
 Submit a Paper
 Propose a Special lssue
 Open Access
ARTICLE
Arrhythmia Detection by Using Chaos Theory with Machine Learning Algorithms
1 Math and Computer Science Department, Faculty of Science, Menoufia University, Shebin El-kom, Egypt
2 College of Engineering, Computer Science Department, Effat University, Jeddah, Kingdom of Saudi Arabia
3 Department of Computer Engineering, College of Computer Science, King Khalid University, Abha, 61421, Saudi Arabia
4 Computer Science and Engineering Department, Faculty of Electronic Engineering, Menoufia University, Shebin El-kom, Egypt
5 Climate Change Information Center and Expert Systems, Agriculture Research Center, Giza, Egypt
* Corresponding Author: Maie Aboghazalah. Email:
Computers, Materials & Continua 2024, 79(3), 3855-3875. https://doi.org/10.32604/cmc.2023.039936
Received 25 February 2023; Accepted 25 July 2023; Issue published 20 June 2024
 View Full Text
 Download PDF
Abstract
Heart monitoring improves life quality. Electrocardiograms (ECGs or EKGs) detect heart irregularities. Machine learning algorithms can create a few ECG diagnosis processing methods. The first method uses raw ECG and time-series data. The second method classifies the ECG by patient experience. The third technique translates ECG impulses into Q waves, R waves and S waves (QRS) features using richer information. Because ECG signals vary naturally between humans and activities, we will combine the three feature selection methods to improve classification accuracy and diagnosis. Classifications using all three approaches have not been examined till now. Several researchers found that Machine Learning (ML) techniques can improve ECG classification. This study will compare popular machine learning techniques to evaluate ECG features. Four algorithms—Support Vector Machine (SVM), Decision Tree, Naive Bayes, and Neural Network—compare categorization results. SVM plus prior knowledge has the highest accuracy (99%) of the four ML methods. QRS characteristics failed to identify signals without chaos theory. With 99.8% classification accuracy, the Decision Tree technique outperformed all previous experiments.Keywords
People’s efficiency and management skills decline dramatically in sensitive circumstances. Acquiring information in the field of anxiety recognition can be achieved from methods associated with stress knowledge; reading heart rate change is a major method of acquisition. The ECG waves are an important method in an early diagnosis of heart conditions that are done by a microcontroller [1,2]. Some information can be discovered from the ECG signal like heart rate, cardiovascular system problems, and drug effects. However, different cases of human types and activity can change the normal values of the ECG signals. State-of-the-art studies considered ECG classification for cardiovascular diagnosis [3]. Some concentrated on the classification methods and did not consider human differences. Others proposed clinical data with ECG features as future work [4]. It was not proved the effect of clinical data on ECG classification which is the main aim of this research. We implemented state-of-the-art algorithms in analyzing ECG signals including clinical data to point the differences in human types and activities as features to the classification model.
The ECG signals are formed of waves that have half a dozen different waveforms. The waves are noticeable and differentiated by P, Q, R, S, T, and U features to sense the QRS values [5,6].
Fig. 1 represents an ECG signal which contains some important features like QRS (Q, R, S) complex waves, P, and T waves. The QRS complexes form the electric flows of the ventricles preceding their compression. The P wave is gotten through atria constriction [2]. An electrocardiogram (EKG or ECG) measures:
• The heart rate (electrical moves).
• The effect of the medication on the heartbeat.
• Points to signs of coronary affliction, for instance, the brevity of breath, shakiness, swooning, or snappy, unusual heartbeats (palpitations).
• Reason for unexplained chest torment, could be brought about by a heart infringement, irritation of the sac incorporating the heart (pericarditis), or angina.
• The thickness of areas of the heart chambers if excessively thick (hypertrophied).
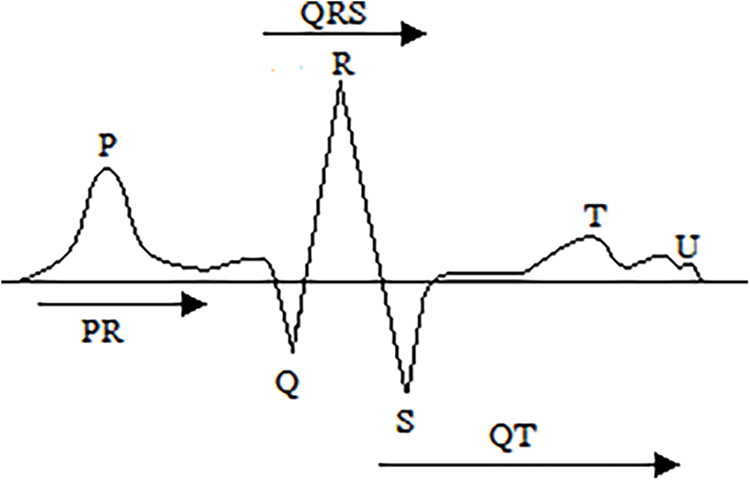
Figure 1: Typical ECG waveforms [2]
ECG readings might be different between various humans according to their personalized states. The personal data of the patient reflects all the body’s vital functions. For example, the intensity of heartbeats is different between children vs. adults, men vs. women, and athletes vs. non-athletes. Some studies considered personal data (i.e., stereotypes) of the patient in the classification process to enhance the results of the classification algorithms [7,8]. Researchers have been working on ECG classification for the last few years. Classification methods have been largely studied by researchers in the areas of databases, machine learning (ML) [9], and statistics [10,11]. In the past, many classification algorithms have been proposed like SVM, Decision Tree, Naive Bayes, Artificial Neural Network (ANN), etc.
Non-linearity in the data initial state can impact the results of machine learning models unexpectedly. Such data need to be translated to deterministic values for proper classification using proper prediction methods [12]. Predictive analysis can be done by utilizing chaos theory and machine learning [13]. Chaos theory studies dynamic deterministic processes that are extremely responsive to initial conditions, leading to significant “chaotic” changes in outputs due to minor changes in the initial conditions. The consequence is a deterministic mechanism that is entirely defined by its original conditions. Therefore, data is translated by the chaos technique to modify the nonlinearity to deterministic values which allows ML algorithms to conclude more accurate decisions. Chaos is widely used in cryptography due to its pseudo-randomness, sensitivity to initial values, etc. [14].
In this paper, ECG features are studied, preprocessed, selected, and experimented to propose a set of features that are related significantly considering efficiency. First, the feature selection preprocessing stage utilizes a deeper semantic representation, in comparison to previous studies. To prove that sensitive data are maintained, received data are submitted to a classification model and results are compared. Second, we added previous knowledge (like clinical data of the patients) to the ECG signals to improve the classification accuracy of the diagnosis for heart diseases. Different experiments are implemented to test the effectiveness of such analysis. In the first step, the ECG signal in its digital form is used for the classification of Cardiac Arrhythmia cases. Second, ECG with a priori knowledge (clinical data) is combined for classification and compared with the previous analysis. Third, QRS complex values are extracted from ECG signals and then classified. Fourth, the calculated QRS features are merged with clinical patient data for classification. Finally, chaos theory is applied to the calculated ECG features combined with the clinical data to increase the accuracy of the ML algorithms. In each case, different ML algorithms are tested for classification to study the effect of the addition of clinical data in the diagnosis.
1.1 Research Objectives and Problem Definition
Raw ECG signals without prior knowledge of patient characteristics cannot be used for Cardiac Arrhythmia diagnosis by themselves. Prior knowledge of patients or clinical data of patients needs to be merged with ECG data for accurate classification. Moreover, ECG complex QRS features provide deeper knowledge of the heart functionality from the ECG signals. However, QRS features are non-deterministic in nature. Chaos theory provides a correlation between the random values of the features and transforms them to deterministic values, such transformation helps differentiate the data for higher classification.
This research contribution is to study the effect of different features on Arrhythmia diagnosis. We will experiment with the effect of prior knowledge of the patient on the accuracy of heart condition diagnosis using ML algorithms. The accuracy of the SVM is increased when adding prior knowledge to the patient’s ECG signals. The accuracy is enhanced again when applying chaos theory to the ECG features added to the clinical data of the patient. The effect of the ECG feature extraction has been verified by the classification accuracy. ECG classification has been done with four different algorithms (SVM, Decision Tree, Naïve Bayes, and ANN) as binary classifiers. However, the results provided different accuracies. The dataset used [15] is filtered for cases with clinical features, thus the number of cases used was 590 ECG signals for arrhythmia and control.
We developed three types of features for classification:
1. Raw signal features, from which ECG-base features have been extracted.
2. QRS complex features are extracted as P, Q, R, S, T. QRS is calculated for each window, where a window is an ECG segment modeling a heart pulse.
3. The prior knowledge features, i.e., clinical data of patients.
Different permutations of the integrated features are conducted, however, when QRS is added to the base features the accuracy declined. Thus, chaos theory is applied to map the features and produce deterministic distances between the features for more accurate classification.
The paper is arranged as follows. Section 2 gives the related work. Section 3 introduces methodology. Section 4 proposes the research model. Section 5 summarizes the results and discussions that have been achieved in this paper. Finally, conclusions are drawn in Section 6.
Kampouraki et al. in 2009 [16] used SVM to classify time series heartbeats. They used Statistical methods and signal testing techniques to extract features from the signal waves. Compared to other Neural Network-based classification approaches, the SVM classifier was the best algorithm used for performing cross-validation. Eventually, the action of the numeral of features to the classification velocity was also inspected for two actual datasets. The first dataset has a lasting ECG recording of youthful and old healthy subjects. The second dataset consists of a long-term ECG database. For more accurate classification the proposed model requires more signal-extracted features, by recognizing more characteristics from the signal.
Hammad et al. in 2018 [17] proposed classifiers which are SVM, K-Nearest Neighbor, and Neural Network achieved 99% accuracy which aims to add the clinical data as future work. Adding the clinical data raises the accuracy of the model. The subjects were 25 men aged 32–89 years, and 22 women aged 23–89 years. The recordings were digitized at 360 samples per second per channel with 11-bit resolution over a 10-mV range. MIT–BIH arrhythmia database was divided into two classes, normal 25 ECG records, and abnormal 23 ECG records. The data set used in their experiment is less than the one used in our research so a cross-validation method had been used, where overfitting might have occurred.
Celin et al. in 2018 [18] proposed an approach to identify the ECG signal by classification. Next, the input signal is pre-processed to eliminate the high-frequency noise by using filtering methods such as low pass, high pass, and butter value filter. To minimize the excess noise in the signal, butter is worth the filter. Using a peak detection algorithm, peak points are identified after preprocessing and the features of the signal are extracted using statistical parameters. Finally, by using SVM, Adaboost, ANN and Naïve Bayes classifiers to classify the ECG signal database into a normal or abnormal ECG signal, the extracted features are categorized. Experimental findings showed the satisfactory accuracy of the classifiers SVM, Adaboost, ANN, and Naïve Bayes. However, they considered ECG signals only as their main data source. They concluded that the Naïve Bayes model achieved the best results in comparison to the others, while SVM achieved the lowest accuracy, which contradicts with other research.
Venkatesan et al. in 2018 [19] proposed ECG signal preprocessing and support vector machine-based arrhythmic beat classification. A delayed error normalized Least mean squares (LMS) adaptive filter is used in ECG signal preprocessing to achieve a high-speed and low-latency architecture with fewer computational elements. Since the signal processing technique has been developed for remote healthcare systems, the main emphasis is on white noise reduction. On the preprocessed signal for HRV feature extraction, discrete wavelet transformation is applied. Machine learning techniques are used to perform arrhythmic beat classification. In this paper, for beat classification, the SVM classifier and other common classifiers were used on the noise-removed signal. The results suggest that the SVM classifier’s output is higher than other ML classifiers. That model’s high achieved accuracy was 96% which can be improved.
In [20], Mejhoudi et al. surveyed and assessed ECG signal processing algorithms on embedded architectures. ECG QRS estimation is an essential phase in ECG classification which is important either in clinical or biomedical practice. The author raised a structure for real-time monitoring of cardiac data based on an embedded architecture, which guarantees a precise analysis without loss of information and allows the mining of all the necessary individuality for an efficient and fast analysis of a patient’s cardiac position.
Sumathi [21] proposed a combination of wavelet transform for feature extraction and used SVM to classify ECG heartbeat. The proposed approach was validated by the MIT-BIH Arrhythmia Database, which has been used for the classification of various cardiac arrhythmias. The Gaussian Kernel was used as a tool for the kernel, in two classification stages: learning and testing. A supervised classifier for a multi-category SVM learning machine (MC-SVM) was developed. To enhance the classification, this study modeled single-lead ECG signals to extricate classifiable highlights using the wave-let and Autoregressive (AR) model. Their accuracy was 98% using only ECG data, thus if more data was included the accuracy was enhanced.
Gupta et al. [22] suggested a method to apply chaos analysis to different ECG databases for feature extraction. By assuming that the original underlying source signals were transmitted mutually independently, the ICA approach distinguished an individual signal from mixed signals. The study of chaos explored the system’s erratic attitude and fits it into deterministic motion equations. Chaos analysis was applied by plotting various attractors against different dimensions of time delay. It is well known that R-peak detection is useful in diagnosing cardiac diseases. Using main component analysis (PCA) that outperforms the current state-of-the-art techniques, the R-peaks are observed. This model is defined as a model for feature extraction that is a state-of-the-art method. Their model is the base for our work where has been extended for further classification and disease diagnosis.
In [23], Shankar et al. discussed the problems involved in ECG signals classification. They explored ECG databases (MIT-BIH), pre-processing, dimensionally reduction, feature selection methods, classification, and optimization strategies. They concluded that machine learning techniques provide classification accuracy based on feature dimensionality. However, they achieved 94% accuracy using QRS features, which can be further enhanced.
Naz et al. [12] proposed a combination of empirical mode decomposition (EMD) with ANN and the chaos principle for electrocardiography (ECG) signal recognition. A sensor with a human-machine interface (Lab-VIEW) was built in this study to measure and capture ECG signals. EMD was exposed to the processed ECG data at high and low frequencies. Using master and slave chaotic systems, a chaotic error scatter map was developed to obtain the chaotic eye coordinates of a particular ECG signal. For recognition, a back propagation neural network (BPNN) was implemented. The proposed approach had 97% accuracy in the ECG signals classification. Accordingly, the ECG sensing device for automated diagnosis was built in this study is not available in all clinics. They used LabView to reduce manual errors in ECG readings.
Most of the previous studies used ML algorithms to classify ECG signals, however, they concluded with contradicting results. Some proposed that SVM provides higher accuracy and others concluded Naïve Bayes while SVM was the lowest. Thus, those models are highly dependent on the way of manipulating the features and feature selection mechanisms. Some calculated the QRS values and some used chaos models. The only high accuracy is achieved when a physical model has been developed as a chaotic system. A clear model for the best features selection needs to be developed and tested. The advantage of considering it as a chaotic system in transforming the signal into manageable and efficient features needs deeper study. For which, this research studies the integration of the features with patient’s a priori data, on one side. On the other side, estimating the features using QRS transformation and analyzing those complex values on classification. The novelty of this model is to develop a feature selection model that integrates ECG signal features considering complex QRS and historical patient data, with chaos analysis for a deterministic manipulation of the signals. No research studied the relationship between the combined features and their effect on accuracy.
Heartbeat pulses are measured from periodical cycles in the ECG signal series from which several features are extracted for classification. Several classification algorithms have been proposed in the past, such as SVM, Decision Tree, Naive Bayes, Neural Network, etc. Deviation in ECG signals indicates many forms of heart disease, and for the past few years researchers worked on developing models of classification for heart diseases from ECG readings.
3.1 Machine Learning Algorithms
Five classification methods have been compared in this study. The selected algorithms are SVM, Decision Tree, Naive Bayes (from Bayes), and Neural Networks. It is implemented using the WEKA package [24].
Briefly, SVM is mostly used as a supervised algorithm in ML that is mostly implemented for problems with either classification or regression. Classification is done by predicting a hyperplane that separated the characteristics of the problem in the 2D space. SVM algorithm is utilized in different research extending from heart diseases analysis, proposal framework, database advertising, location of protein homologies, content arrangement, face recognition, and so on [25].
Decision Tree, on the other hand, offers an efficient decision-making tool because it explicitly set out the dilemma so that it is possible to question all options. Enable us to thoroughly examine the potential effects of a decision. Provide a mechanism for quantifying the result values and the probabilities of achieving them. Decision Tree is used to make observations all around that are used in data mining and some other applications. The Tree models have some variable objects called demand Tree; in these Tree structures, leaves examine the concurrence of highlights that lead to those class names [26].
Naive Bayes algorithm provides a Bayesian graphical model of the nodes corresponding to each of the attributes. It is called Naive since it ignores prior parameter distribution and assumes the independence of all attributes and all rows. The classifier of Naïve Bayesian is based on the rule of Bayes Conditional Probability. Every single characteristic of the informational index is considered autonomous and solid of one another. The upside of Naïve Bayesian classifiers is that the preparation information can be little to foresee the parameters for arrangement. Naïve Bayes classifier functions admirably in numerous certifiable complex circumstances that incorporate spam identification, dialect recognition, and assumption examination [15].
In comparison, Neural Networks are structures for some unique machine learning calculations to cooperate and process complex information sources. Such frameworks learn to perform assignments by thinking by themselves without being modified with any undertaking explicit standards [27]. The basic concept behind a Neural Network is to simulate (copy in a simplified but fairly faithful way) lots of densely interconnected brain cells within a machine to get it to learn things, recognize patterns, and make decisions in a human-like way.
Chaos analysis can be used in an observable nonlinear dynamic system to analyze unexpected episodic variations effectively (environment) [22]. If state variables do not report continual repetition of the values, the fluctuating characteristics appear. Because of distortion presence, randomness never repeats in a signal. Forecasting the next state, therefore, becomes difficult. For efficient forecasting, initial conditions must be identified at a higher degree of precision. In chaos analysis, multi-stability control, considering its intense vulnerability to noise and initial states, has been shown as the most interesting approach to determining the crucial dynamics. For dynamic, periodic, and random signals that cannot be analyzed with linear system theory, chaos analysis is adopted.
The Lyapunov exponent: It is a measure of delicate dependency on initial circumstances [22], i.e., how easily two nearby states diverge. Now, in the time series, consider two points, ti, and tj, whose values are very close. That implies at the ith and jth iterations, the system nearly reached the same state. Now consider the two sequences ti, ti+1, ti+2 …, and tj, tj+1, tj+2 …, We want to know how these two sequences diverge from each other. For all of this, assume the distance after k steps between the two sequences:
If the system is chaotic, d(k) will initially increase with k exponentially. One can plot lnd(k) vs. k for this and provide a linear fit. The slope will be an approximation for an exponent of Lyapunov.
Because the system is limited, however, the two nearby states will not diverge forever. After some length, their exponential divergence will stop. Only within this area must we match the straight line.
Now, this was for the initial states of a single pair. The Lyapunov exponent over all nearby initial pairs is an average of this divergence exponent. So for this, define d(k), where is averaging over all starting pairs ti, tj, such that the initial distance d(0) = | ti– tj | is less than some fixed small value. The program finds all such initial pairs, calculates d(k), plots it against k, and the Lyapunov exponent is given to us by the slope of the initial linear component.
This research hypothesizes that adding clinical features to the ECG features will enhance the classification model because ECG signals differ based on human characteristics. The second hypothesis is that modeling the ECG signals as QRS values only will not improve the diagnosis unless transformed into deterministic values. Thus the proposed model is to calculate QRS values and then treat them with chaos theory to transform them from nondeterministic to deterministic values. In addition to adding clinical features about the cases to be able to differentiate the diagnosis based on gender, age, and other conditions.
The proposed model is shown in Fig. 2, where the first and the second ones are classifying the ECG signal directly with and without clinical data. After that in the third and fourth experiments the ECG features have been extracted and QRS is estimated as mentioned above. Then, we classified those QRS’s for a window of time (a single pulse as defined in Section 4.4), also with and without clinical data. The last one is applying the chaos theory to the QRS’s then applying different classification algorithms.
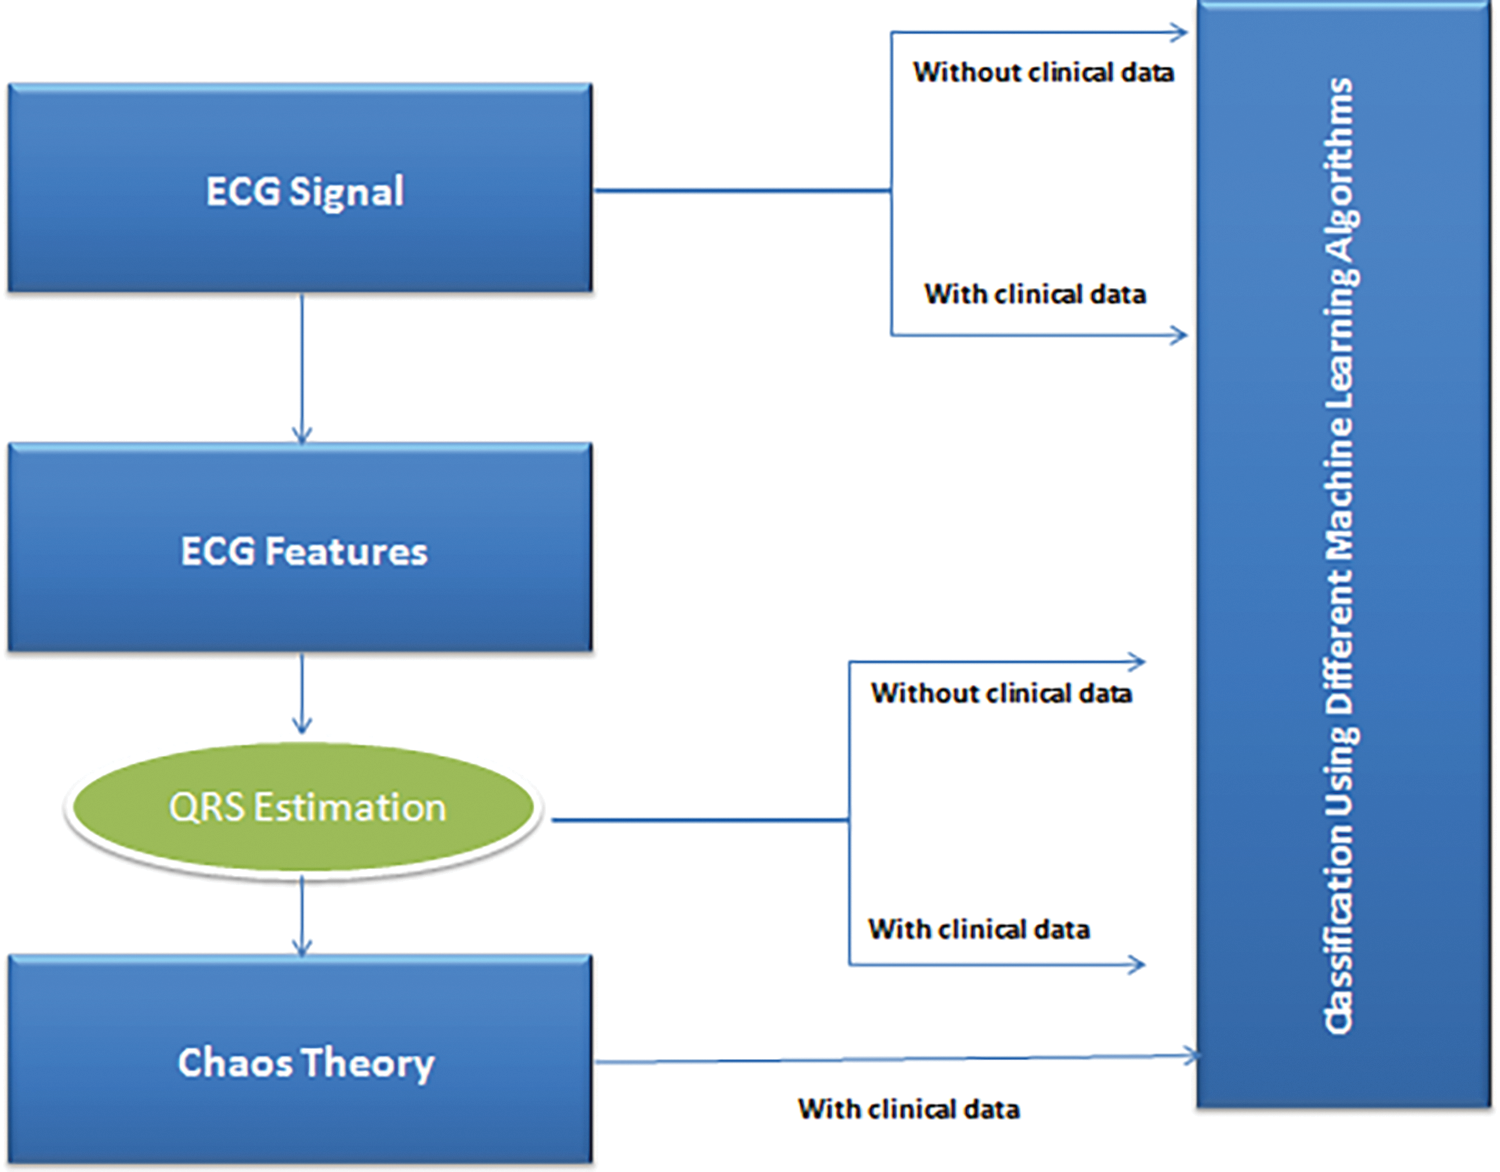
Figure 2: The proposed model
To test the hypothesis and validate the proposed model we will classify the features on four different classification algorithms. The chosen algorithms SVM, Decision Tree, Naïve Bayes, and Neural Network are compared in terms of ECG features classification. Moreover, different experiments are conducted to compare the hypotheses as the following:
1. Comparison of main ML algorithms for ECG classification.
2. Benefits of clinical data in diagnosing cardiac diseases using ECG signals.
3. The use of chaos theory to translate ECG values from their nonlinear form to deterministic values to enhance the classification mechanism.
4. The utilization of QRS features extracted from ECG signals.
4.1 Phase One: Feature Extraction
For processing these data, the whole raw signal is divided into individual windows, and each window represents a single pulse. Each signal was divided into 75 windows; each has the same features [28] for a single time frame, with no overlap between the windows. The main features in every signal window are P, Q, R, and S which are determined by each peak in the signal [29]. It can confront noise by canceling it out using high pass and low pass (baseline wander) filtering. Besides, check out the criterion to stop the detection of spikes as shown in Fig. 3.
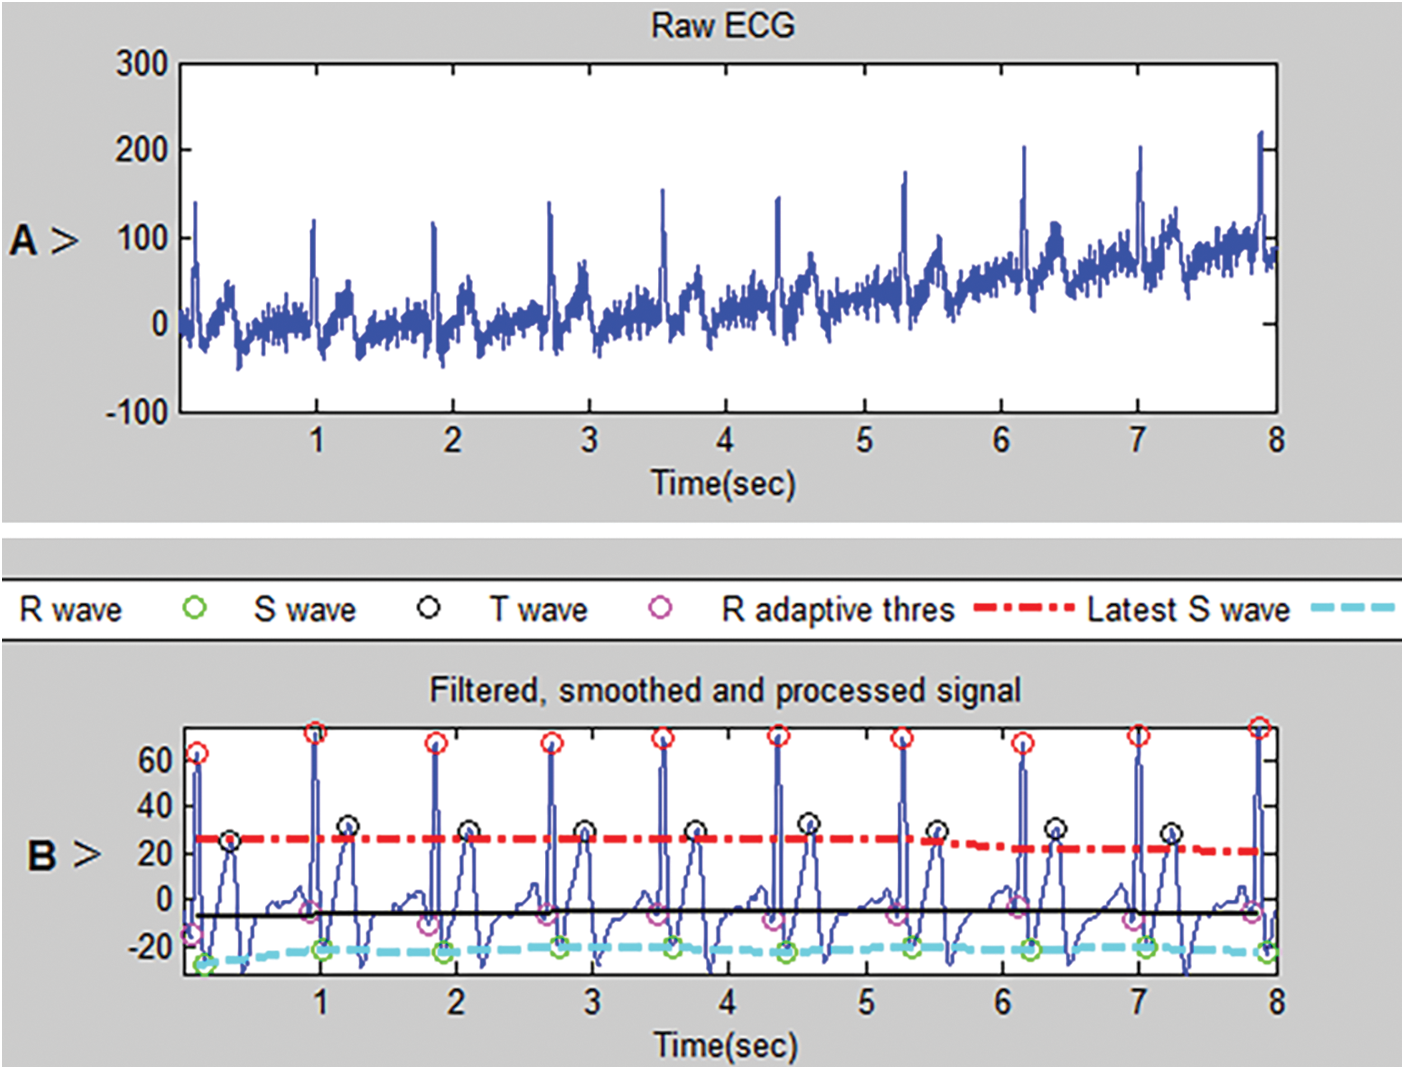
Figure 3: (A) represents the raw signal. (B) represents the processed signal
Fig. 3A shows the raw ECG without deleting the noise. Fig. 3B shows the filtered, smoothed, and processed signal and shows also features extracted from the signal (P, Q, R, and S).
Fig. 4 states the pseudo-code describes the function of feature extraction. The input data are the raw ECG vector, sampling frequency, and span of the signal. The outputs are indexes and amplitudes of P, Q, R, and S. Fig. 5 represents the buffer plot.
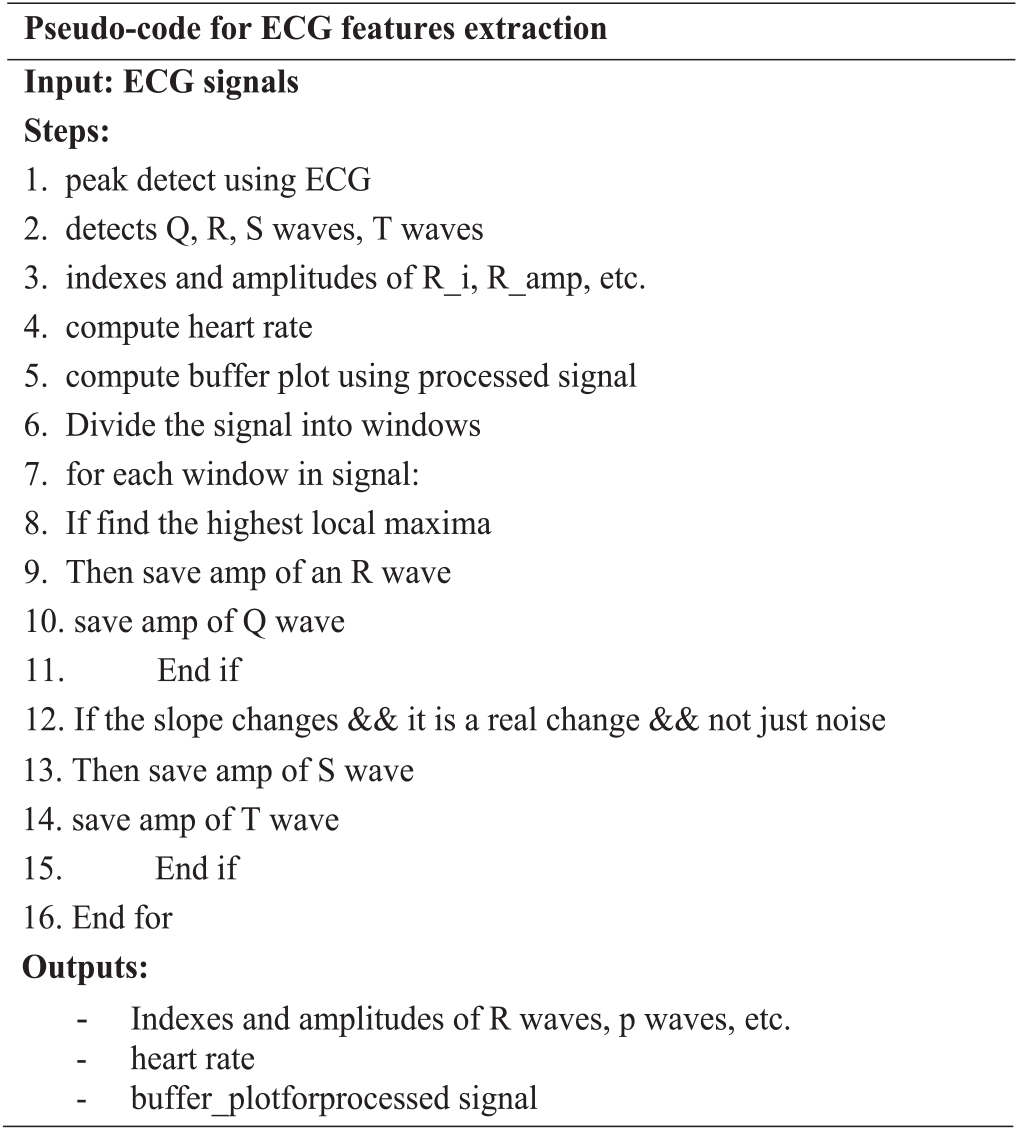
Figure 4: Pseudo-code for ECG features extraction
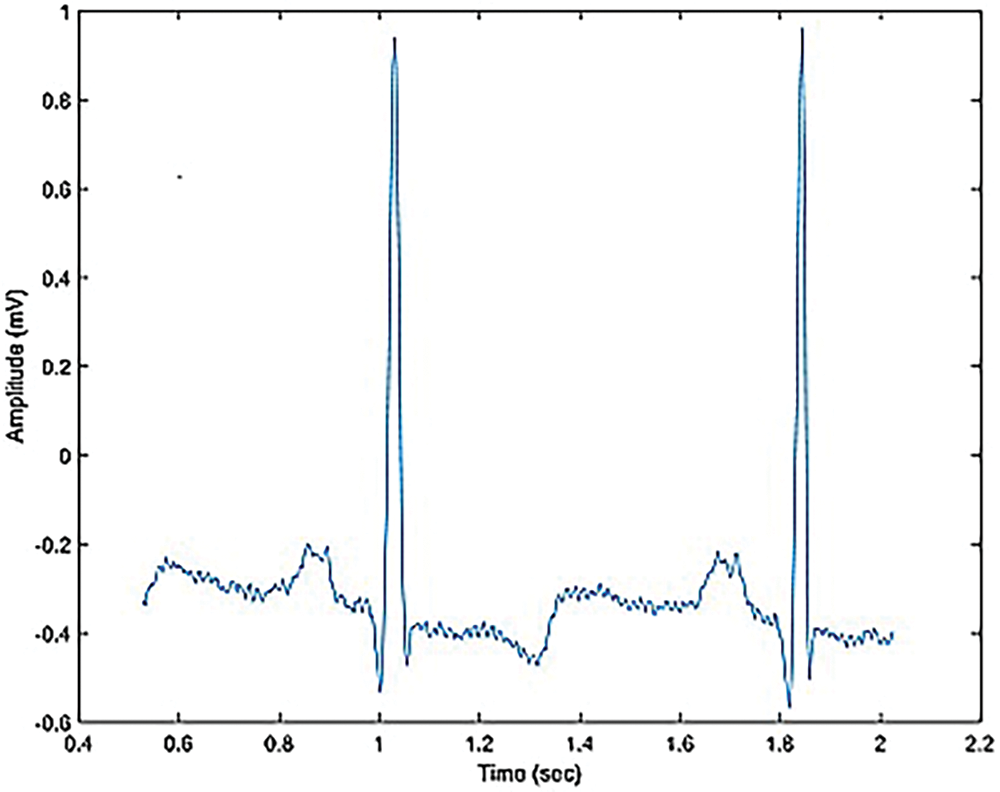
Figure 5: The buffer plot of the signal
4.2 Phase Two: Feature Selection
The feature vector contains five features (p, Q, R, S, T waves) for each window of the signal on the time series, as defined in Section 4.1 where a window is a specific time frame of a signal pulse. Matlab2013a has been used for extracting all features of the ECG signal of each window. In the feature extraction step, the output is P, Q, R, S, and T for each window in the signal. The heart rate [15,27] of the cases is also implemented. After calculating the QRS (according to Section 4.3) for each window in the ECG signals of the patient, they are ordered in a one-time series vector for the input of the classification step (each patient has several QRS values that is implemented from his ECG signals as shown in Table 1).

Different algorithms are used to classify the ECG features using WEKA3.8.1. Each row represents the regularity or the irregularity of the patient’s heart pulse. In the first row in Table 1, the difference between values is low so the heart pulse is regular but, in the third row, the difference is high, so the heart pulse is irregular.
Table 1 shows the QRS values for each window (pulse) in the signal. P1 means QRS features for the signals of the first case. W1 means the first window (around a second) of the signal. This table is a sample data taken for 13 cases from the data set for 12 windows (just a sample from the total 75 windows for each signal). The last column is the output where “N” means normal (270 samples) and “I” means irregular heartbeats (320 samples).
4.3 Phase Three: QRS Calculations
QRS calculation is represented in Fig. 6.
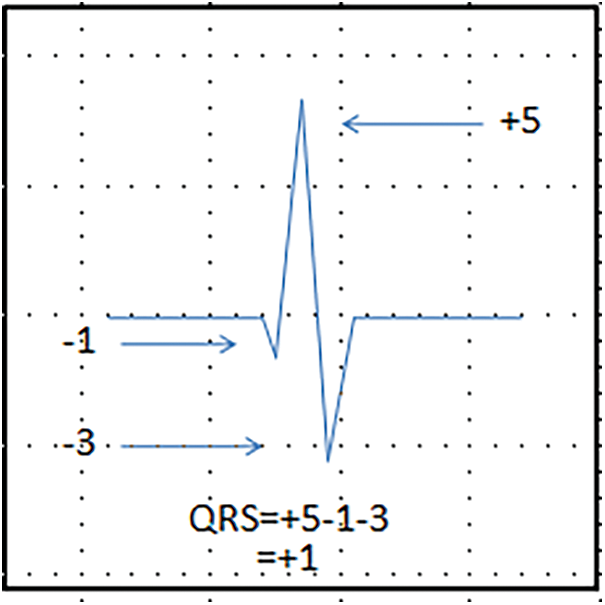
Figure 6: QRS equation
4.4 Phase Four: Chaos Calculations
The deterministic chaos indicates the growth over time depending on the initial values [22]. This increase in values is measured with what is called Lyapunov exponent. If the difference of the initial values is u0 the difference at a time can be estimated as:
which λ is the Lyapunov exponent and can be calculated as follows:
The Lyapunov exponent hence indicates how rapidly a complex system of several interdependent dynamics tends to run up to deterministic chaos.
The study of Lyapunov exponents is an effective measure of instability and system form. A continuous or discrete time may be a machine. It is possible to describe a vector set as follows:
where M is the space’s embedding dimension and T is the delay time. M coordinates are highly correlated if T has a small value, while its higher value implies that the real reconstruction unfolds beyond the subspace.
This section describes the five experiments and their phases in detail. In order to compare fairly the five previous concepts, different experiments are conducted.
The dataset used in this study is the MIT-BIH Arrhythmia ECG [30]. The dataset contains several ECG signals from volunteers driving on open roads representing different ranges of stress levels. For example, driving around Boston city streets represents high stress, on highways represents low stress, and medium stress can be between both. The dataset which is used in these experiments consists of 2931 ECG signals for arrhythmia but only 590 samples are used that have clinical data. The clinical data consists of patient data like age, sex, blood pressure, medicine, weight, and heart pulses rate.
The data set is divided into training and testing data with 33% of data for testing. Shuffling the data is done to avoid overfitting for better results. The dataset is large enough for training where cross-validation is no longer needed. The proposed algorithms used Matlab R2017a (on Microsoft Windows 10 Pro 64-bit) for feature extraction. Data classification and model evaluation are done by IPython 7.2.0 and WEKA 3.8.1 [24] package. The system is implemented on a PC with a 2.7-GHz CPU and 8 GB RAM. Source code can be found in the following link ‘http://github.com/maiemahmoud/Chaos’.
According to the importance of the ECG signals in the diagnosis of cardiac diseases, it is important to study it in detail to get the best results using machine learning algorithms to classify diseases from normal. In this study, different experiments are conducted to examine its effect when considering pure signals and also when combining it with clinical data (which is very important also in diagnosis). To compare fairly between the five previous concepts, different experiments are conducted. The first and the second ones are classifying the ECG signal directly with and without clinical data. After that in the third and fourth experiments the ECG features have been extracted and QRS is estimated as mentioned above then we classified those QRS’s for a window of time (a single pulse as defined in Section 4.4), also with and without clinical data. After the fourth experiment, the effect of the chaos theory on the ECG signals is studied (to convert its values from nonlinear to linear) form which can help in reducing the feature space and thus increasing the accuracy of the algorithm.
Experiment 1: Classification of the raw ECG signal using four ML algorithms. The evaluation of the four algorithms is based on accuracy and other measures. 256 features will be used as input for each ECG signal.
Experiment 2: Classification of ECG signal combined with the clinical data of the patients, to validate the inclusion of patient differences in diagnosis. The number of the features used becomes 262, where six clinical features have been added as in Section 4.1.
Experiment 3: Estimating QRS (from ECG features) to be used in the ECG classification instead of raw ECG values. The number of features is reduced in this experiment to 75 features which is the number of QRS’s extracted from the 256 values of the raw signal.
Experiment 4: Classification of QRS features combined with patient’s clinical data. The number of features became 81 features.
Experiment 5: Transforming QRS features using chaos theory combined with clinical data to generate a new dataset for classification. The number of features is 57 features, whereas the 75 QRS features were further normalized to 51 semantic features.
The following standard metrics [31] are used to assess the performance of the proposed algorithm.
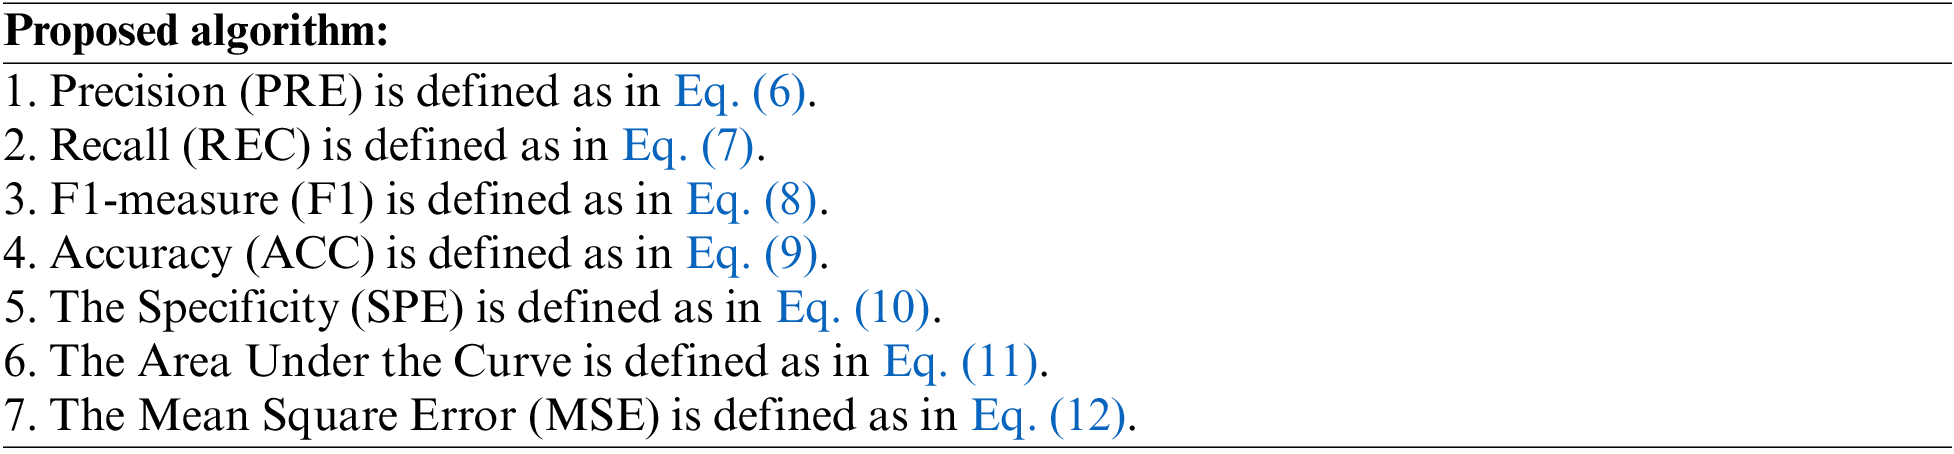
where y is the actual number and z is the predicted one.
TP is the true positive, FN is the false negative, FP is the false positive and TN is the true negative.
The experiments reviled that the use of clinical data with raw ECG signals enhances the classification decision in all ML algorithms. However, QRS features did not distinguish the cases in all ML algorithms when extracted from the ECG signals directly. Those features give higher classification results only when transformed using the chaos method, which transformed the nondeterministic values to deterministic ones. Decision Tree and NN were classified higher in that experiment. The overall highest classification method was achieved by classifying chaos transformation of QRS features with clinical data using Decision Tree; even higher than SVM with ECG signals and clinical data.
Table 2 shows the results of each model in different experiments. The first experiment of data is the ECG features without the patient’s clinical data. In the second experiment, ECG features were combined with clinical data. The third experiment is the QRS without clinical data. The fourth experiment is the QRS with the clinical data. The final experiment is the QRS features combined with the clinical data after applying the chaos theory. In the first experiment, the SVM algorithm gives the best results and Naïve Bayes gives the worst result. In the second experiment, the SVM also brings the best result which was enhanced after adding the clinical data by around 10% and the Naïve Bayes result was enhanced also but still gives the worst result in the whole experiment compared with the other algorithms. The third experiment enhanced the Decision Tree algorithm result over the SVM result but the whole experiment gives less result compared with the other first experiments which mean that adding QRS features do not enhance the algorithm’s results. The fourth experiment got the best result from the SVM algorithm and the Decision Tree algorithm gives the best result after the SVM algorithm. In the last experiment when applying the chaos theory to the ECG features (QRS) and the clinical data the results of the Decision Tree and the Neural Network algorithms are the best with an accuracy of 99.8% and 98%. The last column is the indicated run time in seconds for each experiment. The run time the SVM experiments has a lower run time (19 s) while double the time has been taken by the NN experiments (30–47 s).
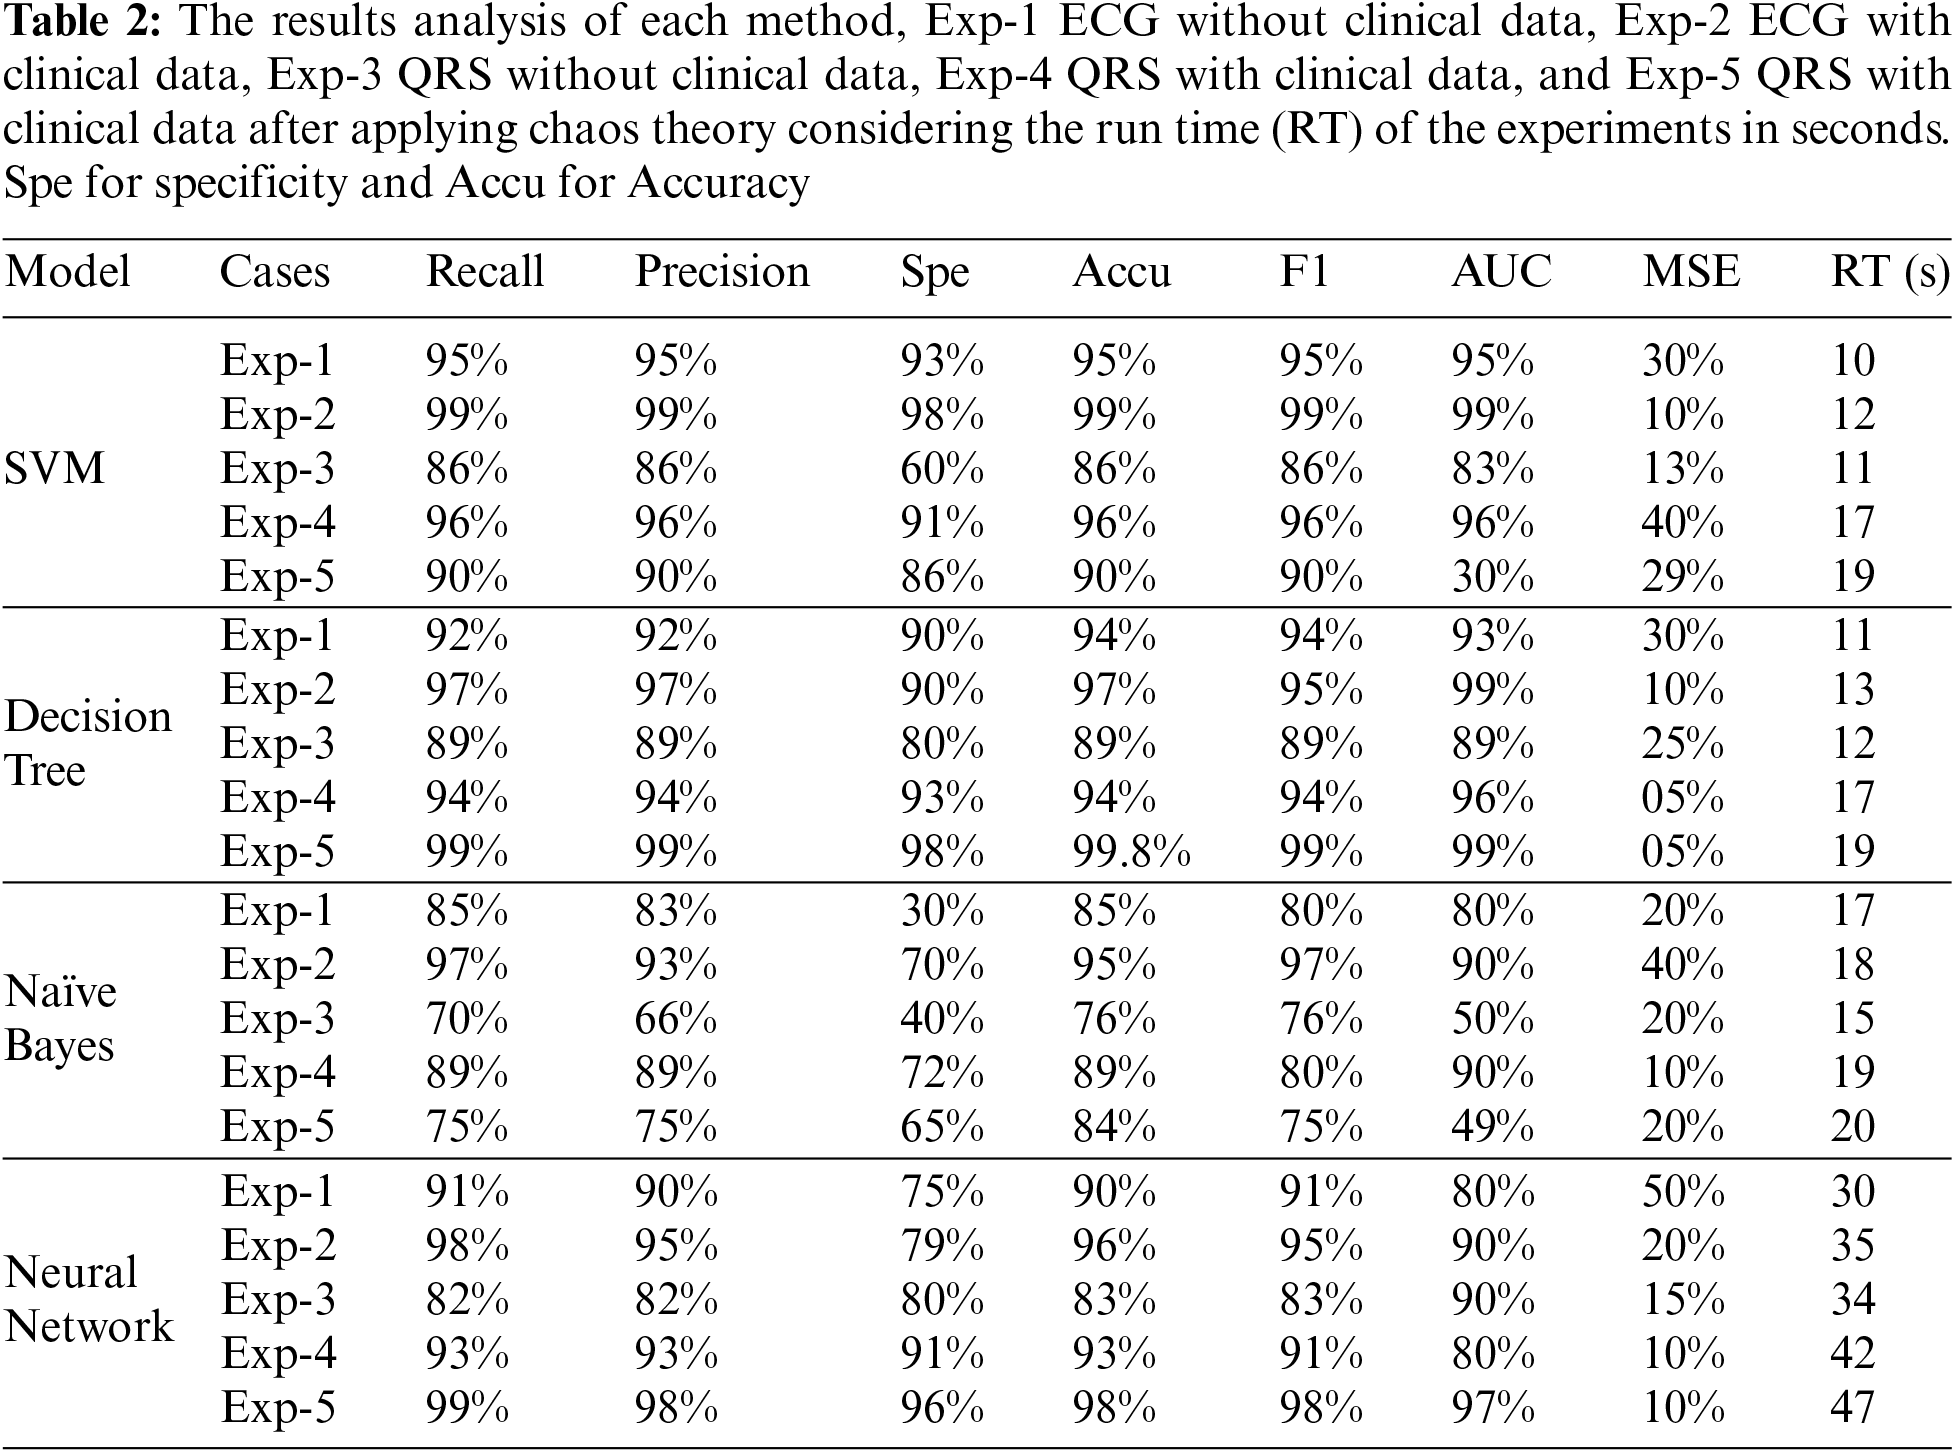
Fig. 7 shows the receiver operating characteristic curve (ROC curve) of the different algorithms. The ROC curve of the SVM algorithm gives the best result. The Decision Tree algorithm gives the best result after the SVM algorithm and the Naïve Bayes is the worst. Similar to state-of-the-art research, SVM performs best when given raw ECG signals.
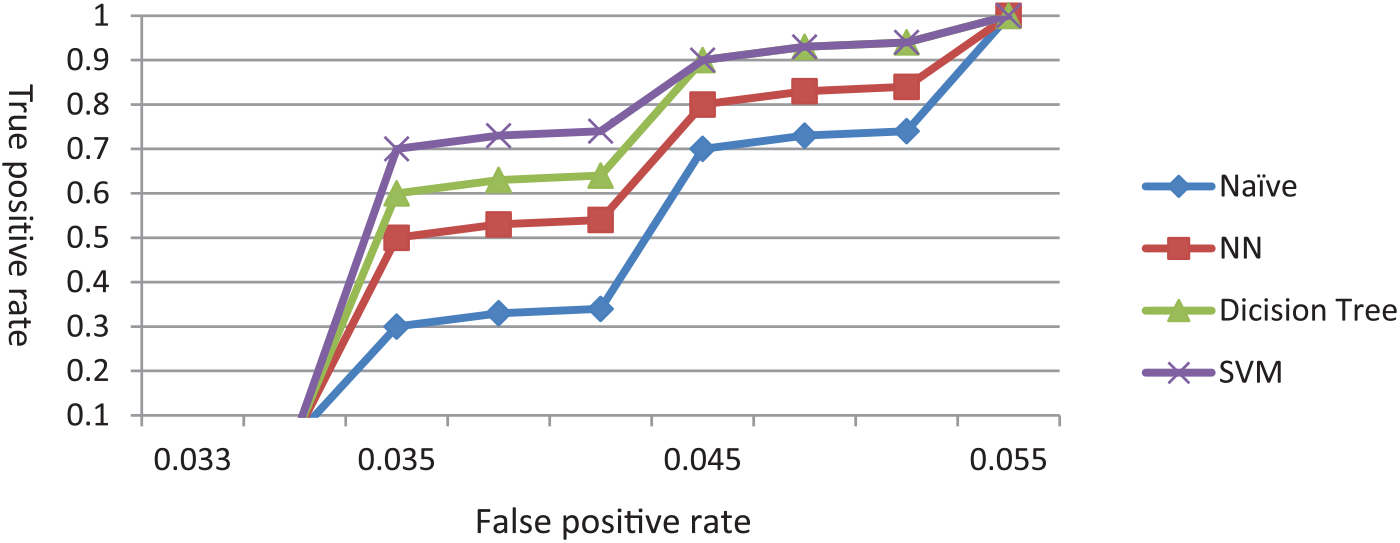
Figure 7: The ROC curve for the shown algorithms applied on ECG (Exp. 1)
Fig. 8 shows the ROC curve of five different algorithms when adding clinical data to the raw ECG signal. The curve of SVM gives the best result. The Neural Network takes a lot of time when applying to the data. The addition of clinical data produced higher accuracy than experiment 1.
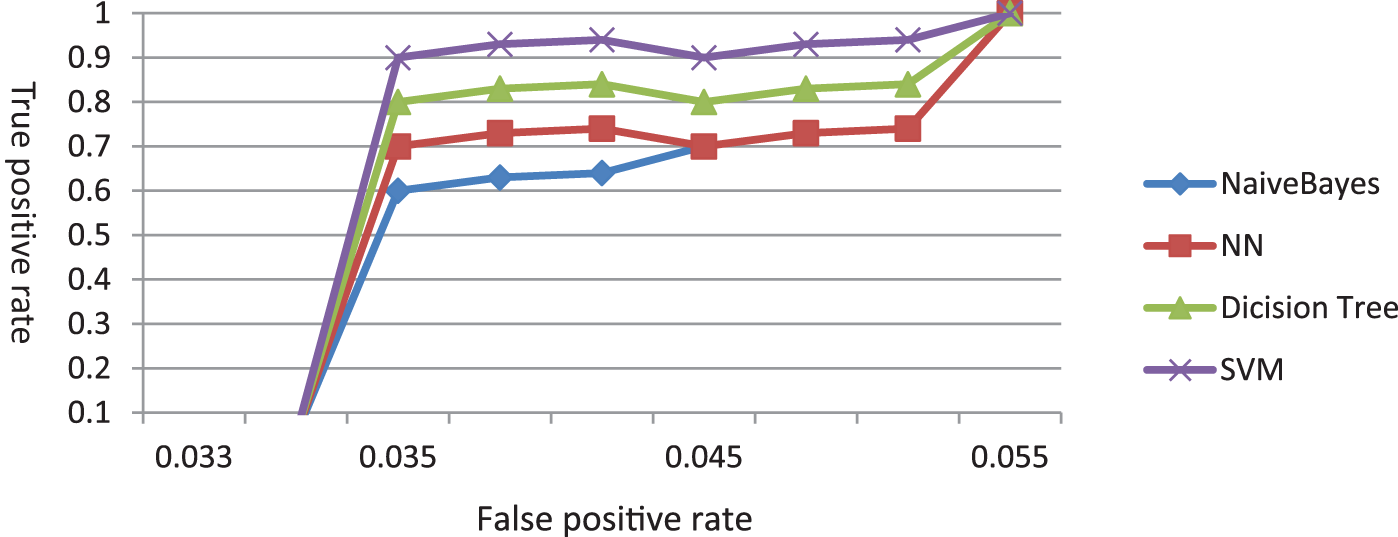
Figure 8: The ROC curve after adding clinical data to the raw ECG signals (Exp. 2)
Fig. 9 presents the ROC curve of the five different algorithms when classifying the QRS. The curve of the Decision Tree algorithm gives the best result and Naïve Bayes is the worst. Decision Tree started to outperform SVM on QRS features.
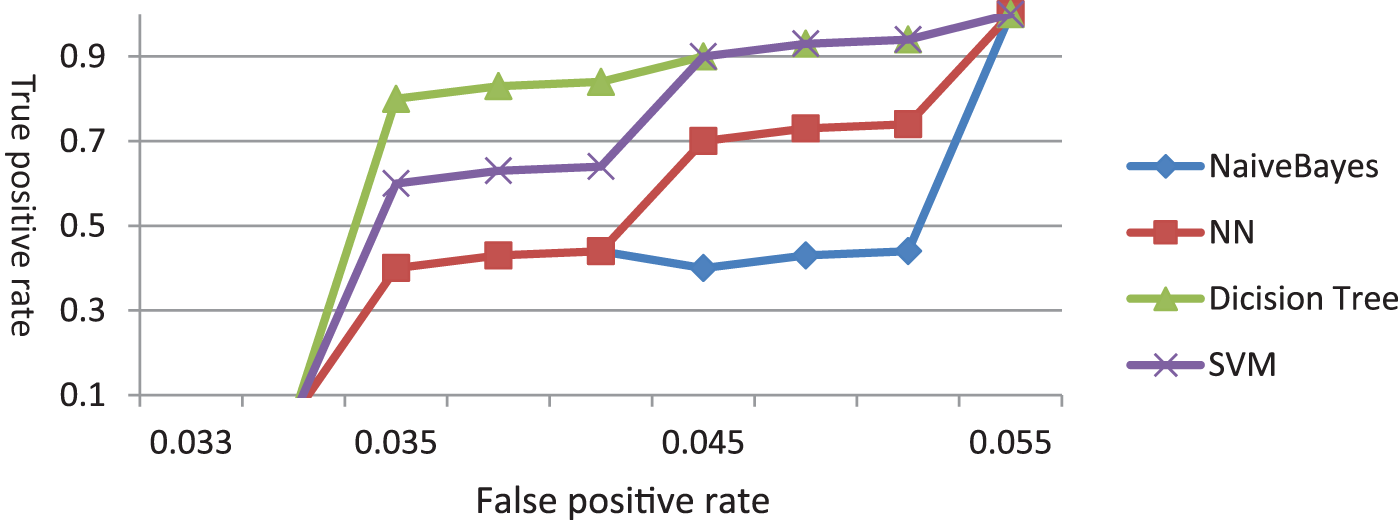
Figure 9: The ROC curve of classifying QRS features (Exp. 3)
Fig. 10 shows the ROC curve of the five different algorithms when classifying the QRS after adding the clinical data. The curve of SVM gives the best result and Naïve Bayes is the worst.
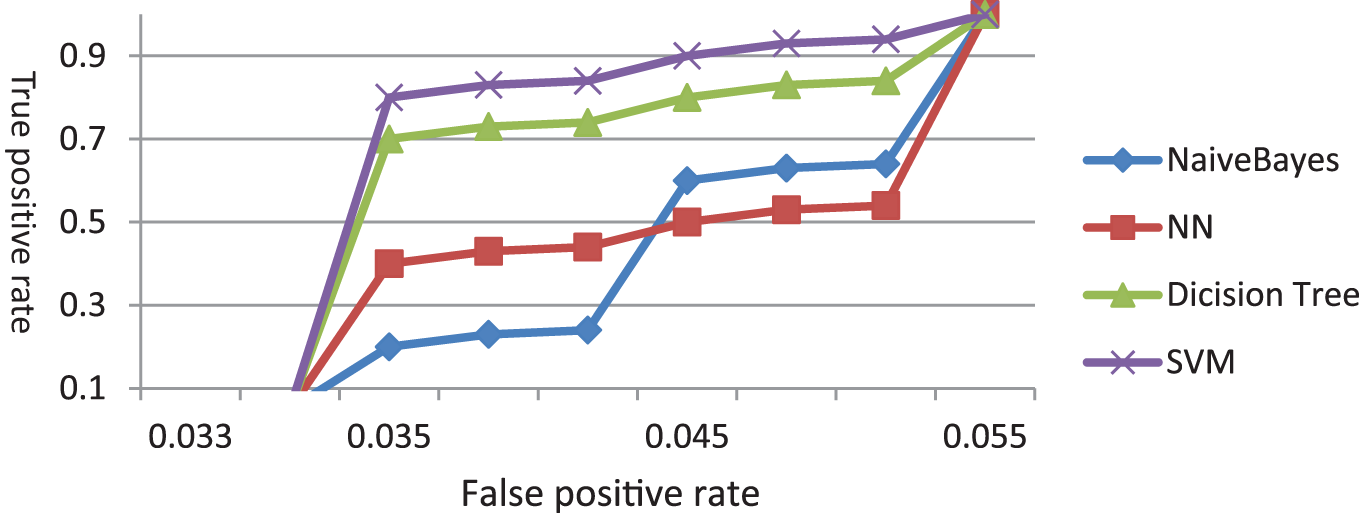
Figure 10: The ROC curve of QRS and clinical data (Exp. 4)
In Fig. 11, the ROC curve of the five different algorithms when classifying the QRS with clinical data after applying the chaos theory. The curve of the Decision Tree shows the effect of the chaos theory on enhancing its result, similar to the Neural Network algorithm. On the other hand, SVM underperforms classification results on QRS features than in the previous experiments.
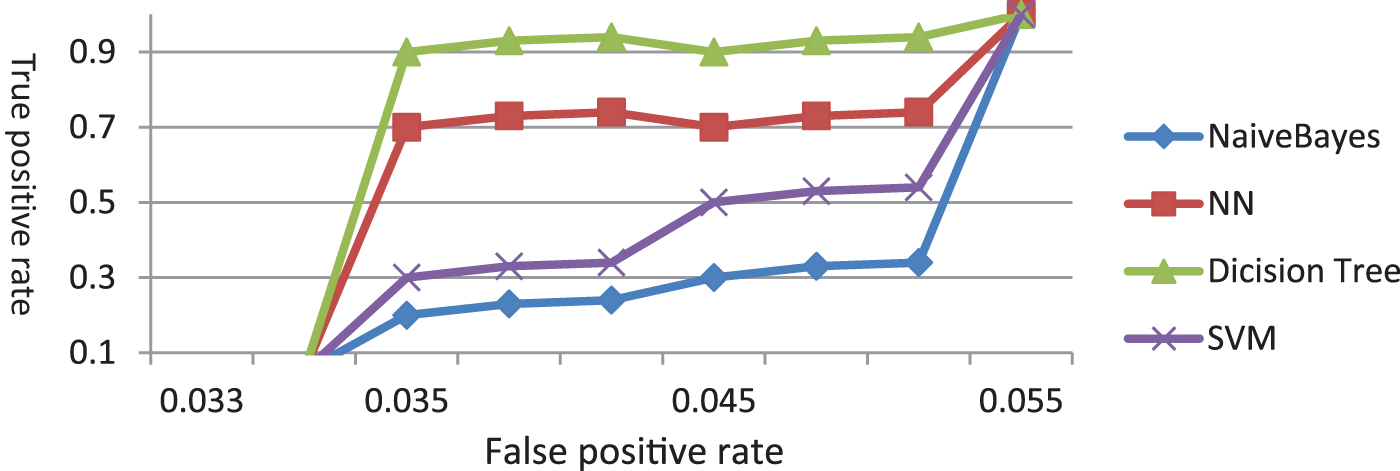
Figure 11: The ROC curve of when applying chaos on QRS features and clinical data
Models comparison is given in Table 3, our system achieved higher results in an efficient time. We implemented different algorithms to show the effect of the extracted features using chaos theory on the ECG signals. Also, the effect of using clinical data on the model accuracy. Applying the chaos theory when adding the clinical data provided better results classified by Decision Tree, with 99.8% accuracy.

In comparison to Hammad et al. work [17], our model achieved higher accuracy. The data set used in their experiment is 47 cases, whereas in our research we used 590. They reduced the ECG signals by QRS transformation only, when QRS values were modeled using chaos theory the accuracy raised from 99% to 99.8%.
The advantages of our system are that its accuracy is higher than all other models reviewed. The proposed approach is simple and easy to operate. The system can utilize cardiac diseases diagnosis with high accuracy and better performance. Adding the clinical data to the patient data provided a higher understanding of the cases in directing the diagnosis for better results.
On the other hand, the disadvantages of the system are that the system needs to be developed in a pipeline framework to fully automate it. The system has several preprocessing calculations for QRS and chaos transformation, however, they are simple and no overhead is generated.
In this work, four main goals were studied, heart diseases diagnosis from ECG signals, enhancing the diagnosis by adding clinical data, studying classification algorithms that provide the best results, and the utilization of QRS features extracted from ECG signals. The modification of ECG signals by calculating QRS features did not classify the heart conditions as the values were non-deterministic in nonlinear distribution. Therefore, QRS features had to be translated using chaos theory to transform it into a linear state before classification. Clinical data provided knowledge of the patient differences in nature for better diagnosis of heart diseases with pure ECG features and with the enhanced features using QRS.
Five experiments have been implemented to compare the results of clinical addition and/or QRS and chaos preprocessing. The first one is a classification of the ECG signal. The second one is a classification of the ECG signals combined with the clinical data of the cases. The third one is a classification of the calculated QRS features from ECG. The fourth experiment is a classification of the ECG QRS features after adding the patient’s clinical data. The last experiment is applying chaos theory to the ECG features with the clinical data. All the experiments utilized different four algorithms to compare with, SVM, Decision Tree, Naïve Bayes, and NN. The SVM algorithm gives the best results in the first experiment 95% when classifying the ECG. After adding the clinical data, the results were enhanced to 99%. The ECG features (QRS) did not perform well in the classification results of 86%, although adding the clinical data enhanced the QRS classification results to 96%. After applying the chaos theory to the ECG QRS features combined with the clinical data the results of the Decision Tree algorithm and the Neural Network algorithm outperformed all previous experiments by 99.8% and 98%, respectively. In comparison to state-of-the-art models, SVM outperforms in raw ECG signal feature classification. However, Decision Tree is outperformed when clinical features are considered, and ECG signals are reduced by QRS after chaos transformation with increased accuracy than the diagnosis of raw ECG signals. For performance, the QRS with chaos transformation reduced the data size by 80%, which is a huge benefit for big data analytics, and thus reduced the processing time to 1/5th of the time. At the same time, this feature reduction model achieved higher accuracy. For future work, the model needs to be investigated in real-time to be applied in intensive cases and evidence-based medicine. Also, studying anxiety levels use such real-time model, e.g., in vehicle driving systems.
Acknowledgement: The authors extend their appreciation to the Deanship of Scientific Research at King Khalid University.
Funding Statement: The authors extend their appreciation to the Deanship of Scientific Research at King Khalid University for funding this work through Large Groups (Grant Number RGP.2/246/44), B.B., and https://www.kku.edu.sa/en.
Author Contributions: The authors confirm contribution to the paper as follows: study conception and design: M.A., B.B., and A.E.; data collection: M.A. and R.E.; analysis and interpretation of results: M.A. and A.A.; draft manuscript preparation: M.A. and P.E. All authors reviewed the results and approved the final version of the manuscript.
Availability of Data and Materials: The data are available any time if needed from the author Maie Aboghazalah (e-mail: eng_maie@yahoo.com).
Conflicts of Interest: The authors declare that they have no conflicts of interest to report regarding the present study.
References
1. S. Faziludeen and P. Sabiq, “ECG beat classification using wavelets and SVM,” in Proc. 2013 IEEE Conf. Inf. Commun. Technol., Thuckalay, Tamil Nadu, India, 2013, pp. 815–818. [Google Scholar]
2. S. Asane, A. M. Rawate, and P. Kamble, “A review on ECG detection and analysis using MATLAB,” Int. J. Innov. Res. Comput. Commun. Eng., vol. 4, no. 11, pp. 19861–19865, 2016. [Google Scholar]
3. M. Hammad et al., “Automated detection of shockable ECG signals: A review,” Inf. Sci., vol. 571, no. 3, pp. 580–604, 2021. doi: 10.1016/j.ins.2021.05.035. [Google Scholar] [CrossRef]
4. M. Hammad, A. Maher, K. Wang, F. Jiang, and M. Amrani, “Detection of abnormal heart conditions based on characteristics of ECG signals,” Measurement, vol. 125, no. 3, pp. 634–644, 2018. doi: 10.1016/j.measurement.2018.05.033. [Google Scholar] [CrossRef]
5. H. A. J. AL-Ziarjawey and I. Çankaya, “Heart rate monitoring and PQRST detection based on graphical user interface with MATLAB,” Int. J. Inf. Electron. Eng., vol. 5, no. 4, pp. 311–316, 2015. doi: 10.7763/IJIEE.2015.V5.550. [Google Scholar] [CrossRef]
6. S. S. Mehta and N. S. Lingayat, “Support vector machine for cardiac beat detection in single lead electrocardiogram,” IAENG Int. J. Appl. Math., vol. 36, no. 2, pp. 1630–1635, 2007. [Google Scholar]
7. F. Lauer and G. Bloch, “Incorporating prior knowledge in support vector machines for classification: A review,” Neurocomputing, vol. 71, no. 7–9, pp. 1578–1594, 2008. doi: 10.1016/j.neucom.2007.04.010. [Google Scholar] [CrossRef]
8. G. K. Malik, Y. Kumar, and M. Panda, “Cardiac arrhythmia detection in ECG signals by feature extraction and support vector machine,” in Proc. Second Int. Conf. Res. in Intell. Comput. Eng., Gopeshwar, Uttrakhand, India, 2017, pp. 241–244. [Google Scholar]
9. P. El Kafrawy, A. Mausad, and H. Esmail, “Experimental comparison of methods for multi-label classification in different application domains,” Int. J. Comput. Appl., vol. 114, no. 19, pp. 1–9, 2015. [Google Scholar]
10. M. Qaraad et al., “A hybrid feature selection optimization model for high dimension data classification,” IEEE Access, vol. 9, no. 19, pp. 42884–42895, 2021. doi: 10.1109/ACCESS.2021.3065341. [Google Scholar] [CrossRef]
11. P. El-Kafrawy, I. I. M. Manhrawy, H. Fathi, M. Qaraad, and A. K. Kelany, “Using multi-feature selection with machine learning for de novo acute myeloid leukemia in Egypt,” in Proc. EEE Int. Conf. Intell. Syst. Adv. Comput. Sci. (ISACS), Taza, Morocco, 2019, pp. 1–8. [Google Scholar]
12. M. Naz et al., “From ECG signals to images: A transformation based approach for deep learning,” PeerJ Comput. Sci., vol. 7, no. 1, pp. 2–18, 2021. doi: 10.7717/peerj-cs.386. [Google Scholar] [PubMed] [CrossRef]
13. M. Wang, M. Huang, S. Lu, and G. Ye, “Application of artificial neural network and empirical mode decomposition with chaos theory to electrocardiography diagnosis,” Sens. Mater., vol. 32, no. 9, pp. 3051–3064, 2020. doi: 10.18494/SAM.2020.2720. [Google Scholar] [CrossRef]
14. S. Gao et al., “A 3D model encryption scheme based on a cascaded chaotic system,” Signal Process., vol. 202, no. 1, pp. 1–13, 2023. doi: 10.1016/j.sigpro.2022.108745. [Google Scholar] [CrossRef]
15. A. P. Wibawa et al., “Naïve Bayes classifier for journal quartile classification,” Int. J. Recent Contrib. Eng. Sci. IT (iJES), vol. 7, no. 2, pp. 91–99, 2019. doi: 10.3991/ijes.v7i2.10659. [Google Scholar] [CrossRef]
16. A. Kampouraki, G. Manis, and C. Nikou, “Heartbeat time series classification with support vector machines,” IEEE Trans. Inf. Technol. Biomed.: Publication IEEE Eng. Med. Biol. Soc., vol. 13, no. 4, pp. 512–518, 2009. doi: 10.1109/TITB.2008.2003323. [Google Scholar] [PubMed] [CrossRef]
17. V. Gupta, M. Mittal, and V. Mittal, “Chaos theory: An emerging tool for arrhythmia detection,” Sens. Imaging, vol. 21, no. 1, pp. 10, 2018. doi: 10.1007/s11220-020-0272-9. [Google Scholar] [CrossRef]
18. S. Celin and K. Vasanth, “ECG signal classification using various machine learning techniques,” J. Med. Syst., vol. 42, no. 4, pp. 241–252, 2008. doi: 10.1007/s10916-018-1083-6. [Google Scholar] [PubMed] [CrossRef]
19. C. Venkatesan, P. Karthigaikumar, A. Paul, S. Satheeskumaran, and R. Kumar, “ECG signal preprocessing and SVM classifier-based abnormality detection in remote healthcare applications,” IEEE Access, vol. 6, pp. 9767–9773, 2018. doi: 10.1109/ACCESS.2018.2794346. [Google Scholar] [CrossRef]
20. S. Mejhoudi, R. Latif, A. Toumanari, W. Jenkal, and A. Elouardi, “Implementation and evaluation of ECG signal processing algorithms on embedded architectures,” in Proc. 2017 Int. Conf. Electr. Inf. Technol. (ICEIT), Rabat, Morocco, 2017, pp. 1–6. [Google Scholar]
21. S. Sumathi, “An approach for ECG feature extraction and classification of cardiac abnormalities,” Cardiovasc. Pharmacol.: Open Access, vol. 7, no. 1, pp. 2–4, 2018. [Google Scholar]
22. V. Gupta, M. Mittal, and V. Mittal, “R-peak detection based chaos analysis of ECG signal,” Analog Integr. Circuits Signal Process., vol. 102, no. 1, pp. 479–490, 2020. doi: 10.1007/s10470-019-01556-1. [Google Scholar] [CrossRef]
23. M. G. Shankar and C. G. Babu, “An exploration of ECG signal feature selection and classification using machine learning techniques,” Int. J. Innov. Technol. Explor. Eng., vol. 9, no. 3, pp. 797–804, 2020. doi: 10.35940/ijitee.C8728.019320. [Google Scholar] [CrossRef]
24. E. Frank, M. Hall, and I. Witten, “The WEKA workbench online appendix for data mining: Practical machine learning tools and techniques,” in Data Mining: Practical Machine Learning Tools and Techniques, 4th ed. Hamilton, New Zealand: University of Waikato, 2016, vol. 3, pp. 797–804. [Google Scholar]
25. M. Awad and R. Khanna, “Support vector machines for classification,” in Efficient Learning Machines: Theories, Concepts, and Applications for Engineers and System Designers, 1st ed. Berkeley, CA: Apress, 2015, pp. 39–66. [Google Scholar]
26. S. Liu, Z. Yang, Y. Li, and S. Wang, “Decision tree-based sensitive information identification and encrypted transmission system,” Entropy, vol. 22, no. 2, pp. 1–18, 2020. doi: 10.3390/e22020192. [Google Scholar] [PubMed] [CrossRef]
27. N. Siagian, M. Zarlis, and Z. Situmorang, “Analysis of neural network algorithm in determining high school student department,” in Proc. IOP Conf. Ser.: Mater. Sci. Eng., Ulaanbaatar, Mongolia, 2020, pp. 1–6. [Google Scholar]
28. S. Steven and S. Alberto, “Review of C4.5: Programs for machine learning,” Mach. Learn., vol. 16, no. 3, pp. 235–240, 1994. doi: 10.1023/A:1022645310020. [Google Scholar] [CrossRef]
29. D. Ai et al., “Fast multi-scale feature fusion for ECG heartbeat classification,” EURASIP J. Adv. Signal Process., vol. 46, no. 1, pp. 1–12, 2015. doi: 10.1186/s13634-015-0231-0. [Google Scholar] [CrossRef]
30. A. Goldberger et al., “PhysioBank, PhysioToolkit, and PhysioNet: Components of a new research resource for complex physiologic signals,” Circulation, vol. 101, no. 23, pp. 215–220, 2022. [Google Scholar]
31. M. Hammad, M. H. Alkinani, B. B. Gupta, and A. A. A. El-Latif, “Myocardial infarction detection based on deep neural network on imbalanced data,” Multimed. Syst., vol. 28, no. 2, pp. 1373–1385, 2021. doi: 10.1007/s00530-020-00728-8. [Google Scholar] [CrossRef]
Cite This Article
 Copyright © 2024 The Author(s). Published by Tech Science Press.
This work is licensed under a Creative Commons Attribution 4.0 International License , which permits unrestricted use, distribution, and reproduction in any medium, provided the original work is properly cited.
 Downloads
 Citation Tools