
 Submit a Paper
 Propose a Special lssue
 Open Access
ARTICLE

Prediction of the Pore-Pressure Built-Up and Temperature of Fire-Loaded Concrete with Pix2Pix
1 Mechanics and Materials Science Research Center, Ningbo University, Ningbo, 315211, China
2 Jinyun Institute, Zhejiang Sci-Tech University, Lishui, 321400, China
3 School of Civil Engineering and Architecture, Zhejiang Sci-Tech University, Hangzhou, 310018, China
4 School of Computer Science, Nanjing University of Information Science and Technology, Nanjing, 210044, China
* Corresponding Author: Yiming Zhang. Email:
Computers, Materials & Continua 2024, 79(2), 2907-2922. https://doi.org/10.32604/cmc.2024.050736
Received 15 February 2024; Accepted 08 April 2024; Issue published 15 May 2024
 View Full Text
 Download PDF
Abstract
Concrete subjected to fire loads is susceptible to explosive spalling, which can lead to the exposure of reinforcing steel bars to the fire, substantially jeopardizing the structural safety and stability. The spalling of fire-loaded concrete is closely related to the evolution of pore pressure and temperature. Conventional analytical methods involve the resolution of complex, strongly coupled multifield equations, necessitating significant computational efforts. To rapidly and accurately obtain the distributions of pore-pressure and temperature, the Pix2Pix model is adopted in this work, which is celebrated for its capabilities in image generation. The open-source dataset used herein features RGB images we generated using a sophisticated coupled model, while the grayscale images encapsulate the 15 principal variables influencing spalling. After conducting a series of tests with different layers configurations, activation functions and loss functions, the Pix2Pix model suitable for assessing the spalling risk of fire-loaded concrete has been meticulously designed and trained. The applicability and reliability of the Pix2Pix model in concrete parameter prediction are verified by comparing its outcomes with those derived from the strong coupling THC model. Notably, for the practical engineering applications, our findings indicate that utilizing monochrome images as the initial target for analysis yields more dependable results. This work not only offers valuable insights for civil engineers specializing in concrete structures but also establishes a robust methodological approach for researchers seeking to create similar predictive models.Keywords
When exposed to fire, concrete structures are at risk of undergoing explosive spalling, a process characterized by the sudden and forceful detachment of fragments from the heated concrete surface [1,2]. Explosive spalling not only strips away protective layers from the reinforcing steels but also critically undermines the load-bearing capabilities of concrete structures. Spalling arises from complex Thermo-Hydro-Chemical (THC) interactions [3–6] that include dehydration of the concrete matrix, phase transitions between liquid and vapor states, and the permeation and diffusion of water and dry air within concrete pores [7–9]. These processes are influenced by a myriad of material and environmental factors, such as permeability, conductivity, moisture content, and fire loading. Conventionally, simulating spalling accurately has required complicated numerical tools and considerable computational efforts. In many cases, highly refined temporal and spatial discretizations are inevitable, rendering real-time prediction of spalling risk during fire emergencies impractical. However, within engineering practices, there is a strong preference for rapid assessment methods that can adapt to any environmental condition and fire load scenario, aiding engineers and designers in their work. On the other hand, in recent years machine learning (ML) [10,11] has emerged as a powerful research tool for solving various engineering problems [12–14] in which the data-driven machine learning methods show their great potential in automatically identifying and extracting features and building predictive models. A typical data-driven model is a neural network-like numerical procedure. By feeding vast amounts of data into the neural network, the parameters of the network will be iteratively determined. Although the training process can be computationally intensive, once a network is trained, it is capable of delivering predictions with near-instantaneous speed [15], serving as an exceptionally efficient surrogate model.
As indicated in references [9,16], the evolution and distribution of pore-pressure built-up and temperature are the most important information to predict the spalling risk of fire-loaded concretes. In reference [15], a strategy is proposed that employs an RGB image to represent the temporal and spatial distributions of pore-pressure
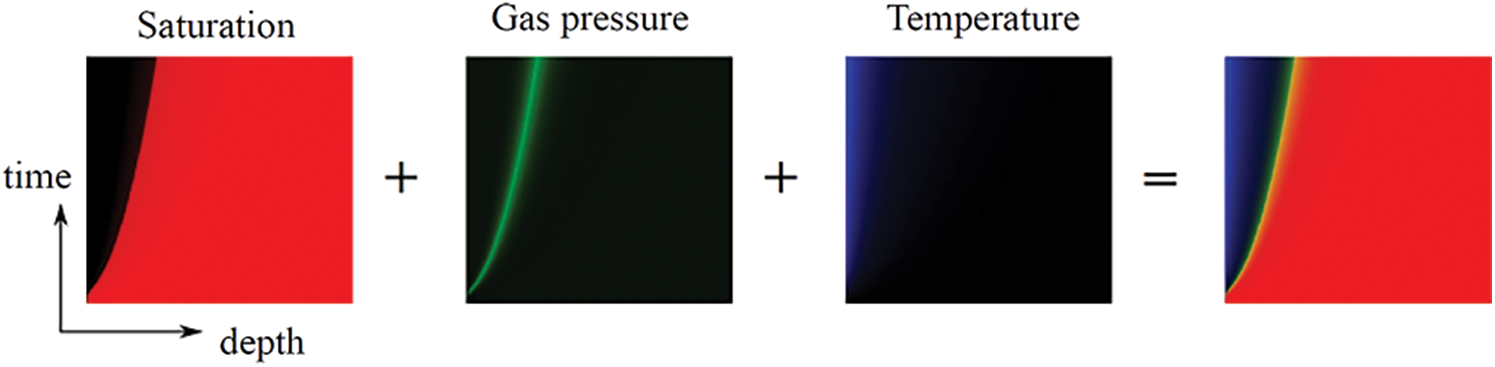
Figure 1: Using an RGB image for representing the time-space variations of
Building on our early work [15,17], aiming at obtaining the pore-pressure and temperature of concrete subjected to arbitrary fire load at any ambient humidity, Pix2Pix network is designed and used. The dataset originates from a well-established coupled THC model [8], transformed into image-based representations of both input parameters and results. The main contributions of this work are:
1. The appropriate network structure is obtained by comparing different levels of U-Net and patchGAN structures which extract image feature information and avoid the loss of details during transmission;
2. The influences of different loss functions on the calculation results are studied. By improving the loss constraints in the Pix2Pix model, the output error of the model is reduced, assuring precise images with high resolution;
3. The impacts of providing different initial target images on the generated results of training model are analyzed, indicating that in engineering applications, using a monochrome image as the initial target image often leads to dependable predictions.
The remaining parts of the paper are organized as follows (see Fig. 2): In Section 2, the Pix2Pix model is presented, including network structures, loss functions, training procedures, etc. In Section 3, numerical examples are given. By testing different structures and parameters, an optimized Pix2Pix model is obtained, and its reliability is indicated by comparing its results with those from the coupled THC model. Concluding remarks are given in Section 4.
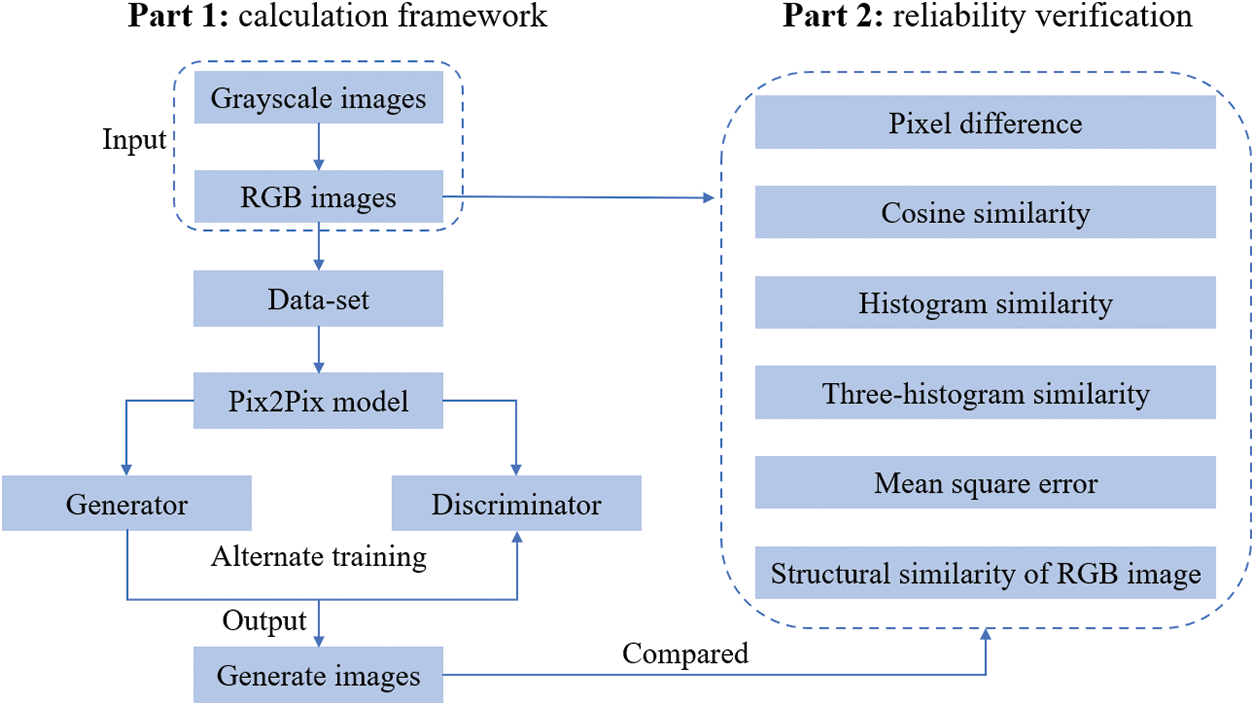
Figure 2: The main contents of this paper
2 Pix2Pix Image Conversion Model
The Pix2Pix is a GAN model specialized for image type data-sets. As shown in Fig. 3, the Pix2Pix model consists of two networks: i) a generator network (G) and ii) a discriminator network (D). The generator takes random noise vectors and input (grayscale) images as input and produces new RGB images, with the goal of generating images which are so close to the real images that the discriminator cannot distinguish between the two. The discriminator distinguishes between the real images from the data-set and the generated (fake) images produced by the generator then gives the probability of the input being real or fake. The generator tries to minimize the probability of the discriminator making a correct classification while the discriminator tries to maximize its accuracy in distinguishing between real and fake images. When the discriminator determines that an image is real, it directly outputs 1. After training, the generator and the discriminator are finally balanced, so the discriminator cannot identify the authenticity of the generated image. In other words, the probability of judging the authenticity of the output image is 0.5. The objective function of Pix2Pix can be expressed as:
in which (x) is the input image; in the training and testing stages, (y) is the real image from the target domain (can be expressed as y(r)), in the verification and application stages, since the real image is generally unknown in actual projects, (y) is usually provided casually by the user, which is called the initial target image (represented by y(s)); (z) is a random noise vector, and G(x, z) is the generated image. It is worth mentioning that the noise vector (z) is not indispensable in the training process [23]. The adversarial loss
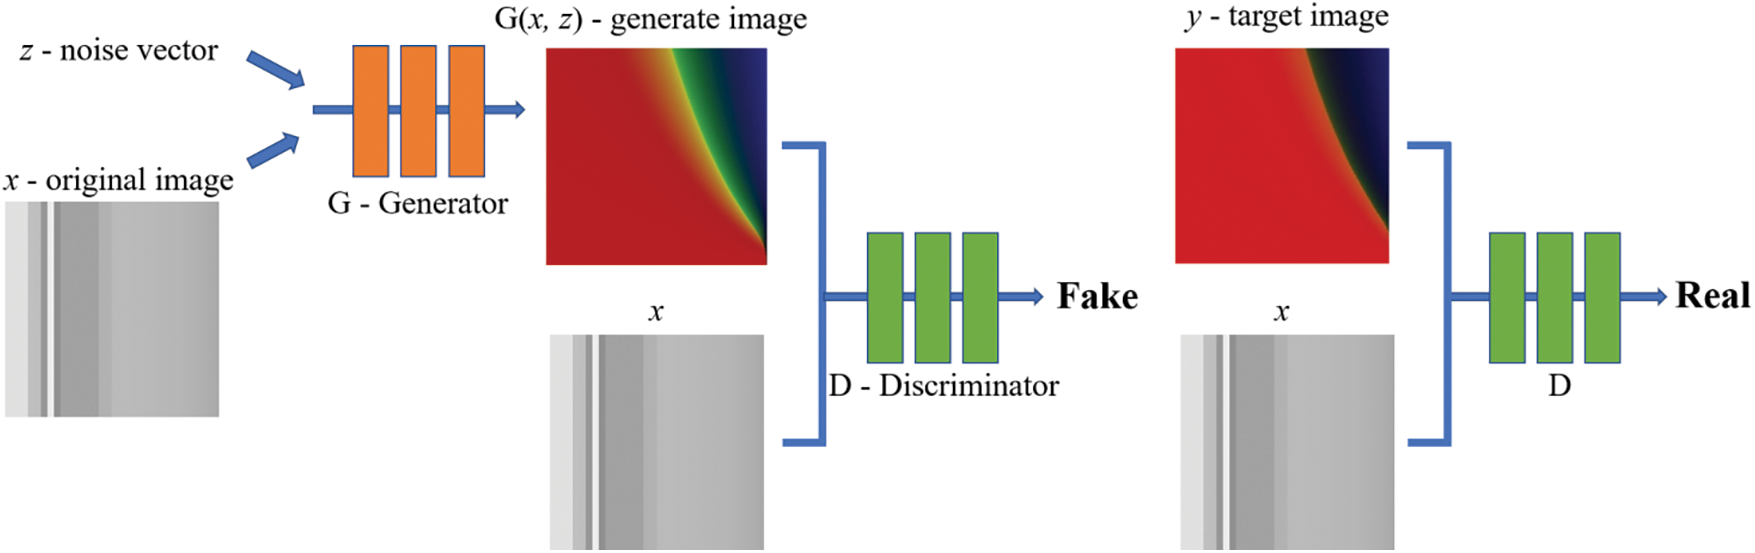
Figure 3: Pix2Pix model network structure
2.1 Generator and Discriminator
The U-Net structure has excellent image compression and denoising capabilities [29]. Compared with the traditional encoder-decoder structure network that performs down-sampling and dimension reduction on the input image, and then up-sampling and restoration, the U-Net generator adopts direct feature fusion instead of pooling index. As shown in Fig. 4, there are skip connections between each layer i and layer n−i, represented by blue arrows, and each rectangular box corresponds to a multi-channel feature map. Therefore, U-Net avoids the loss of low-level information during the transmission process by adding skip connections between decoders, and there is no full connection with large memory consumption between the up-sampling and down-sampling, effectively improving the image conversion performance. Hence the U-Net structure is adopted as the generator of Pix2Pix.
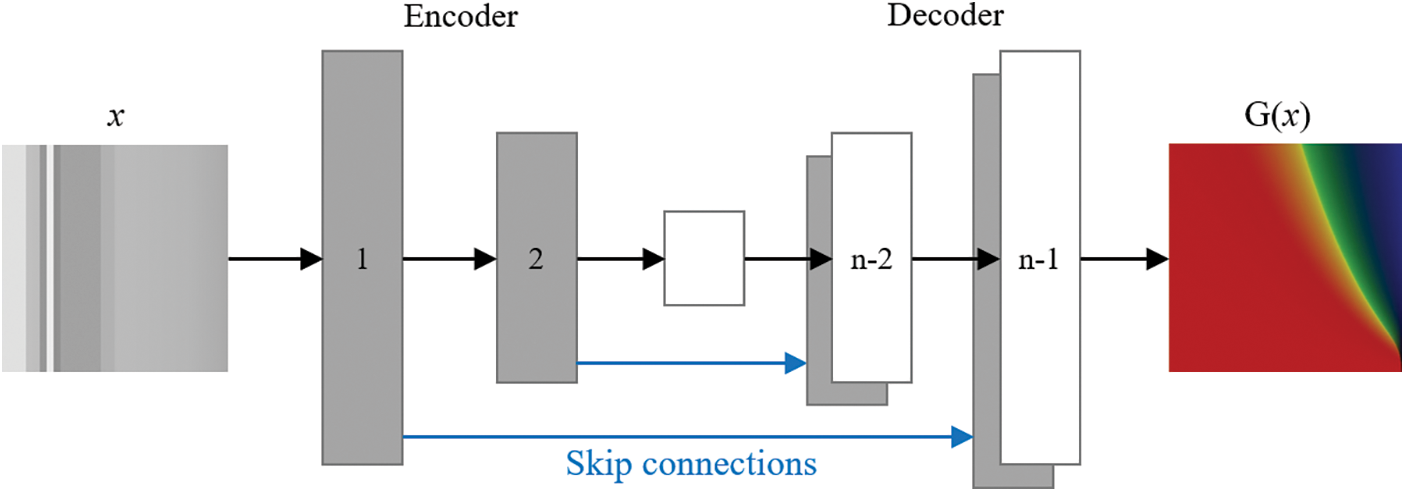
Figure 4: U-Net structure
Considering the discriminator, the patchGAN structure is used. The input of the discriminator is the real and the generated images, and its output is the probability value in the range of0–1. The patchGAN divides each image into multiple fixed-size and mutually independent patches, transforming the judgment of the real and fake of the whole image into the real and fake of each patch. The average value of all patch is used as the final output of the discriminator. Comparing to the other structures, the image sizes of patchGAN is not limited and the input dimension of the image can be greatly reduced.
By introducing activation functions, the nonlinear fitting ability of the U-Net structure can be improved. The rectified linear unit (ReLU) is a relatively commonly used activation function in deep learning, and it can be written as:
ReLU shows high efficiency and effectively alleviate the problems of gradient disappearance and explosion. However, during the processes of image convolution, a large number of negative values may be generated, making ReLU function provide great amount of zero values. To solve this problem, the LeakyReLU activation function is introduced as:
where
To determine the activation functions, three cases are considered. Case 1 uses all ReLU in the convolution process, Case 2 uses LeakyReLU, and Case 3 combines both by using LeakyReLU in the down-sampling process and ReLU in the up-sampling process. Fig. 5 shows the results comparing to the real images. These images are the distributions of pore-pressure, saturation degree, and temperature. The dark images are with low saturation degree and the bright images are with high saturation degree.
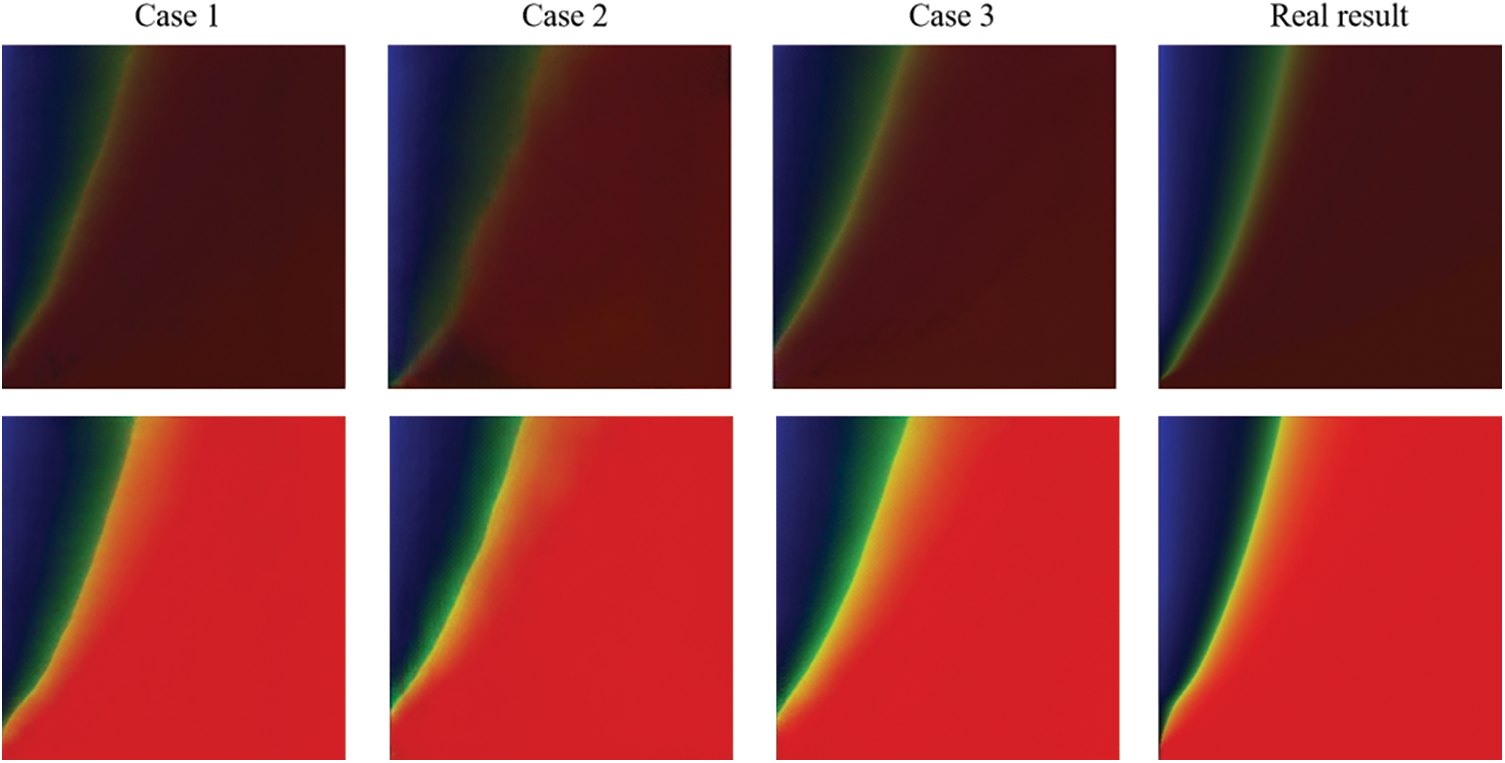
Figure 5: Comparison of different activation functions
By comparing with the real images, it can be found that the results of Case 1 lose many details and the results of Case 2 are worse. In contrast, Case 3 achieves the best conversion results for both low and high saturation images. Based on these results, the LeakyReLU activation function is used in the down-sampling process, ReLU function is used in the first seven up-sampling activation layers, and Tanh activation function is used in the last layer (up-sampling) in this work.
The loss function measures the difference between the predicted and the real value of the model. Because of the complexity and diversity of machine learning tasks, it is necessary to select an appropriate loss function to ensure the effectiveness of the model and improve the convergence speed. Several loss functions involved in this work are introduced here.
The Mean Square Error (MSE) function refers to the mean of the sum of squared differences between the predicted value and the real value of the model:
The Binary Cross Entropy Loss (BCELoss) is:
to ensure numerical stability, its output value can be normalized into [0,1] by using a sigmoid function. The
Smooth
where n is the numbers of pictures,
As the most commonly used loss function, MSE can reduce the error when there is a small difference between the real values and the predicted values. BCELoss is often used for binary classification problems. The gradient value of
3.1 Data-Set, Environment and Process
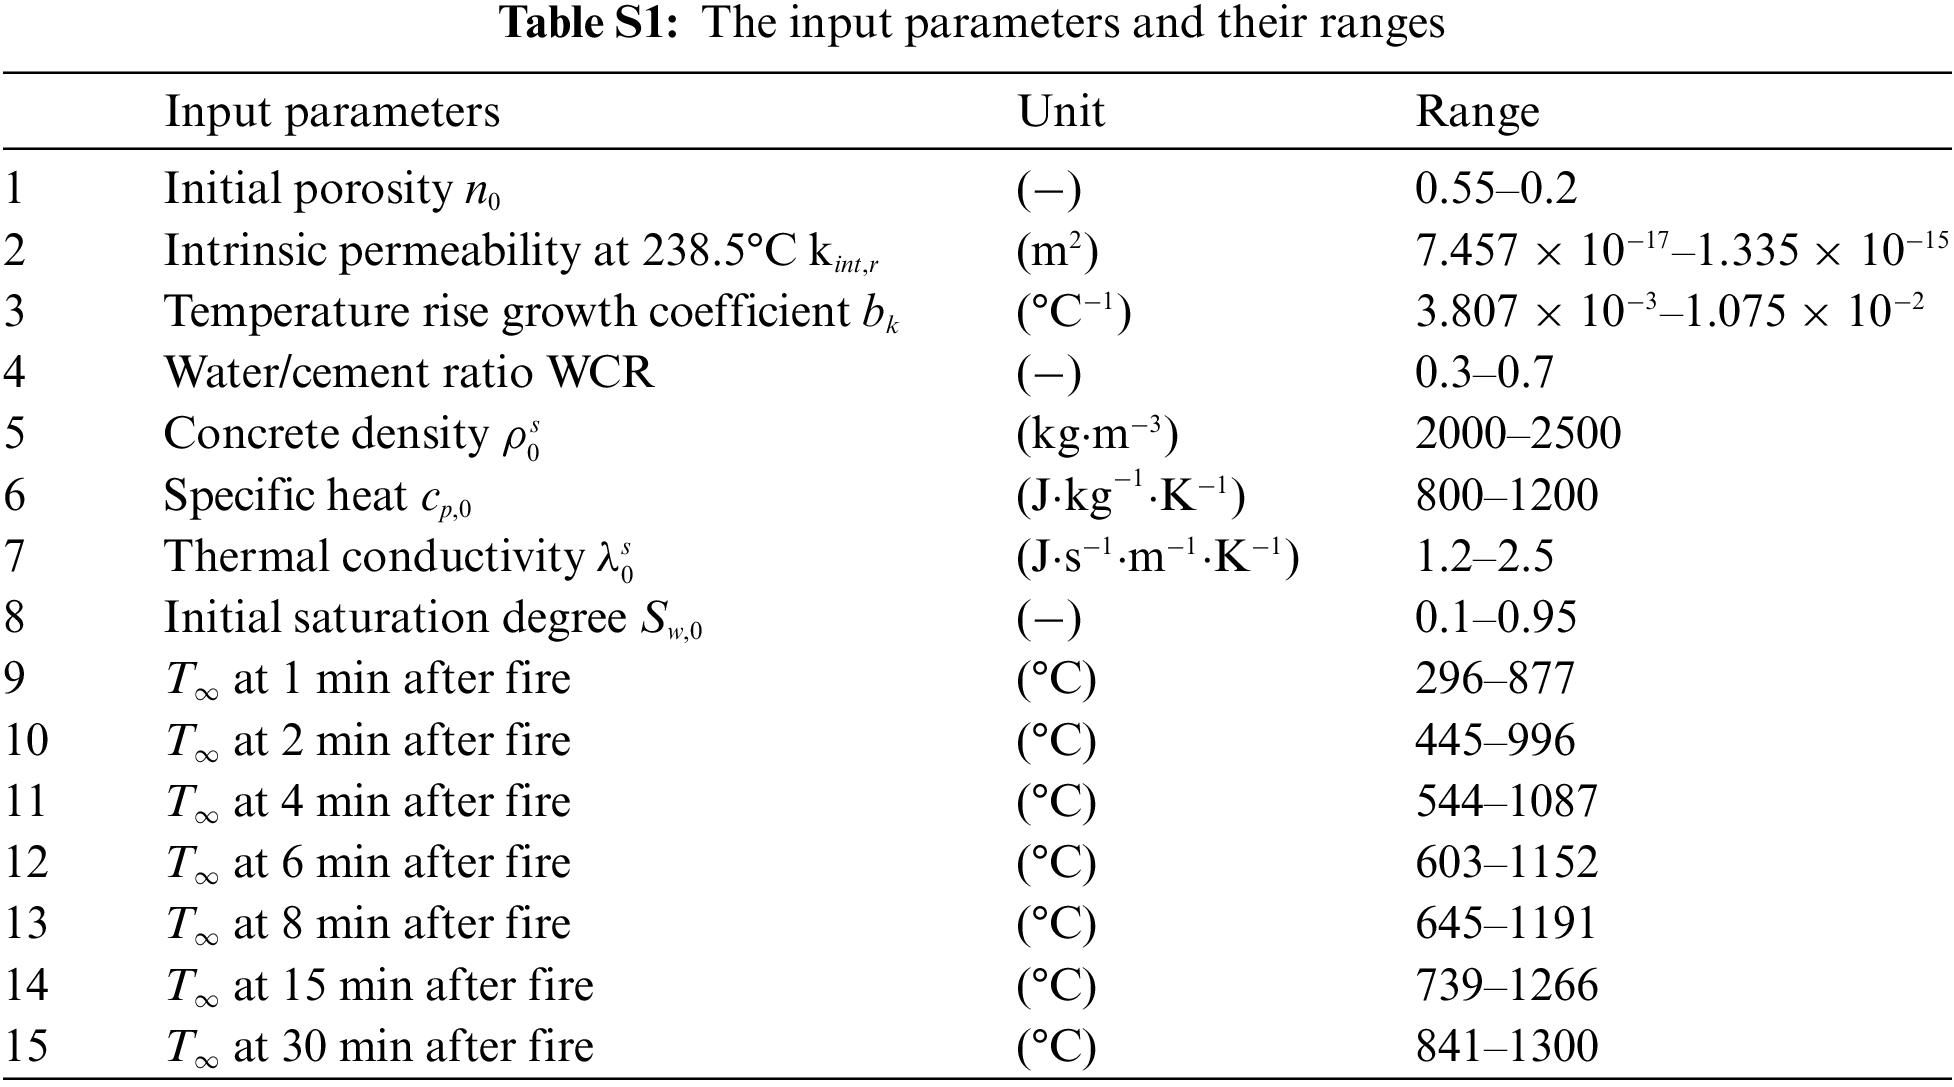
The data-set consists of 5000 image pairs and each pair includes a grayscale image as input image x and an RGB image as target (real) image y. The grayscale images store information like concrete material parameters, environmental moisture, and temperature loads (see Table S1 for detailed information) and the RGB images store the evolution and distributions of pore pressure, saturation degree and temperature, see [15,17] for details. The dataset can be accessed at “https://github.com/gzzgrzh/smart-building-track.git”. The 5000 groups of pictures are divided into training groups, test groups and validation groups at 80%, 18% and 2%, respectively. The trainings are conducted on a computer running 64-bit Ubuntu 20.04.4 LTS, Python 3.9.7, Tensorflow 2.5.2, Torchvision0.12.0, CUDA11.6, with an Intel(R) Core (TM) i7-9700 CPU @ 3.00 GHz ×8 processor and NVIDIA GeForce GTX 1600 Ti graphics card.
The generator and discriminator are trained alternately, using the Adam solver with mini-batch stochastic gradient descent. Both network weights are initialized from a Gaussian distribution with mean 0 and standard deviation 0.02. 200 epochs are used in each training procedure. The model is updated after each image, in other words, the batch-size is 1. The learning rate equals to 0.0002 and momentum parameter β = 0.5 [23,25]. In the pre-processing stage, one-to-one correspondence between the grayscale input image x and the RGB target image y is performed. After iteration, the images in the test data-set are tested after the trained model is obtained. Then the trained model is used to compare predictions on the validation set.
The number of U-Net structure sampling layers directly affects the quality of image conversion. For 256 × 256 images, when the number of sampling layers is set to 8 or 12, the generated images are distorted and unreliable, see Fig. 6 for example. Great differences can be found between the generated and real images. As shown in Fig. 7, this paper utilizes a U-Net structure with 8 down-sampling layers and 8 up-sampling layers to extract image feature information. The numbers on the sampling layer represent the width, height and number of feature channels of each layer feature image, respectively. The sampling layers use full convolution network structures with a convolution kernel of 4 × 4, a convolution step of 2, and padding pixel of 1. Each sampling layer includes convolution, normalization, and activation processing. The “skip connections strategy” fuses the image features after each up-sampling with the image features extracted from the down-sampled layer, simplifying the network structure and making full use of the low-level structural information and high-level semantic features of the image. After each convolution, the image size is reduced by half, replacing the pooling process to avoid the loss of image feature information. Additionally, the standard normalization operation improves the training efficiency and prevents overfitting. The generated results are shown in Fig. 8, indicating that the model show better performance on low-saturation (dark) images than on high-saturation (bright) images. Generally, these results are acceptable in the first iteration.
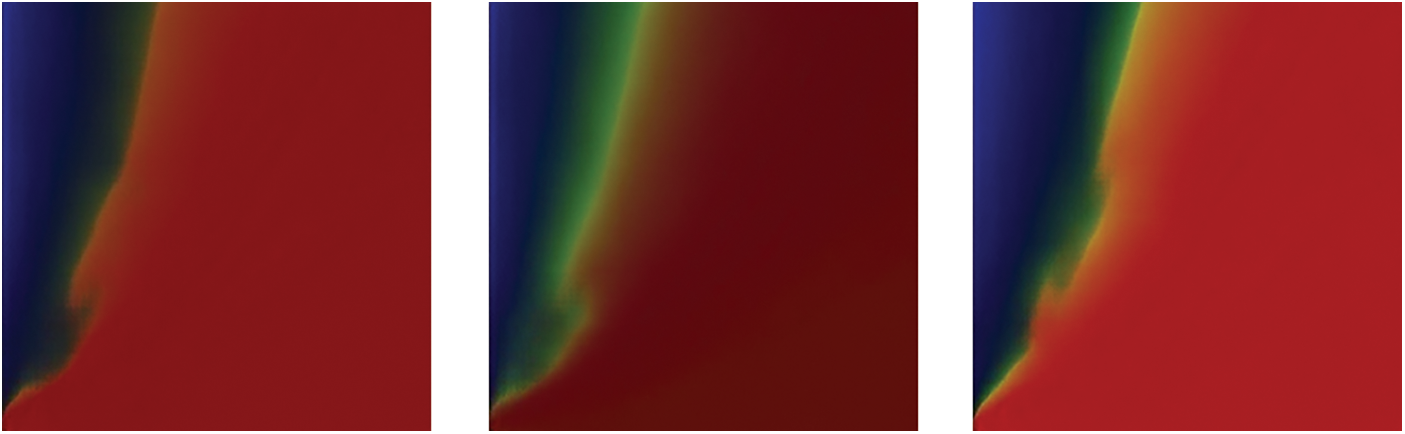
Figure 6: Results of U-Net structure with 8 or 12 layers
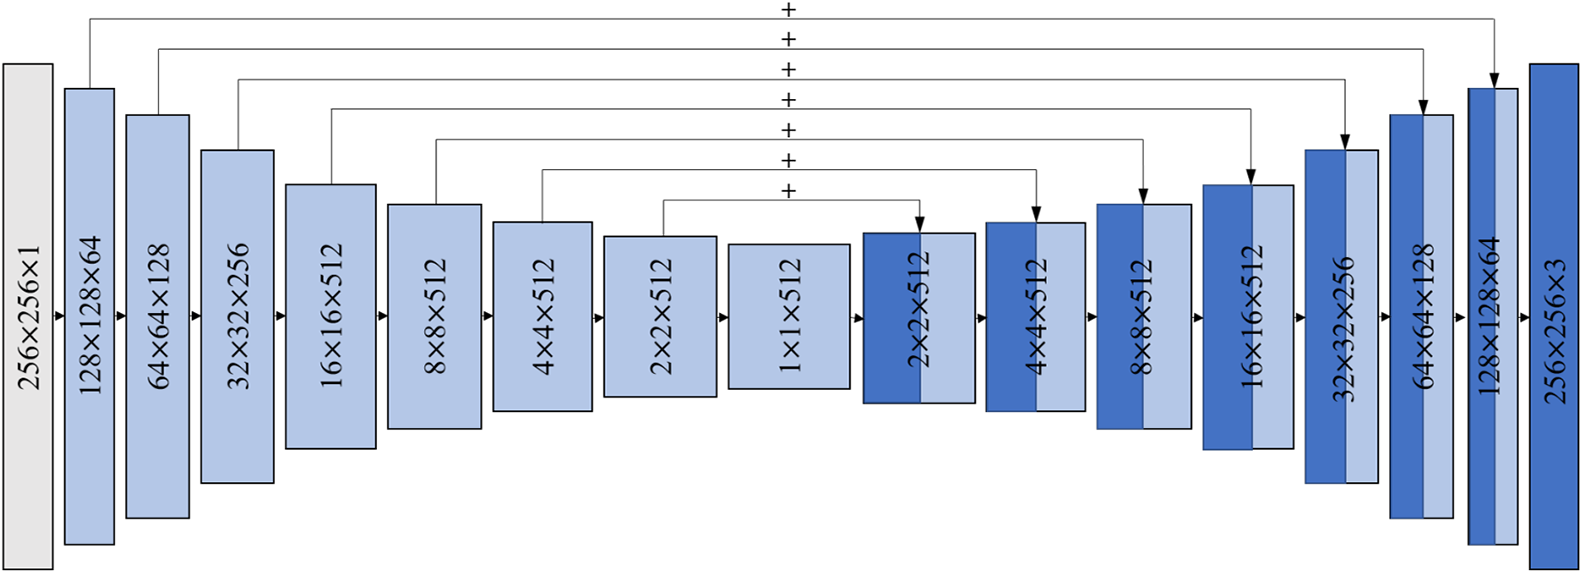
Figure 7: U-Net structure in this paper
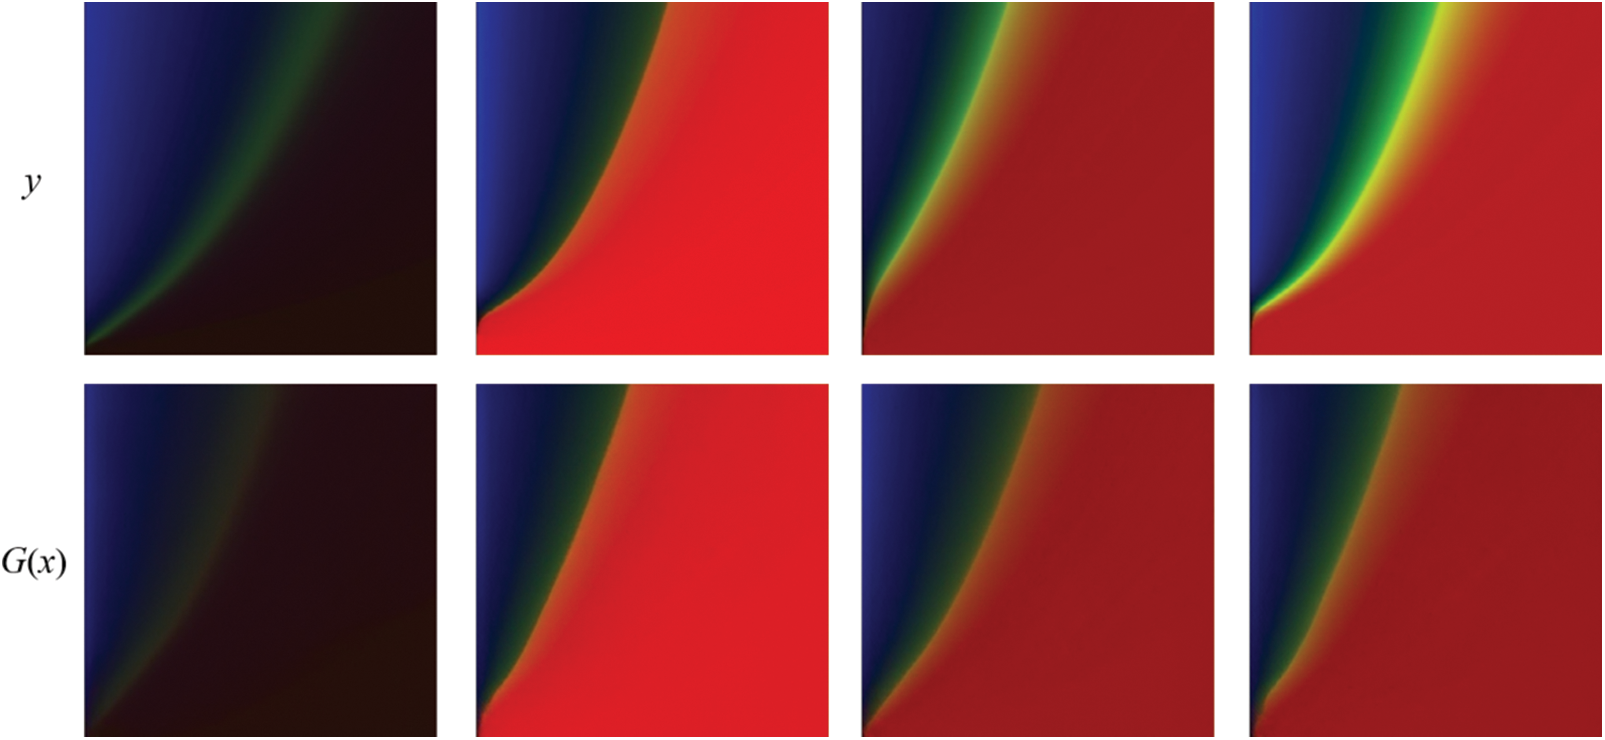
Figure 8: Results of U-Net structure with 8 down-sampling layers and 8 up-sampling layers (16 layers)
3.2.2 The Discriminator (patchGAN)
The number of convolutional layers directly affects the ability of the patchGAN discriminator to distinguish the real and fake images. In this work, the numbers of convolutional layers are tested with values of 3, 6 and 9. The differences between the generated images of generator and the real images are shown in Fig. 9. Through comparison, it can be found that when the number of discriminator convolution layers is 3 and 6, both perform well on generated images considering low saturation (dark). But in the cases with high saturation (bright), 6 convolution layers give better results. On the other hand, it is found that 9 convolution layers can lead to unreliable results, see Fig. 10 for example. Hence 6 convolution layers is used in the remaining parts of this work.
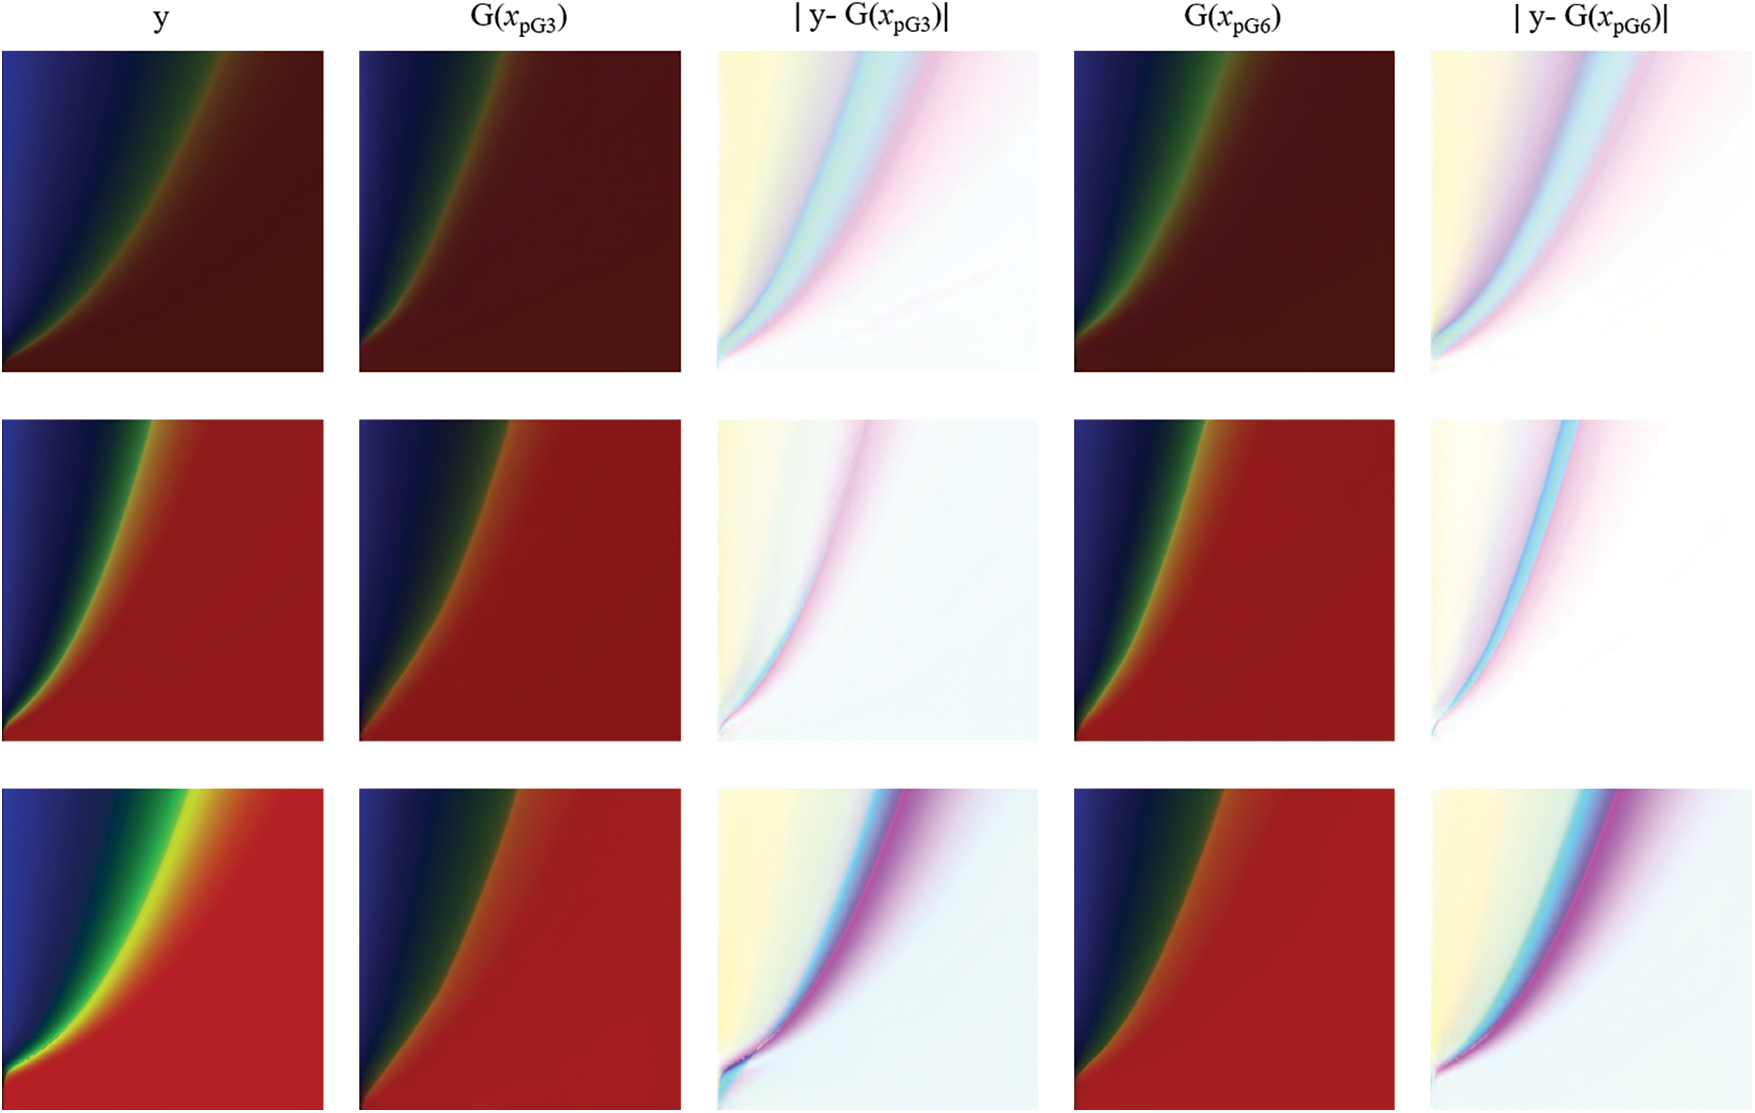
Figure 9: The results when the number of convolution layers is 3 and 6
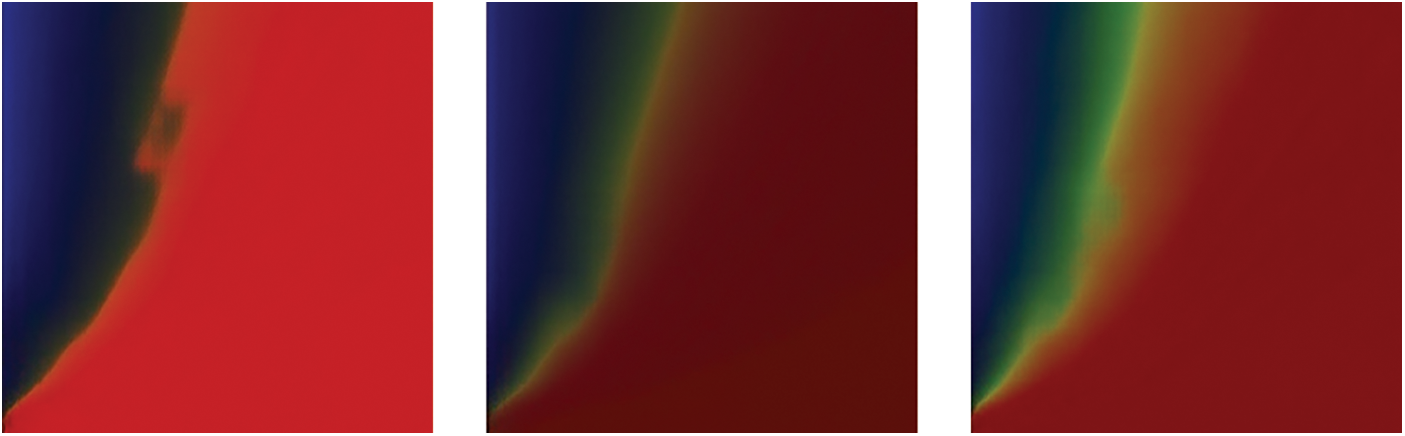
Figure 10: Some failure examples when the number of convolution layers is 9
Considering different loss functions, the obtained target images are shown in Fig. 11. Generally, the differences between these images are indistinguishable to the naked eyes. Hence different image similarity evaluation methods are used, including image cosine similarity (Cosine), histogram similarity (Hm), three-histogram similarity (ThreeH), structural similarity of RGB image (
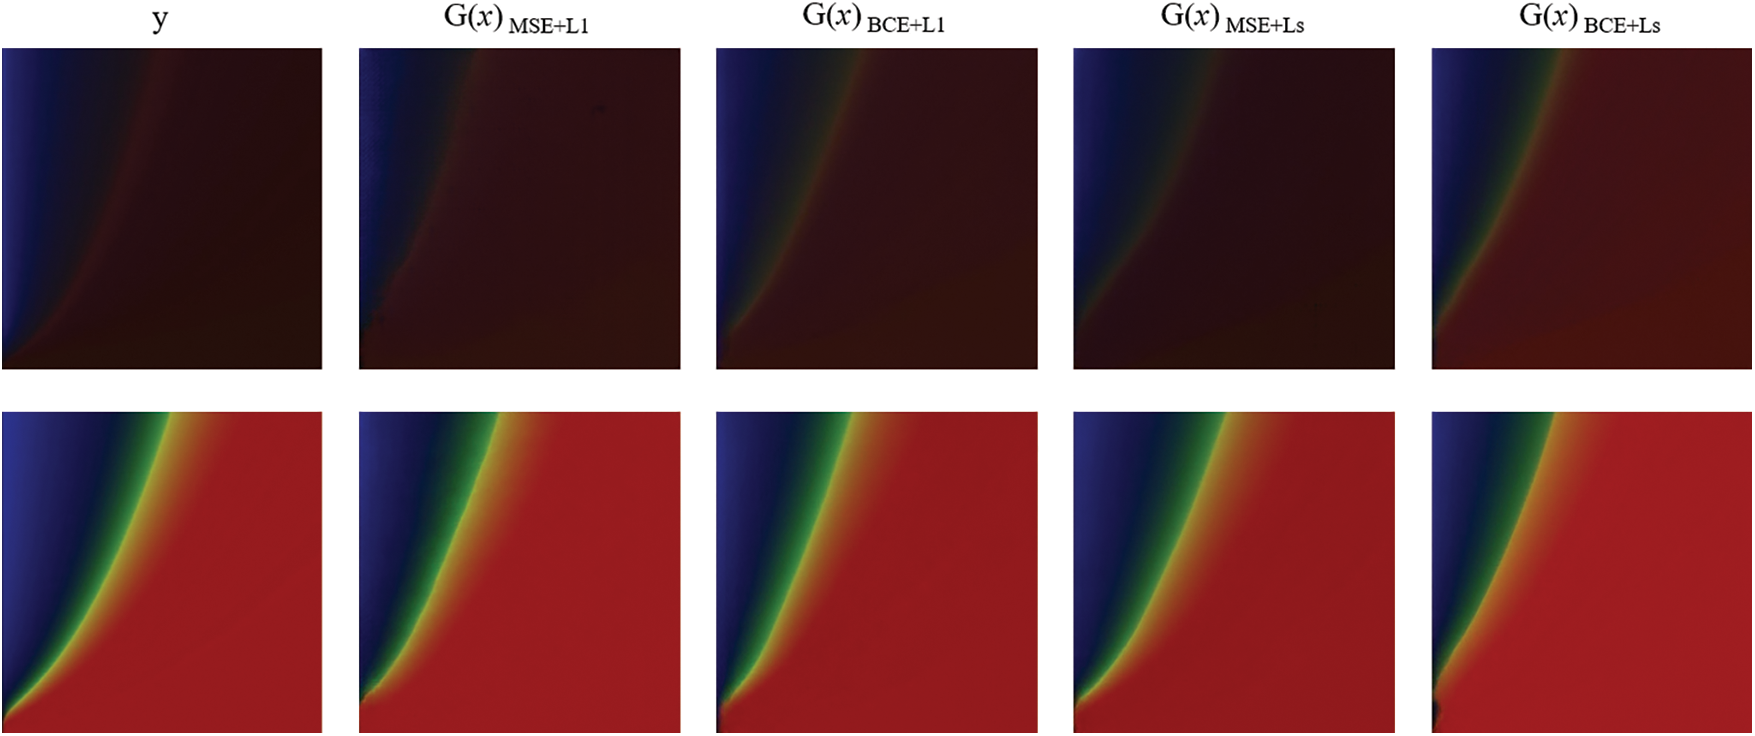
Figure 11: Results of using different loss functions

In summary, the hyperparameters used in the training process are listed in Table 2. Fig. 12 shows the loss curve of Pix2Pix in training, it can be found that

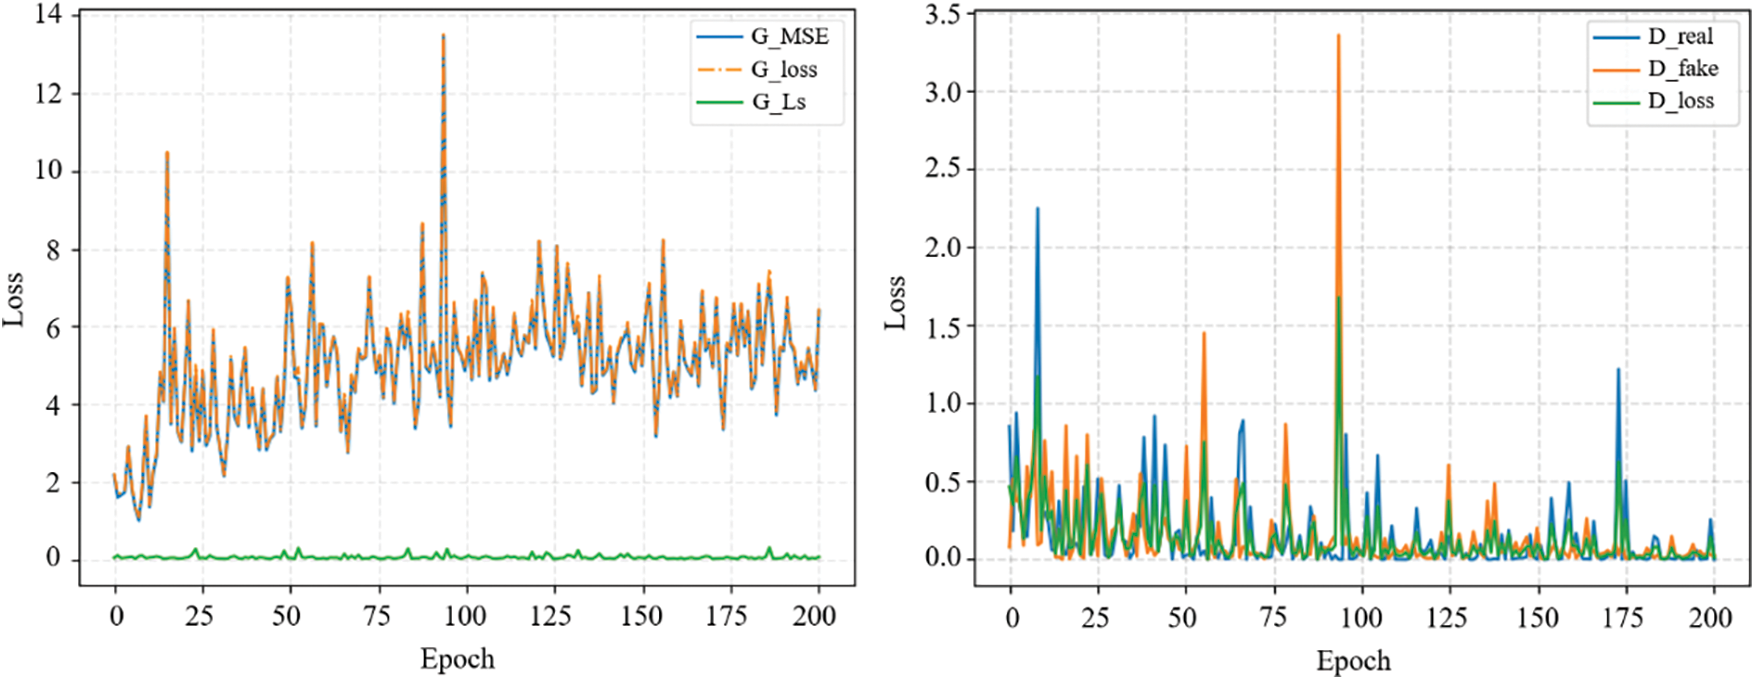
Figure 12: Losses of Pix2Pi2
3.2.4 The Influence of the Initial Target Images
The Pix2Pix model necessitates both an input image and an initial target image to produce an output image, with a blank image often serving as the initial target. To explore the impact of this initial target image, we examine four scenarios: i) using an image very close to the actual output image, ii) using an image that is similar yet distinct from the actual output image (darker), iii) using a monochrome blue image, and iv) using a blank image as the initial target. The outcomes, illustrated in Fig. 13, highlight the discrepancies between the generated output images and the actual images, presented as error images. As expected, scenario i yields the most accurate results. Conversely, scenario ii produces the least accurate results, suggesting that selecting an initial target image that is similar but not identical to the actual image can lead to poorer outcomes than even those achieved with monochrome images as the initial target. Therefore, given that the actual images are largely unknown, using a monochrome image as the initial target image becomes the most suitable choice.
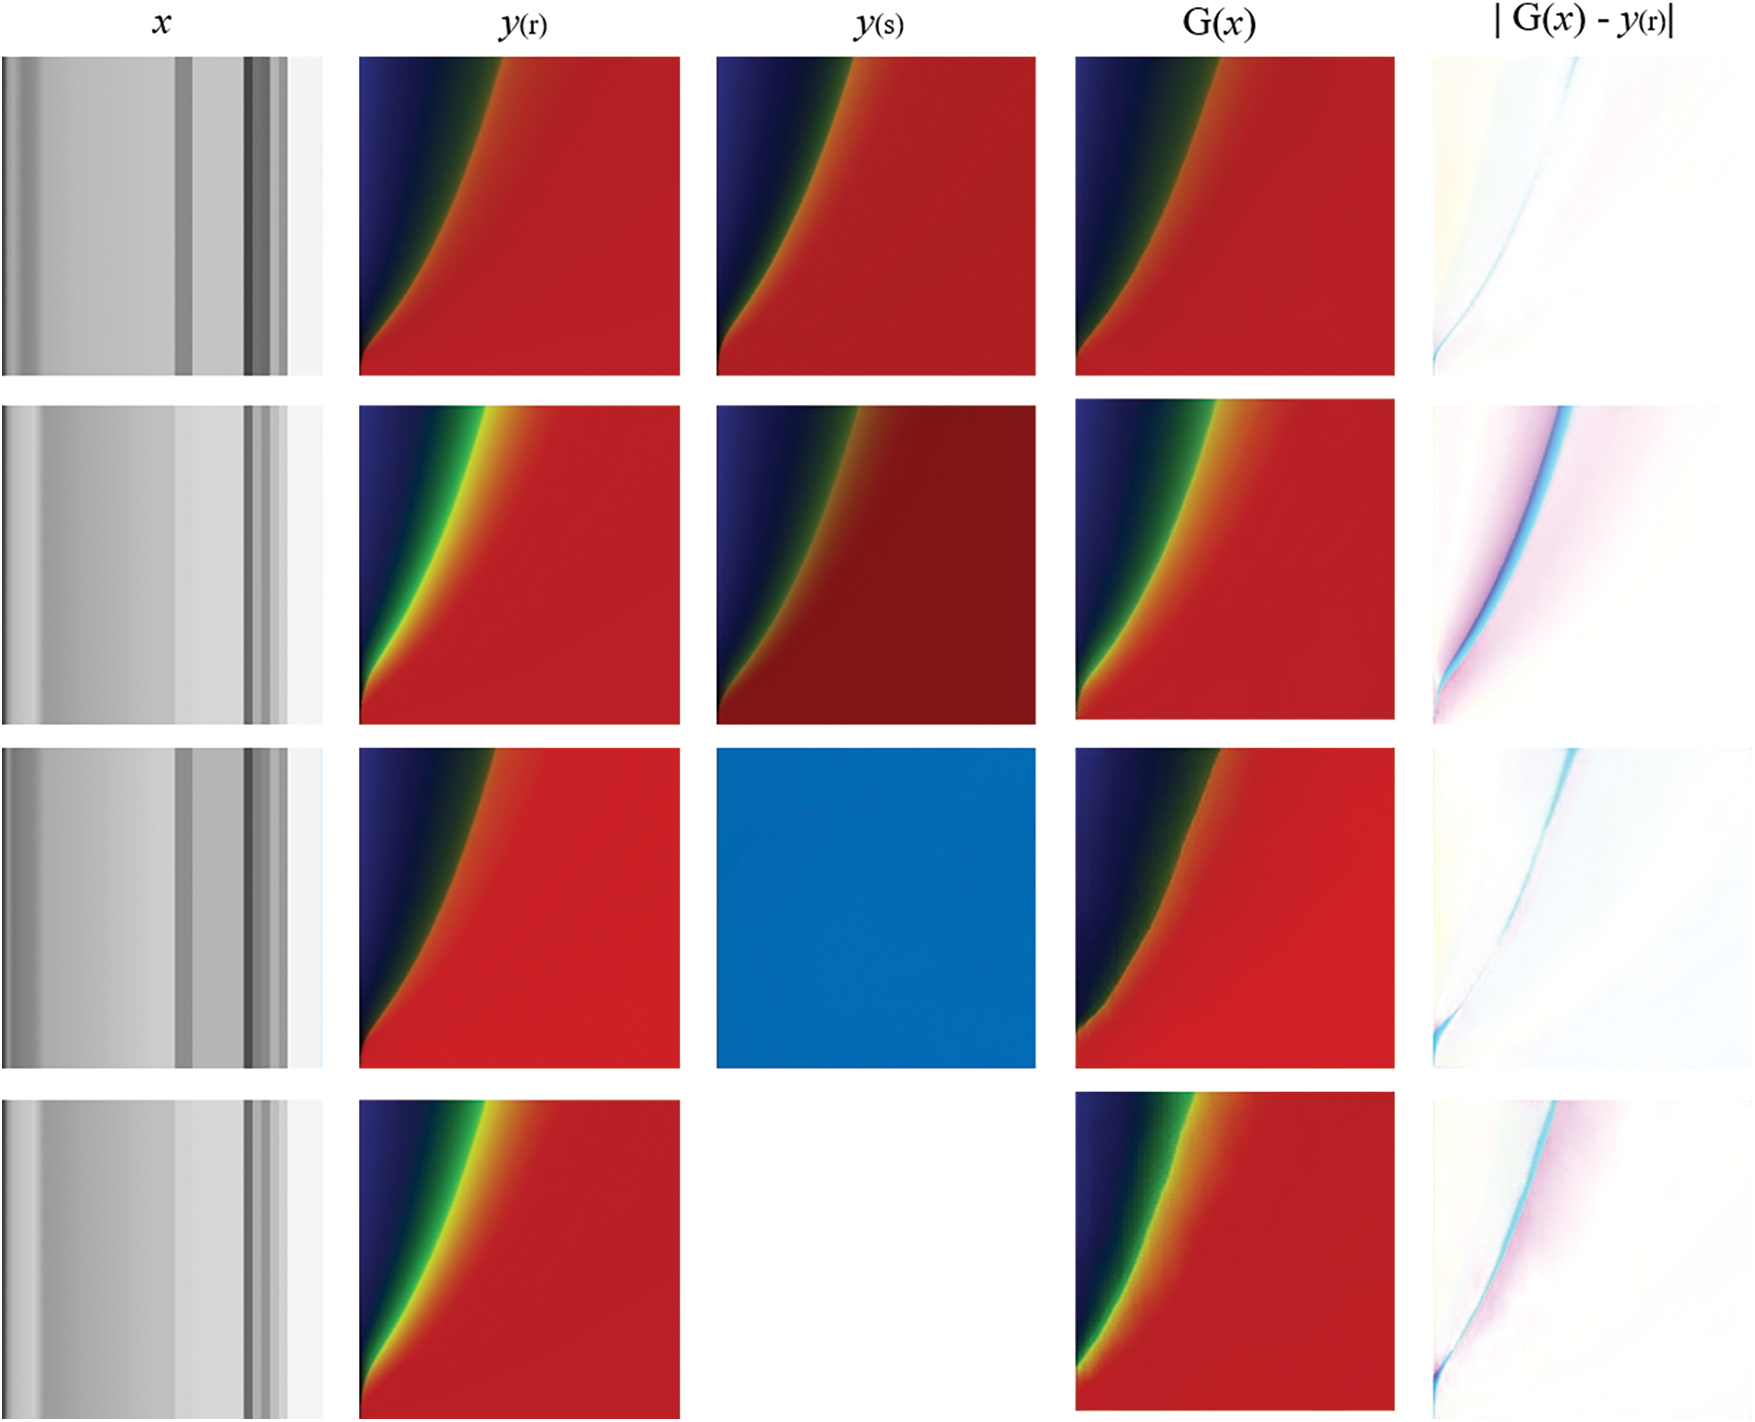
Figure 13: Results of using different initial target images
Aiming at predicting the pore-pressure and temperature of fire-loaded concrete, a Pix2Pix network is adopted and trained, which is widely used for image conversion and generation. The data-set, which is open-sourced, was constructed by using our previously developed a coupled THC model. The Pix2Pix network structures of the generator and discriminator are designed, taking into account various configurations of layers, activation functions, and loss functions. Through comparative analysis using different methods against the results of the strong coupled THC model, this work determined that the predictive error margin of our Pix2Pix model remains within acceptable limits. Notably, in practical engineering applications where the initial objective function may be obscure, this study indicates that the use of monochrome images as initial inputs can lead to predictions that more closely mirror the desired values. Furthermore, the applicability and reliability of the Pix2Pix model in concrete parameter prediction are verified. The methodologies and procedures developed in this work offer engineers a rapid assessment tool for evaluating the risk of spalling in concrete structures within a practical engineering context.
Acknowledgement: The authors would like to express our sincere gratitude and appreciation to each other for our combined efforts and contributions throughout the course of this research paper.
Funding Statement: This work was support by the National Natural Science Foundation of China (NSFC) (52178324).
Author Contributions: The authors confirm contribution to the paper as follows: Study conception and design: Y. Zhang, X. Wang; data collection: Y. Zhang, X. Wang; analysis and interpretation of results: X. Wang, Y. Zhang, Q. Liu, H. Wang; draft manuscript preparation: X. Wang. All authors reviewed the results and approved the final version of the manuscript.
Availability of Data and Materials: The datasets used in the experiments are cited in the article.
Conflicts of Interest: The authors declare that they have no conflicts of interest to report regarding the present study.
References
1. J. Sanjayan and L. Stocks, “Spalling of high-strength silica fume concrete in fire,” ACI Mater. J., vol. 59, no. 2, pp. 170–173, Mar. 1993. doi: 10.14359/4015. [Google Scholar] [CrossRef]
2. K. Hertz, “Limits of spalling of fire-exposed concrete,” Fire Saf. J., vol. 38, no. 2, pp. 103–116, Mar. 2003. doi: 10.1016/S0379-7112(02)00051-6. [Google Scholar] [CrossRef]
3. C. Davie, C. Pearce, and N. Bićanić, “Fully coupled, hygro-thermo-mechanical sensitivity analysis of a pre-stressed concrete pressure vessel,” Eng. Struct., vol. 59, no. Suppl. 1, pp. 536–551, Feb. 2014. doi: 10.1016/j.engstruct.2013.10.033. [Google Scholar] [CrossRef]
4. D. Gawin, F. Pesavento, and B. Schrefler, “Modelling of hygro-thermal behaviour and damage of concrete at temperature above the critical point of water,” Int. J. Numer. Anal. Methods Geomech., vol. 26, no. 6, pp. 537–562, May 2002. doi: 10.1002/nag.211. [Google Scholar] [CrossRef]
5. D. Gawin, F. Pesavento, and B. Schrefler, “Towards prediction of the thermal spalling risk through a multi-phase porous media model of concrete,” Comput. Methods Appl. Mech. Eng., vol. 195, no. 41, pp. 5707–5729, Aug. 2006. doi: 10.1016/j.cma.2005.10.021. [Google Scholar] [CrossRef]
6. D. Gawin, F. Pesavento, and A. G. Castells, “On reliable predicting risk and nature of thermal spalling in heated concrete,” Arch. Civil Mech. Eng., vol. 18, no. 4, pp. 1219–1227, Sep. 2018. doi: 10.1016/j.acme.2018.01.013. [Google Scholar] [CrossRef]
7. A. Sharma, J. Bošnjak, J. Ožbolt, and J. Hofmann, “Numerical modeling of reinforcement pull-out and cover splitting in fire-exposed beam-end specimens,” Eng. Struct., vol. 111, pp. 217–232, Mar. 2016. doi: 10.1016/j.engstruct.2015.12.017. [Google Scholar] [CrossRef]
8. Y. Zhang, M. Zeiml, C. Pichler, and R. Lackner, “Model-based risk assessment of concrete spalling in tunnel linings under fire loading,” Eng. Struct., vol. 77, pp. 207–215, Oct. 2014. doi: 10.1016/j.engstruct.2014.02.033. [Google Scholar] [CrossRef]
9. Y. Zhang, M. Zeiml, M. Maier, Y. Yuan, and R. Lackner, “Fast assessing spalling risk of tunnel linings under RABT fire: From a coupled thermo-hydro-chemo-mechanical model towards an estimation method,” Eng. Struct., vol. 142, pp. 1–19, Jul. 2017. doi: 10.1016/j.engstruct.2017.03.068. [Google Scholar] [CrossRef]
10. R. S. Michalski, I. Bratko, and A. Bratko, Machine learning and data mining; methods and applications. New York, USA: John Wiley & Sons, Inc., 1998. [Google Scholar]
11. G. Hinton et al., “Deep neural networks for acoustic modeling in speech recognition: The shared views of four research groups,” IEEE Signal Process. Mag., vol. 29, no. 6, pp. 82–97, Nov. 2012. doi: 10.1109/MSP.2012.2205597. [Google Scholar] [CrossRef]
12. A. Agrawal, P. Deshpande, A. Cecen, B. Gautham, A. Choudhary and S. Kalidindi, “Exploration of data science techniques to predict fatigue strength of steel from composition and processing parameters,” Integr. Mater. Manuf. Innov., vol. 3, no. 1, pp. 90–108, Apr. 2014. doi: 10.1186/2193-9772-3-8. [Google Scholar] [CrossRef]
13. X. Gao, M. Shi, X. Song, C. Zhang, and H. Zhang, “Recurrent neural networks for real-time prediction of tbm operating parameters,” Autom. Const., vol. 98, no. 1, pp. 225–235, Feb. 2019. doi: 10.1016/j.autcon.2018.11.013. [Google Scholar] [CrossRef]
14. Y. Li, H. Wang, and X. Deng, “Image-based reconstruction for a 3D-PFHS heat transfer problem by reconnn,” Int. J. Heat Mass Transf., vol. 134, no. 18, pp. 656–667, May. 2019. doi: 10.1016/j.ijheatmasstransfer.2019.01.069. [Google Scholar] [CrossRef]
15. Y. Zhang, Z. Gao, X. Wang, and Q. Liu, “Predicting the pore-pressure and temperature of fire-loaded concrete by a hybrid neural network,” Int. J. Comput. Methods, vol. 19, no. 8, pp. 656–667, Mar. 2022. doi: 10.1142/S0219876221420111. [Google Scholar] [CrossRef]
16. Z. Sun, Y. Zhang, Y. Yuan, and H. A. Mang, “Stability analysis of a fire-loaded shallow tunnel by means of a thermo-hydro-chemo-mechanical model and discontinuity layout optimization,” Int. J. Numer. Anal. Methods Geomech., vol. 43, no. 16, pp. 2551–2564, Aug. 2019. doi: 10.1002/nag.2991. [Google Scholar] [CrossRef]
17. Y. Zhang, Z. Gao, X. Wang, and Q. Liu, “Image representations of numerical simulations for training neural networks,” Comput. Model. Eng. Sci., vol. 134, no. 2, pp. 821–833, Aug. 2023. doi: 10.32604/cmes.2022.022088. [Google Scholar] [CrossRef]
18. X. Zhao, H. Yu, and H. Bian, “Image to image translation based on differential image pix2pix model,” Comput. Mater. Contin., vol. 77, no. 1, pp. 181–198, Oct. 2023. doi: 10.32604/cmc.2023.041479. [Google Scholar] [CrossRef]
19. I. J. Goodfellow et al., “Generative adversarial nets,” in Proc. NIPS’14, Dec. 2014, pp. 2672–2680. [Google Scholar]
20. M. Mirza and S. Osindero, “Conditional generative adversarial nets,” arXiv preprint arXiv:1411.1784, Nov. 2014. [Google Scholar]
21. A. Radford, L. Metz, and S. Chintala, “Unsupervised representation learning with deep convolutional generative adversarial networks,” in Proc. ICLR, 2016. [Google Scholar]
22. J. Zhu, T. Park, P. Isola, and A. A. Efros, “Unpaired image-to-image translation using cycle-consistent adversarial networks,” in Proc. ICCV, Venice, Italy, 2017, pp. 2242–2251. [Google Scholar]
23. P. Isola, J. Zhu, T. Zhou, and A. Efros, “Image-to-image translation with conditional adversarial networks,” in Proc. CVPR, Honolulu, HI, USA, 2017, pp. 5967–5976. [Google Scholar]
24. Z. Zheng, P. Zhao, and X. Zhao, “Virtual restoration of the colored paintings on weathered beams in the forbidden city using multiple deep learning algorithms,” Adv. Eng. Inform., vol. 50, no. 1, pp. 101421, Dec. 2021. doi: 10.1016/j.aei.2021.101421. [Google Scholar] [CrossRef]
25. C. Zhao, J. Yang, and J. Li, “Generation of hospital emergency department layouts based on generative adversarial networks,” J. Build. Eng., vol. 43, no. 1, pp. 102539, Nov. 2021. doi: 10.1016/j.jobe.2021.102539. [Google Scholar] [CrossRef]
26. Q. Liu, H. Zhao, Y. Wang, F. Zhang, M. Ramasamy and Z. Qiao, “Sketch to portrait generation with generative adversarial networks and edge constraint,” Comput. Electr. Eng., vol. 95, no. 7, pp. 107338, Oct. 2021. doi: 10.1016/j.compeleceng.2021.107338. [Google Scholar] [CrossRef]
27. S. Kim, J. Lee, K. Jeong, J. Lee, T. Hong and J. An, “Automated door placement in architectural plans through combined deep-learning networks of ResNet-50 and Pix2Pix-GAN,” Expert. Syst. Appl., vol. 244, no. 21, pp. 122932, 2024. doi: 10.1016/j.eswa.2023.122932. [Google Scholar] [CrossRef]
28. W. Song, H. Wang, X. Zhang, J. Xia, T. Liu and Y. Shi, “Deep-sea nodule mineral image segmentation algorithm based on pix2pixhd,” Comput. Mater. Contin., vol. 73, no. 1, pp. 1449–1462, May. 2022. doi: 10.32604/cmc.2022.027213. [Google Scholar] [CrossRef]
29. O. Ronneberger, P. Fischer, and T. Brox, “U-Net: Convolutional networks for biomedical image segmentation,” in Proc. MICCAI, 2015, pp. 234–241. [Google Scholar]
30. D. Gawin, F. Pesavento, and B. Schrefler, “Hygro-thermo-chemo-mechanical modelling of concrete at early ages and beyond. Part I: Hydration and hygro-thermal phenomena,” Int. J. Numer. Methods Eng., vol. 67, pp. 299–331, Jan. 2006. doi: 10.1002/nme.1615. [Google Scholar] [CrossRef]
Appendix
Control Equations of the Coupled THC Model
Heated concrete generally experiences thermal deformation, performance degradation and energy and material transfer processes, which can be comprehendsively analyzed through thermo-mechanical coupling (TM) and THC coupling models. For tunnel linings, THC model is necessary and sufficient. Herein, we show the control equations of the coupled THC model to indicate their complexity, the denotations of the symbols and the detailed deductions can be found in [5,15]. The control equations are built by mass and energy conservation with capillary pressure
Mass-balance equation for the water phase:
Mass-balance equation for the dry-air phase:
Energy-balance equation:
in which
In Eqs. (10)–(13), the definitions of the symbols can be found in [30].
The input parameters of the THC model involve material properties and fire loadings. As shown in Table S1, we use grayscale images to represent 15 calculation parameters. The specific meaning and range of the parameters can be found in our works [9]. It is worth noting that since explosive spalling mostly occurs within 10 to 30 mins after the fire, only the temperature of heat source
Cite This Article
 Copyright © 2024 The Author(s). Published by Tech Science Press.
This work is licensed under a Creative Commons Attribution 4.0 International License , which permits unrestricted use, distribution, and reproduction in any medium, provided the original work is properly cited.
 Downloads
 Citation Tools