
 Submit a Paper
 Propose a Special lssue
 Open Access
ARTICLE

SCIRD: Revealing Infection of Malicious Software in Edge Computing-Enabled IoT Networks
School of Information Engineering, Huzhou University, Huzhou, 313000, China
* Corresponding Author: Shigen Shen. Email:
Computers, Materials & Continua 2024, 79(2), 2743-2769. https://doi.org/10.32604/cmc.2024.049985
Received 24 January 2024; Accepted 08 April 2024; Issue published 15 May 2024
 View Full Text
 Download PDF
Abstract
The Internet of Things (IoT) has characteristics such as node mobility, node heterogeneity, link heterogeneity, and topology heterogeneity. In the face of the IoT characteristics and the explosive growth of IoT nodes, which brings about large-scale data processing requirements, edge computing architecture has become an emerging network architecture to support IoT applications due to its ability to provide powerful computing capabilities and good service functions. However, the defense mechanism of Edge Computing-enabled IoT Nodes (ECIoTNs) is still weak due to their limited resources, so that they are susceptible to malicious software spread, which can compromise data confidentiality and network service availability. Facing this situation, we put forward an epidemiology-based susceptible-curb-infectious-removed-dead (SCIRD) model. Then, we analyze the dynamics of ECIoTNs with different infection levels under different initial conditions to obtain the dynamic differential equations. Additionally, we establish the presence of equilibrium states in the SCIRD model. Furthermore, we conduct an analysis of the model’s stability and examine the conditions under which malicious software will either spread or disappear within Edge Computing-enabled IoT (ECIoT) networks. Lastly, we validate the efficacy and superiority of the SCIRD model through MATLAB simulations. These research findings offer a theoretical foundation for suppressing the propagation of malicious software in ECIoT networks. The experimental results indicate that the theoretical SCIRD model has instructive significance, deeply revealing the principles of malicious software propagation in ECIoT networks. This study solves a challenging security problem of ECIoT networks by determining the malicious software propagation threshold, which lays the foundation for building more secure and reliable ECIoT networks.Keywords
Internet of Things (IoT) networks have experienced rapid development in areas such as smart cities, smart health, and smart transportation. Such networks have characteristics such as node mobility, node heterogeneity, link heterogeneity, and topology diversity [1]. Facing these characteristics and the large data processing demands brought by the explosive growth of IoT nodes, edge computing has become an emerging network architecture that provides powerful computing capabilities and good service functions to support IoT applications [2–4]. In this manner, Edge Computing-enabled IoT (ECIoT) architecture brings computation, storage, and analytic capabilities closer to the data source, enabling real-time decision-making and reducing the latency of data transmission to cloud-based systems [5]. However, ECIoT nodes (ECIoTNs) with distributed and interconnected nature involve security vulnerabilities [6] introduced by malicious software such as Trojans, spyware, viruses, worms, rootkits, etc. Each type of malicious software has certain characteristics and infiltrates the ECIoT through different methods [7]. Incidents of significant losses caused by the spread of malicious software are not uncommon in society [8]. In November 2022, a new type of ransomware attacked the Australian insurance giant Medibank, which affected the personal information of 9.7 million customers, involving multiple sectors such as healthcare institutions and government departments [9]. The attackers typically spread malicious software to victims’ systems through email attachments or network vulnerabilities, and then demanded ransom to decrypt the infected files. The ransomware attack has caused significant financial losses and leads to data breaches and system paralysis. In the same year, the Bank of Zambia was hit by ransomware attacks, causing disruptions in some systems, threatening crucial financial data and impacting its normal operations and financial system stability, and resulting in certain negative effects on the country’s economy. These two attacks resulted in many organizations facing the risks of data loss, business disruptions, and substantial financial losses [10].
Recent research shows that malicious software in ECIoT is capable of spreading itself and has become a major factor affecting ECIoT security [11]. Once malicious software exploits vulnerabilities in ECIoTNs and spreads widely in the ECIoT, it can eavesdrop on ECIoTNs data and even cause ECIoTNs to completely lose their functionality by depleting their energy sources [12,13]. This seriously affects the availability, confidentiality, and stability of ECIoT services. Therefore, it is urgent to study the infection behavior and influencing factors of malicious software in ECIoT and provide methods for analyzing the stability of the infection model of malicious software in ECIoT [14].
The goal of the current work is to explore the spread rule of malicious software within ECIoTNs and propose strategies to prevent and inhibit its spread. It also proposes a malicious software infection model that integrates the expected probability of malicious software infection behavior by extending epidemic theory [15]. Subsequently, we study the stability of this model and finally obtain results that can reveal the infection mechanism of malicious software in ECIoT. By integrating insights from previous research, this study makes an effort to provide a comprehensive analysis of malicious software spreading dynamics in ECIoT networks and offer valuable insights for designing effective security countermeasures.
Here are our contributions:
(1) An epidemiology-based Susceptible-Curb-Infectious-Removed-Dead (SCIRD) model is proposed, which studies the characteristics of malicious software propagation in ECIoT networks by considering node heterogeneity, link heterogeneity, and topology structure heterogeneity. The model extends the Markov chain to study the state transition of ECIoTNs.
(2) The differential equations of the SCIRD model are derived, which represent the proportion dynamics of different compartments, namely
(3) Equilibrium states in the SCIRD model are demonstrated. Therefore, the conditions to determine whether malicious software will spread or die out in ECIoT networks can be obtained to guide the security mechanism defending malicious software propagation.
The key contributions of this paper are as follows. The application of the proposed SCIRD model can help researchers gain a deeper understanding of the propagation mechanism of malicious software in ECIoT networks, including characteristics such as propagation speed, range, and pathways, which will provide a more systematic and comprehensive perspective for the analysis, prediction, and formulation of strategies to combat malicious software propagation. Such a model can facilitate a better understanding and control of malicious software propagation behavior, contributing to enhancing security alertness and preventive capabilities of ECIoT networks. Moreover, our model can be extended to one considering different types of network topologies such as random, small-world, and scale-free networks to study the dynamics and patterns of malicious software propagation in different network structures.
The remaining sections of this paper are structured as follows. In Section 2, we examine the current state of research and put forth several issues that need to be addressed regarding the propagation of malicious software in ECIoT networks. In Section 3, we build a state graph for ECIoTNs infected by malicious software, taking into consideration the distinctive characteristics of current malicious software propagation, and propose the SCIRD model. Section 4 is dedicated to demonstrating equilibrium states of the SCIRD model, calculating the fundamental reproduction number, and affirming the model stability. Moving forward, in Section 5, we propose an algorithm using Matlab, and conduct experiments to validate the stability of equilibrium points. Finally, in Section 6, we provide a summary of the paper. Fig. 1 shows the paper workflow providing sufficient visual aids to guide readers through the various phases and steps of the work.
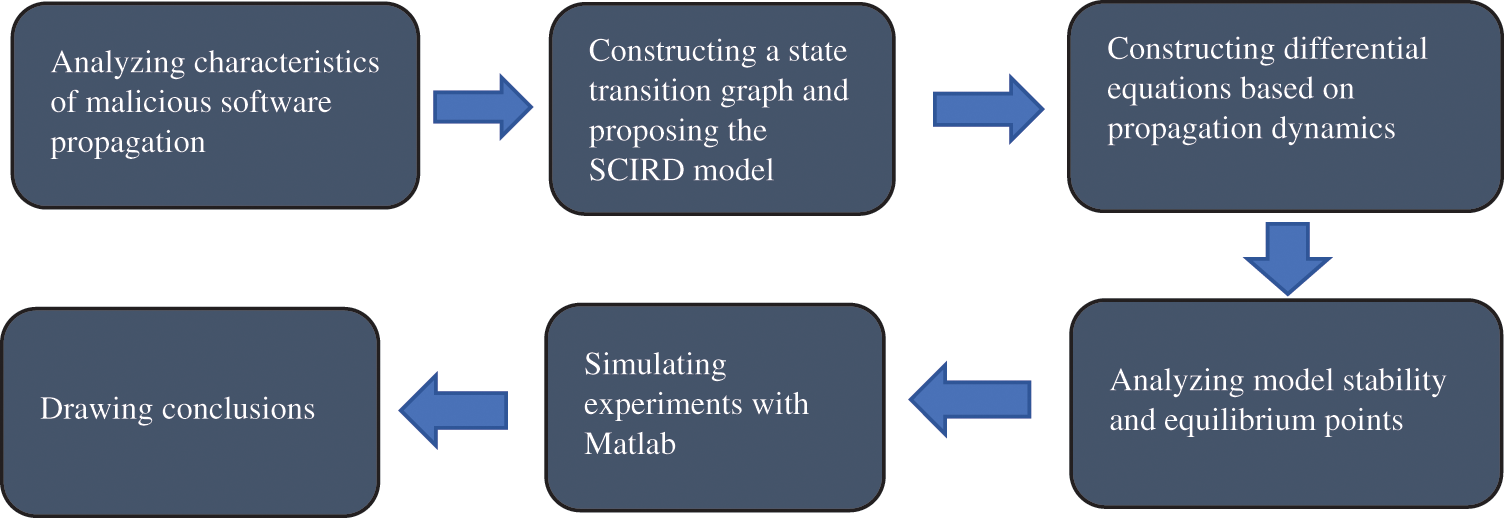
Figure 1: Paper workflow diagram
The propagation of malicious software in the context of ECIoT bears certain similarity to infectious diseases to some extent [16]. Common epidemic models are classified based on the type of infectious diseases, such as the Susceptible-Infectious (SI) [17] and Susceptible-Infectious-Susceptible (SIS) [18] models. They can also be categorized based on the transmission mechanisms, including Partial Differential Equations (PDEs), Ordinary Differential Equations (ODEs), and network dynamics. For examples, the model STSIR (Social Internet of Things Susceptible-Infectious-Removed) was proposed to illustrate malicious software propagation among IoT nodes considering people behavior [19], however, the application of the model may require adjustments and validation in specific scenarios. By adding the state E (exposed), an SEIR (Susceptible-Exposed-Infectious-Removed) model was proposed to analyze the interval of logging, the number of friends in the list, and the influence of the malicious software’s initial spreading rate [20], but the fixed immunity assumption in the SEIR model may not accurately describe factors in the propagation of malicious software.
Some researchers have studied the spread of malicious software from different perspectives. Guo et al. [21] put forward a method to represent the impact of different network structures on virus transmission using growth curves. Li et al. [22] began to study the impact model of information dissemination in mobile social networks from a multi-role perspective. Li et al. [23] used structural optimization to control information diffusion in social networks. Wang et al. [24] proposed a new data-driven approach, based on intuitive assumptions, to enhance the detection of zombie networks. They utilized honeypots to simulate zombie network attacks on medical devices and assets connected to the IoT with healthcare settings. In addition to the above models, others include models twin-SIR (twin Susceptible-Infectious-Removed) [25], SLBRS (Susceptible-Latent-Breaking-out-Recovered-Susceptible) [26], SEIRS-QV (Susceptible-Exposed-Infected-Recovered-Susceptible with Quarantine and Vaccination) [27], SEIQ-VS (Susceptible-Exposed-Infected-Quarantine with Vaccination-Susceptible) [28], and SIQR (Susceptible-Infected-Quarantine-Removed) [29]. Wherein, the twin-SIR model lacks of consideration for real-world factors such as changes of node behavior and network structure. The SLBRS model is indeed novel when proposed, but, due to considering multiple factors, its complexity increases, its interpretability decreases, and it requires higher requirements for actual data. Both the SEIRS-QV and SEIQ-VS models consider a wide range of influencing factors, but they both require accurate parameter estimation and extensive data support. The SIQR model neglects some complex propagation dynamics, such as latency and immune details.
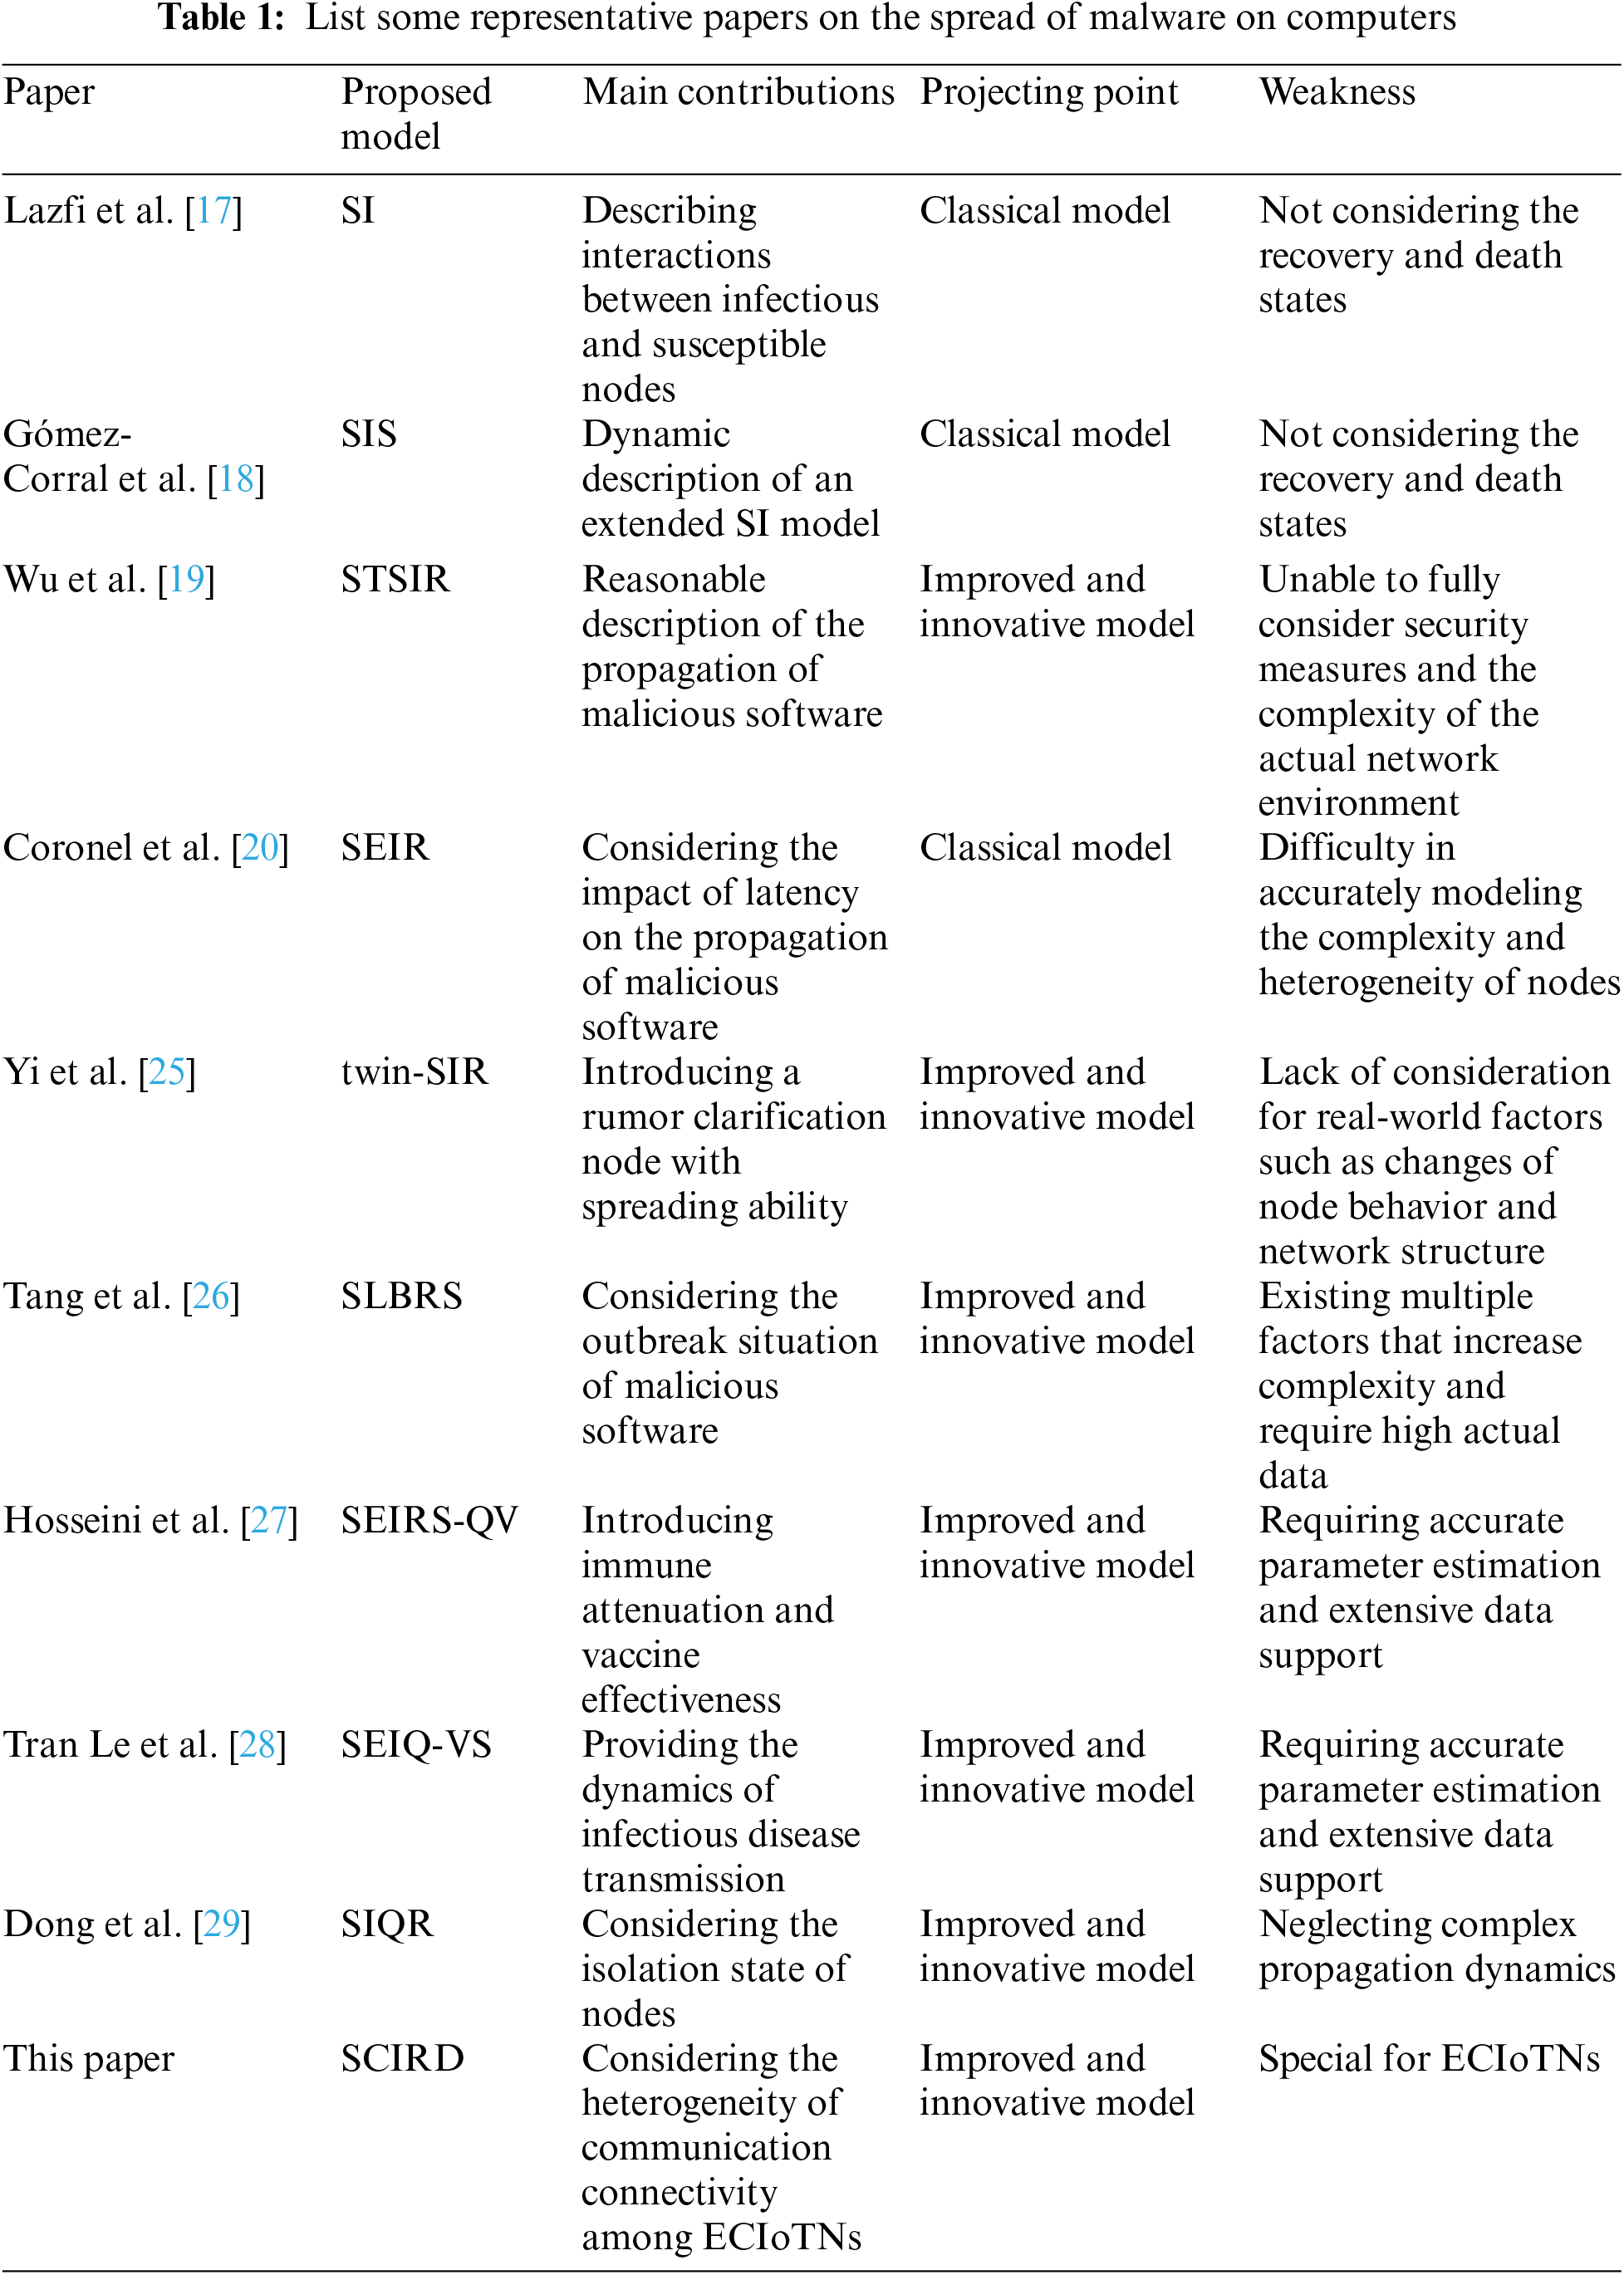
These models all add certain states to the original classical SIR (Susceptible-Infectious-Removed) or SI model, while considering the communication radius and node distribution density. Besides, worm viruses are also highly contagious in the IoT, so people have proposed various propagation models based on compartmental populations [30], specifically designed for heterogeneous and hierarchical networks incorporating human behaviors. At the same time, the dynamics of worm propagation in complex networks have been extensively modeled and studied, and it has been confirmed that the network topology has a significant impact on the worm propagation in such networks [31,32]. The researchers also proposed a propagation model for the defense of PLC-PC (Programmable Logic Controller-Personal Computer) worms in industrial networks [33]. In the meanwhile, Yang et al. presented a new VEIQS (Vaccination-Exposed-Infected-Quarantine-Susceptible) worm propagation model [34]. But the model typically assumes that propagation is unobstructed and does not take into account the impact of defensive measures. Table 1 summarizes some representative papers on the propagation of malicious software, and compares with our work to provide a brief overview for better understanding in terms of the model name, main contributions, projecting point, and weakness.
However, the above research still fails to address some problems related to the spread of ECIoT malicious software. One problem is how to describe the actual situation where an ECIoTN becomes ineffectual due to energy depletion, physical degradation, or malicious software attacks. The other problem is how to ascertain the conditions under which malicious software will spread or disappear in wireless hardware. Herein, considering the heterogeneity of communication connectivity among ECIoTNs, we address the first problem by adding two states, namely, the dead state and the suppressed state, to the traditional SIR model. Furthermore, we address the second problem by studying the equilibrium point stability of our non-homogeneous model and mathematically verifying the correctness of our theoretic results.
3 Designing a State Diagram for ECIoT with Malicious Software Infection
Viewed in terms of the network’s topology, we assume that the malicious software-infected ECIoT consists of M stationary ECIoTNs that are uniformly distributed across a two-dimensional region. Each ECIoTN is equipped with an omnidirectional antenna available for signal transmission. When an ECIoTN detects local data, it can forward this data to neighboring ECIoTNs located within its transmission range. These neighboring ECIoTNs then relay the data to their respective neighbors in an ongoing fashion.
Based on the characteristics of ECIoTNs, we develop a state diagram to represent the behavior of an ECIoTN within the malicious software-infected ECIoT. This can be analogized to an epidemiology-based model for malicious software propagation. In the state diagram, an ECIoTN is assigned to a single state that reflects its manner. We categorize an ECIoTN as state
As illustrated in Fig. 2, any ECIoTN within the network has the potential to undergo a state transition in reaction to external factors. This means that the current state of an ECIoTN can be altered due to external influences. When susceptible ECIoTNs become infected through the propagation of malicious software, not all nodes are necessarily affected, as a portion of nodes can successfully thwart the infection due to the presence of security software. This results in a transition of their state from
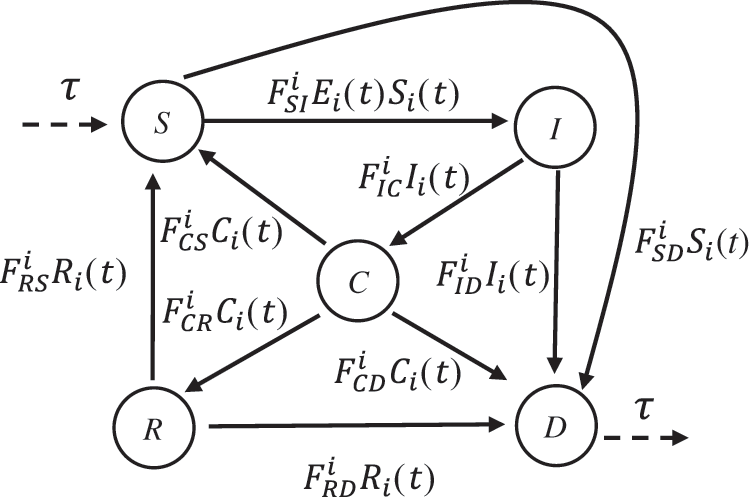
Figure 2: State diagram for an ECIoTN
We categorize the ECIoTNs based on their heterogeneous communication connectivity. Within the ECIoT, all ECIoTNs can be classified into L clusters, each characterized by the same degree of connectivity. For simplicity, we adopt a unified notation to represent both the cluster and its degree, where
where
Let
Here,
and
Various equations for the spread capability that may be borrowed to ECIoTNs have been presented. Representative examples contain (1)
Up to this point, we have established the dynamics of all states. At time t, an ECIoTN assigned to cluster
satisfying equations
4 Stability Analysis of the SCIRD Model for ECIoT with Malicious Software Infection
Our main focus is to determine the steady states of our SCIRD model for ECIoT with malicious software infection, enabling us to identify the critical thresholds at which malicious software will either spread or die out within the ECIoTNs.
Theorem 1. There exist steady states in the SCIRD model including Eqs. (8)–(13) for ECIoT with malicious software infection.
Proof. Once the SCIRD attains its steady states, the proportional changes in all state variables cease. This indicates that all differential Eqs. (8)–(12) equal to zero. Therefore we obtain
At the same time, we can define two steady states:
This completes the proof.
According to epidemiological theory, steady state
In summary, at steady state
4.2 Fundamental Reproduction Number
In order to explore dynamical characteristics of the proposed SCIRD model, our current focus is on determining the fundamental reproduction number denoted by
Subsequently, we proceed to calculate the fundamental reproduction number
and
We achieve
and
Then, we can obtain the fundamental reproduction number
4.3 Analysis of Equilibrium Point Stability
Now we will perform stability analysis on the equilibrium points in the model to investigate whether the model displays the characteristics of viral contagion. Assessing the stability of an equilibrium point involves determining whether the system’s key conditions associated with that point lead trajectories to converge towards it over time, indicating stability. Conversely, if an equilibrium point is deemed unstable, the trajectories will diverge away from it as time progresses.
The SCIRD model, which includes Eqs. (8)–(13) for malicious software-infected ECIoTNs, can be simplified to a set of differential equations containing Eqs. (8)–(11). Besides, Eq. (12) can be replaced by
Theorem 2. If
Proof. In accordance with the stability theory for ordinary differential equations, we begin by calculating Jacobian matrix
Furthermore, we compute the Jacobian matrix at the equilibrium point representing the absence of malicious software
Let
Therefore, we can obtain all the eigenvalues:
From the above formula derivation, we can deduce that
According to Theorem 2, when
Theorem 3. If
Proof. We rescript
As a matter of course,
It can be obtained in the same way that the eigenfunction of matrix
Clearly, it is infeasible to determine all the eigenvalues of matrix
Given a quartic polynomial expression, we can determine its positivity by inspecting the discriminant, denoted as
Through simulation, we attain that the discriminant
According to Theorem 3, when
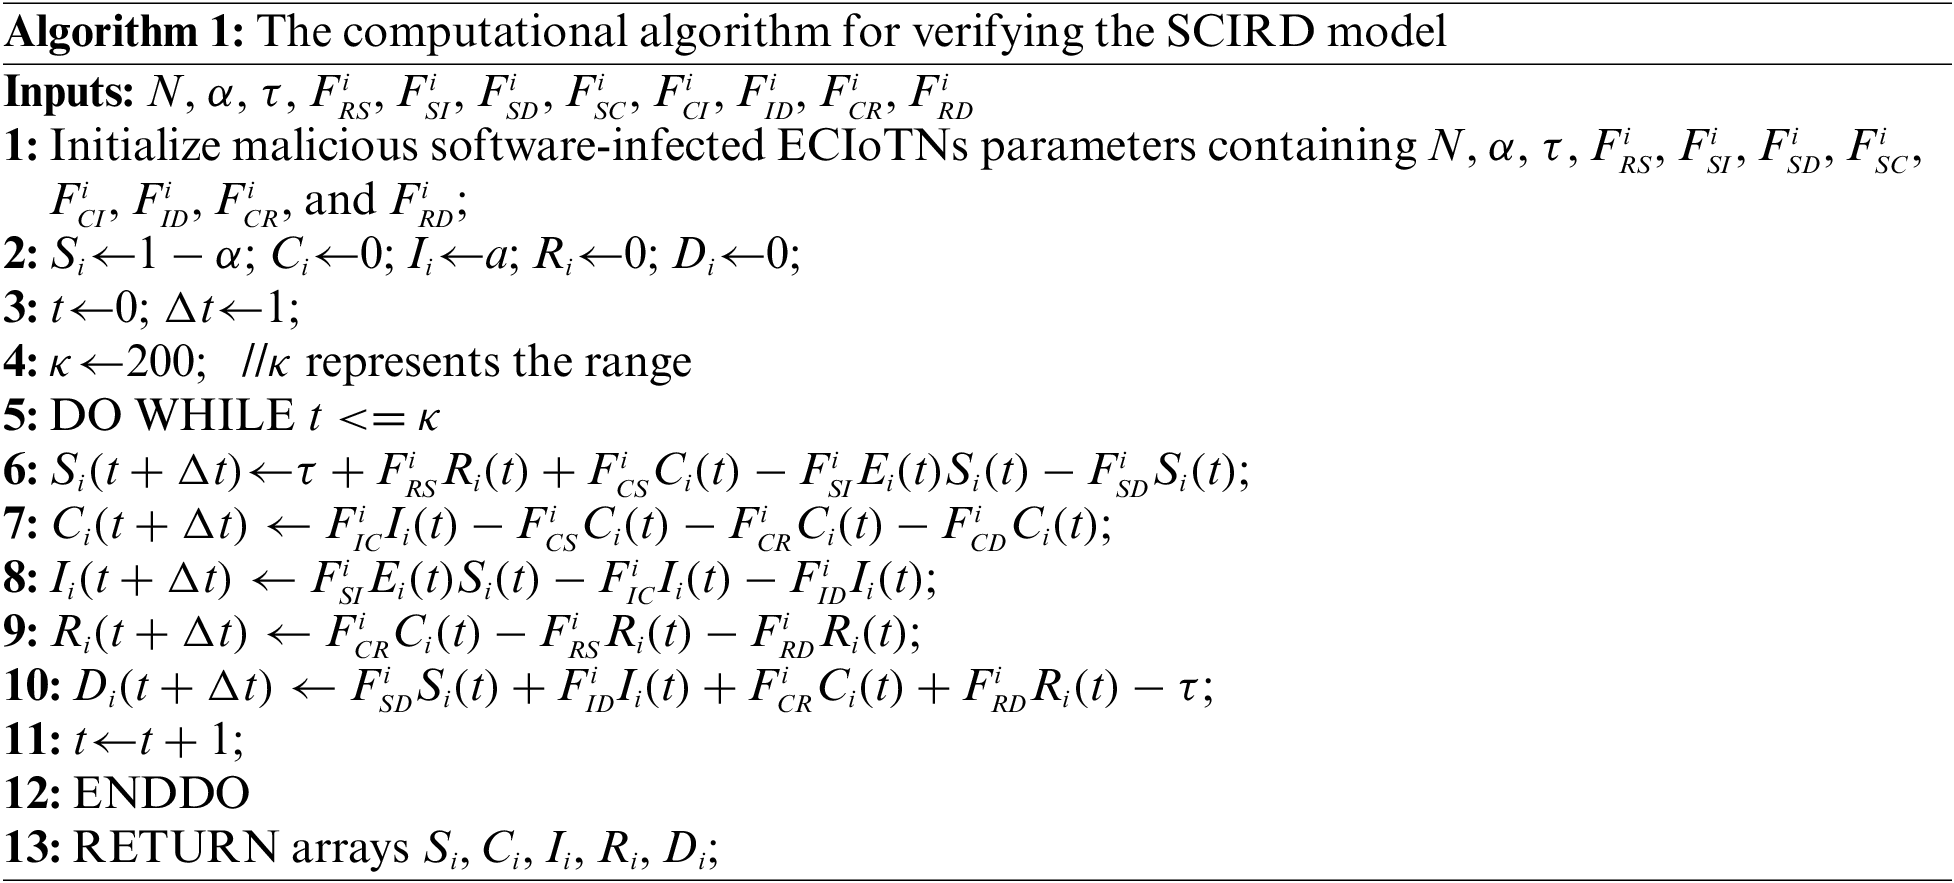
To confirm the SCIRD model for malicious software-infected ECIoTNs, we implemented the model using MATLAB R2022a. The computational algorithm, Algorithm 1, was utilized for this purpose.
In the simulation program of MATLAB, the ECIoT network consists of 1500 static ECIoTNs. The interval
5.1 Assessing Stability of the Equilibrium State in the Absence of Malicious Software
In this part, we verify the correctness of Theorem 2 by setting various infection capacities.
Here, the infection capacity
Fig. 3 describes the changing tendency of susceptible ECIoTNs under the circumstance of Theorem 2 for
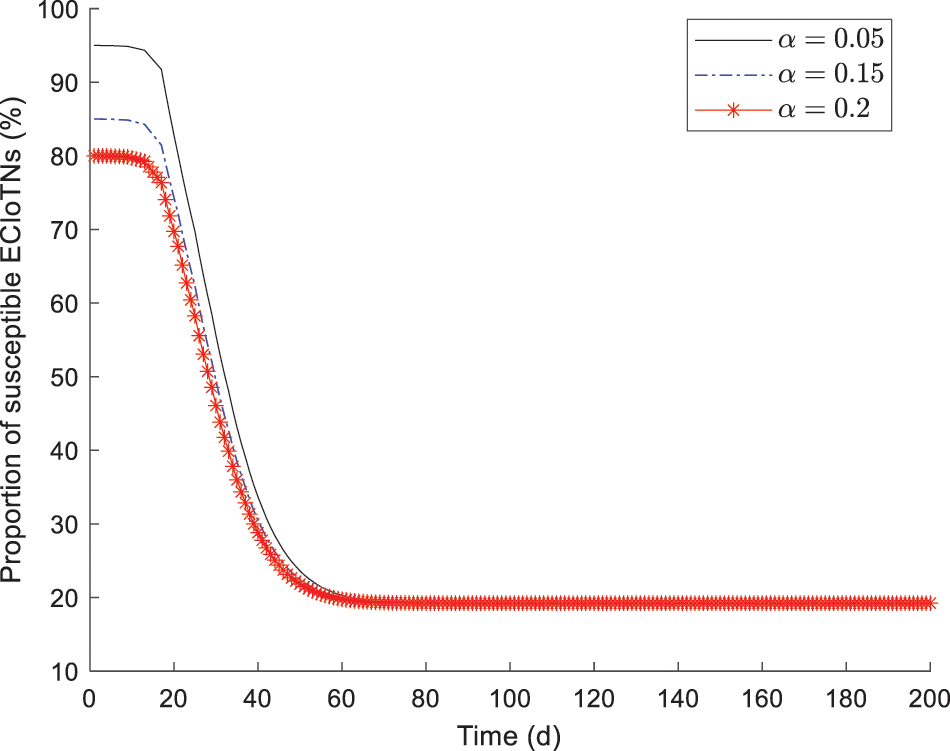
Figure 3: Changing tendency of susceptible ECIoTNs under the circumstance of Theorem 2 for
Figs. 4–7 depict the changing tendency of curb, infectious, removed, and dead ECIoTNs under the circumstance of Theorem 2 for

Figure 4: Changing tendency of curb ECIoTNs under the circumstance of Theorem 2 for
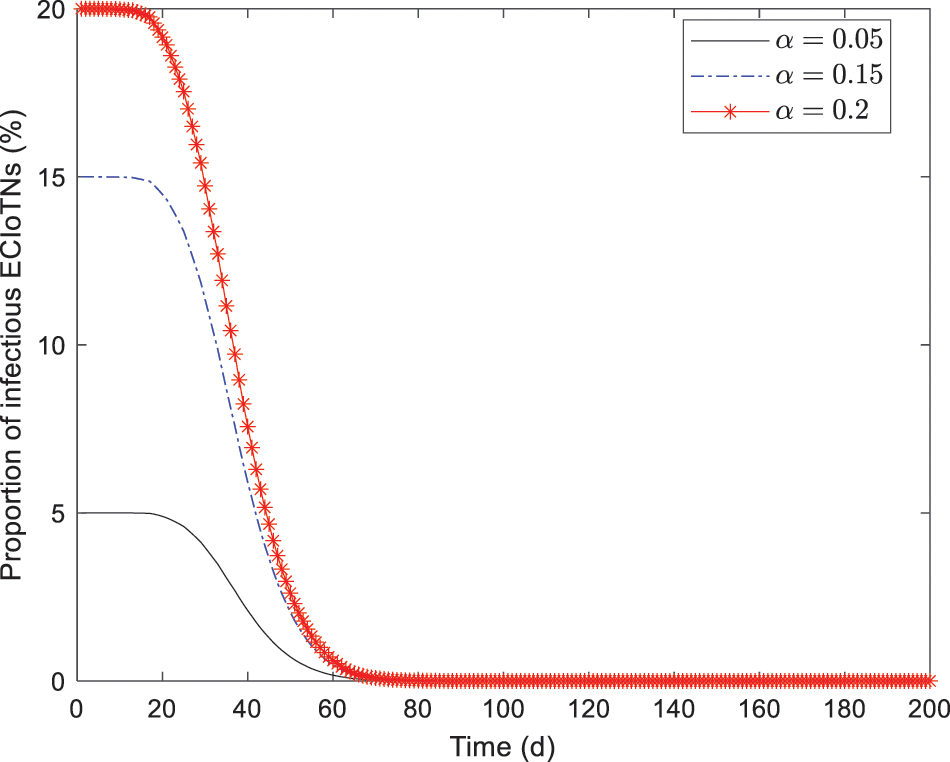
Figure 5: Changing tendency of infectious ECIoTNs under the circumstance of Theorem 2 for

Figure 6: Changing tendency of removed ECIoTNs under the circumstance of Theorem 2 for

Figure 7: Changing tendency of dead ECIoTNs under the circumstance of Theorem 2 for
Apart from the infectivity factor
In Figs. 8–12, while there are variations in the peak values of the curves, the proportions of susceptible, curb, removed, and dead ECIoTNs ultimately converge to
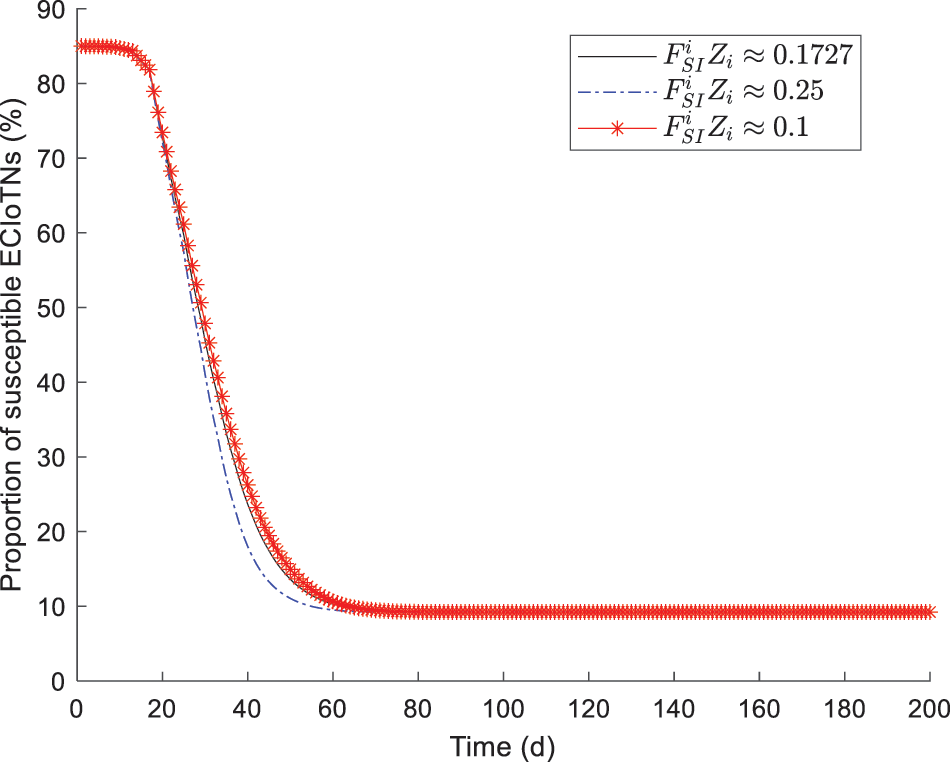
Figure 8: Changing tendency of susceptible ECIoTNs under the circumstance of Theorem 2 with diverse infection capabilities

Figure 9: Changing tendency of curb ECIoTNs under the circumstance of Theorem 2 with diverse infection capabilities

Figure 10: Changing tendency of infectious ECIoTNs under the circumstance of Theorem 2 with diverse infection capabilities

Figure 11: Changing tendency of removed ECIoTNs under the circumstance of Theorem 2 with diverse infection capabilities
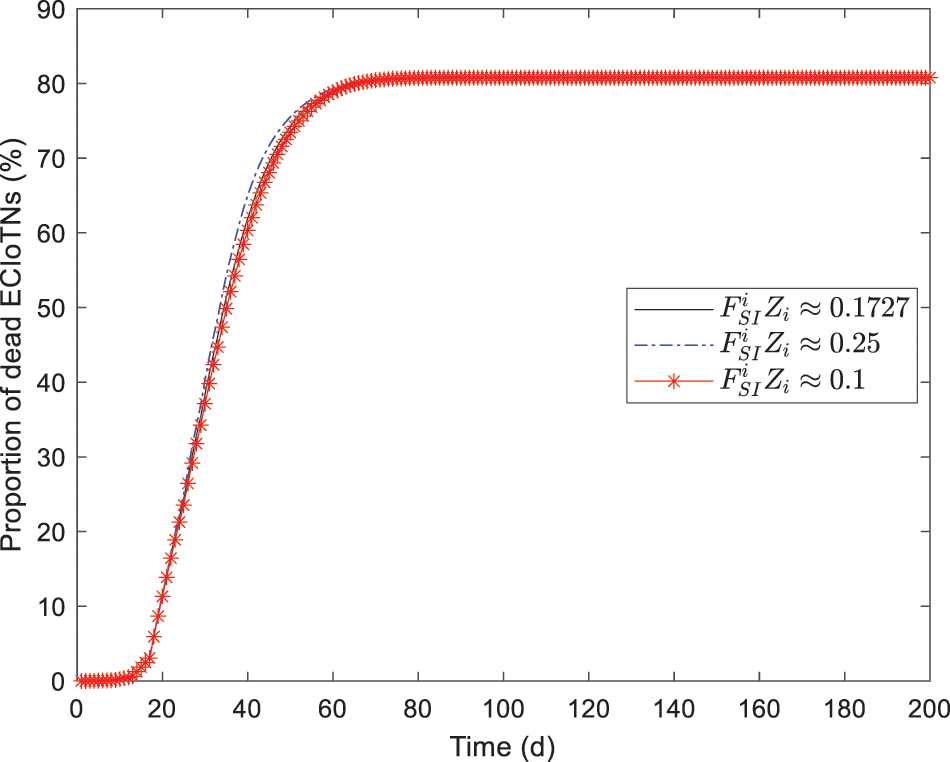
Figure 12: Changing tendency of dead ECIoTNs under the circumstance of Theorem 2 with diverse infection capabilities
By conducting experiments under the equal infection capacity as well as diverse infection capacity, we have successfully validated Theorem 2. These experiments offer compelling evidence that the malicious software residing in infected ECIoTNs will ultimately be eliminated.
When the conditions for Theorem 2 are satisfied, although malicious software infects a large number of ECIoTNs from the beginning, it is crucial to strive for the stable conditions of an equilibrium without malicious software. This phenomenon can be attributed to the stability of the system, which guarantees that the infected ECIoTNs will be cleared of malicious software, even in the presence of new outbreaks.
5.2 Confirming Stability of Endemic Equilibrium
In this case, we will employ a similar approach as in Section 5.1 to confirm the validity of Theorem 3, utilizing two distinct scenarios: equal infectivity and diverse infectivity.
During the verification process, all values except
Figs. 13–17 depict the the changing tendency of susceptible, curb, infectious, removed and dead ECIoTNs under the circumstance of Theorem 3 for
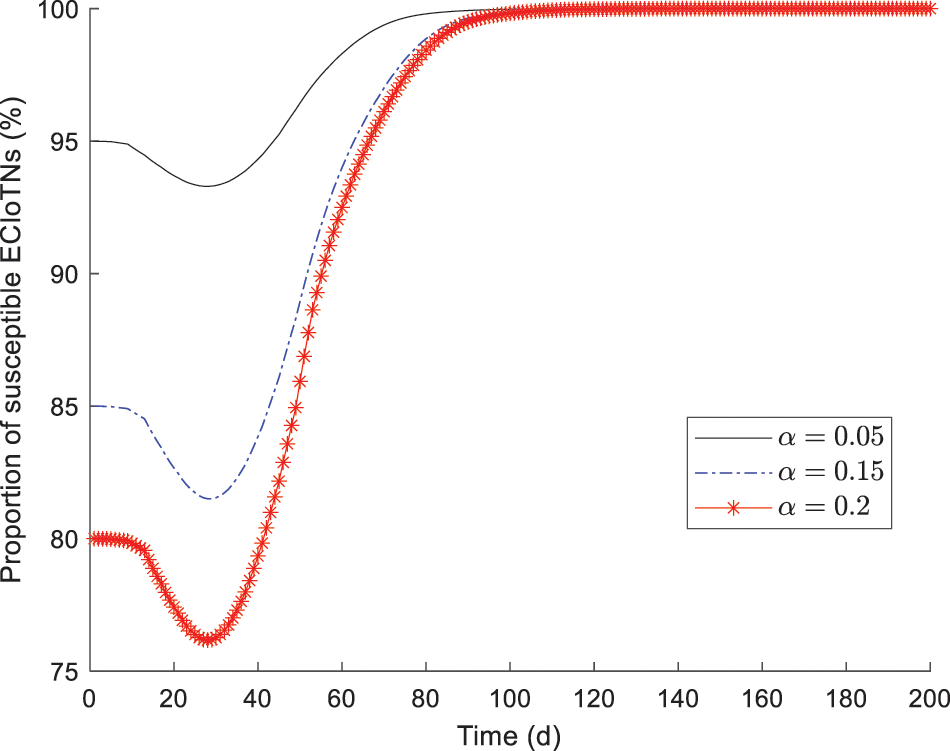
Figure 13: Changing tendency of susceptible ECIoTNs under the circumstance of Theorem 3 or

Figure 14: Changing tendency of curb ECIoTNs under the circumstance of Theorem 3 for or

Figure 15: Changing tendency of infectious ECIoTNs under the circumstance of Theorem 3 or

Figure 16: Changing tendency of removed ECIoTNs under the circumstance of Theorem 3 for
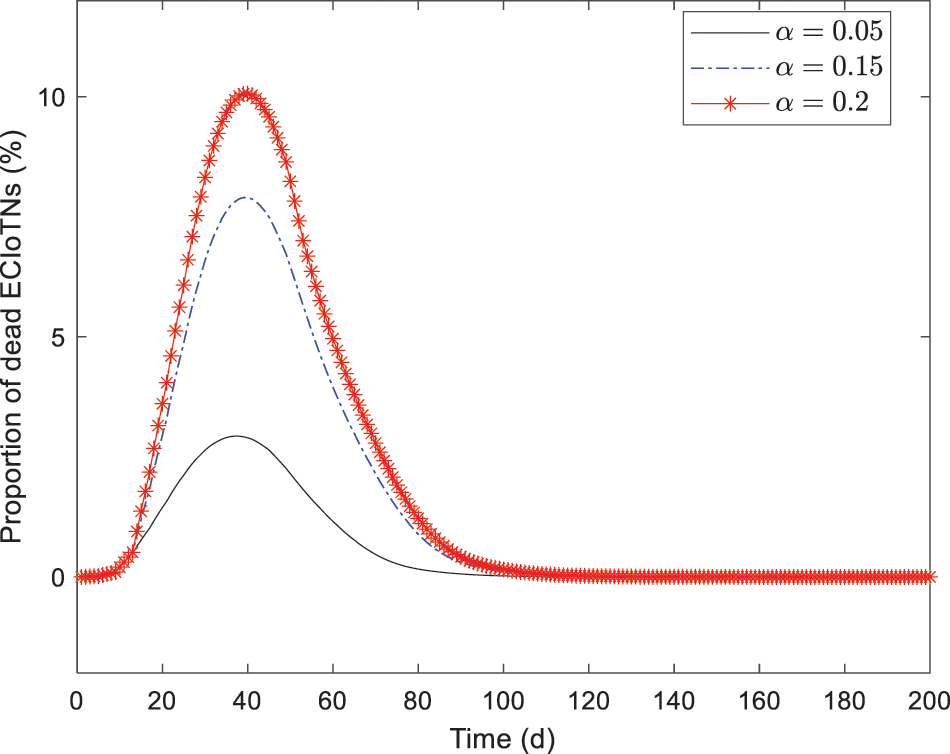
Figure 17: Changing tendency of dead ECIoTNs under the circumstance of Theorem 3 for
In Fig. 14, the proportion of curb ECIoTNs exhibits minor changes in the first
According to the simulation results, we obtain the conclusion that no matter what proportions of infected ECIoTN there are, the ECIoTN cluster
In this section, using the identical parameter values as those provided in Section 5.1.2, for
As depicted in Figs. 18–22, while there are variations in the peak values of the curves, the proportions of susceptible, curb, removed, and dead ECIoTNs ultimately converge to

Figure 18: Changing tendency of susceptible ECIoTNs under the circumstance of Theorem 3 with diverse infection capabilities
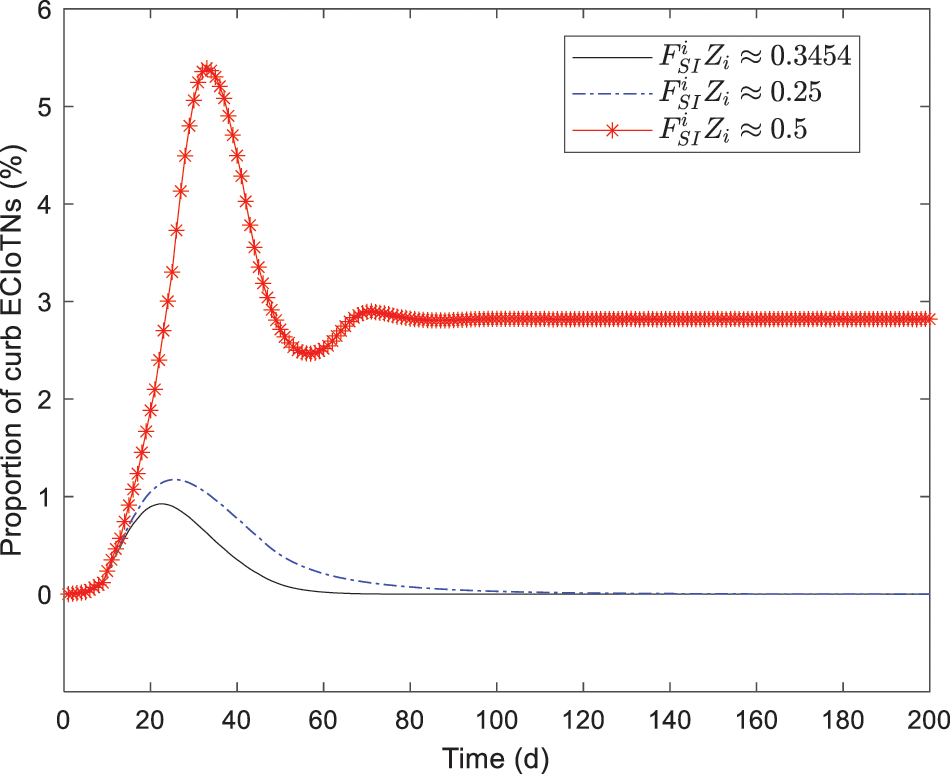
Figure 19: Changing tendency of curb ECIoTNs under the circumstance of Theorem 3 with diverse infection capabilities

Figure 20: Changing tendency of infectious ECIoTNs under the circumstance of Theorem 3 with diverse infection capabilities
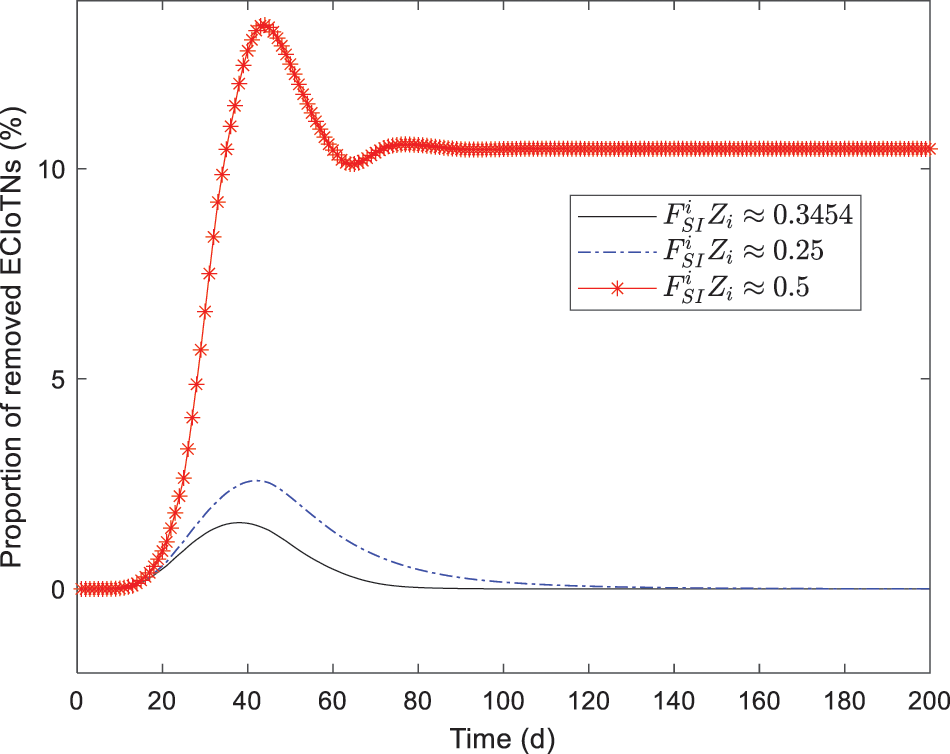
Figure 21: Changing tendency of removed ECIoTNs under the circumstance of Theorem 3 with diverse infection capabilities

Figure 22: Changing tendency of dead ECIoTNs under the circumstance of Theorem 3 with diverse infection capabilities
In the end, we have successfully verified that Theorem 3 possesses both homogeneous and heterogeneous infection capabilities. The results of simulation experiments indicate that when the conditions of Theorem 3 are met, the infected ECIoTNs will eventually stabilize at a consistent level. As a result, during the defense process of ECIoT, it is of utmost importance to prevent the fulfillment of the stability conditions of the local equilibrium., as these conditions greatly enhance the potential for malicious software propagation.
Drawing inspiration from epidemiology, we have proposed an SCIRD model that takes into account the heterogeneous nature of the ECIoTN ecosystem and the varying connectivity of ECIoTN communication. By formulating a system of differential equations, we have described the dynamics of different states and degrees of high-speed rail fractions. Based on computational and experimental analysis, we have successfully demonstrated the existence of two equilibrium points within the SCIRD model. One represents a state without any malicious software, where malicious software eventually dissipates within ECIoTNs, while the other represents a localized equilibrium where malicious software persists and continues to propagate. Using the next generation matrix approach, we have calculated the fundamental reproduction number that governs the stability of these equilibrium points. Through computations and simulation experiments, we have verified that by controlling ECIoTN parameters, we can achieve stable conditions for a malicious software-free equilibrium and prevent the occurrence of localized equilibria. In our future work, we will focus on further optimizing the IoT security model by integrating the SCIRD infectious disease model to better reflect security issues in actual systems. We may consider incorporating more factors and variables, such as user behavior, interactions between IoT devices, to enhance the accuracy and applicability of the model, and provide guidance for the security management of real systems. Besides, future research can focus on developing new security mechanisms and technologies to enhance the security of IoT systems. This includes technological innovations in areas such as security authentication, encrypted communication, and intrusion detection and response, to address the constantly evolving security threats.
Acknowledgement: The authors would like to express their gratitude for the valuable feedback and suggestions provided by all the anonymous reviewers and the editorial team.
Funding Statement: This work was supported in part by National Undergraduate Innovation and Entrepreneurship Training Program under Grant No. 202310347039, Zhejiang Provincial Natural Science Foundation of China under Grant No. LZ22F020002, and Huzhou Science and Technology Planning Foundation under Grant No. 2023GZ04.
Author Contributions: Study conception and design: J. Ye, S. Shen; Data collection: W. Cheng, W. Zhu; Analysis and interpretation of results: J. Ye, X. Liu; Draft manuscript preparation: J. Ye, X. Wu, S. Shen. All authors reviewed the results and approved the final version of the manuscript.
Availability of Data and Materials: Data available on request from the authors.
Conflicts of Interest: The authors declare that they have no conflicts of interest to report regarding the present study.
References
1. W. Lin et al., “A deep neural collaborative filtering based service recommendation method with multi-source data for smart cloud-edge collaboration applications,” Tsinghua Sci. Technol., vol. 29, no. 3, pp. 897–910, 2024. doi: 10.26599/TST.2023.9010050. [Google Scholar] [CrossRef]
2. G. Wu, X. Chen, Z. Gao, H. Zhang, S. Yu, and S. Shen, “Privacy-preserving offloading scheme in multi-access mobile edge computing based on MADRL,” J. Parallel Distr. Comput., vol. 183, pp. 104775, 2024. doi: 10.1016/j.jpdc.2023.104775. [Google Scholar] [CrossRef]
3. Y. Shen, S. Shen, Q. Li, H. Zhou, Z. Wu and Y. Qu, “Evolutionary privacy-preserving learning strategies for edge-based IoT data sharing schemes,” Digit. Commun. Netw., vol. 9, no. 4, pp. 906–919, 2023. doi: 10.1016/j.dcan.2022.05.004. [Google Scholar] [CrossRef]
4. J. Ai, Z. Guo, and H. Chen, “Thwarting worm spread in heterogeneous networks with diverse variant placement,” IEEE Commun. Lett., vol. 22, no. 7, pp. 1346–1349, 2018. doi: 10.1109/LCOMM.2018.2820072. [Google Scholar] [CrossRef]
5. G. Wu, Z. Xu, H. Zhang, S. Shen, and S. Yu, “Multi-agent DRL for joint completion delay and energy consumption with queuing theory in MEC-based IIoT,” J. Parallel Distr. Comput., vol. 176, pp. 80–94, 2023. doi: 10.1016/j.jpdc.2023.02.008. [Google Scholar] [CrossRef]
6. V. A. Memos, K. E. Psannis, and Z. Lv, “A secure network model against bot attacks in edge-enabled industrial Internet of Things,” IEEE Trans. Ind. Inform., vol. 18, no. 11, pp. 7998–8006, 2022. doi: 10.1109/TII.2022.3162837. [Google Scholar] [CrossRef]
7. M. S. Arif, A. Raza, W. Shatanawi, M. Rafiq, and M. Bibi, “A stochastic numerical analysis for computer virus model with vertical transmission over the Internet,” Comput. Mater. Contin., vol. 61, no. 3, pp. 1025–1043, 2019. doi: 10.32604/cmc.2019.08405. [Google Scholar] [CrossRef]
8. R. M. Carnier, Y. Li, Y. Fujimoto, and J. Shikata, “Exact Markov chain of random propagation of malware with network-level mitigation,” IEEE Internet Things J., vol. 10, no. 12, pp. 10933–10947, 2023. doi: 10.1109/JIOT.2023.3240421. [Google Scholar] [CrossRef]
9. T. Wang, H. Li, C. Xia, H. Zhang, and P. Zhang, “From the dialectical perspective: Modeling and exploiting of hybrid worm propagation,” IEEE Trans. Inf. Forensics Secur., vol. 18, pp. 1610–1624, 2023. doi: 10.1109/TIFS.2023.3246765. [Google Scholar] [CrossRef]
10. H. Ahn, J. Choi, and Y. H. Kim, “A mathematical modeling of Stuxnet-style autonomous vehicle malware,” IEEE Trans. Intell. Transp. Syst., vol. 24, no. 1, pp. 673–683, 2023. doi: 10.1109/TITS.2022.3213771. [Google Scholar] [CrossRef]
11. S. Shen, L. Xie, Y. Zhang, G. Wu, H. Zhang and S. Yu, “Joint differential game and double deep Q-networks for suppressing malware spread in Industrial Internet of Things,” IEEE Trans. Inf. Forensics Secur., vol. 18, pp. 5302–5315, 2023. doi: 10.1109/TIFS.2023.3307956. [Google Scholar] [CrossRef]
12. M. Al-Fawa'Reh, J. Abu-Khalaf, P. Szewczyk, and J. J. Kang, “MalBoT-DRL: Malware botnet detection using deep reinforcement learning in IoT networks,” IEEE Internet Things J., vol. 11, no. 6, pp. 9610–9629, 2024. doi: 10.1109/JIOT.2023.3324053. [Google Scholar] [CrossRef]
13. G. Wu, H. Wang, H. Zhang, Y. Zhao, S. Yu and S. Shen, “Computation offloading method using stochastic games for software-defined-network-based multiagent mobile edge computing,” IEEE Internet Things J., vol. 10, no. 20, pp. 17620–17634, 2023. doi: 10.1109/JIOT.2023.3277541. [Google Scholar] [CrossRef]
14. S. Shen, C. Cai, Z. Li, Y. Shen, G. Wu, and S. Yu, “Deep Q-network-based heuristic intrusion detection against edge-based SIoT zero-day attacks,” Appl. Soft Comput., vol. 150, pp. 111080, 2024. doi: 10.1016/j.asoc.2023.111080. [Google Scholar] [CrossRef]
15. M. N. Aman, U. Javaid, and B. Sikdar, “IoT-Proctor: A secure and lightweight device patching framework for mitigating malware spread in IoT networks,” IEEE Syst. J., vol. 16, no. 3, pp. 3468–3479, 2022. doi: 10.1109/JSYST.2021.3070404. [Google Scholar] [CrossRef]
16. J. Chen, S. Sun, C. Xia, D. Shi, and G. Chen, “Modeling and analyzing malware propagation over wireless networks based on hypergraphs,” IEEE Trans. Netw. Sci. Eng., vol. 10, no. 6, pp. 3767–3778, 2023. doi: 10.1109/TNSE.2023.3273184. [Google Scholar] [CrossRef]
17. S. Lazfi, S. Lamzabi, A. Rachadi, and H. Ez-Zahraouy, “The impact of neighboring infection on the computer virus spread in packets on scale-free networks,” Int. J. Mod. Phys. B, vol. 31, no. 30, pp. 1750228, 2017. doi: 10.1142/S0217979217502289. [Google Scholar] [CrossRef]
18. A. Gómez-Corral, F. Palacios-Rodríguez, and M. T. Rodríguez-Bernal, “On the exact reproduction number in SIS epidemic models with vertical transmission,” Comput. Appl. Math., vol. 42, pp. 291, 2023. doi: 10.1007/s40314-023-02424-5. [Google Scholar] [CrossRef]
19. G. Wu, L. Xie, H. Zhang, J. Wang, S. Shen and S. Yu, “STSIR: An individual-group game-based model for disclosing virus spread in Social Internet of Things,” J. Netw. Comput. Appl., vol. 214, pp. 103608, 2023. doi: 10.1016/j.jnca.2023.103608. [Google Scholar] [CrossRef]
20. A. Coronel, F. Huancas, I. Hess, E. Lozada, and F. Novoa-Muñoz, “Analysis of a SEIR-KS mathematical model for computer virus propagation in a periodic environment,” Mathematics, vol. 8, no. 5, pp. 761, 2020. doi: 10.3390/math8050761. [Google Scholar] [CrossRef]
21. H. Guo, H. K. Cheng, and K. Kelley, “Impact of network structure on malware propagation: A growth curve perspective,” J. Manag. Inf. Syst., vol. 33, no. 1, pp. 296–325, 2016. doi: 10.1080/07421222.2016.1172440. [Google Scholar] [CrossRef]
22. J. Li, F. Li, W. Wang, and J. Zhai, “An information dissemination influence model for mobile social network under multi-role view,” Int. J. Uncertain. Fuzz. Knowl.-Based Syst., vol. 29, no. 1, pp. 1–15, 2021. doi: 10.1142/S021848852150001X. [Google Scholar] [CrossRef]
23. S. Li, B. Wang, S. Qian, Y. Sun, X. Yun and Y. Zhou, “Influence maximization for emergency information diffusion in social internet of vehicles,” IEEE Trans. Veh. Technol., vol. 71, no. 8, pp. 8768–8782, 2022. doi: 10.1109/TVT.2022.3146260. [Google Scholar] [CrossRef]
24. H. Wang, H. He, W. Zhang, W. Liu, P. Liu and A. Javadpour, “Using honeypots to model botnet attacks on the internet of medical things,” Comput. Electr. Eng., vol. 102, pp. 108212, 2022. doi: 10.1016/j.compeleceng.2022.108212. [Google Scholar] [PubMed] [CrossRef]
25. J. Yi, P. Liu, Z. Wang, and W. Liu, “Research on twin-SIR rumor spreading model in online social network,” J. Intell. Fuzz. Syst., vol. 40, no. 4, pp. 5863–5874, 2021. doi: 10.3233/JIFS-189426. [Google Scholar] [CrossRef]
26. W. Tang, Y. Liu, Y. Chen, Y. Yang, and X. Niu, “SLBRS: Network virus propagation model based on safety entropy,” Appl. Soft Comput., vol. 97, pp. 106784, 2020. doi: 10.1016/j.asoc.2020.106784. [Google Scholar] [CrossRef]
27. S. Hosseini and M. A. Azgomi, “The dynamics of an SEIRS-QV malware propagation model in heterogeneous networks,” Physica A: Stat. Mech. App., vol. 512, pp. 803–817, 2018. doi: 10.1016/j.physa.2018.08.081. [Google Scholar] [CrossRef]
28. D. Tran Le, T. T. Tran, K. Q. Dang, R. Alkanhel, and A. Muthanna, “Malware spreading model for routers in Wi-Fi networks,” IEEE Access, vol. 10, pp. 61873–61891, 2022. doi: 10.1109/ACCESS.2022.3182243. [Google Scholar] [CrossRef]
29. N. P. Dong, H. V. Long, and N. L. Giang, “The fuzzy fractional SIQR model of computer virus propagation in wireless sensor network using Caputo Atangana-Baleanu derivatives,” Fuzzy Sets Syst., vol. 429, pp. 28–59, 2022. doi: 10.1016/j.fss.2021.04.012. [Google Scholar] [CrossRef]
30. T. Wang, C. Xia, X. Li, and Y. Xiang, “Epidemic heterogeneity and hierarchy: A study of wireless hybrid worm propagation,” IEEE Trans. Mob. Comput., vol. 21, no. 5, pp. 1639–1656, 2022. doi: 10.1109/TMC.2020.3026342. [Google Scholar] [CrossRef]
31. J. Dou, G. Xie, Z. Tian, L. Cui, and S. Yu, “Modeling and analyzing the spatial-temporal propagation of malware in mobile wearable IoT networks,” IEEE Internet Things J., vol. 11, no. 2, pp. 2438–2452, 2024. doi: 10.1109/JIOT.2023.3295016. [Google Scholar] [CrossRef]
32. C. Gan, Y. Qian, A. Liu, and Q. Zhu, “Search-driven virus spreading on Social Internet of Things: A dynamical perspective,” Commun. Nonlinear Sci. Numer. Simul., vol. 114, pp. 106624, 2022. doi: 10.1016/j.cnsns.2022.106624. [Google Scholar] [CrossRef]
33. Y. Yao, C. Sheng, Q. Fu, H. Liu, and D. Wang, “A propagation model with defensive measures for PLC-PC worms in industrial networks,” Appl. Math. Model., vol. 69, pp. 696–713, 2019. doi: 10.1016/j.apm.2019.01.014. [Google Scholar] [CrossRef]
34. F. Yang, Z. Zhang, and A. Zeb, “Hopf bifurcation of a VEIQS worm propagation model in mobile networks with two delays,” Alex. Eng. J., vol. 60, no. 6, pp. 5105–5114, 2021. doi: 10.1016/j.aej.2021.03.055. [Google Scholar] [CrossRef]
35. K. Wang, Y. Gong, and F. Hu, “SIS epidemic propagation on scale-free hypernetwork,” Appl. Sci., vol. 12, no. 21, pp. 10934, 2022. doi: 10.3390/app122110934. [Google Scholar] [CrossRef]
36. Y. Xie and Z. Wang, “Transmission dynamics, global stability and control strategies of a modified SIS epidemic model on complex networks with an infective medium,” Math. Comput. Simul., vol. 188, pp. 23–34, 2021. doi: 10.1016/j.matcom.2021.03.029. [Google Scholar] [CrossRef]
37. X. Liu, D. He, and C. Liu, “Information diffusion nonlinear dynamics modeling and evolution analysis in online social network based on emergency events,” IEEE Trans. Comput. Soc. Syst., vol. 6, no. 1, pp. 8–19, 2019. doi: 10.1109/TCSS.2018.2885127. [Google Scholar] [CrossRef]
38. E. Zhang, G. Wang, Y. Feng, and R. Ma, “Mathematical analysis and design of PMTD strategies for an SIRO model of OS virus propagation,” Comput. Commun., vol. 192, pp. 332–342, 2022. doi: 10.1016/j.comcom.2022.06.006. [Google Scholar] [CrossRef]
39. D. Bartl, M. Fabian, and J. Kolář, “Clarke Jacobians, Bouligand Jacobians, and compact connected sets of matrices,” J. Math. Anal. Appl., vol. 516, no. 1, pp. 126491, 2022. doi: 10.1016/j.jmaa.2022.126491. [Google Scholar] [CrossRef]
40. S. Özgür and M. Orman, “Application of deep learning technique in next generation sequence experiments,” J. Big Data, vol. 10, pp. 160, 2023. doi: 10.1186/s40537-023-00838-w. [Google Scholar] [CrossRef]
41. C. Li, C. Tsai, and S. Yang, “Analysis of epidemic spreading of an SIRS model in complex heterogeneous networks,” Commun. Nonlinear Sci. Numer. Simul., vol. 19, no. 4, pp. 1042–1054, 2014. doi: 10.1016/j.cnsns.2013.08.033. [Google Scholar] [CrossRef]
Cite This Article
 Copyright © 2024 The Author(s). Published by Tech Science Press.
This work is licensed under a Creative Commons Attribution 4.0 International License , which permits unrestricted use, distribution, and reproduction in any medium, provided the original work is properly cited.
 Downloads
 Citation Tools