
 Submit a Paper
 Propose a Special lssue
 Open Access
ARTICLE

Optimizing Optical Fiber Faults Detection: A Comparative Analysis of Advanced Machine Learning Approaches
1 School of Electronics Engineering, Beijing University of Posts and Telecommunications, Beijing, 100876, China
2 State Key Laboratory of Integrated Services Networks, Xidian University, Xi’an, 710071, China
3 State Key Laboratory of Networking and Switching Technology, Beijing University of Posts and Telecommunications, Beijing, 100876, China
* Corresponding Author: Yuanxiang Chen. Email:
(This article belongs to the Special Issue: Advanced Artificial Intelligence and Machine Learning Frameworks for Signal and Image Processing Applications)
Computers, Materials & Continua 2024, 79(2), 2697-2721. https://doi.org/10.32604/cmc.2024.049607
Received 12 January 2024; Accepted 28 March 2024; Issue published 15 May 2024
 View Full Text
 Download PDF
Abstract
Efficient optical network management poses significant importance in backhaul and access network communication for preventing service disruptions and ensuring Quality of Service (QoS) satisfaction. The emerging faults in optical networks introduce challenges that can jeopardize the network with a variety of faults. The existing literature witnessed various partial or inadequate solutions. On the other hand, Machine Learning (ML) has revolutionized as a promising technique for fault detection and prevention. Unlike traditional fault management systems, this research has three-fold contributions. First, this research leverages the ML and Deep Learning (DL) multi-classification system and evaluates their accuracy in detecting six distinct fault types, including fiber cut, fiber eavesdropping, splicing, bad connector, bending, and PC connector. Secondly, this paper assesses the classification delay of each classification algorithm. Finally, this work proposes a fiber optics fault prevention algorithm that determines to mitigate the faults accordingly. This work utilized a publicly available fiber optics dataset named OTDR_Data and applied different ML classifiers, such as Gaussian Naive Bayes (GNB), Logistic Regression (LR), Support Vector Machine (SVM), K-Nearest Neighbor (KNN), Random Forest (RF), and Decision Tree (DT). Moreover, Ensemble Learning (EL) techniques are applied to evaluate the accuracy of various classifiers. In addition, this work evaluated the performance of DL-based Convolutional Neural Network and Long-Short Term Memory (CNN-LSTM) hybrid classifier. The findings reveal that the CNN-LSTM hybrid technique achieved the highest accuracy of 99% with a delay of 360 s. On the other hand, EL techniques improved the accuracy in detecting fiber optic faults. Thus, this research comprehensively assesses accuracy and delay metrics for various classifiers and proposes the most efficient attack detection system in fiber optics.Keywords
The optical fiber communication system is envisioned as the backbone of modern telecommunication systems that is the most reliable and secure, with high data transfer and low latency at a longer distance [1]. The existing fiber optics fulfill the increasing network demands, including 5G, Internet of Things (IoT), 4K and 8K video streaming services, Virtual Reality (VR), and Augmented Reality (AR) content and applications. According to the recent forecast by CISCO, 66% of the human population will have internet access in the future [2]. In such situations, the fiber optics network must ensure the Quality of Service (QoS) and provide uninterrupted connectivity worldwide. Despite many promising features of the fiber optics network, it is highly vulnerable to a variety of failures [3], including fiber cut [4], fiber eavesdropping [5], splicing, bad connector [6], fiber bending, and Physical Contact (PC) connector [7]. These faults can lead to diminished data transfer rates and increased latency, directly impacting the end-user experience [8]. Fig. 1 depicts the major fiber optics faults.

Figure 1: Fiber optics faults
In order to cope with these faults, existing literature proposed various techniques such as Optical Power Meter (OPM) and Optical Spectrum Analyzer (OSA) [9], Fiber Bragg Grating (FBG), Mach−Zehnder Interferometry (MZI) [10], Optical Frequency Field Reflection (OFDR) [11], Photon Counting Optical Time Domain Reflectometers (v-OTDR) [12] and Optical Time Domain Reflectometers (OTDR). Furthermore, authors in [13,14] used FBG for fault detection and Wavelength Division Multiplexing (WDM) to identify faulty fiber branches in Passive Optical Networks (PON). Among the techniques mentioned above, the OTDR is a widely adopted method for identifying and localizing faults in fiber optics. It uses the time and intensity of light backscattered from the fiber optics. However, the detection efficiency of traditional techniques is hindered by the noise present in backscattered OTDR signals.
On the other hand, Artificial Intelligence (AI) has an enormous contribution to predicting the anomalies in various domains such as healthcare [15], IoT [16], Vehicular Networks (VANETs) [17], Power monitor systems [18], E-Commerce and so on. More specifically to existing research, Machine Learning (ML) and Deep Learning (DL) techniques are significantly used in optical communication systems, such as the Linear Regression (LR) algorithm applied for signal amplification [19]. Similarly, Principle Component Analysis (PCA) and Support Vector Machine (SVM) are utilized for modulation reorganization and data rate [20]. Furthermore, Random Forest (RF) and Decision Tree (DT) are used for classifying the probability of Bit Error Rate (BER) to ensure the QoS threshold [21]. Deep Neural Networks (DNN) are also employed for multiple purposes in optical communications, such as monitoring and predicting the Optical Signal to Noise Ratio (OSNR), modulation schemes, and so forth [22,23]. Similarly, fault detection and localization based on ML techniques are developed. For instance, soft failure-based detection and identification of fiber optics are monitored by continuous observation of BER using SVM, Neural Networks (NN), and RF techniques [24]. Furthermore, the Single-Layer Perceptron Neural Networks (SLP NN) technique was developed on simple LR to predict the location of the fiber cut in underground cable [25]. Other techniques, including Autoencoder (AE) and Bidirectional Gated Recurrent Unit (BiGRU) algorithms for anomaly detection [3], are incorporated in fiber optics.
However, the above-mentioned works used limited ML/DL techniques for fault detection and localization. Different from those works, this research evaluates six major faults using various advanced ML and DL classification techniques. The proposed study detects the faults and enables the users to identify the attack type accurately. The contribution of this research can be summarized as follows:
• The proposed research exploited six major faults in fiber optics using a multiclassification system to determine the fault types accurately.
• This work evaluated and compared the accuracy of six ML classifiers, Gaussian Naive Bayes (GNB), LR, SVM, K-Nearest Neighbor (KNN), RF, and DT, and a hybrid DL classifier, Convolutional Neural Network and Long-Short Term Memory (CNN-LSTM) to detect the fiber optics faults.
• This research applied various EL techniques to combine the ML models and evaluate their performance for enhancing fault detection accuracy.
• The proposed work evaluated the performance of every classifier in terms of delay and accuracy.
The rest of the article is summarized as follows:
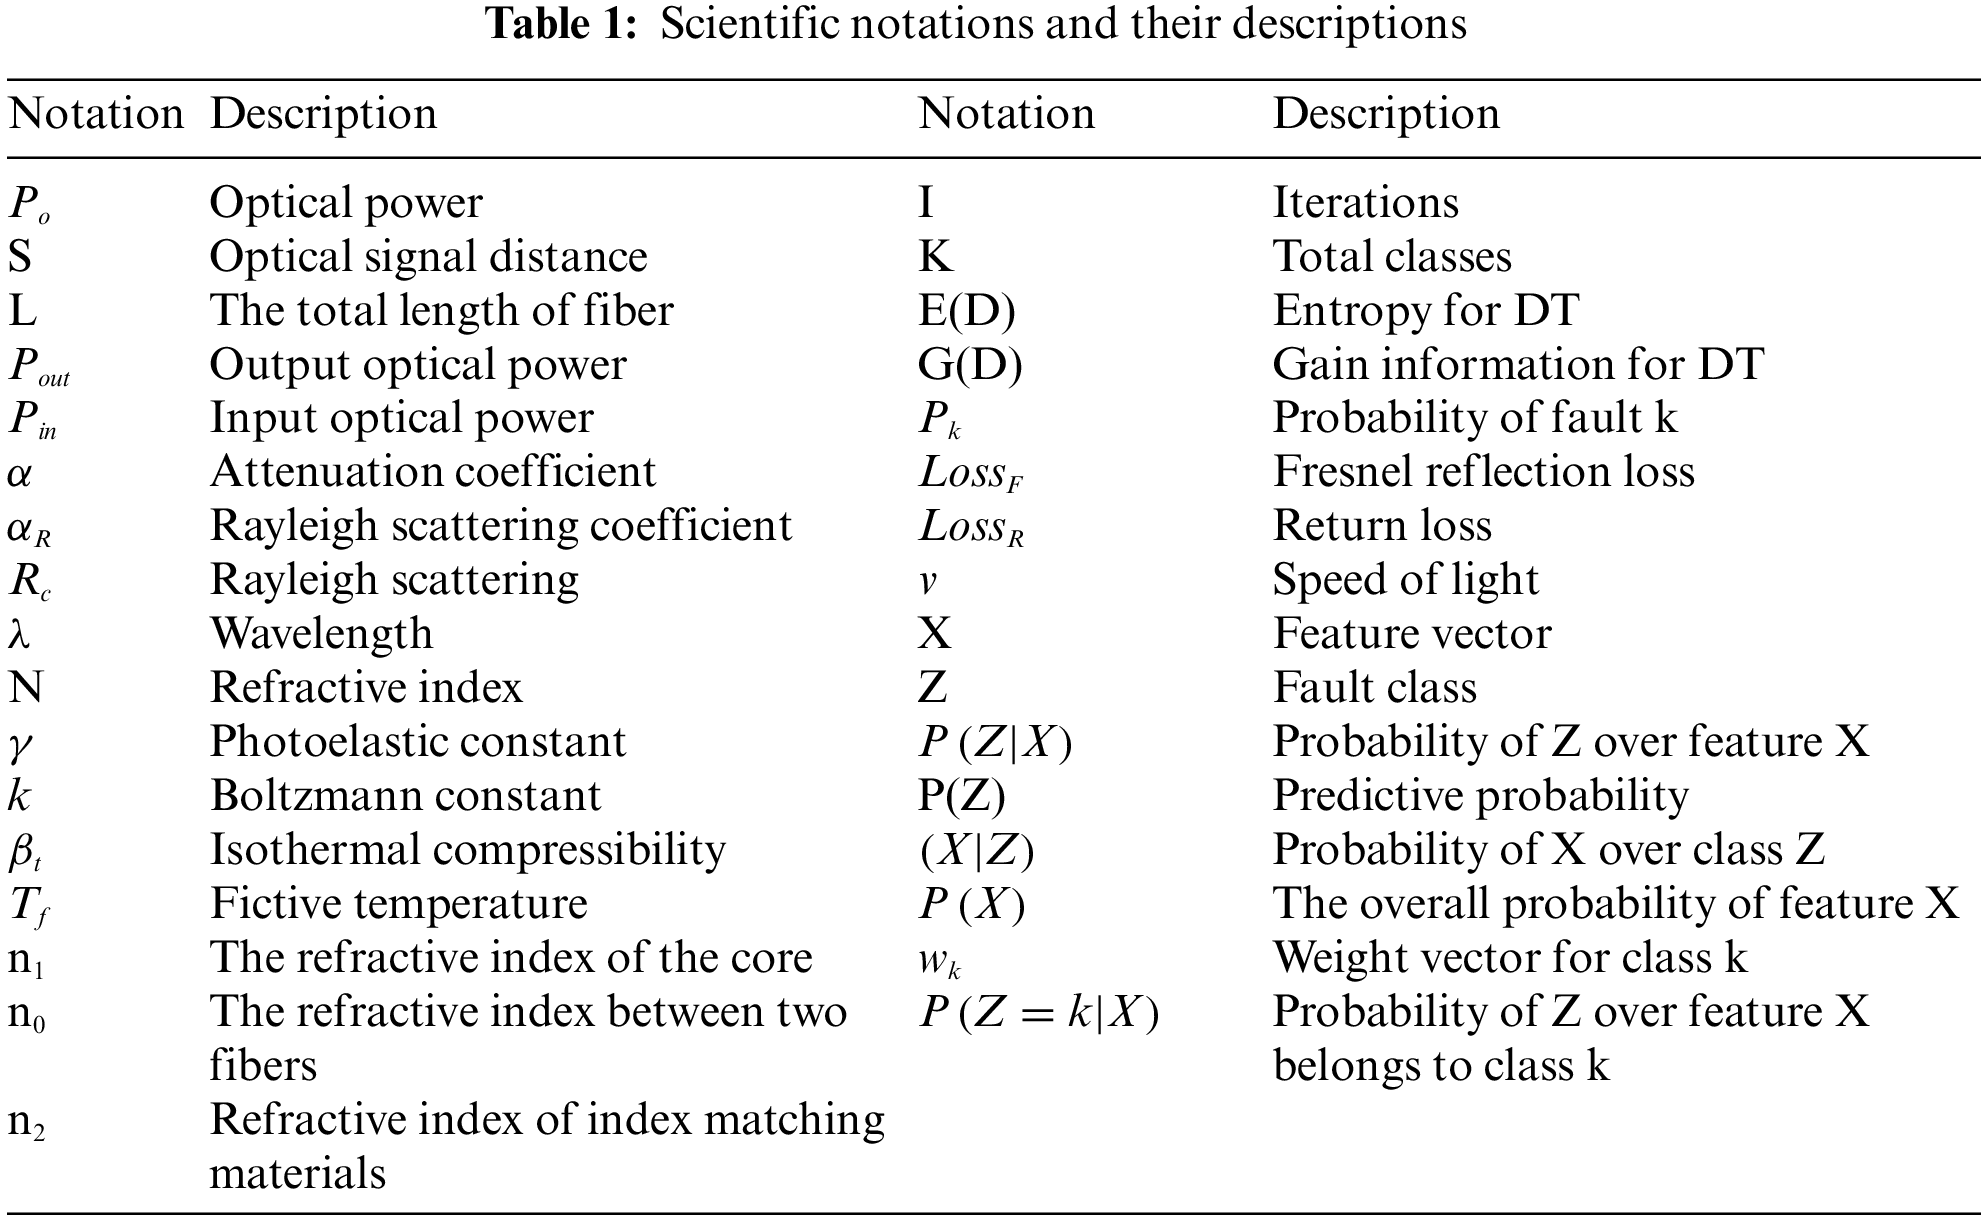
Section 2 provides detailed work related to fault detection. Section 3 presents the system model for fault detection and proposes an ML-based simulation system. In Section 4, this paper demonstrates the results achieved in graphical form. Finally, Section 5 summarizes the paper in the conclusion section. Table 1 illustrates the notations and their descriptions used in this paper.
In recent years, the extensive upliftment in fiber optics networks has gained significant attention from academics and the industry. Specifically, the existing literature witnessed considerable development in this era. The advancement in optical fiber networks has improved data transmission up to terabytes per second, with a negligible delay at long distances, and fiber optics has expanded its reach from backhaul to the access network, including the deployment of Fiber-to-the-X (FTTX), (X: Home, node, building, etc.) [26]. Despite notable achievements, the prompt fault detection and prevention system is crucial in fiber optics. To mitigate these challenges, existing literature has contributed using various techniques, such as the FBG technique, which is gaining momentum in fiber optics components [27]. The significant drawback of FBG is that it detects anomalies over fiber optics, such as temperature and stress, without identifying the fault types. Researchers in [28] introduced a fault detection technique using tunable photon counting (Φ-OTDR) to identify fiber optics faults in PONs. This method filters out and reduces the coherent noise and enhances fault detection through a feedback loop linking a Field-Programmable Gate Array (FPGA) based acquisition unit and the filter.
Nevertheless, the increased sensitivity of Single-Photon Detectors (SPDs) poses a challenge to dynamic range detection. Additionally, the existing work encounters power consumption limitations as the Semiconductor Optical Amplifier (SOA) struggles to meet power requirements. In addition, authors in [29] implemented a real-time fiber incident detection system by exploiting AI to train the model using previous fiber optics incident images in fiber optics networks. The authors proposed a You Only Look Once (YOLO) technique using CNN, and they extended this work to a Regional Mask CNN (Mask-RCNN) based model, which detects and extracts the object regions from images, including fiber cut, link degradation, power issue. Notably, this study is limited to training the model using images rather than detecting multiple faults.
Recently, ML has gained a widespread application, particularly in fiber optics communication networks for fault prediction and localization systems with high accuracy. OPM collects and evaluates various physical characteristics of transmitted signals and components within an optical network to detect ML-based faults. Specifically, Artificial Neural Networks (ANN) extract the features by learning from optical fiber channel parameters such as OSNR, polarization-mode dispersion (PMD), Polarization Dependent Loss (PDL), and Chromatic Dispersion (CD) [30]. However, these techniques require advanced signal processing to find the relevant information; therefore, detecting network failure and system performance becomes very complex and time-consuming.
In reference [31], nonlinear regression ML techniques, specifically SVM and neural networks, are employed to analyze multiple modulation schemes, including Quadrature Phase-Shift Keying (QPSK), Quadrature Amplitude Modulation (8 QAM), 16 QAM, and 64 QAM. These models are trained using diverse OSNR, and relevant features are derived directly from the detected optical signals. This work mainly focuses on the classification of distinct modulation schemes for transmission, whereas the network performance is not evaluated. In contrast, reference [32] introduced a Multi-Task Learning Artificial Neural Network (MTL-ANN) for monitoring the optical performance on simultaneous OSNR and Modulation Format Identification (MFI). The Amplitude Histograms (AHs) of signals are used as an input feature, and the results obtained for non-return-to-zero on-off-keying (NRZ-OOK), pulse-amplitude-modulation (PAM4), and PAM8 signals, MTL-ANN performs better in terms of accuracy and stability. However, the complexity of the MTL-ANN increases exponentially.
Along with the OPM, fiber optic failure management is essential; a review of failure management is presented by [33] to meet the service level agreements with customers and guarantee reliable and stable network services. Failure management of the optical network is performed by alarm monitoring, predicting equipment life, identifying equipment abnormalities, power monitoring, and identifying fiber optics anomalies. These techniques take time to resolve issues; therefore, they need an instant solution to deal with network anomalies to avoid significant delays.
The authors in [34] employed a DL model with a recurrent-based autoencoder technique for identifying the fault in PON. Remarkably, the model achieved an average accuracy of 97% in fault detection and minimized Root Mean Square Error (RMSE) compared to conventional techniques. Nevertheless, this approach identified faulty branches within the PON, it demonstrated poor performance in detecting significant faults such as fiber cuts and bends.
Another work in [35] on branch identification utilized the reflectors at each branch of 1:32 splitting branches PON and the state-of-the-art ML-based attention mechanism autoencoder and GRU techniques used for measuring the performance of the designed algorithm. A Variable Optical Attenuator (VOA) distinguishes the overlapped reflections from multiple branches. The performance of the proposed method is compared with Multilayer Perceptron (MLP), CNN, LSTM, and GRU methods. Despite a significant contribution, the proposed method does not identify the fault type and location. Moreover, authors in [36] worked on the detection and localization of fiber faults at SNR from 0 to 30 dB using noised OTDR reflected traces simulated over the CNN model, the performance of reflective events measured in probability detection and RMSE for the location of the event. This method only detects and localizes the reflective events in a single fiber and is limited to the prediction of reflective events capacity; it needs further improvement for better accuracy. In addition, Abdelli et al. [3] determined two fiber faults, including fiber cut and eavesdropping, using the ML-based Auto Encoder (AE) model. This model detects the fiber faults using a localized fault detection system. However, the proposed method is limited to only two fault types.
Authors in [37] proposed an experimental splitting eavesdropping events detection and localization performed over optical fiber communications at different splitting ratios using ML-based CNN technique by considering both OPM (Q-factor, OSNR, BER, Error Vector Magnitude (EVM)) and eye diagram as input features. The results show 100% for event detection and 92.76% for event localization, but the proposed method is limited to end-to-end transmission eavesdropping events and ignores the other anomalies.
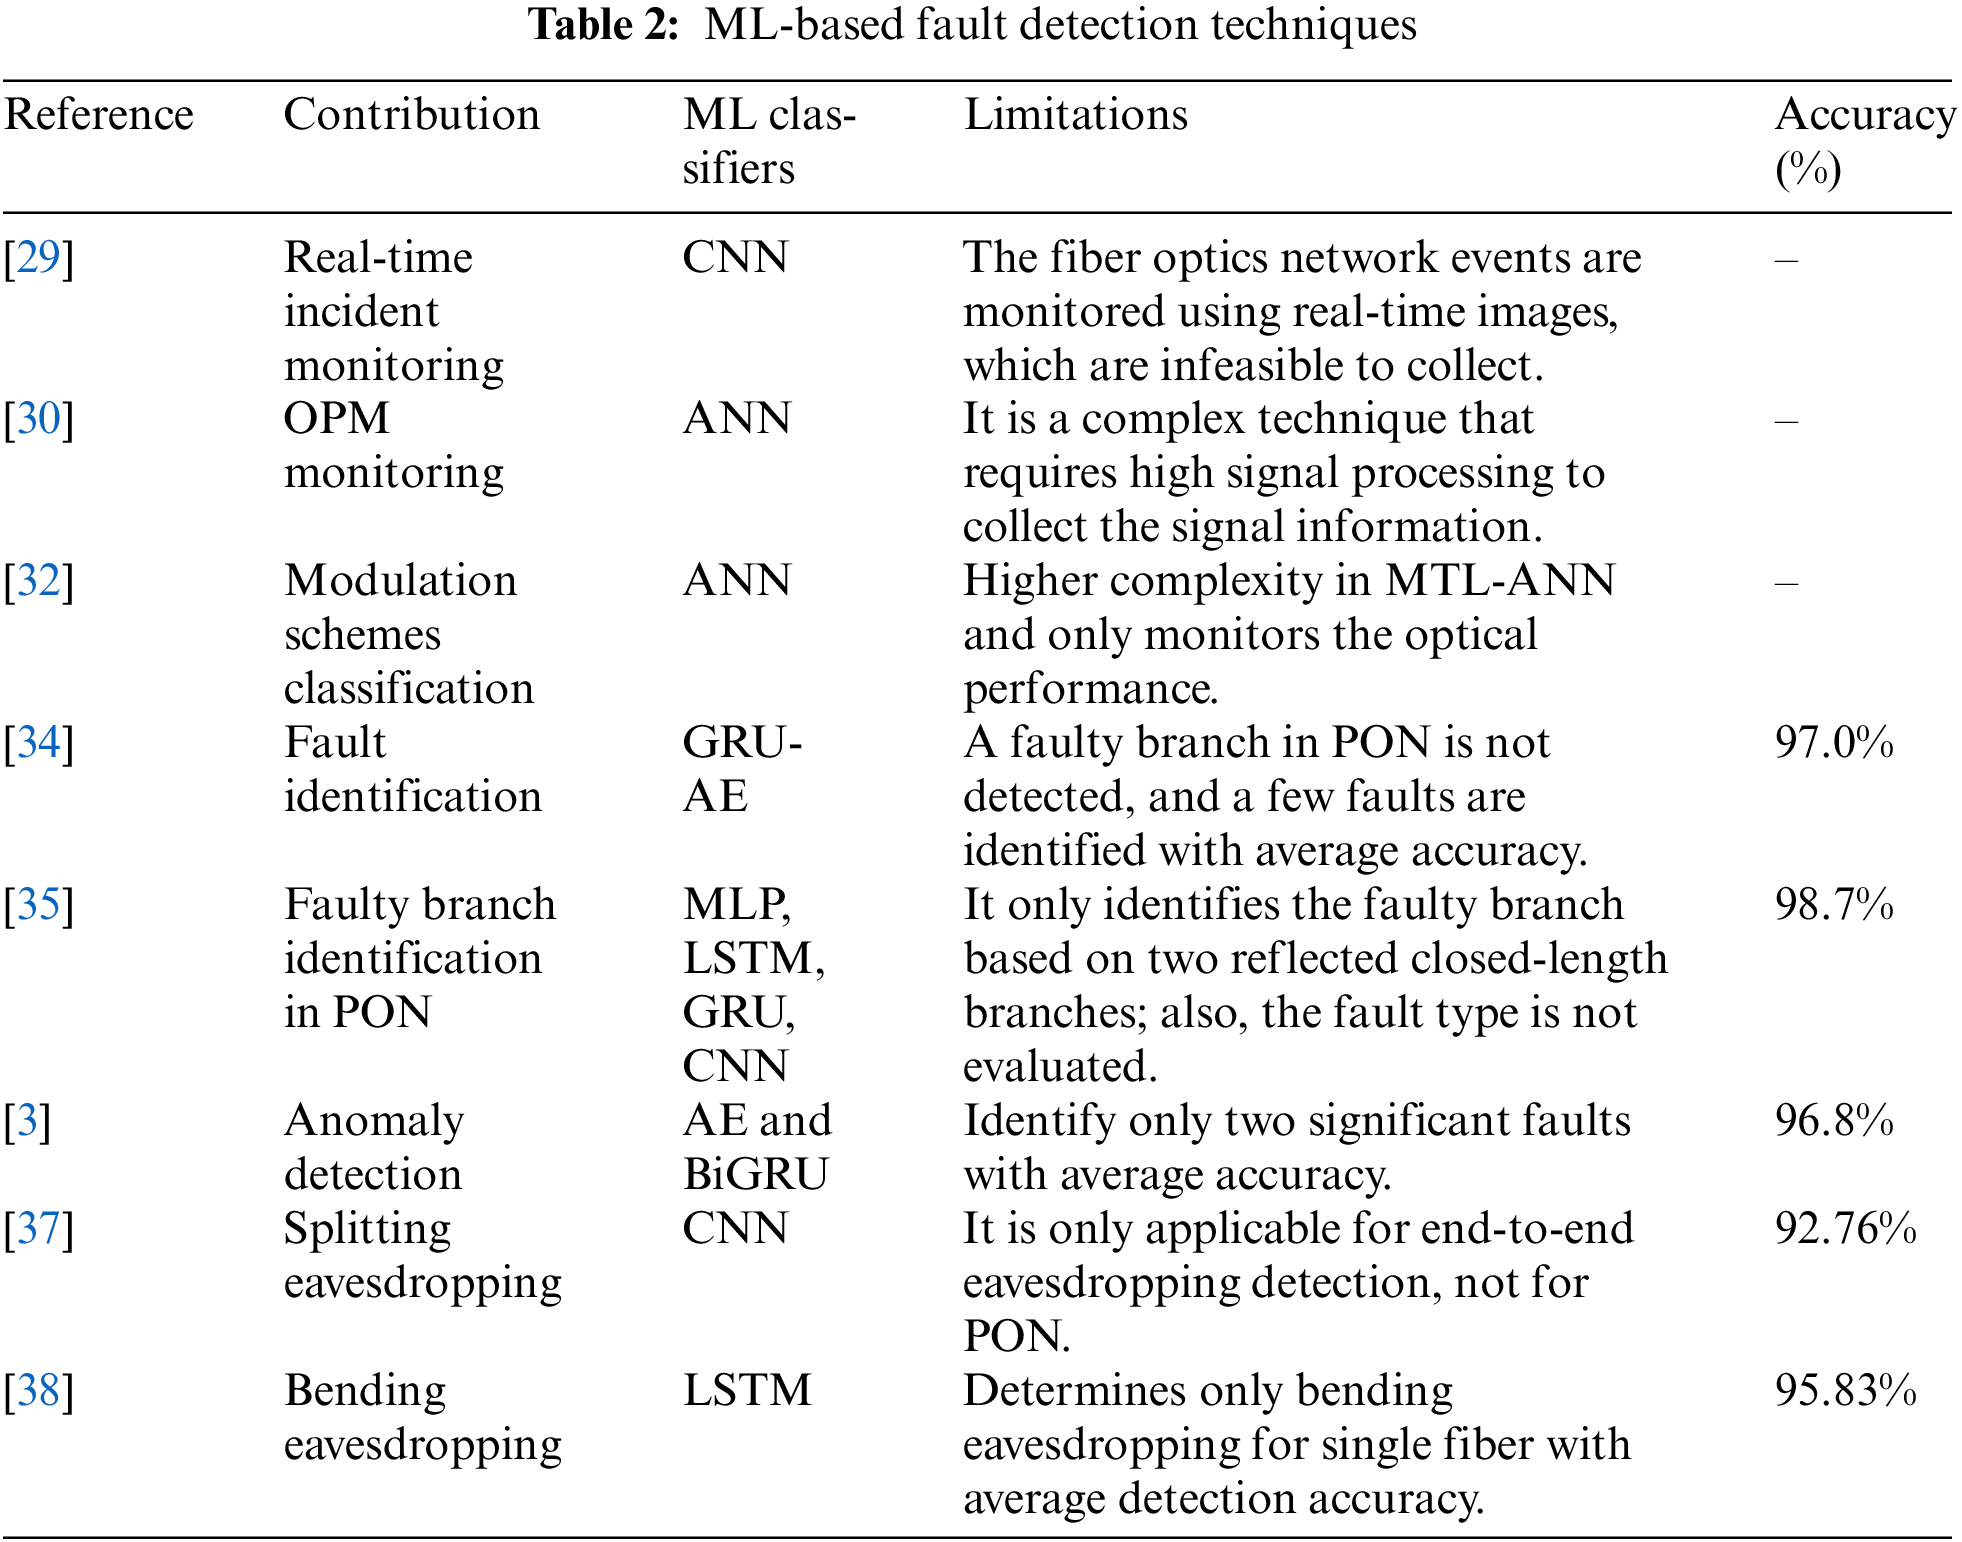
Similarly, authors in [38] proposed a fiber-bending eavesdropping detection using a clip-on coupler, which evaluates the 5-dimensional input features from received optical signals time domain waveform. The employed ML-based LSTM classifier classifies the normal and bending eavesdropping events and achieves a 95.83% accuracy rate. Table 2 shows the summarized work for ML-based fault detection techniques, contributions, and limitations in fiber optics communications.
Different from the above-mentioned traditional works, which are limited to a few fault detection methods, their proposed techniques are inefficient in detecting and localizing the fault promptly. Furthermore, prevention is a significant issue not considered by any related work. Unlike previous works, this work deeply considers all types of faults in fiber optics and provides the most reliable detection and prevention techniques. Furthermore, this work used the hybrid DL model based on CNN-LSTM and EL of bagging, boosting, and voting, which exhibited better performance than other proposed ML models (GNB, LR, SVM, KNN, RF, DT). In addition, it predicts the delay for each classifier.
The proposed system model is divided into two parts. Initially, this work presents the system components, loss analysis using attenuation in fiber optics, and ML multiclassification system for detecting various faults, including fiber eavesdropping, bending events, bad splices, dirty connectors, fiber cut, and PC connectors. This work utilized reflectors to identify the faulty link in PON. Secondly, this work proposes a decision-making algorithm to tackle the faults mentioned above as per the situation. Notably, every attack varies in severity and requires a situation-specific response. The first part of this proposed methodology includes system components and an ML-based fault detection system.
The proposed system models contain various system components, including an Optical Line Terminal (OLT), Optical Distribution Network (ODN), and Optical Network Unit (ONU). The data is fetched from OLT to ONU and vice versa through ODN. A detailed discussion of these three components is given below. Moreover, OTDR is another significant component in this proposed system that detects network faults. The system components and their relation are depicted in Fig. 2.

Figure 2: PON system and components
OLT: OLT is a fundamental component of PON in this research that performs multiple operations, including signal conversion (electrical to optical), signal distributions (CO to ONUs using ODN), and signal management for upstream and downstream transmission. In addition, it performs multiplexing, demultiplexing, dynamic bandwidth allocations, network synchronizations, monitoring, authentication, and security. In this proposed work, OLT transmits the data using fiber optics.
ODN: The ODN is a critical passive intermediary component in this proposed system. Its primary function is to distribute the signal from a single fiber of the OLT to multiple ONUs. The significance and scope of the ODN are amplified with the expanding deployment of FTTX technologies. In the context of this proposed research, the ODN’s role is pivotal, acting as a bridge that facilitates communication between the OLT and ONUs.
ONU: In this research, ONU is a vital end-user component equipped with a transceiver. It converts the optical signals to electrical signals and vice versa. Moreover, it plays a role in handling and filtering data downstream and upstream. In upstream, the ONU allocates the time slot allocation, multiplication, collision avoidance, etc.
OTDR: The OTDR is one of the essential components in this proposed system that detects faults in fiber optics using a Rayleigh backscattering technique. Based on the calculations in Eq. (1), the OTDR locates the fault position and attenuation losses.
where
3.1.1 Attenuation in Fiber Optics
Attenuation is one of the significant challenges in fiber optic communications that delays transmission due to various factors such as dispersion, absorption, bending, splicing, and faulty connectors. A careful manufacturing process and specific selection of materials and waveguides are crucial to mitigate dispersion and absorption issues. On the other hand, fiber attenuation due to bending, splicing, and connectors depends upon the quality of installation. The optical receivers recover the transmitted signals from the received degraded optical power, but the receiver cannot recover the signals due to higher attenuations in fiber links. The fiber attenuation is calculated in Eq. (2) as [39]:
where α is the attenuation coefficient,
Here, Pin is the input power, and L is the fiber length in kilometers (km). The attenuation coefficient α(dB/km) is calculated in Eq. (4) as:
Other losses were observed by rayleigh scattering due to the fluctuations in refractive index due to the microscopic variations in density and concentration of silicon molecules in fiber optics during fabrications. See Eq. (5) the Rayleigh scattering.
Whereas n is the refractive index,
Furthermore, the losses occur due to optical components like fiber joints and connectors between two fibers producing little light reflection. The change in refractive index (glass-air-glass) due to fiber joint known as Fresnel reflection loss
n1 and n0 are the refractive indexes of the fiber core and medium between two fibers, respectively.
The losses due to connectors for optical fiber are measured as the Return loss (
n2 is the refractive index of index-matching material.
Furthermore, the bending in fiber optics is of two types: i. Macro bending and ii. Micro bending. The losses due to macro bending are the larger visible loop bents cause light reflection out of the fiber core. Microbending produces small-scale distortion due to imperfect installation and stress on the fiber. The total attenuation coefficient (
3.2 ML-Based Multiclassification System
This work exploits advanced ML and DL techniques to detect and classify attacks effectively. The proposed ML-based model involves various steps, as outlined in Fig. 3.

Figure 3: ML-based fault detection system
The data collection and its relevance to the problem is the most crucial step in ML, as it lays the foundation for accurate model training and analysis. Considering the importance of the relevant dataset, this work utilized a publicly available dataset, OTDR_Data [44]. This dataset is mainly designed to capture various faults. It contains six fault types and 30 features. Overall, this dataset comprises 125,832 records. Furthermore, the collected data is passed through the data preprocessing process.
Preprocessing plays a vital role in ensuring the accuracy of ML models. The existing dataset contains many missing records and useless features. To perform efficient preprocessing, this work incorporated the following steps: Data cleaning, data split in training and testing, and applying 10-fold cross-validation.
3.2.3 Data Cleaning and Normalization
The data cleaning process ensures the elimination of non-contributing records and features. The empty records are removed manually in the data cleaning processes to optimize the dataset. The missing values were replaced with the median and mode for numerical and categorical features, and the missing records with excessive missing data were discarded. The Interquartile Range (IQR) and Z-score statistical methods are applied to analyze and address the missing values. The stability and standardization of data are maintained primarily for fault identifications in fiber optics. Furthermore, duplicate records are removed to avoid bias in the model training and ensure that each data contributes to the model learning. The data is normalized by preventing overfitting and underfitting. This work balanced the insufficient classes to remove the overfitting in the dataset, and a wide range of data was assured to combat underfitting.
3.2.4 Data Training and Testing
The training and testing of datasets are fundamental in developing robust, reliable models capable of accurately detecting and analyzing faults in PON systems. In this step, this work divided the dataset into training (70%) and testing (30%). This training set actively develops and perfects the models to various fault scenarios and feature variabilities. The testing set involves a crucial step for evaluating the performance of the model and its capability. Afterwards, this work employed a 10-fold cross-validation technique to ensure the robustness and reliability of this proposed model.
Unlike binary classification systems, multiclassification is a categorical approach involving multi-class prediction. Considering the fault detection type that includes various classes, this work employed a multi-classification system to assess the performance of different ML and DL models. Specifically, integrated six ML models as mentioned below:
GNB: It is a fast and multivariate ML classifier that relies on the Bayes theorem and assumes the features of each class on Gaussian distribution. It calculates the mean and variance of each class and predicts the new data points [45]. Eq. (11) shows the mathematical model for GNB.
Here,
P(Z) is the predictive probability of class.
LR: The LR classification technique employs the probability of categorical data. This method uses the logistic function to model the relationship between dependent variables (fault class) and independent variables (features). The multinomial LR classification calculates the sigmoid function with the SoftMax function, as mentioned in Eq. (12) [46].
SVM: SVM is a powerful and multipurpose supervised ML algorithm, mainly used for classification purposes. It separates the different classes in available features by finding the best hyperplane. The hyperplane boundary is chosen on a maximum margin between data points of other classes [47].
KNN: KNN is a simple and commonly used instant-based learning ML algorithm that handles multiclassification tasks over a large dataset. It uses the entire dataset to calculate the point and predict the values based on the nearest k-neighbor points. The data point is calculated for classification by voting the most used labels for the closest neighbor points [48].
RF: RF is a supervised learning technique for classification and regression tasks. It works on ensemble learning techniques by combining the multiple decision tree outputs to predict the features. For classification, it determines the training set, applies DT for each sample, and generates the output on majority voting [49].
DT: DT is one of the most popular ML predictive techniques; this paper utilized it for multiclassification in fiber optics fault detection. DT separates the data into subsets by investigating the training samples and features on the principle of information gain and entropy. The purpose is to construct a tree structure to efficiently predict the output for new data using an available dataset. The Entropy (E(D)) and Gain information (G(D)) are given in Eqs. (13) and (14), respectively [47].
Here, K is the total number of faults, and
EL: It is a powerful ML technique with the additional capability to predict faults. In contrast, it increases the computational efficiency by combining the weak learning models. The EL technique’s predictive performance is higher than that of the individual models. The following EL techniques are utilized in this study.
Bagging: It is an EL ML technique that improves the accuracy of algorithms by containing the subset of trained multiple models, and each model votes for the output similar to the RF model. It combines numerous models and reduces the variance. This work used the DT classifier as a base function and applied the bagging EL technique.
Boosting: Boosting combines multiple ML models that have weak prediction capability. It trains each sample, adjusts the weight, and corrects previous errors to increase the model’s accuracy. The final output is based on the weight of each model and has better classification accuracy. In this work, the boosting EL technique is also evaluated by using DT as a base classifier.
Voting: Voting is a vital EL technique where multiple models are trained independently, and their predictions are combined on a majority voting for classifications. This work combined RF, LR, and KNN for voting classifications. Fig. 4 shows the ensemble model applied to RF, LR, and KNN classifiers.

Figure 4: EL voting technique
CNN: It is an ANN with high feature extraction capability from the training data. It consists of multiple hidden layers, where the first part contains the input layer, followed by altering the convolutional layer and pooling layer. The convolutional layer is partially connected; it extracts the features as artificial neurons and forwards them to the next pooling layer. The pooling layer reduces the feature and resamples it based on the average input value. The second part consists of a fully connected layer with a completely straightforward neural network to create the combinations of features for mapping the output.
LSTM: Traditional feedforward ANNs do not support sequential time series structured data. Recently developed Recurrent Neural Networks (RNNs) overcome this by incorporating recurrent alongside forward connections. LSTM is a type of RNN with high capacity, especially for learning from data sequences. It has a complex architecture consisting of three gates: An input gate, an output gate, and a forget gate. These gates are designed to store long-term memory, control the flow of information, and determine whether information is kept or removed. Furthermore, it enables LSTM to remember the pattern for extended periods, which benefits not to train the data repeatedly.
Hybrid model (CNN-LSTM): By taking advantage of the best feature extraction for CNN and sequential data developing from LSTM, this paper combined both models and generated a hybrid model based on CNN-LSTM. In this designed network architecture, the efficiency of convolutional layers in extracting and generalizing features from time series data is improved by using LSTM. This combination advances the accuracy of mapping the output from input, mainly fault classification, using time series.
In this work, the designed CNN algorithm, the convolutional layer with 64 filters and a kernel size of 03, extracts features and passes them to the next pooling payer to reduce the computational complexity by downsampling the feature maps. After the pooling layer, data is flattened into the 1D array to send into the fully connected layer. The Rectified Linear Unit (Relu) is an activation function for convolutional and pooling layers. It creates non-linearity and allows the network to learn complex patterns. The LSTM is specially designed for processing data sequences; tanh and sigmoid are the activation functions used for the gating mechanism. The combined CNN-LSTM is the most potent solution for sequential data. Finally, the softmax function is used in the final layer for multiclassification. Fig. 5 shows a consolidated evaluation framework for CNN and LSTM.

Figure 5: CNN-LSTM architecture
3.3 Fault Prevention System in Fiber Optics
Each fault in fiber optics has its own severity and prevention techniques. In this proposed system, the OTDR signals are initially analyzed to predict the faults through the multiclassification ML approaches and address the fault according to the ML-based results. Based on the fault type, this work proposes a decision-making system that decides an appropriate prevention system. Specifically, optical fiber includes two major fault types: Fiber disconnection and Fiber attenuation. The faults are followed, and their proposed mitigation system.
Fiber cut: In the case of a fiber cut, the most reliable solution is to route the traffic from a redundant link. Thus, this paper proposes a redundancy that implies switching to backup fiber to maintain the data transmission until the link is established physically.
Fiber attenuation: Fiber attenuation involves various fiber faults. In the case of signal attenuation, the proposed system model copes with the fault accordingly. For example, a splice loss fault detected at the fiber junction is resolved by a splicer of fiber in the proposed system. On the other hand, losses due to dirty connectors are resolved by cleaning or replacing the connectors. Regarding fiber tapping or eavesdropping, the proposed system uses OLT to secure communication channels through encryption.
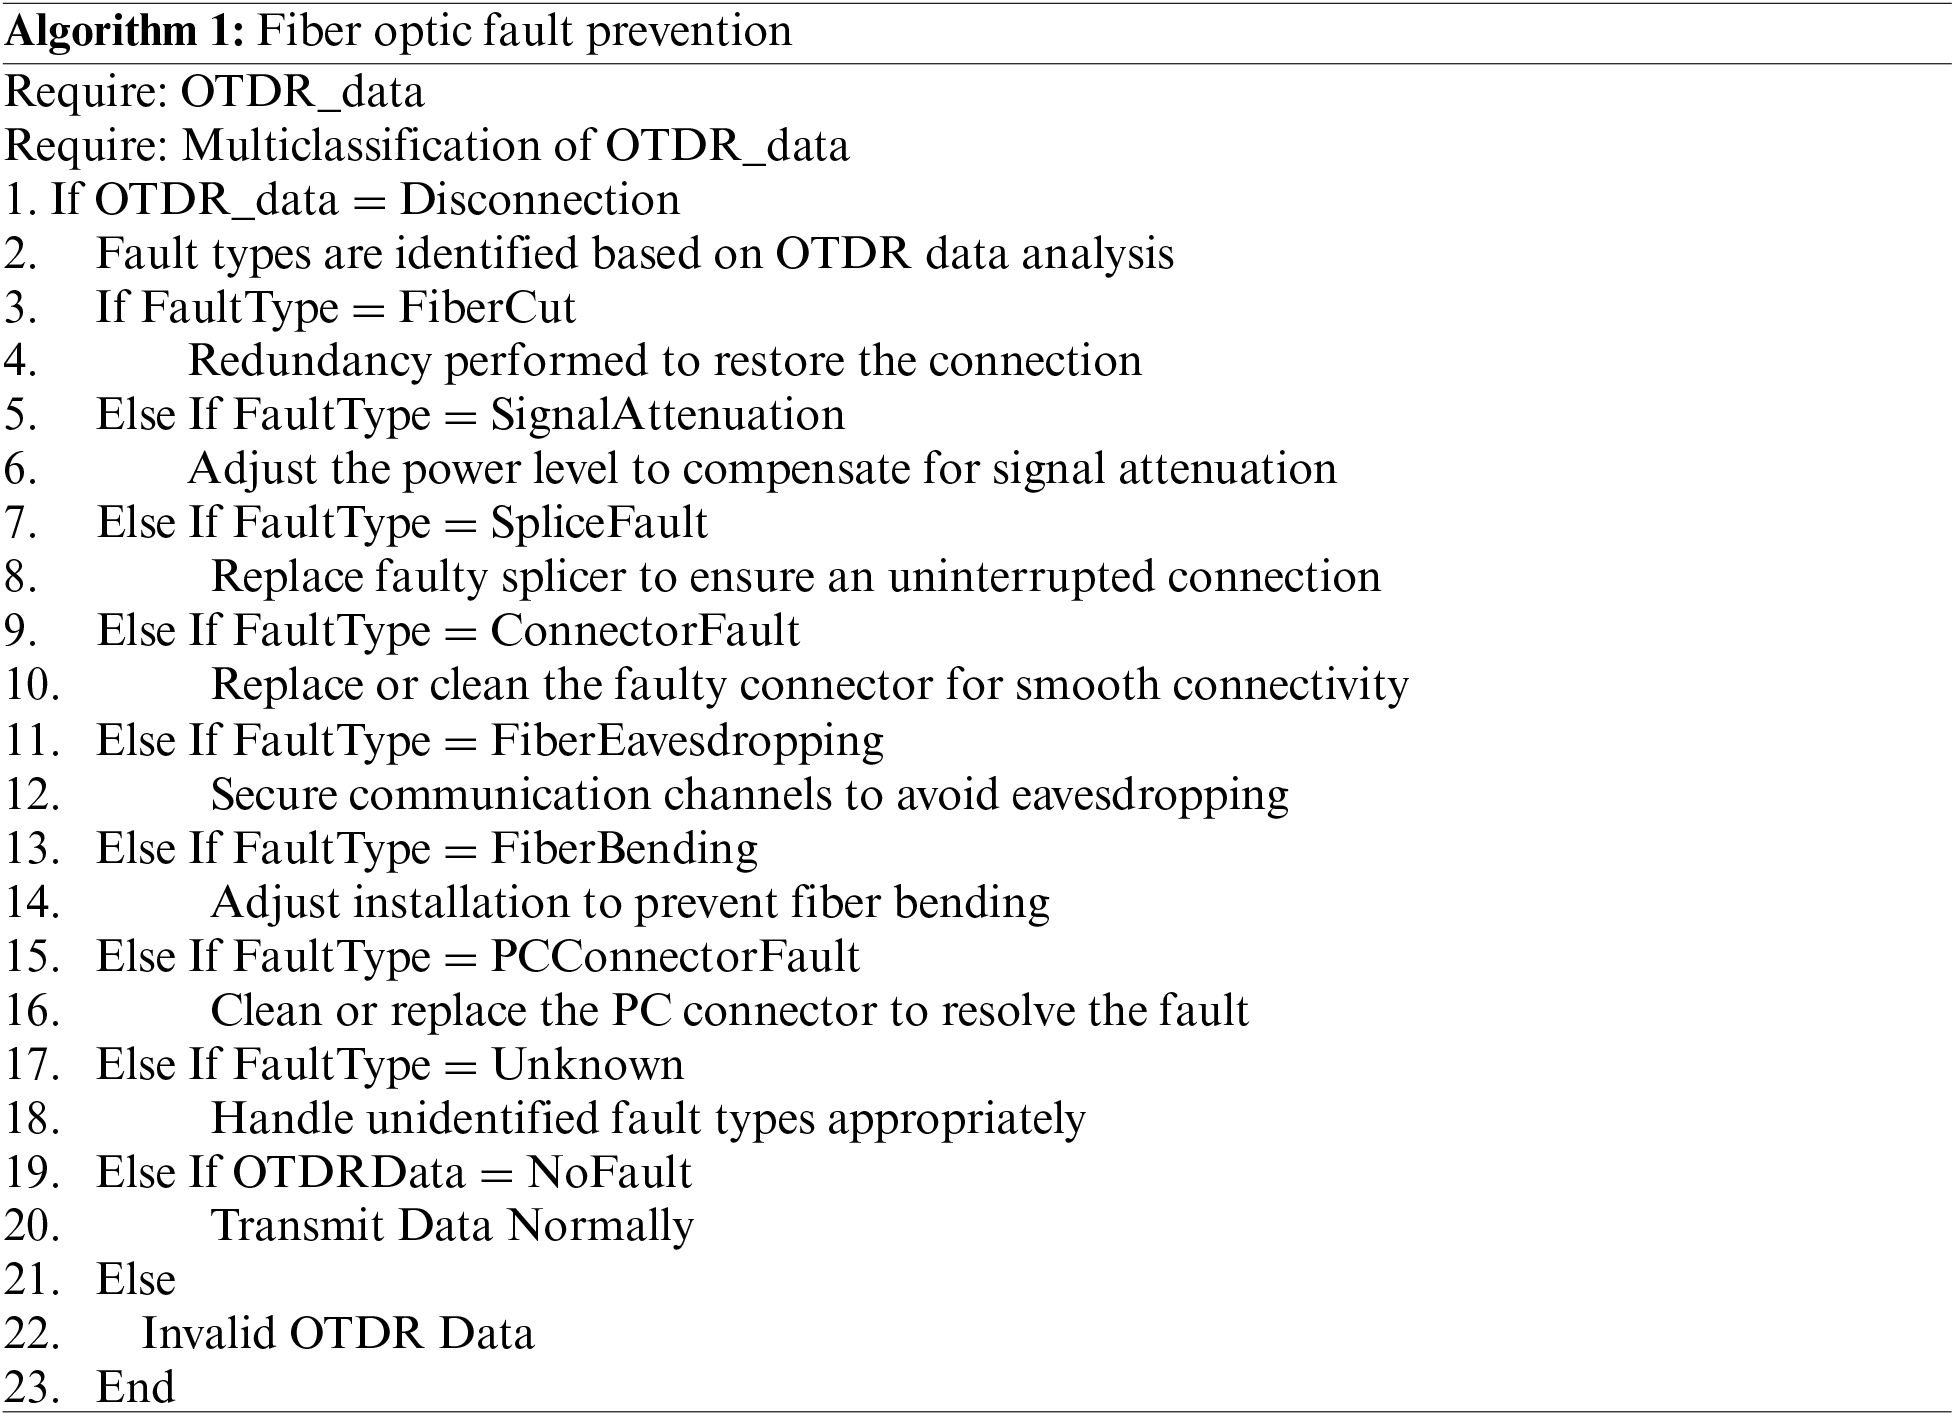
Finally, the proposed system manages fiber bending by adjusting the installation to reduce stress. However, physical connector faults are treated as other faulty connectors that need to be replaced. Algorithm 1 presents the fault detection and decision system.
The proposed ML-based evaluation system is divided into Accuracy and Delay. The accuracy involves the model’s accuracy, whereas the delay measures the testing time of each classifier. The motive of involving delay in the proposed system verifies the tradeoff between the accuracy and delay of a specific model. The performance of proposed ML classifiers is evaluated using the precision, recall, accuracy, and F1 score calculated in Eqs. (15) to (18), respectively.
The precision (Prc) measures the accuracy of valid predictors.
Recall (Rc) measures the sensitivity or ability of an ML model to count all the related classes.
Accuracy (Acc) is an essential parameter for performance measurement, and the equation is given as follows:
F1 score is the harmonic mean of precision and recall parameters, and the purpose is to balance both precision and recall parameters.
Here,
Delay: The fiber optics is a delay-sensitive network, which requires less delay while classifying the attack type. In the proposed system, the delay measures the average time each ML classifier takes for testing, illustrating the computational efficiency in terms of processing time. Through this evaluation, this work aims to identify classifiers that strike the optimal balance between accuracy and computational efficiency, ensuring effective fault detection while minimizing processing time.
In this work, the deep study of fault detection and prevention systems is performed using six different ML classifiers, three EL techniques, and one hybrid DL technique. The classifiers for the model are evaluated using a multiclassification system that includes accuracy, precision, recall, F1 score, and delay. In addition, this work exhibited the results using Receiver Operating Characteristic (ROC) curves for each model that shows the performance of classifiers. Table 3 shows the numerical results of each model.
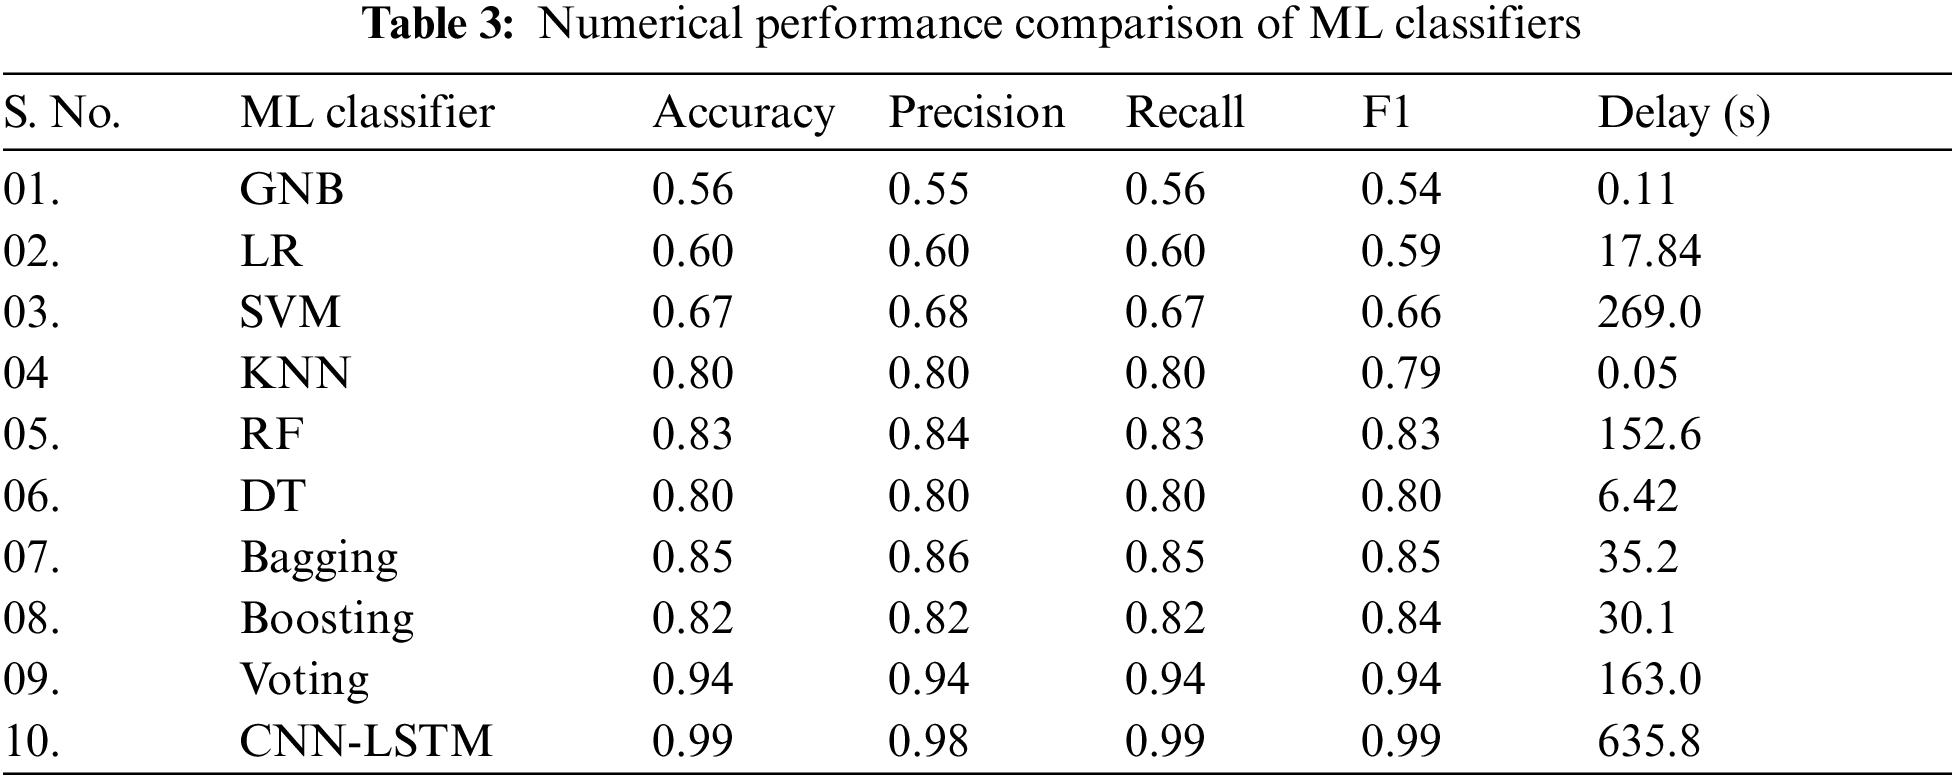
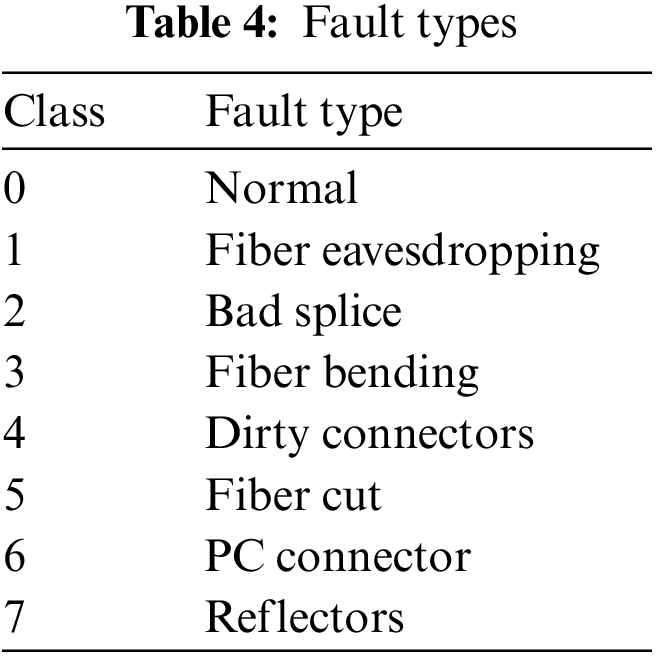
Notably, the RF, LR, and KNN using EL show an improved accuracy, whereas the delay is enhanced compared to individual classifiers. Thus, the EL technique has higher accuracy with increased delay. The following are the visualized results of various ML classifiers where every class shows a specific fault type from 1 to 6, class 0 shows no fault, and class 7 is the reflector. It is also normal and helps to identify the faulty branch, as illustrated in Table 4.
The visualized ROC curve of different ML classifiers is shown as follows. Fig. 6 indicates that the GNB classifier achieved the highest accuracy in class 3, which is 0.95; Class 1 and class 7 are 0.93. Class 0, class 2, class 4, and class 5 are 0.85, 0.88, 0.92, and 0.80, respectively; class 6 achieves lowest of 0.65. Fig. 7 shows that the LR classifier achieved a satisfactory accuracy of 0.97 in class 3 and 0.95 in class 1. In class 7 and class 4, LR attained an accuracy of 0.94 and 0.91, respectively, while the rest of the classes were in the 80s. Fig. 8 shows that the SVM classifier achieved the highest accuracy in class 3, 0.97. Most of the accuracy achieved by SMV is in the 90s, except for class 6, which is 0.88. The KNN obtained an accuracy of 0.96 in class 3, class 4, and class 7. While it achieved 0.95 in class 1 and class 6, 0.94 for class 2 and class 4, 0.88 for class 0, as depicted in Fig. 9. The RF shows better accuracy in most of the classes, such as 0.97 in class 1, class 3, class 4, and class 7. On the other side, class 0, class 2, and class 5 achieved 0.96 accuracy. As compared to previous classifiers, RF achieved a better accuracy, as shown in Fig. 10. As displayed in Fig. 11, DT reflects a poor accuracy in most of the classes, where the highest accuracy is 0.92 in class 7, 0.91 in class 4 and class 6, 0.90 in class 1 and class 3 and lowest accuracy of 0.80 in class 0.
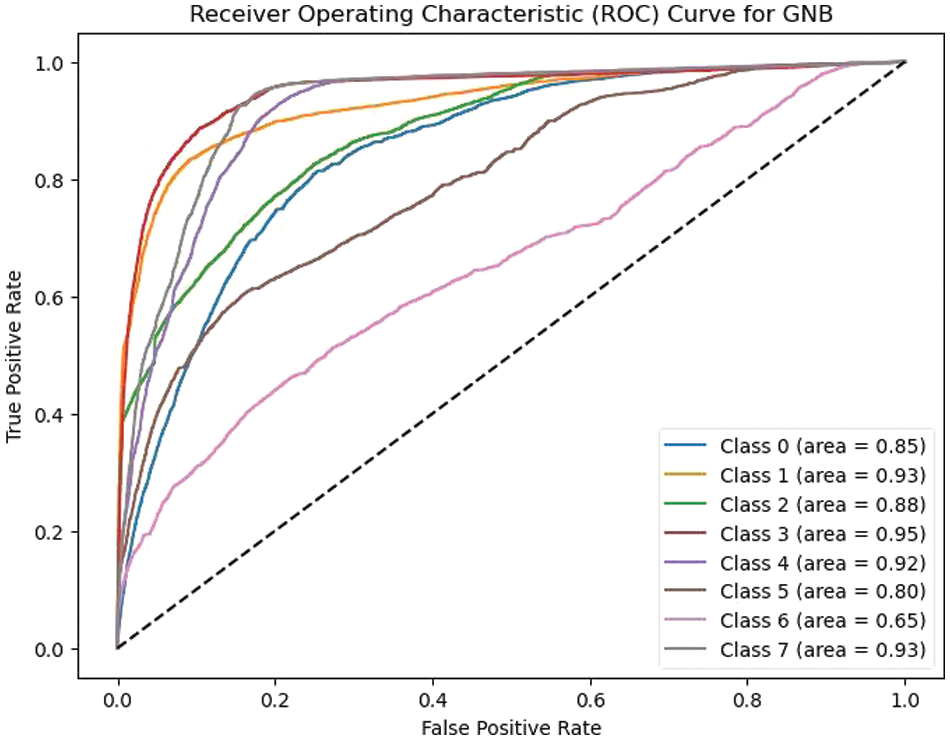
Figure 6: GNB classifier

Figure 7: LR classifier
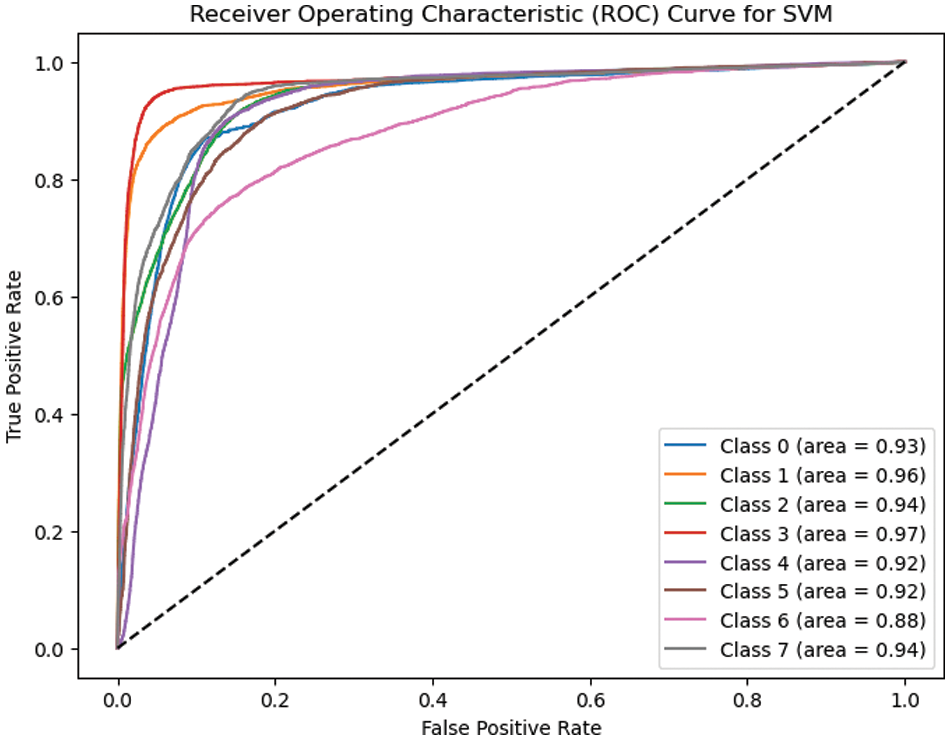
Figure 8: SVM classifier

Figure 9: KNN classifier

Figure 10: RF classifier

Figure 11: DT classifier
EL: The bagging EL applied on DT reflected an improved accuracy compared to simple DT. After applying bagging EL, class 4 achieved a height accuracy of 0.98; other classes, except class 0, predicted an accuracy of 0.97. Moreover, class 0 shows an accuracy of 0.96, see Fig. 12. Similarly, the boosting EL is applied on DT in the proposed system, which depicts less accuracy than the bagging method. The highest accuracy using boosting is shown in Fig. 13, which is 0.96 accuracy, which is less than the bagging method.

Figure 12: Bagging classifier
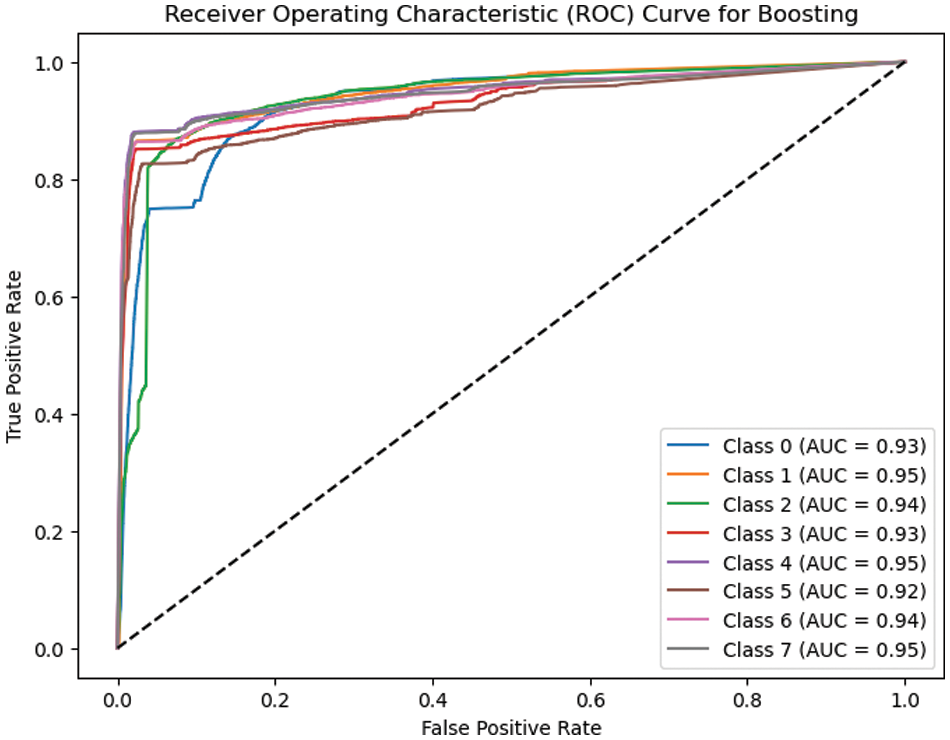
Figure 13: Boosting classifier
Moreover, the voting EL method is applied to LR, RF, and KNN combined in the proposed system. The superiority of the voting method is reflected in Fig. 14, where class 1, class 3, class 4, class 5, and class 7 achieved 0.97, and other classes achieved 0.96 accuracy. Thus, the voting method is more efficient and accurate in multi-class fault detection systems.

Figure 14: Voting classifier
Fig. 15 is for the hybrid-based CNN-LSTM model, showing the highest average accuracy for all classes, class 2 and class 4 to class 7 of 0.98, and the rest of all classes showed 0.97.

Figure 15: CNN-LSTM classifier
Accuracy: As shown in Fig. 16, comparative evaluation results of all classifiers with and without the EL technique reflect that the voting method achieved higher accuracy, precision, recall, and F1 of 94% than other EL techniques and individual classifiers. Moreover, the DL-based hybrid CNN-LSTM model shows % highest average performance of 99%.

Figure 16: Performance comparison of ML classifiers
Delay: As shown in Fig. 17, the lowest delay is observed in the KNN ML model, which is 0.05 s, whereas GNB is in a second-ranked model with a delay of 0.11 ms. The higher delay observed for the EL voting model and hybrid CNN-LSTM model is 163 and 635.8 s, respectively.
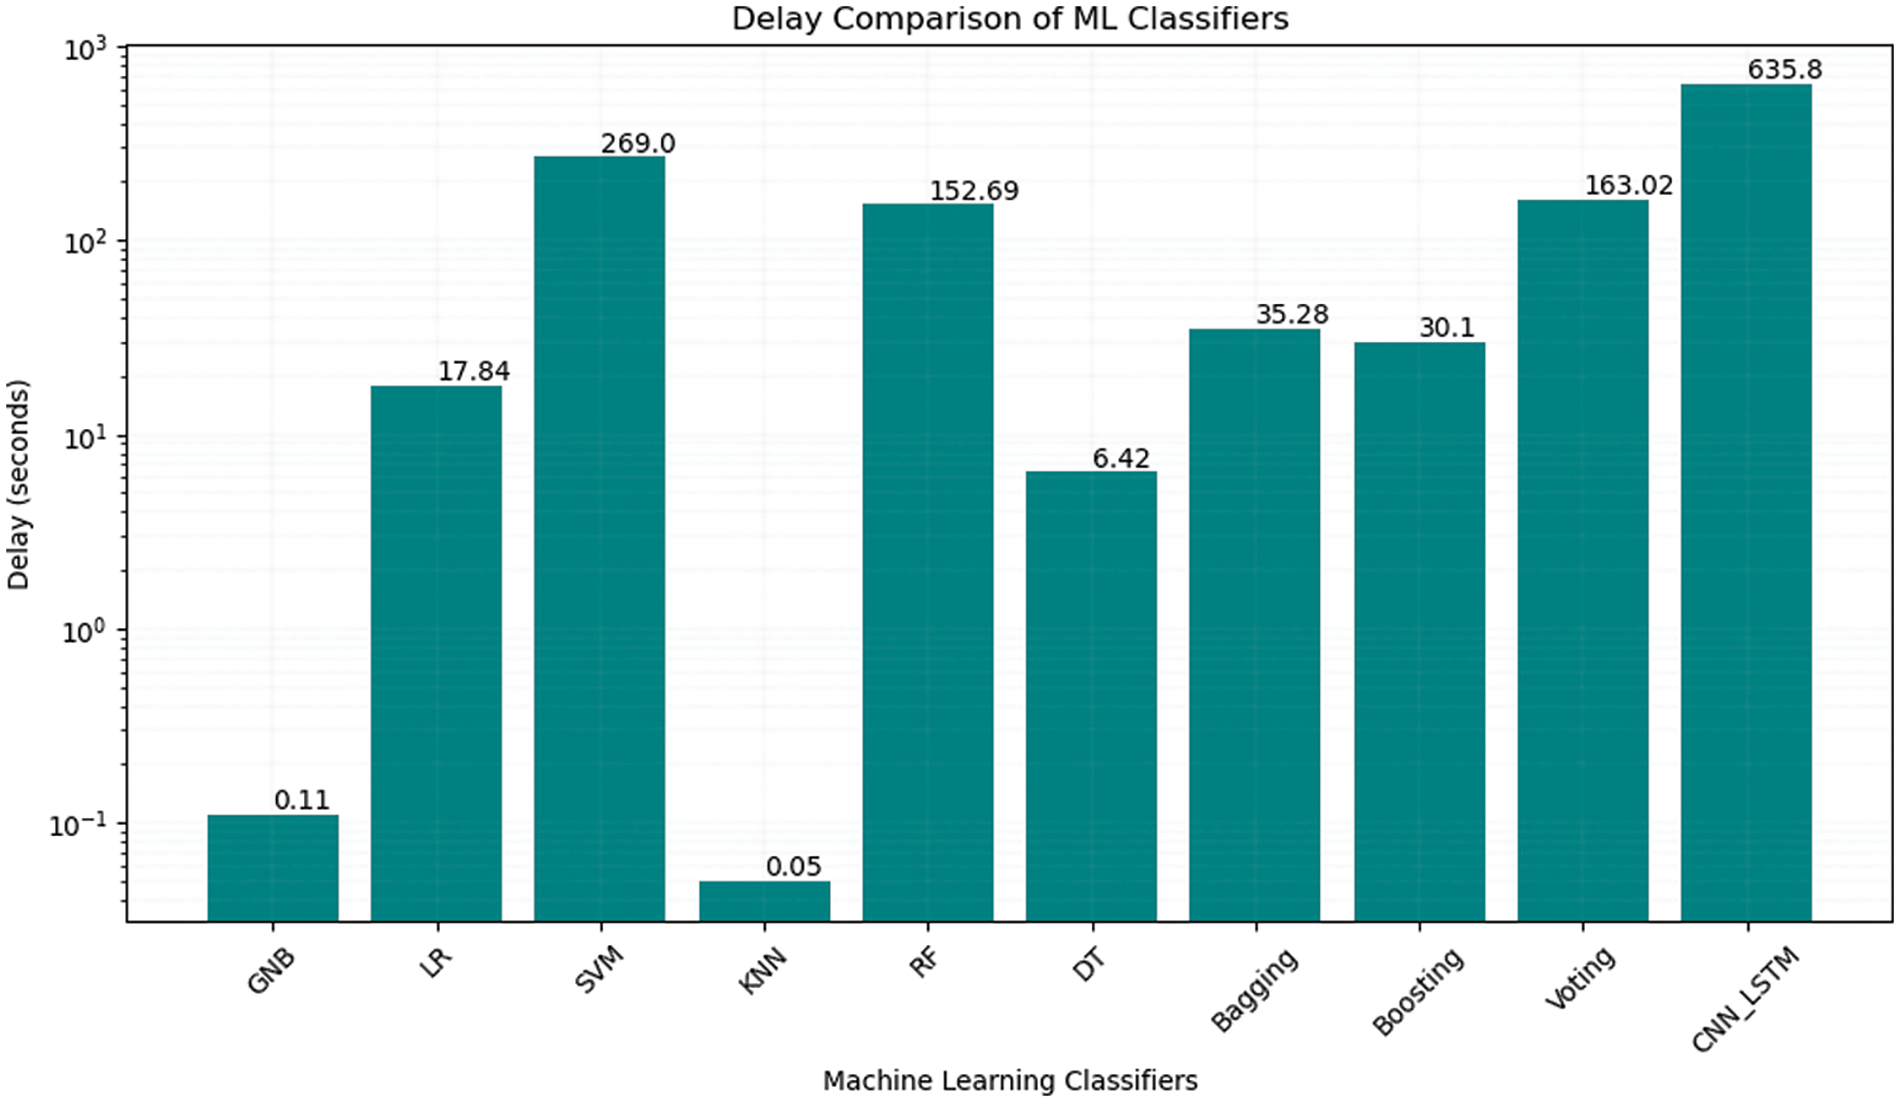
Figure 17: Delay analysis of ML classifiers
Fault detection and prevention in fiber optics is the most prioritized issue in optical communications. It badly affects the communications services for a longer time. To keep safe and secure fiber optics cables, this research proposed the six ML models (GNB, LR, SVM, KNN, RF, DT) and three EL-based ML models (Bagging, Boosting, and Voting) and a DL-based CNN-LSTM hybrid model to predict the faults. The faults are classified into six classes: Fiber eavesdropping, bad splicing, bending events, dirty connectors, fiber cut, and PC connectors. The reflectors are used to identify the branch in PON. Class 0 shows the normal link, class 1 to class 6 shows faulty links, and class 7 shows reflectors. Additionally, we proposed an algorithm for the prevention of specific detected faults. Different ML classifiers’ performance is measured in terms of accuracy, precision, recall, F1, and delay. Results show that the KNN-based ML model has the shortest delay of 0.05s and performance accuracy of 80%, and GNB shows a delay of 0.11 s and has the lowest performance of 56% accuracy. The performance of ML models is increased by applying the EL-based bagging, boosting, and voting techniques, showing accuracy and delay of 86% and 35.28 s, 82% and 30.1 s, 94% and 163.02 s, respectively. Moreover, the proposed DL-based hybrid model shows the highest performance of 99% accuracy and delay of 635.8 s.
Acknowledgement: The authors acknowledge the support received from the National Natural Science Foundation of China, the Fundamental Research Funds for the Central Universities, the National Key Research and Development Program of China, the Beijing Nova Program, and the State Key Laboratory of Integrated Services Networks, Xidian University.
Funding Statement: This work was supported in part by the National Natural Science Foundation of China under Grants 62271079, 61875239, 62127802, in part by the Fundamental Research Funds for the Central Universities under Grant 2023PY01, in part by the National Key Research and Development Program of China under Grant 2018YFB2200903 and in part by the Beijing Nova Program with Grant Number Z211100002121138.
Author Contributions: Study conception and design: K. K. Soothar, Y. Chen, A. H. Magsi; data collection: K. K. Soothar, C. Hu, H. Shah; analysis and interpretation of results: K. K. Soothar, Y. Chen, A. H. Magsi; draft manuscript preparation: K. K. Soothar, C. Hu; data curation: K. K. Soothar, C. Hu, H. Shah; visualization: K. K. Soothar, A. H. Magsi, C. Hu, H. Shah; resources: K. K. Soothar, Y. Chen, C. Hu. All authors reviewed the results and approved the final version of the manuscript.
Availability of Data and Materials: The data that support the findings of this study are available from the first author upon request.
Conflicts of Interest: The authors declare that they have no conflicts of interest to report regarding the present study.
References
1. X. Pan, X. Wang, B. Tian, C. Wang, H. Zhang and M. Guizani, “Machine-learning-aided optical fiber communication system,” IEEE Netw., vol. 35, no. 4, pp. 136–142, Aug. 2021. doi: 10.1109/MNET.011.2000676. [Google Scholar] [CrossRef]
2. U. Cisco, Cisco Annual Internet Report (2018-2023) White Paper. San Jose, CA, USA: Cisco, vol. 10, no. 1, pp. 1–35, Mar. 10, 2020. [Google Scholar]
3. K. Abdelli, J. Y. Cho, F. Azendorf, H. Griesser, C. Tropschug and S. Pachnicke, “Machine-learning-based anomaly detection in optical fiber monitoring,” J. Opt. Commun. Netw., vol. 14, no. 5, pp. 365–375, May 2022. doi: 10.1364/JOCN.451289. [Google Scholar] [CrossRef]
4. T. Hayford-Acquah and B. Asante, “Causes of fiber cut and the recommendation to solve the problem,” IOSR J. Electron. Commun. Eng., vol. 12, no. 1, pp. 46–64, Jan. 2017. doi: 10.9790/2834-1201014664. [Google Scholar] [CrossRef]
5. H. Hao, Z. Pang, G. Wang, and B. Wang, “Indoor optical fiber eavesdropping approach and its avoidance,” Opt. Express, vol. 30, no. 20, pp. 36774–36782, Sep. 26, 2022. doi: 10.1364/OE.470529. [Google Scholar] [PubMed] [CrossRef]
6. M. Kihara, R. Nagano, H. Izumita, and M. Toyonaga, “Unusual fault detection and loss analysis in optical fiber connections with refractive index matching material,” Opt. Fiber Technol., vol. 18, no. 3, pp. 167–175, May 2012. doi: 10.1016/j.yofte.2012.03.001. [Google Scholar] [CrossRef]
7. T. A. Ali and J. J. H. Ameen, “Study of fault detection techniques for optical fibers,” ZANCO J. Pure Appl. Sci., vol. 31, no. s3, pp. 143–149, 2019. doi: 10.21271/ZJPAS.31.s3.20. [Google Scholar] [CrossRef]
8. J. Mata et al., “Artificial intelligence (AI) methods in optical networks: A comprehensive survey,” Opt. Switch. Netw., vol. 28, no. 1, pp. 43–57, Apr. 2018. doi: 10.1016/j.osn.2017.12.006. [Google Scholar] [CrossRef]
9. D. Wang et al., “Machine learning-based multifunctional optical spectrum analysis technique,” IEEE Access, vol. 7, pp. 19726–19737, Jan. 2019. doi: 10.1109/ACCESS.2019.2895409. [Google Scholar] [CrossRef]
10. X. Zhao, M. Dong, Y. Zhang, F. Luo, and L. Zhu, “Simultaneous measurement of strain, temperature and refractive index based on a fiber Bragg grating and an in-line Mach-Zehnder interferometer,” Opt. Commun., vol. 435, no. 9, pp. 61–67, Mar. 2019. doi: 10.1016/j.optcom.2018.11.022. [Google Scholar] [CrossRef]
11. R. G. Duncan et al., “OFDR-based distributed sensing and fault detection for single-and multi-mode avionics fiber-optics,” in Proc. Joint Conf. Aging Aircr., Apr. 2007, pp. 16–19. [Google Scholar]
12. J. Brendel, “High-resolution photon-counting OTDR for PON testing and monitoring,” in Proc. OFC/NFOEC, San Diego, CA, USA, Feb. 24–28, 2008, pp. 1–5. [Google Scholar]
13. J. Montalvo, D. S. Montero, C. Vázquez, J. M. Baptista, and J. L. Santos, “Radio-frequency self-referencing system for monitoring drop fibers in wavelength division multiplexing passive optical networks,” IET Optoelectron., vol. 6, no. 4, pp. 226–234, Dec. 2010. doi: 10.1049/iet-opt.2009.0070. [Google Scholar] [CrossRef]
14. J. Montalvo, A. Tapetado, D. S. Montero, and C. Vázquez, “New fiber supervision technique for passive optical networks supporting mobile services,” IEEE Photon. Technol. Lett., vol. 28, no. 4, pp. 501–504, 2015. doi: 10.1109/LPT.2015.2500278. [Google Scholar] [CrossRef]
15. M. H. Abidi, U. Umer, S. H. Mian, and A. Al-Ahmari, “Big data-based smart health monitoring system: Using deep ensemble learning,” IEEE Access, vol. 11, pp. 114880–114903, Oct. 2023. doi: 10.1109/ACCESS.2023.3325323. [Google Scholar] [CrossRef]
16. M. Q. Tran, H. P. Doan, V. Q. Vu, and L. T. Vu, “Machine learning and IoT-based approach for tool condition monitoring: A review and future prospects,” Meas., vol. 207, no. 10, pp. 112351, Feb. 2023. doi: 10.1016/j.measurement.2022.112351. [Google Scholar] [CrossRef]
17. A. H. Magsi, A. Ghulam, S. Memon, K. Javeed, M. Alhussein and I. Rida, “A machine learning-based attack detection and prevention system in vehicular named data networking,” Comput. Mater. Contin., vol. 77, no. 2, pp. 1445–1465, Dec. 2023. doi: 10.32604/cmc.2023.040290. [Google Scholar] [CrossRef]
18. K. Dhibi, M. Mansouri, K. Bouzrara, H. Nounou, and M. Nounou, “An enhanced ensemble learning-based fault detection and diagnosis for grid-connected PV systems,” IEEE Access, vol. 9, pp. 155622–155633, Nov. 2021. doi: 10.1109/ACCESS.2021.3128749. [Google Scholar] [CrossRef]
19. Y. Huang et al., “A machine learning approach for dynamic optical channel add/drop strategies that minimize EDFA power excursions,” in Proc. ECOC, Dusseldorf, Germany, Sep. 18–22, 2016, pp. 1–3. [Google Scholar]
20. M. C. Tan, F. N. Khan, W. H. Al-Arashi, Y. Zhou, and A. P. T. Lau, “Simultaneous optical performance monitoring and modulation format/bit-rate identification using principal component analysis,” J. Opt. Commun. Netw., vol. 6, no. 5, pp. 441–448, May 2014. doi: 10.1364/JOCN.6.000441. [Google Scholar] [CrossRef]
21. S. A. A. El-Mottaleb, A. Métwalli, A. Chehri, H. Y. Ahmed, M. Zeghid and A. N. Khan, “A QoS classifier based on machine learning for next-generation optical communication,” Electron., vol. 11, no. 16, pp. 2619, Aug. 2022. doi: 10.3390/electronics11162619. [Google Scholar] [CrossRef]
22. Y. Cheng, S. Fu, M. Tang, and D. Liu, “Multi-task deep neural network (MT-DNN) enabled optical performance monitoring from directly detected PDM-QAM signals,” Opt. Express, vol. 27, no. 13, pp. 19062–19074, Jun. 2019. doi: 10.1364/OE.27.019062. [Google Scholar] [PubMed] [CrossRef]
23. T. Tanimura, T. Hoshida, T. Kato, S. Watanabe, and H. Morikawa, “Convolutional neural network-based optical performance monitoring for optical transport networks,” J. Opt. Commun. Netw., vol. 11, no. 1, pp. A52–A59, Jan. 2019. doi: 10.1364/JOCN.11.000A52. [Google Scholar] [CrossRef]
24. S. Shahkarami, F. Musumeci, F. Cugini, and M. Tornatore, “Machine-learning-based soft-failure detection and identification in optical networks,” in Proc. OFC Conf. Expo., San Diego, CA, USA, Mar. 11-15, 2018, pp. 1–3. [Google Scholar]
25. O. Nyarko Boateng, A. F. Adekoya, and B. A. Weyori, “Predicting the actual location of faults in underground optical networks using linear regression,” Eng. Rep., vol. 3, no. 3, pp. eng212304, Mar. 2021. doi: 10.1002/eng2.12304. [Google Scholar] [CrossRef]
26. P. J. Winzer, D. T. Neilson, and A. R. Chraplyvy, “Fiber-optic transmission and networking: The previous 20 and the next 20 years,” Opt. Express, vol. 26, no. 18, pp. 24190–24239, Sep. 2018. doi: 10.1364/OE.26.024190. [Google Scholar] [PubMed] [CrossRef]
27. B. Ghosh and S. Mandal, “Fiber bragg grating-based optical filters for high-resolution sensing: A comprehensive analysis,” Res. Opt., vol. 12, no. 12, pp. 100441, Jul. 2023. doi: 10.1016/j.rio.2023.100441. [Google Scholar] [CrossRef]
28. G. C. Amaral, J. D. Garcia, L. E. Y. Herrera, G. P. Temporao, P. J. Urban and J. P. V. D. Weid, “Automatic fault detection in WDM-PON with tunable photon counting OTDR,” J. Lightwave Technol., vol. 33, no. 24, pp. 5025–5031, Dec. 2015. doi: 10.1109/JLT.2015.2495518. [Google Scholar] [CrossRef]
29. A. Diop, I. Ngom, and I. Diop, “Fiber optic incidents detection and classification with yolo method,” in 2023 IEEE IC_ASET, Hammamet, Tunisia, Apr. 29–May 1, 2023, vol. 1, pp. 1–6. [Google Scholar]
30. F. N. Khan, T. S. R. Shen, Y. Zhou, A. P. T. Lau, and C. Lu, “Optical performance monitoring using artificial neural networks trained with empirical moments of asynchronously sampled signal amplitudes,” IEEE Photon. Technol. Lett., vol. 24, no. 12, pp. 982–984, Jun. 2012. doi: 10.1109/LPT.2012.2190762. [Google Scholar] [CrossRef]
31. J. Thrane, J. Wass, M. Piels, J. C. M. Diniz, R. Jones and D. Zibar, “Machine learning techniques for optical performance monitoring from directly detected PDM-QAM signals,” J. Lightwave Technol., vol. 35, no. 4, pp. 868–875, Feb. 2017. doi: 10.1109/JLT.2016.2590989. [Google Scholar] [CrossRef]
32. Z. Wan, Z. Yu, L. Shu, Y. Zhao, H. Zhang and K. Xu, “Intelligent optical performance monitor using multi-task learning based artificial neural network,” Opt. Express, vol. 27, no. 8, pp. 11281–11291, Apr. 2019. doi: 10.1364/OE.27.011281. [Google Scholar] [PubMed] [CrossRef]
33. D. Wang, C. Zhang, W. Chen, H. Yang, M. Zhang and A. P. T. Lau, “A review of machine learning-based failure management in optical networks,” Sci. China Inf. Sci., vol. 65, no. 11, pp. 211302, Nov. 2022. doi: 10.1007/s11432-022-3557-9. [Google Scholar] [CrossRef]
34. K. Abdelli, F. Azendorf, H. Grieser, C. Tropschug, and S. Pachnicke, “Gated recurrent unit based autoencoder for optical link fault diagnosis in passive optical networks,” in 2021 ECOC, Bordeaux, France, Sep. 2021, pp. 1–4. [Google Scholar]
35. K. Abdelli, C. Tropschug, H. Grießer, S. Jansen, and S. Pachnicke, “Branch identification in passive optical networks using machine learning,” in Proc. OFC Conf., San Diego, California, USA, Mar. 5–9, 2023, pp. M2G–4. [Google Scholar]
36. K. Abdelli, H. Griesser, and S. Pachnicke, “Convolutional neural networks for reflective event detection and characterization in fiber optical links given noisy OTDR signals,” in Proc. Photonic Netw., 22nd ITG Symp., Mar. 2021, pp. 1–5. [Google Scholar]
37. H. Song et al., “Experimental study of machine-learning-based detection and location of eavesdropping in end-to-end optical fiber communications,” Opt. Fiber Technol., vol. 68, no. 4, pp. 102669, Jan. 2022. doi: 10.1016/j.yofte.2021.102669. [Google Scholar] [CrossRef]
38. H. Song et al., “Machine-learning-based method for fiber-bending eavesdropping detection,” Opt. Lett., vol. 48, no. 12, pp. 3183–3186, Jun. 2023. doi: 10.1364/OL.487214. [Google Scholar] [PubMed] [CrossRef]
39. G. P. Agrawal, “Optical fibers,” in Fiber-Optic Commun. Sys., 4th ed. New York, USA: John Wiley & Sons, Feb. 2012, pp. 24–58. [Google Scholar]
40. K. Tsujikawa, K. Tajima, and M. Ohashi, “Rayleigh scattering reduction method for silica-based optical fiber,” J. Lightwave Technol., vol. 18, no. 11, pp. 1528–1532, Nov. 2000. doi: 10.1109/50.896213. [Google Scholar] [CrossRef]
41. M. Kihara, S. Tomita, and T. Haibara, “Influence of wavelength and temperature changes on optical performance of fiber joints with small gap,” IEEE Photonics Technol. Lett., vol. 18, no. 20, pp. 2120–2122, Oct. 2006. doi: 10.1109/LPT.2006.883256. [Google Scholar] [CrossRef]
42. M. Kihara, S. Nagasawa, and T. Tanifuji, “Return loss characteristics of optical fiber connectors,” J. Lightwave Technol., vol. 14, no. 9, pp. 1986–1991, Sep. 1996. doi: 10.1109/50.536966. [Google Scholar] [CrossRef]
43. W. C. Young, “Optical fiber connectors, splices, and jointing technology,” in C. Lin (Ed.Optoelectronic Technol. and Lightwave Commun. Syst., Dordrecht: Springer, 1989, pp. 155–174. doi: 10.1007/978-94-011-7035-2_6. [Google Scholar] [CrossRef]
44. K. Abdelli, F. Azendorf, C. Tropschug, H. Griesser, S. Pachnicke and J. Choo, “Dataset for optical fiber faults,” IEEE Dataport, Oct. 17, 2022. doi: 10.21227/pdpn-1b78. [Google Scholar] [CrossRef]
45. E. M. K. Reddy, G. Akash, V. B. Hasitha, and K. V. R. Kumar, “Introduction to naive bayes and a review on its subtypes with applications,” in Bayesian Reason. Gaussian Process. Mach. Learn. Appl., 1st ed. New York, USA: Chapman and Hall/CRC, 2022, ch. 1, pp. 1–14. [Google Scholar]
46. C. Y. J. Peng, K. L. Lee, and G. M. Ingersoll, “An introduction to logistic regression analysis and reporting,” J. Edu. Research., vol. 96, no. 1, pp. 3–14, 2002. doi: 10.1080/00220670209598786. [Google Scholar] [CrossRef]
47. D. A. Pisner and D. M. Schnyer, “Support vector machine,” in Machine Learning Academic Press, Jan. 2020, pp. 101–121. doi: 10.1016/B978-0-12-815739-8.00006-7. [Google Scholar] [CrossRef]
48. G. Guo, H. Wang, D. Bell, Y. Bi, and K. Greer, “KNN model-based approach in classification,” in On the Move Meaningful Int. Syst. 2003: CoopIS, DOA, and ODBASE: OTM Confed. Int. Conf., CoopIS, DOA, and ODBASE 2003, Catania, Sicily, Italy, Nov. 3–7, 2003, 2003, pp. 986–996. [Google Scholar]
49. L. Breiman, “Random forests,” Mach. Learn., vol. 45, no. 1, pp. 5–32, Oct. 2001. [Google Scholar]
Cite This Article
 Copyright © 2024 The Author(s). Published by Tech Science Press.
This work is licensed under a Creative Commons Attribution 4.0 International License , which permits unrestricted use, distribution, and reproduction in any medium, provided the original work is properly cited.
 Downloads
 Citation Tools