
 Submit a Paper
 Propose a Special lssue
 Open Access
ARTICLE

A Study on the Explainability of Thyroid Cancer Prediction: SHAP Values and Association-Rule Based Feature Integration Framework
1 Department of Computer Applications, Hindustan Institute of Technology and Science, Chennai, Tamil Nadu, India
2 Department of Computer Engineering, Hindustan Institute of Technology and Science, Chennai, Tamil Nadu, India
* Corresponding Author: Sujithra Sankar. Email:
Computers, Materials & Continua 2024, 79(2), 3111-3138. https://doi.org/10.32604/cmc.2024.048408
Received 06 December 2023; Accepted 29 February 2024; Issue published 15 May 2024
 View Full Text
 Download PDF
Abstract
In the era of advanced machine learning techniques, the development of accurate predictive models for complex medical conditions, such as thyroid cancer, has shown remarkable progress. Accurate predictive models for thyroid cancer enhance early detection, improve resource allocation, and reduce overtreatment. However, the widespread adoption of these models in clinical practice demands predictive performance along with interpretability and transparency. This paper proposes a novel association-rule based feature-integrated machine learning model which shows better classification and prediction accuracy than present state-of-the-art models. Our study also focuses on the application of SHapley Additive exPlanations (SHAP) values as a powerful tool for explaining thyroid cancer prediction models. In the proposed method, the association-rule based feature integration framework identifies frequently occurring attribute combinations in the dataset. The original dataset is used in training machine learning models, and further used in generating SHAP values from these models. In the next phase, the dataset is integrated with the dominant feature sets identified through association-rule based analysis. This new integrated dataset is used in re-training the machine learning models. The new SHAP values generated from these models help in validating the contributions of feature sets in predicting malignancy. The conventional machine learning models lack interpretability, which can hinder their integration into clinical decision-making systems. In this study, the SHAP values are introduced along with association-rule based feature integration as a comprehensive framework for understanding the contributions of feature sets in modelling the predictions. The study discusses the importance of reliable predictive models for early diagnosis of thyroid cancer, and a validation framework of explainability. The proposed model shows an accuracy of 93.48%. Performance metrics such as precision, recall, F1-score, and the area under the receiver operating characteristic (AUROC) are also higher than the baseline models. The results of the proposed model help us identify the dominant feature sets that impact thyroid cancer classification and prediction. The features {calcification} and {shape} consistently emerged as the top-ranked features associated with thyroid malignancy, in both association-rule based interestingness metric values and SHAP methods. The paper highlights the potential of the rule-based integrated models with SHAP in bridging the gap between the machine learning predictions and the interpretability of this prediction which is required for real-world medical applications.Keywords
In AI-driven modern healthcare, the integration of advanced machine learning techniques has brought forth a promising era of predictive modeling, offering the potential to revolutionise the early diagnosis and treatment of complex medical conditions. Thyroid cancer stands as a significant global health concern, necessitating precise and timely interventions. The estimated number of new cases of thyroid cancer in 2023 is 43,720, and the estimated number of deaths is 2,120 according to the American Cancer Society Cancer Statistics Centre [1]. In these statistics, an astounding 71% are estimated as female patients. While machine learning models have exhibited remarkable predictive performance in thyroid cancer detection, the complexity and opacity of these models pose a considerable challenge when it comes to understanding their decision-making processes. This paper deals with model interpretability in thyroid cancer prediction, with a primary focus on the application of SHapley Additive exPlanations (SHAP) values as a powerful tool for unraveling the black-box nature of these models [2]. In the following sections, the clinical significance of thyroid cancer, our novel contribution of the association-rule based feature integration framework, association-rule based feature-integrated model, and the potential of SHAP values to provide valuable insights into the decision-making processes of popular machine learning algorithms are discussed.
1.1 Thyroid Cancer Prediction with Machine Learning Models
The thyroid gland, a butterfly-shaped organ located at the base of the neck, plays a pivotal role in regulating various essential bodily functions through the secretion of thyroid hormones. These hormones, primarily thyroxine (T4) and triiodothyronine (T3) are responsible for controlling the body’s metabolism. They influence the rate at which cells use energy, help regulate body temperature, maintain heart rate, and influence other critical processes. Thyroid cancer arises when there is uncontrolled growth and division of abnormal thyroid cells. While most thyroid nodules are benign, the early detection of malignant thyroid nodules is crucial for effective treatment and improved prognosis. Hence, the development of accurate and reliable predictive models, often using machine learning algorithms, has gained prominence in identifying thyroid cancer at an early stage, facilitating timely intervention, and thus improving patient outcomes. Predictive models empower patients, contribute to public health planning, and stimulate ongoing research and development in the field of thyroid cancer. Machine learning predictive models offer diagnostic accuracy aiding healthcare professionals in making decisions. This paper explores thyroid cancer prediction using machine learning models, highlighting the significance of the explainable prediction of this disease.
1.2 Machine Learning Models and Explainability
Machine learning models have become indispensable tools in a wide range of applications, from healthcare to autonomous vehicles and natural language processing. The challenge of model explainability is an important concern when machine learning systems are deployed, especially in domains where transparency, accountability, and trust are most valued. SHAP values enhance the interpretability of machine learning models in the context of thyroid cancer diagnosis and prediction. Researchers have been actively developing techniques to enhance the interpretability of machine learning models, enabling users to understand how and why these models arrive at specific predictions or decisions. Explainability is vital for building trust with end-users, and finding potential biases in the AI model outputs. Thus, explainability is a very important part of AI models.
Conventional machine learning models, especially complex ones, face several challenges in terms of interpretability, and this is particularly crucial in the context of clinical decision-making. Some challenges and reasons why interpretability matters are: i) the complexity of the models; ii) the black box nature of the models; iii) the trade-off with accuracy, etc. The interpretability in clinical decision-making builds trust, aids patient understanding, addresses ethical concerns, ensures clinical actionability, facilitates regulatory compliance and allows for continuous improvement of machine learning models in healthcare. Our endeavor in this paper is to help understand the inner workings of AI algorithms in thyroid cancer prediction, with the help of SHAP values, and how it can be validated using an association-rule based feature integration framework.
1.3 Novelty: Association-Rule Based Feature Integration Framework
Association rule mining serves as a major functionality in data mining, employing algorithms such as the Apriori and its variants to uncover patterns and relationships within datasets. In our novel framework, association rule mining is integrated into disease prediction systems to enhance accurate and explainable predictions by machine learning models.
This novel association rule mining-rule based feature integration framework incorporates association rule mining algorithms on the database. The association rules mined highlight attributes that frequently appear in the database along with the label of malignancy or benignancy. Subsequently, interestingness metrics analysis is conducted on this knowledge base derived through association rule mining, and dominant features and feature sets are identified. AI models are trained on this original database, and SHAP values of explainability are also generated with these models. The SHAP values associated with the features are compared with the association-rule interestingness metric values such as support, confidence, lift, leverage, and conviction values of these features. Thus, dominant features identified through both methodologies get mutually validated.
In the next phase, the dominant features identified through association-rule based interestingness metric analysis are integrated with the original database and this new integrated dataset is used in re-training the machine learning models. The performance metrics of the models show a good improvement in accuracy and other metrics. This framework also helps us validate the feature ranking. By explicitly incorporating these association rules into training models, and by generating new SHAP explanations with these models, we could gain insights into the model’s reliance on rule-based relationships. This novel study enhances the validation of SHAP values through the integration of an association-rule based framework by leveraging additional domain-specific knowledge encoded in association rules. Our proposed framework contributes to the robustness and reliability of the interpretation and validation process in the context of thyroid cancer prediction.
In recent years, the focus has intensified on the interpretability of machine learning models. Explainable AI (XAI) has emerged as a critical area, to interpret complex models and enhance their transparency. Significant research has been done on the integration of SHAP values, a method providing insightful explanations for model predictions, thereby bridging the gap between model complexity and interpretability.
2.1 Explainability in Clinical Decision Support Systems
In 2016, Ribeiro et al. [3] proposed Local Interpretable Model-Agnostic Explanations (LIME), an innovative explanation method designed to elucidate predictions from any classifier in a way that is both understandable and faithful. This is achieved by constructing an interpretable model locally around the prediction. SHAP, developed by Lundberg et al. [4], is a technique designed for explaining individual predictions in machine learning. It relies on Shapley values, which are optimal in the context of game theory, to provide comprehensive explanations for the contributions of each feature to a particular prediction.
In 2022, researchers Du et al. [5] developed an interpretable clinical decision support system (CDSS) using explainable machine learning to identify women at risk who require targeted pregnancy interventions. The machine learning models were elucidated through SHAP explanations, enhancing the credibility and acceptability of the system. Various models were devised for diverse use cases and implemented as a publicly accessible web server for academic purposes. This interpretable CDSS showcases its potential to aid clinicians in screening and identifying at-risk patients.
In another study conducted in 2023, Naiseh et al. [6] conducted an empirical study to evaluate four eXplainable artificial intelligence (XAI) classes for their impact on trust calibration. The study took clinical decision support systems as a case study and the findings are presented as guidelines for designing XAI interfaces.
In 2022, a study by Panigutti et al. [7] demonstrated XAI applicability to explain a clinical DSS and designed the prototype of an explanation user interface. They tested the prototype with healthcare providers collected their feedback, and obtained evidence that explanations increase users’ trust in the XAI system, and they achieved useful insights on the perceived deficiencies of healthcare professional’s interaction with the system.
In research conducted in 2022 by Amann et al. [8], the analysis focused on three dimensions: Technical aspects, human elements, and the specific system role in decision-making. Results indicate that explainability can enhance the utility of Clinical Decision Support Systems (CDSS), contingent on factors like technical feasibility, validation levels for explainable algorithms, contextual characteristics, the assigned role in decision-making, and the primary user group(s).
2.2 Explainability in Thyroid Disease Predictions
In a study conducted by Aljameel [9] in 2022, a model of an explainable artificial neural network (EANN) was created to differentiate between benign and malignant nodules while uncovering the predictive factors associated with malignancy. Wang et al. [10] developed a diagnostic model in artificial intelligence (AI) using a combination of deep learning and ensemble learning methods with multiple risk features. The AI diagnostic model demonstrated partial interpretability by providing identified risk features as output.
In a similar study in 2023, Hossain et al. [11] identified the top-performing model and the features exerting the most influence on classification through eXplainable artificial intelligence (XAI). The diverse algorithmic performances indicate that each algorithm excelled under specific conditions, whether utilising a subset or the complete set of features. They concluded that most instances have been classified as hypothyroid based on the features TSH, T3 TT4. They also identified that the FTI and T3 test values are important for the hyperthyroid class.
In a study in 2022, Arjaria et al. [12] used a widely adopted SHAP method, which was grounded in coalition game theory, to interpret the outcomes. This study elucidates the system’s behavior on both local and global scales, demonstrating how machine learning can discern the causality of diseases. Additionally, it aids healthcare professionals in recommending optimal treatments. The research not only showcases the outcomes of machine learning algorithms but also provides insights into feature importance and model explanations.
Another study in 2022 conducted by Hosain et al. [13] used Explainable Artificial Intelligence (XAI) architectures LIME and SHAP, to interpret the model’s decision in a comprehensive manner to address the ‘Black Box’ issue of machine learning. In another study in 2022, Jin et al. [14] introduced a SHAP-based interpretation of Thy-Wise which enables clinicians to better understand the reasoning behind the diagnosis, which may facilitate the clinical translation of this model.
In a major research paper in 2023, Nguyen et al. [15] proposed new statistic-based XAI methods, namely Kernel Density Estimation and Density map, to explain the case of no nodule detected. XAI methods’ performances are considered under a qualitative and quantitative comparison as feedback to improve the data quality and the model performance. Finally, we survey to assess doctors’ and patients’ trust in XAI explanations of the model’s decisions on thyroid nodule images.
2.3 Association Rule Mining in Disease Predictions
Many studies have been conducted on employing association rule mining in feature selection and classification. Sarno et al. [16] employed expert verification to utilise association rule mining itemsets for generating both positive and negative association rules. These rules were then applied for compliance testing on the testing dataset. Ogunde et al. [17] developed novel association rule mining algorithms tailored for distributed databases to enhance the overall response time of the distributed association rule mining system. Kaoungku et al. [18] investigated association rule mining within the context of feature selection. Wang et al. [19] utilized an association rule mining algorithm in business scenarios. In 2020, Li et al. [20] proposed a thyroid disease knowledge discovery and diagnosis framework AR-ANN, which integrates association rule mining and artificial neural networks to select the most frequent features to reduce the dimensions and to diagnose thyroid diseases.
3.1 Association Rule Mining and Interestingness Metrics Analysis
In the proposed framework, association rule mining algorithms, Apriori, and FPgrowth [21,22] are used to extract interesting association rules from the thyroid cancer dataset. Association rules generated are sorted with rules on class (malignant and benign) labels. The selected association rules are considered for the next step. In the next step, interestingness of a rule are computed using Lift, Leverage, and Conviction. Attributes are ranked according to their interestingness metric values with malignant as well as benign labels. The attributes that have got higher ranking in the association-rule based interestingness metric analysis are termed the dominant features/attributes for that label. The effectiveness of association rule mining relies on the characteristics and composition of the dataset.
Let D be the dataset, then support count is computed as the occurrences of a specific itemset (e.g., {A, B}) in the dataset, as given in Eq. (1). If the frequency surpasses or equals the minimum support (min_support), the item is termed a frequent k-itemset, where k represents the number of items in the itemset or set of attributes. Confidence of an itemset {A} implied on {B}, is the co-occurrence frequency of {A} and {B} in transactions solely containing the itemset {A}, as shown in Eq. (2). The rule based interestingness metrics of confidence, lift, leverage, and conviction are applied to each association rule to identify strongly associated attributes to select relevant and interesting association rules. Lift measures the ratio of the observed co-occurrence of items to the expected co-occurrence, if the items were independent as shown in Eq. (3). A lift value greater than 1 indicates a positive association, suggesting that the occurrence of one item increases the likelihood of the occurrence of the other. Eq. (4) quantifies the significance of lift in the identification of relevant association rules.
For the rule A ⇒ B:
Leverage measures the difference between observed and expected co-occurrence as shown in Eq. (5).
A leverage of 0 suggests independence, while positive values indicate a tendency for items A and B to co-occur more frequently than expected. Conviction assesses the dependency of item A on the absence of item B and is given by Eq. (6).
A conviction value of 1 implies independence, with higher values indicating stronger dependence between items A and B.
SHapley Additive exPlanations (SHAP) is a powerful method for model interpretability, offering a comprehensive understanding of feature contributions. By leveraging concepts from cooperative game theory [2], SHAP values allocate the overall model prediction to individual features. Each feature is assigned a SHAP value, representing its impact on the model’s output. These values facilitate an interpretation of how each predictor contributes to specific predictions, promoting transparency and trust in complex models.
The Shapley value of feature i is calculated in the given Eq. (7):
where, N is the total number of features,
S denotes any subset of features that excludes the i-th feature,
∣S∣ is the magnitude of that particular subset, and
fx () symbolizes the predictive function employed by the model.
∣S∣! represents the count of possible arrangements of feature values that precede the ith feature value. Similarly, (∣N∣−∣S∣−1)! represents the count of possible arrangements of feature values that follow the ith feature value. The term in the equation that involves the difference is indicative of the incremental contribution resulting from the inclusion of the ith feature value to the set S. This formula represents the average marginal contribution of feature i across all possible combinations of features in the model. Each term in the summation corresponds to a specific subset S of features, and the calculation involves the value of the model prediction for the union of S and i minus the value for S. The coefficients in the formula ensure a fair distribution of the overall prediction value among the features.
3.3 Our Proposed Algorithm for Association-Rule Based Feature-Integrated Model and SHAP Values Generation
Input:
D: Dataset of thyroid cancer.
f: Preprocessing function for converting text data to numerical features.
M: Machine learning model trained on processed data.
R: Set of association rules mined from D with minimum support σ and confidence γ.
φ: Function that encodes each rule in R as a binary feature vector.
H: Matrix where each row represents a tuple in the dataset, and each column represents a rule-based feature. It is a matrix that encodes the application of association rules to each tuple.
hr(d): A function that determines whether a specific association rule (r) applies to a given tuple (d).
Output:
S: Matrix of SHAP values for all features, including association rule features.
w: Vector of weights for each feature based on SHAP values.
Steps:
Step 1: Preprocessing
Convert categorical data in D into binary form using the preprocessing function f.
Create a feature matrix (X) and a label vector (y) from D.
Step 2: Interestingness Metric Calculation and Association Rule Encoding
Calculate support (σ), confidence (γ), and Lift for each association rule in R.
Support of a rule r:
Confidence of a rule r:
Lift of a rule r:
For each rule r in R, and each tuple d in D:
Encode rule as binary feature using function φ.
Create a matrix (H) where rows represent tuples, and columns represent rule-based features.
Step 3: Feature Space Expansion
Combine the original feature matrix (X) with the rule-based feature matrix (H) to create an expanded feature matrix (X′).
X′ = [X, H].
Step 4: Model Training
Train the machine learning model M on the expanded feature matrix (X′) and label vector (y).
Step 5: SHAP Calculation
For each tuple d:
Sd = SHAP (M, X′d, d)
For SHAP value calculation, refer Section 3.2 Eq. (7).
Store SHAP values in matrix S.
Step 6: Feature Ranking
Calculate average SHAP value for each feature j across all tuples:
for all tuples d in D and i = 1,..., N where N is the number of tuples.
Assign weights to features based on the calculated SHAP values. Features with high SHAP values and large weights are identified as key contributors to accurate diagnosis.
Fig. 1 shows the complete workflow of our proposed framework. In phase 1: Thyroid cancer dataset pre-processing and feature extraction; phase 2: association rule interestingness metric analysis; phase 3: Machine learning models trained on the original dataset; phase 4: Predictions generation by baseline models; phase 5: Explainer object creation from baseline model; phase 6: Explainability in terms of SHAP values of features; phase 7: Generation of association-rule based metric values; integration of rule-based features with dataset and re-training of models; the SHAP values generation for the re-trained model. Feature ranking validation is carried out by comparing association-rule based interestingness metric ranks and SHAP values. The following Sections 3.4 till 3.11 elaborate on each phase of the workflow of our proposed framework.
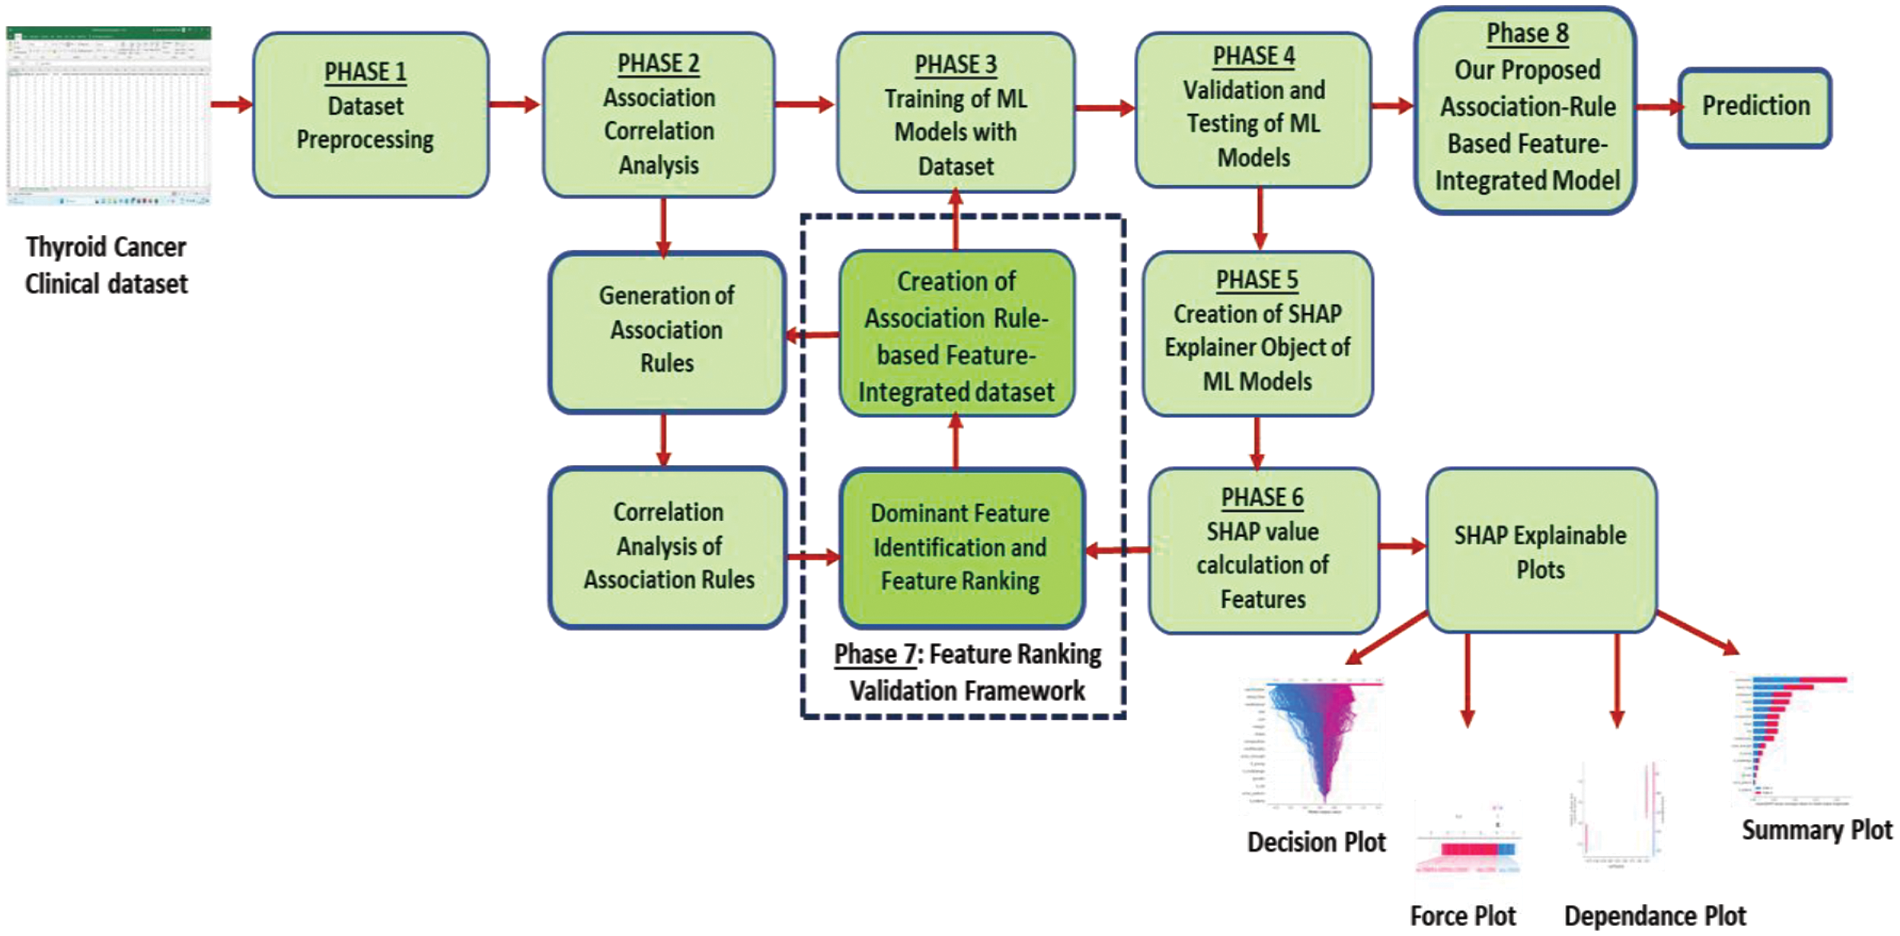
Figure 1: Our proposed association-rule based feature integration framework with SHAP explainability validation
To initiate the process, the first step involves the procurement of relevant training, testing and prediction datasets. The thyroid_clean clinical dataset containing thyroid cancer data is used in this study. The original dataset contains data on 1232 nodules from 724 patients. There are 18 attributes and 1 label in the original dataset.
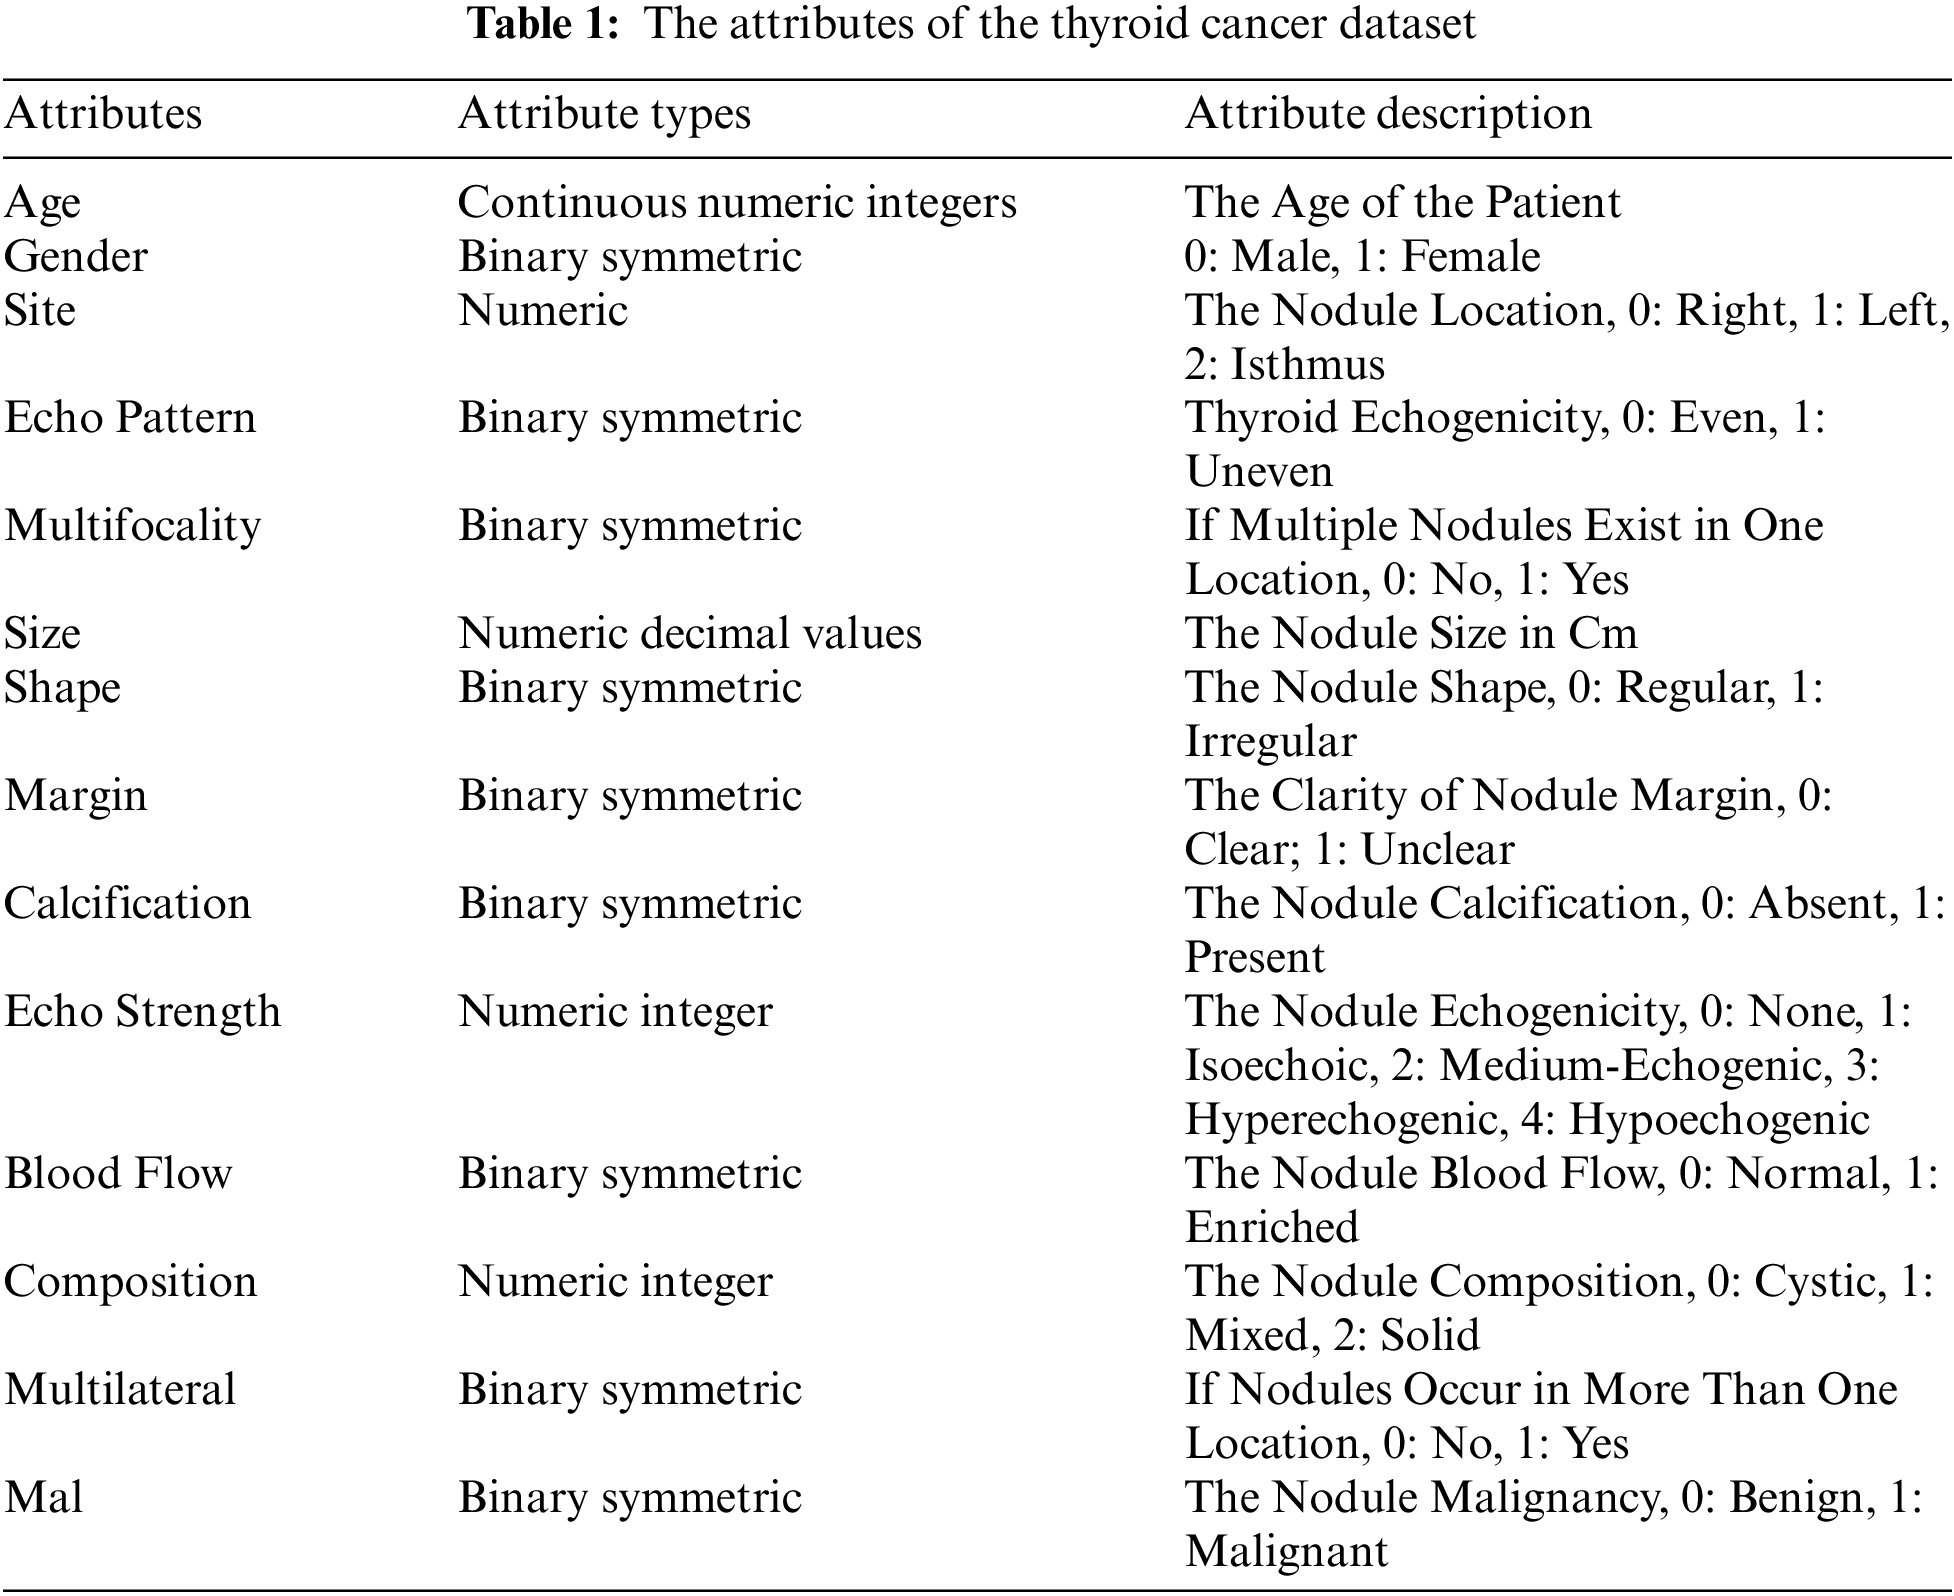
The thyroid_clean.csv open-access dataset used in this study is available online [23]. In this dataset, 413 (33.5%) are benign nodule tuples and 819 (66.48%) are malignant nodule data. Table 1 shows the attributes and the label of the dataset which are included in this study.
The dataset is used in generating association rules and then used in training to generate SHAP values. The dataset is subdivided horizontally and the same operations are performed on each subset to yield results for cross-validations. A prediction dataset is also prepared from the original thyroid cancer dataset which is not used in training or testing.
3.5 Phase 1: Data Preprocessing
The data pre-processing of the dataset is initially undertaken before the training of the machine learning model. Several steps are taken to clean, transform, and prepare the data for analysis or modeling. The original number of attributes was 18. After the preprocessing steps, it is changed to 29 binary symmetrical attributes and a single label.
The data pre-processing steps undertaken for the dataset are given below.
Missing values are handled by imputing or removing missing data. Outliers are identified and addressed.
3.5.2 Normalisation or Standardisation
Numerical features are scaled to a standard range to ensure that they contribute equally to the analysis. Categorical variables are converted into numerical values using techniques like one-hot encoding. For example, composition, echogenicity, margins, etc., are attributes with categorical multiple-domain values. Each domain value of the attribute is converted into a symmetric binary value column.
New relevant features are created from existing ones that might enhance the model’s performance. For example, the attribute age in the dataset having continuous numerical values is binned concerning the value range. Thus, we created new categorical domain values such as young, middle-aged, old, and elderly. Further, this attribute is converted to multiple columns of symmetric binary values. Similarly, the size of the nodule is another attribute that was feature-engineered to create bucketed values and eventually symmetric binary values as per the advice received from the domain experts.
The size of the nodule in cm is a very relevant attribute in thyroid cancer prediction. The original domain values of decimal are initially converted to integer buckets ranging from 0 to 5 as follows:
0.0–0.5 cm → Bucket 0
0.6–0.9 cm → Bucket 1
1.0–1.4 cm → Bucket 2
1.5–2.4 cm → Bucket 3
2.5–3.9 cm → Bucket 4
4.0–> 4 cm → Bucket 5
Finally, these values are converted to 6 new binary symmetric columns.
3.5.4 Dealing with Imbalanced Classes
Since there is an imbalance in the distribution of benign and malignant classes, oversampling techniques such as duplicating instances from the minority class using techniques like Synthetic Minority Over-sampling Technique (SMOTE) are employed. Benign class labels are a minority in the dataset. So SMOTE technique is used to make a balanced dataset.
3.6 Phase 2: Association-Rule Interestingness Metric Analysis
3.6.1 Generation of Association Rules
The original dataset is used to generate relevant association rules with the Apriori algorithm or FP Growth algorithm. The relevant association rules for benign as well as malignant labels are generated.
3.6.2 Interestingness Metric Analysis of Association Rules
In this step, association rules for benign and malignant labels are identified and ranked with metrics such as Confidence, Lift, and Conviction. Further, metrics of associated attributes are calculated to filter only high-ranking and relevant attributes with only the malignant label as consequent. See Section 3.1for more details.
3.7 Phase 3: Training of Machine Learning Models
During this phase, the dataset is divided into training, validation, and testing sets for model training. Popular machine learning models such as Random Forest (RF), eXtreme Gradient Boosting (XGB), Decision Tree, Support Vector Machine (SVM), k-Nearest Neighbours (KNN), etc., are trained using the original dataset to learn patterns and relationships within the dataset.
3.8 Phase 4: Testing and Validation of Machine Learning Models
After successful training, the trained models are validated on the validation dataset and make predictions on the test dataset. Metrics like accuracy, precision, specificity, sensitivity, and F1-score are calculated to evaluate the model performance. Decision Tree Classifier has achieved a good 93.0% accuracy with the baseline model. Decision Tree also showed good performance concerning other performance metrics such as precision, sensitivity, specificity as well as F1-score.
3.9 Phase 5: Creation of Explainer Objects of Machine Learning Models
Explainer objects are created to shed light on the inner workings of machine learning models. The SHAP explainer objects are created using the trained machine learning models of Decision Tree, Random Forest, XGB, etc.
3.10 Phase 6: SHAP Value Calculation of Features
The SHAP values are extracted from the explainer objects. It gives a clear understanding of the contribution of each feature to individual predictions. The SHAP explainer plots such as summary plots, force plots, and waterfall plots are generated with the extracted SHAP values. See Section 3.2 for more details.
3.11 Phase 7: Feature Ranking and Validation Framework
By validating feature ranking derived from association rule mining with SHAP values, we are essentially trying to do a mutual assessment of the feature ranking obtained through two different methods. The feature ranking obtained by association rule-interestingness metric analysis validates the importance of dominant features found through SHAP values. The steps of this validation process are given below.
3.11.1 Dominant Feature Identification and Feature Ranking
The SHAP values of machine learning models are obtained from phase 6. The features with top SHAP values are selected from this phase. The association rule-interestingness metric analysis generates the association-rule based ranks for features, as shown in phase 2. The top-ranked features generated through the association-rule based analysis are also selected. To create a robust feature ranking, weights are assigned to both SHAP and association rule interestingness metric rankings. Dominant features are identified and ranked using both methods.
3.11.2 Creation of Association-Rule Based Feature-Integrated Dataset
This is a crucial step in our framework. In this step, high-ranking or dominant features which are identified through association-rule interestingness metric analysis and validated through the SHAP values, are integrated into the original dataset. This integration process ensures that features deemed important by both methods contribute synergistically to the overall predictive power of the model. Cross-validation is implemented to ensure robustness in results. The dataset is split horizontally into multiple subsets. Association rule mining and subsequent interestingness metric analysis is applied to these subsets. Cross-validation involves using association rules as additional features within SHAP explanations.
Only the rules with high support and confidence values are selected for this step, indicating statistically significant relationships between features. Each rule is represented as a binary feature. For a given data instance, the feature value is 1 if the rule applies to the instance, and 0 otherwise. Machine learning models are re-trained on this dataset, with the newly integrated features representing association rules. SHAP values for all features, including the association rule features are generated with these models and analysed. These values indicate how much each rule contributes to the model’s predictions for individual instances. The magnitude and sign of the SHAP values are analysed to understand the direction and strength of the rule’s influence on the model’s decision-making. The effect of the presence or absence of specific rules on the model’s predictions for individual cases is analysed.
3.12 Phase 8: Our Proposed Association-Rule Based Feature-Integrated Model
Phases 3, 4, 5, 6, and 7 are repeated to obtain the highest prediction accuracy. Various combinations of association rule feature sets are used in integrating into the dataset. Then the machine learning model is re-trained on this dataset. The model is again validated and tested. The SHAP values are generated using this new integrated model. The feature weights are compared. The dataset can be integrated with newly found relevant feature sets. These steps are repeated until there is no change in relevant feature sets and model prediction accuracy. Thus, the final prediction is obtained. This is our proposed association-rule based feature-integrated model. The final prediction is obtained through this model.
Input from domain experts is employed to validate the importance of features identified by both methods. Domain knowledge provides valuable context and helps interpret discrepancies. As per the radiologists, endocrinologists, and oncologists consulted, the Thyroid Imaging Reporting and Data System (TI-RADS) score [24] is a standard followed in assessing the malignancy of thyroid nodules. TI-RADS employs five ultrasound features of thyroid nodules: Composition, echogenicity, shape, margin, and punctate echogenic foci (calcification attribute in the thyroid dataset). Each feature is assigned a score, and the total points determine the TI-RADS level, with corresponding recommendations. A TI-RADS level of 2 is not suspicious, and 3 is mildly suspicious. A score of 4–6 is TI-RADS level 4 and is moderately suspicious. A score of 7 points or more is TI-RADS level 5, which indicates a highly suspicious or malignant nodule. Nodules under 5 mm generally do not require follow-up, even if categorised as TI-RADS 5, as their likelihood of becoming clinically significant malignancies is very low. Thus, the five ultrasound features mentioned above play a major role in determining the malignancy of a thyroid nodule.
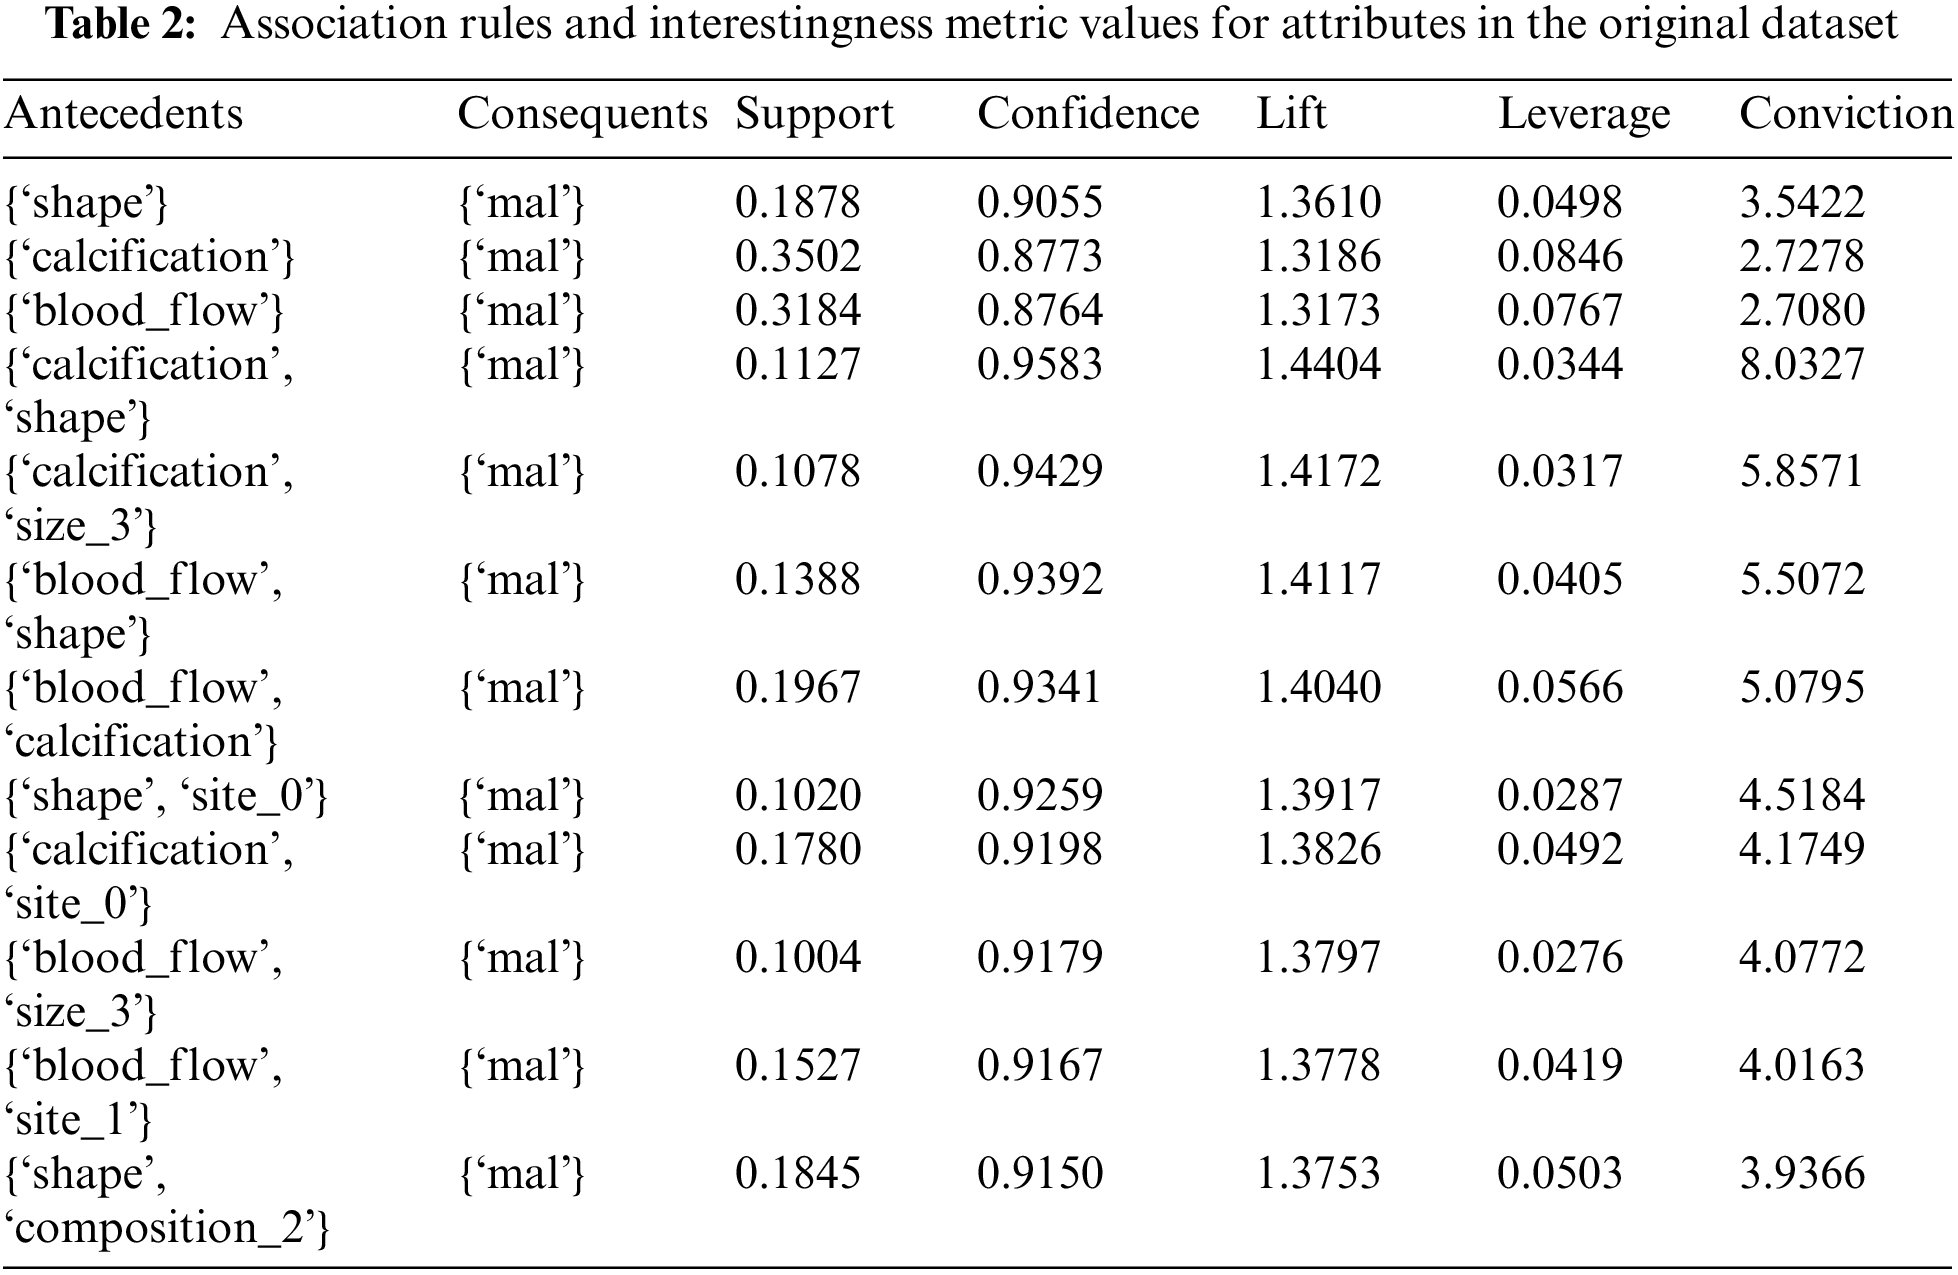
Association rules mined from the thyroid cancer dataset give valuable insights into the attributes and their relationships. Table 2 shows the relevant association rules of various feature sets with malignancy as the consequent, and various interestingness metrics of attribute sets such as support, confidence, lift, leverage, and conviction. The attribute sets with only the top metric values are tabulated, which shows the dominant features in the original dataset.
4.1 Making Sense of Association Rules and Interestingness Metric Values
The first association rule from the above table, Table 2 can be written as
Rule: {‘shape’} ⇒{‘mal’}
The terms and values of association rules are interpreted with the first rule are as follows:
Antecedents are the items that are present or known (e.g.: ‘shape’ in the first rule).
Consequents are the items that are predicted to occur based on the presence of antecedents (e.g., ‘mal’ for malignancy).
Support is the proportion of transactions that contain both the antecedent and consequent. It is 0.188, meaning both ‘shape’ and ‘mal’ appear together in about 18.8% of the transactions.
Confidence measures how often the rule is true. In this case, the rule shape → mal is true about 90.6% of the time.
The interestingness metric values of the framework are as follows:
Lift measures how much more likely the consequent is, given the antecedent, compared to its likelihood without the antecedent. A lift of 1 means no association; a lift greater than 1 indicates a positive association. A value of 1.361 suggests a positive association.
Leverage measures the difference between the observed frequency of antecedent and consequent occurring together and the frequency expected if they were independent. A value of 0.050 indicates a positive impact.
Conviction is a measure of how much the consequent relies on the antecedent. A higher conviction value means the consequent is highly dependent on the antecedent. A value of 3.542, suggests a strong dependence of ‘mal’ on ‘shape’.
4.2 Making Sense of SHAP Values
Since the feature values of our dataset are binary, explaining the impact of each feature on the model’s prediction using SHAP values becomes more straightforward. In our experiments, we have used binary labels, malignancy (1) and benignancy (0).
The sign and magnitude of the SHAP values for each feature indicate the impact of the presence or absence of that feature on the model’s prediction for malignancy or benignancy. If the SHAP value for a feature is positive, it indicates that the presence or an increase in that feature is associated with a higher prediction of malignancy (1). If the SHAP value for a feature is negative, it means that the absence or a decrease in that feature is associated with a higher prediction of benignancy (0). In our SHAP plots, the SHAP value for the calcification feature is strongly negative, it suggests that the absence or lower presence of calcification is associated with a higher likelihood of benignancy (0). The sign of the SHAP values provides information about the direction of the impact (positive or negative), and the magnitude indicates the strength of that impact.
To experiment with and evaluate our proposed framework, we employed a dataset named thyroid_clean. This dataset is available at the Zenodo repository [23], for research activities.
The thyroid cancer dataset is first preprocessed using various data pre-processing steps mentioned in Sections 3.5. Thus, the dataset is prepared as a completely binary encoded dataset to apply association rule mining. After the association rule-interestingness metric analysis, dominant attributes concerning malignant labels are identified.
A total of 16828 association rules are generated by the application of frequent item set mining algorithms on the thyroid cancer dataset. The label of the dataset is malignant/benign. To reduce the huge number of rules to relevant and interesting ones, first, the association rules are filtered with the consequent fixed as malignant. Thus, 210 rules are shortlisted as interesting rules. From the remaining rules, only those rules with threshold values of confidence >0.7 and lift value >1.3 are retained. Thus, interestingness metric values are used in the selection of association rules. Single-value antecedents are also included to proceed further. Thus 25 strong association rules are selected after interestingness metric analysis.
The dataset is used in the training, validation, and testing of various machine learning models such as SVM, XGB, KNN, DT, and RF. The model prediction accuracy for Decision Tree is found to be the highest with more than 90%. Decision tree SHAP values are analysed throughout our experiment. The models are used in creating SHAP explainer objects. SHAP values of features are generated with the explainer objects. To validate the SHAP values, we compare the features discovered through SHAP values with the features identified through the association-rule based framework. For this comparison study between values obtained through two different methodologies, we have used various plots to visually represent both values.
Furthermore, the thyroid cancer dataset is integrated with association rule-based feature sets and horizontally divided into multiple subsets. Association rule-based metric values and SHAP values are generated with each subset and compared using feature ranking analysis. The association-rule based feature-integrated models are created by training various machine learning models on association-rule-integrated dataset. These models show improved prediction accuracy. Decision Tree model achieved 93.48% accuracy when trained on association-rule-integrated dataset.
We computed various performance metrics for each model, including accuracy, area under the receiver operating characteristic (AUROC), sensitivity, specificity, and precision. Accuracy reflects the ratio of correct predictions to the total nodules in the dataset. The AUROC assesses the overall diagnostic capability of a binary predictive model across different discrimination thresholds. Sensitivity signifies the proportion of correctly identified malignant nodules, while specificity denotes the proportion of accurately predicted benign nodules. Precision is the ratio of true malignant nodules among those predicted as malignant. These metrics collectively offer a comprehensive overview of the diagnostic effectiveness of the predictive models.
The proposed framework is developed using Python version 3.10 in Google Colab. For association-rule based feature integration framework, various Python libraries including pandas, numpy, scikit-learn, seaborn, matplotlib, etc., are used. Google Colab Pro with mlxtend library as well as Weka [25,26] are employed in the experiments. Mlxtend library [27] was designed and shared by Sebastian Raschka and it is a very popular association rule mining library used with Python.
For SHAP value calculations, python shap libraries are used. All experiments are carried out in Google Colab Pro with V100 GPU and high RAM.
4.5 Feature Ranking and Validation Framework
In association-rule based feature integration framework, the maximum number of iterations, support, confidence, and lift are respectively set to a threshold of 1000, 0.5, 0.7, and 1.3. The most dominant attributes with significance to the malignant label are found to be calcification, shape, margin, gender, blood flow, size, and site using the original dataset. The top association rules with corresponding interestingness metrics for the complete dataset are presented in a suitable bar diagram as shown in Fig. 2.
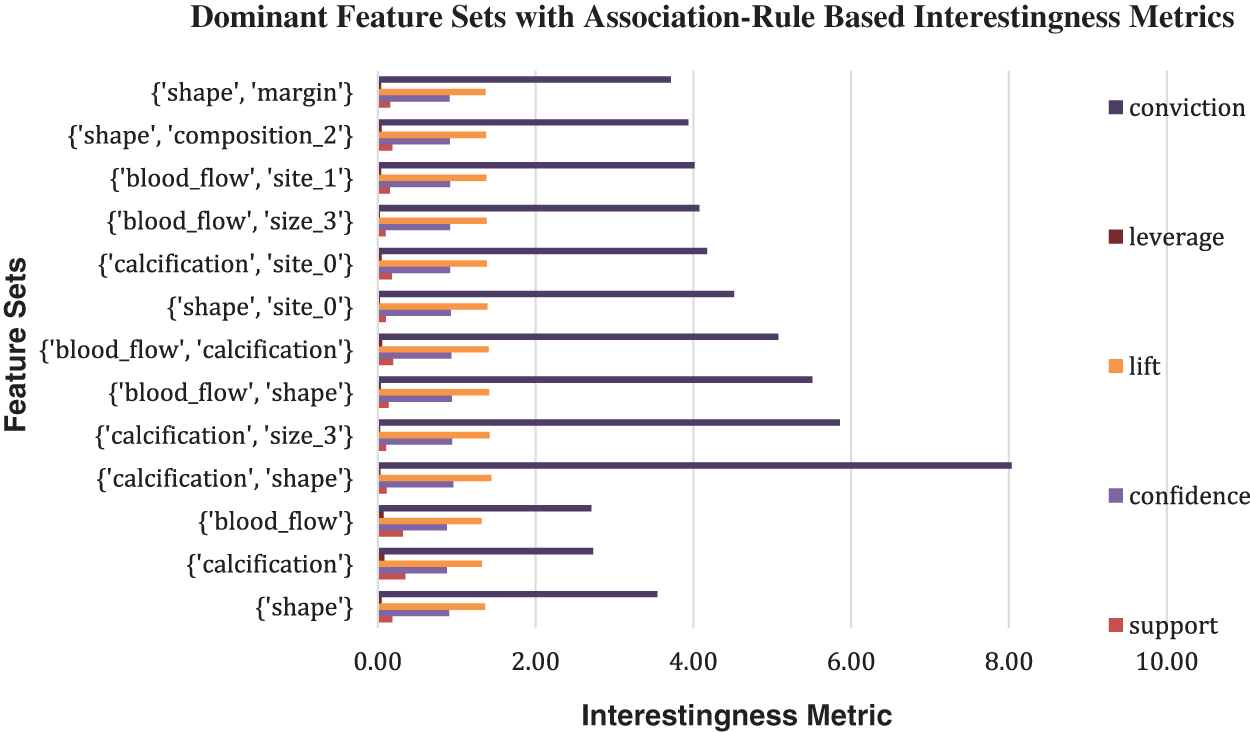
Figure 2: Bar chart of association rules-Based Interestingness Metrics values with label malignant as consequent generated for the original dataset
Shapley values offer a powerful tool for interpreting the impact of different attributes on thyroid cancer model predictions. By attributing a share of the prediction to each attribute, SHAP values highlight the significance of individual features in determining the outcome [28]. The average SHAP values of all features, generated by the model developed in the complete dataset, are presented in a suitable bar diagram as shown in Fig. 3. The SHAP explainability plots show that shape, calcification, blood flow, and margin are the major contributing attributes to model prediction.
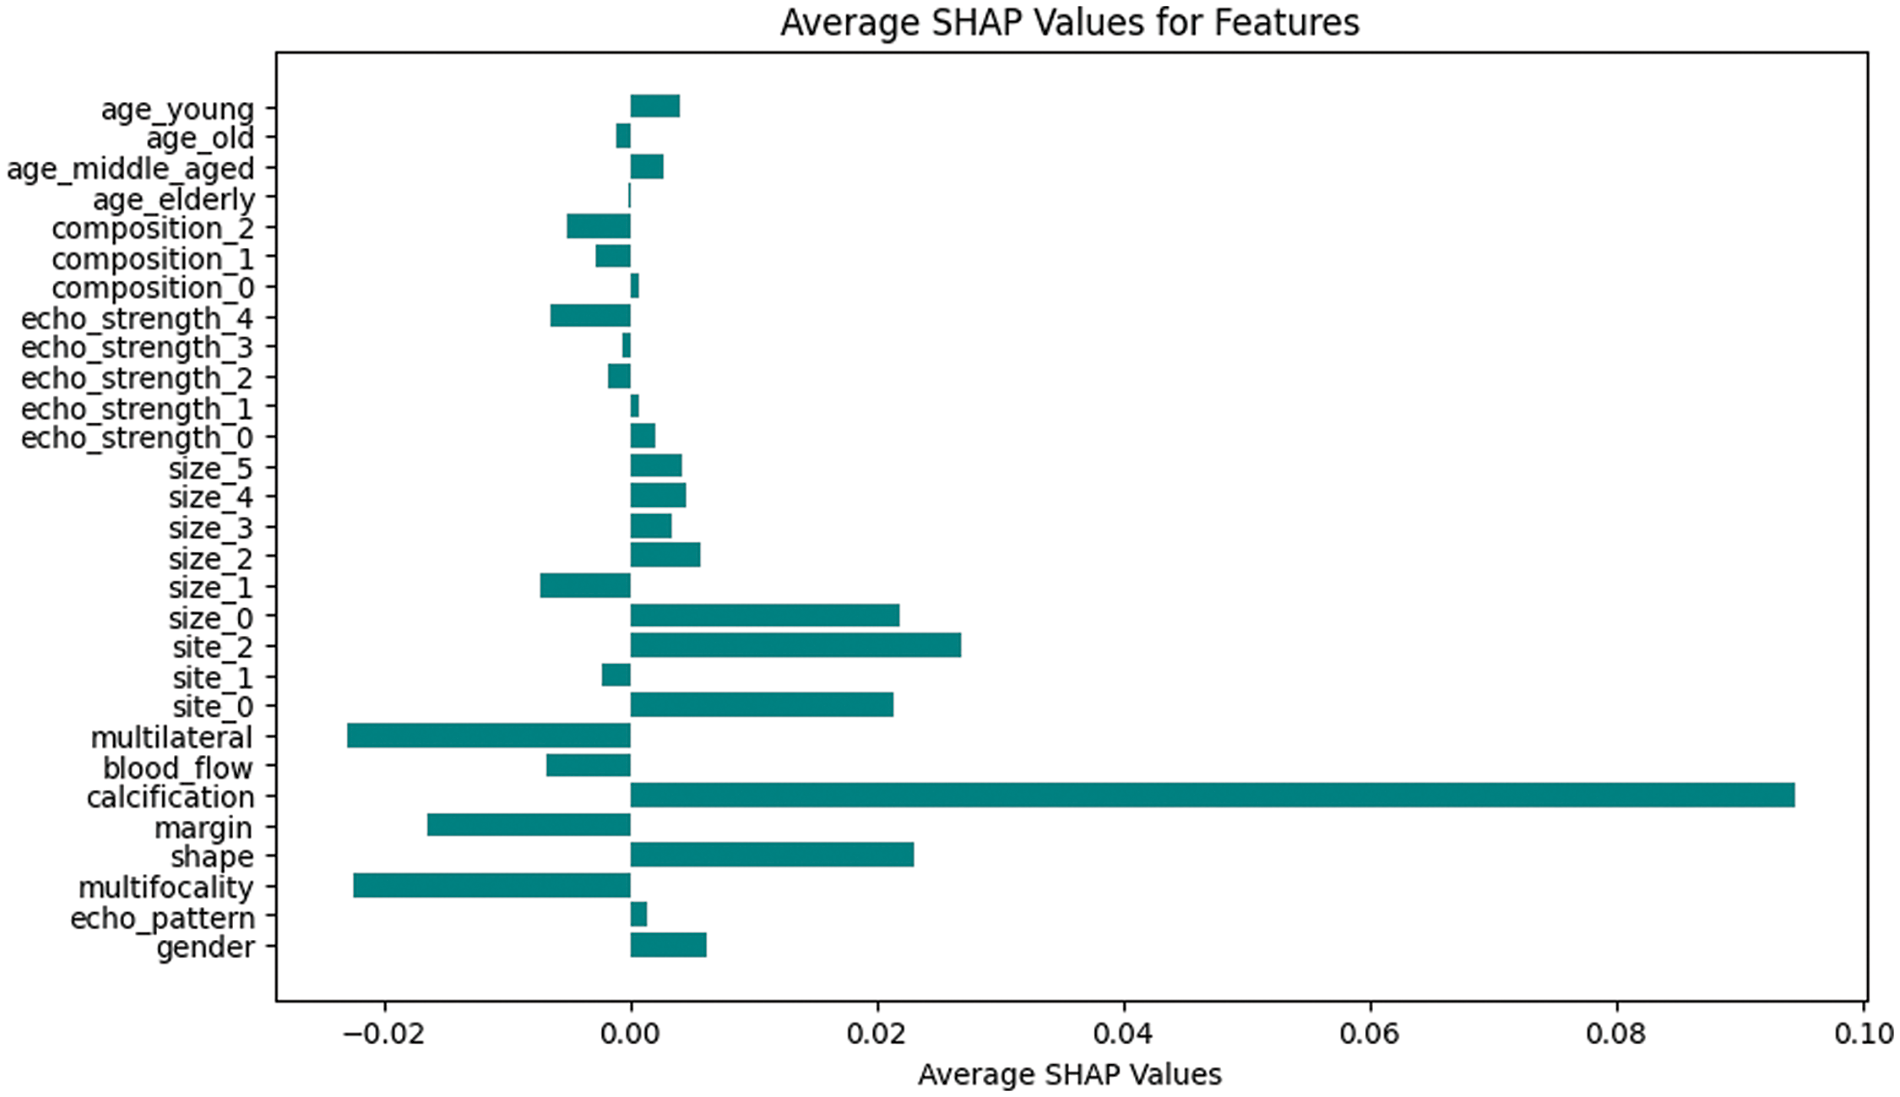
Figure 3: Bar chart of average SHAP values for malignant prediction for original dataset
In the initial phase of the experiment, the dominant features associated with malignancy are identified using an association-rule based framework applied to the original thyroid cancer dataset. The feature sets identified are: {calcification}, {shape}, {blood_flow}, {calcification, shape}, {calcification, size_3}, {blood_flow, shape}, {blood_flow, calcification}, {shape, site_0}, {calcification, site_0}, {blood_flow, size_3}. These features show high confidence and lift values. Refer to Table 2. Average SHAP values of features generated from various ML models trained on the same thyroid cancer dataset are compared with these association-rule based feature sets.
The SHAP values of features generated with the original dataset can be found in Fig. 3. The features associated with the highest SHAP values are found to be {calcification}, {shape}, {size_0}, {site_2}, and {site_0}. They are found to have a positive impact on malignancy prediction. The features {Multifocality, {Multilateral}, {margin}, {blood_flow}, and {size_1} shows negative impact on malignancy prediction. It means that the absence or decrease in those features is associated with a higher likelihood of prediction of benignancy. This can also be interpreted as the presence or increase in this feature might be associated with malignancy. Thus, features obtained through association rule interestingness metric analysis play major roles in the prediction of a malignant case according to SHAP values. Fig. 4 shows various SHAP plots with significant attributes with malignancy prediction with the original thyroid cancer dataset.
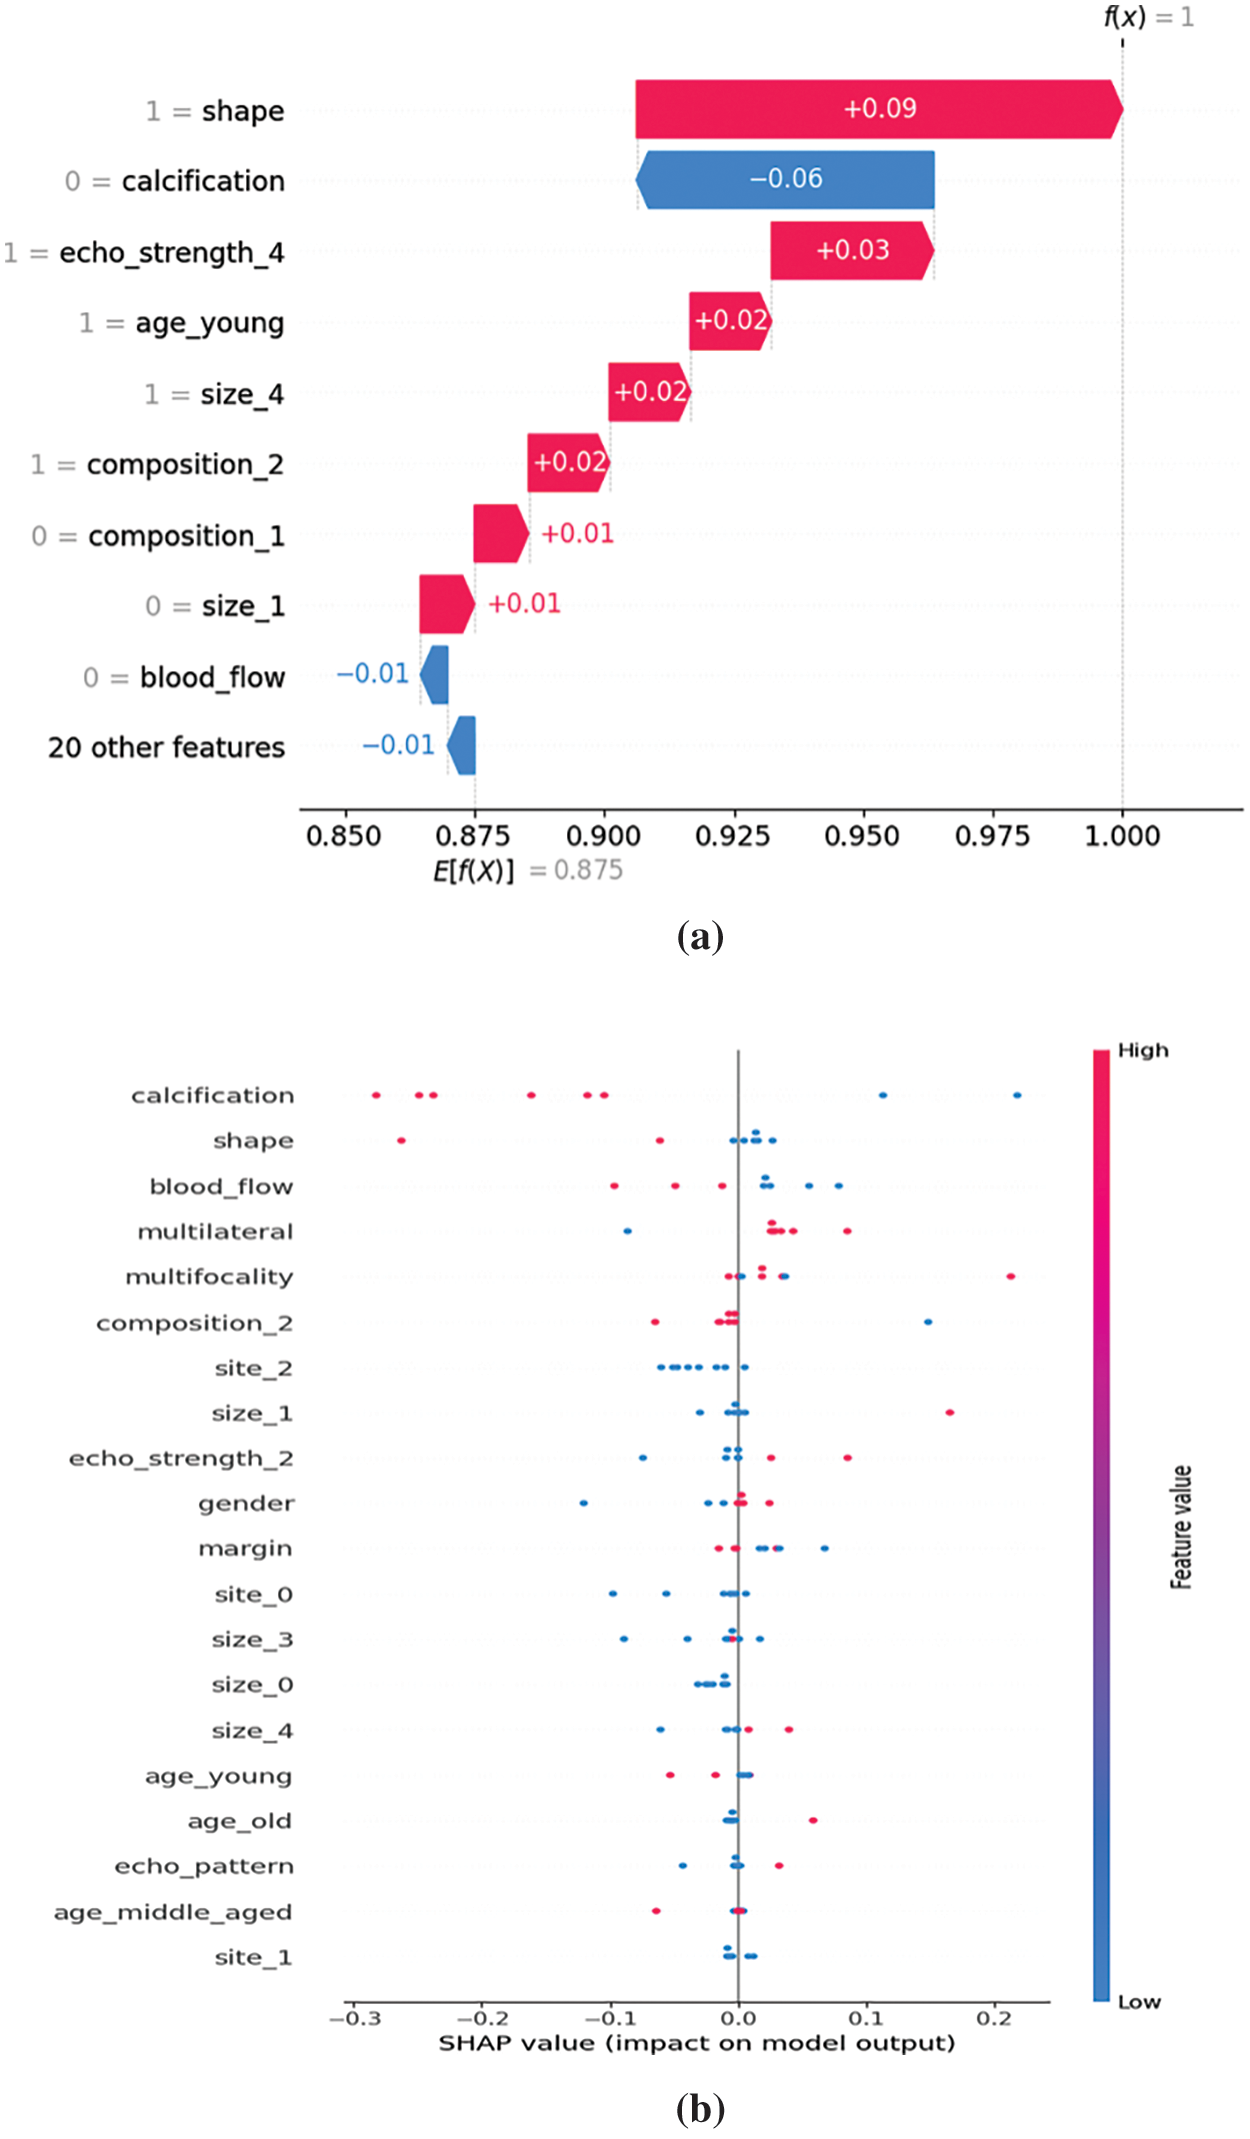
Figure 4: (a) SHAP waterfall plot for malignancy, (b) SHAP Summary plot for malignancy
In the next phase, the dataset is integrated with dominant feature sets generated through association-rule metric analysis. The feature sets {calcification, shape}, {calcification, size_3}, {blood_flow, shape}, {blood_flow, calcification}, {shape, site_0}, {calcification, site_0}, and {blood_flow, size_3} are integrated as new attributes to the original dataset. The original dataset has 29 features and the integrated dataset is increased to 36 features. This new rule-based feature set integrated dataset is used to train new models with SVM, RF, DT, KNN, and XGB algorithms.
This new rule-based feature set integrated dataset is further divided horizontally to create multiple data subsets. These data subsets are used to generate association rules. The rule-based interestingness metrics are applied to the rules and the top rules are filtered. The corresponding SHAP values are again generated with the machine learning model trained with the new data subsets. These association rules and SHAP values are again compared and multilevel validation of the feature ranking is thus conducted through our experiments. These high-ranking association rule features can be again integrated into the dataset and this process can be iterated to get the most impactful and dominant features in the malignancy prediction. In our experiments, we conducted a 2-level validation.
For validation, to visually corroborate both methodologies, bar charts of SHAP values and association-rule based interestingness metric values are generated with the data subsets. They highlight dominant attributes with high association-rule based metric values and high SHAP values (Refer to Fig. 5). Thus, the importance of these attributes in predicting malignancy is validated.
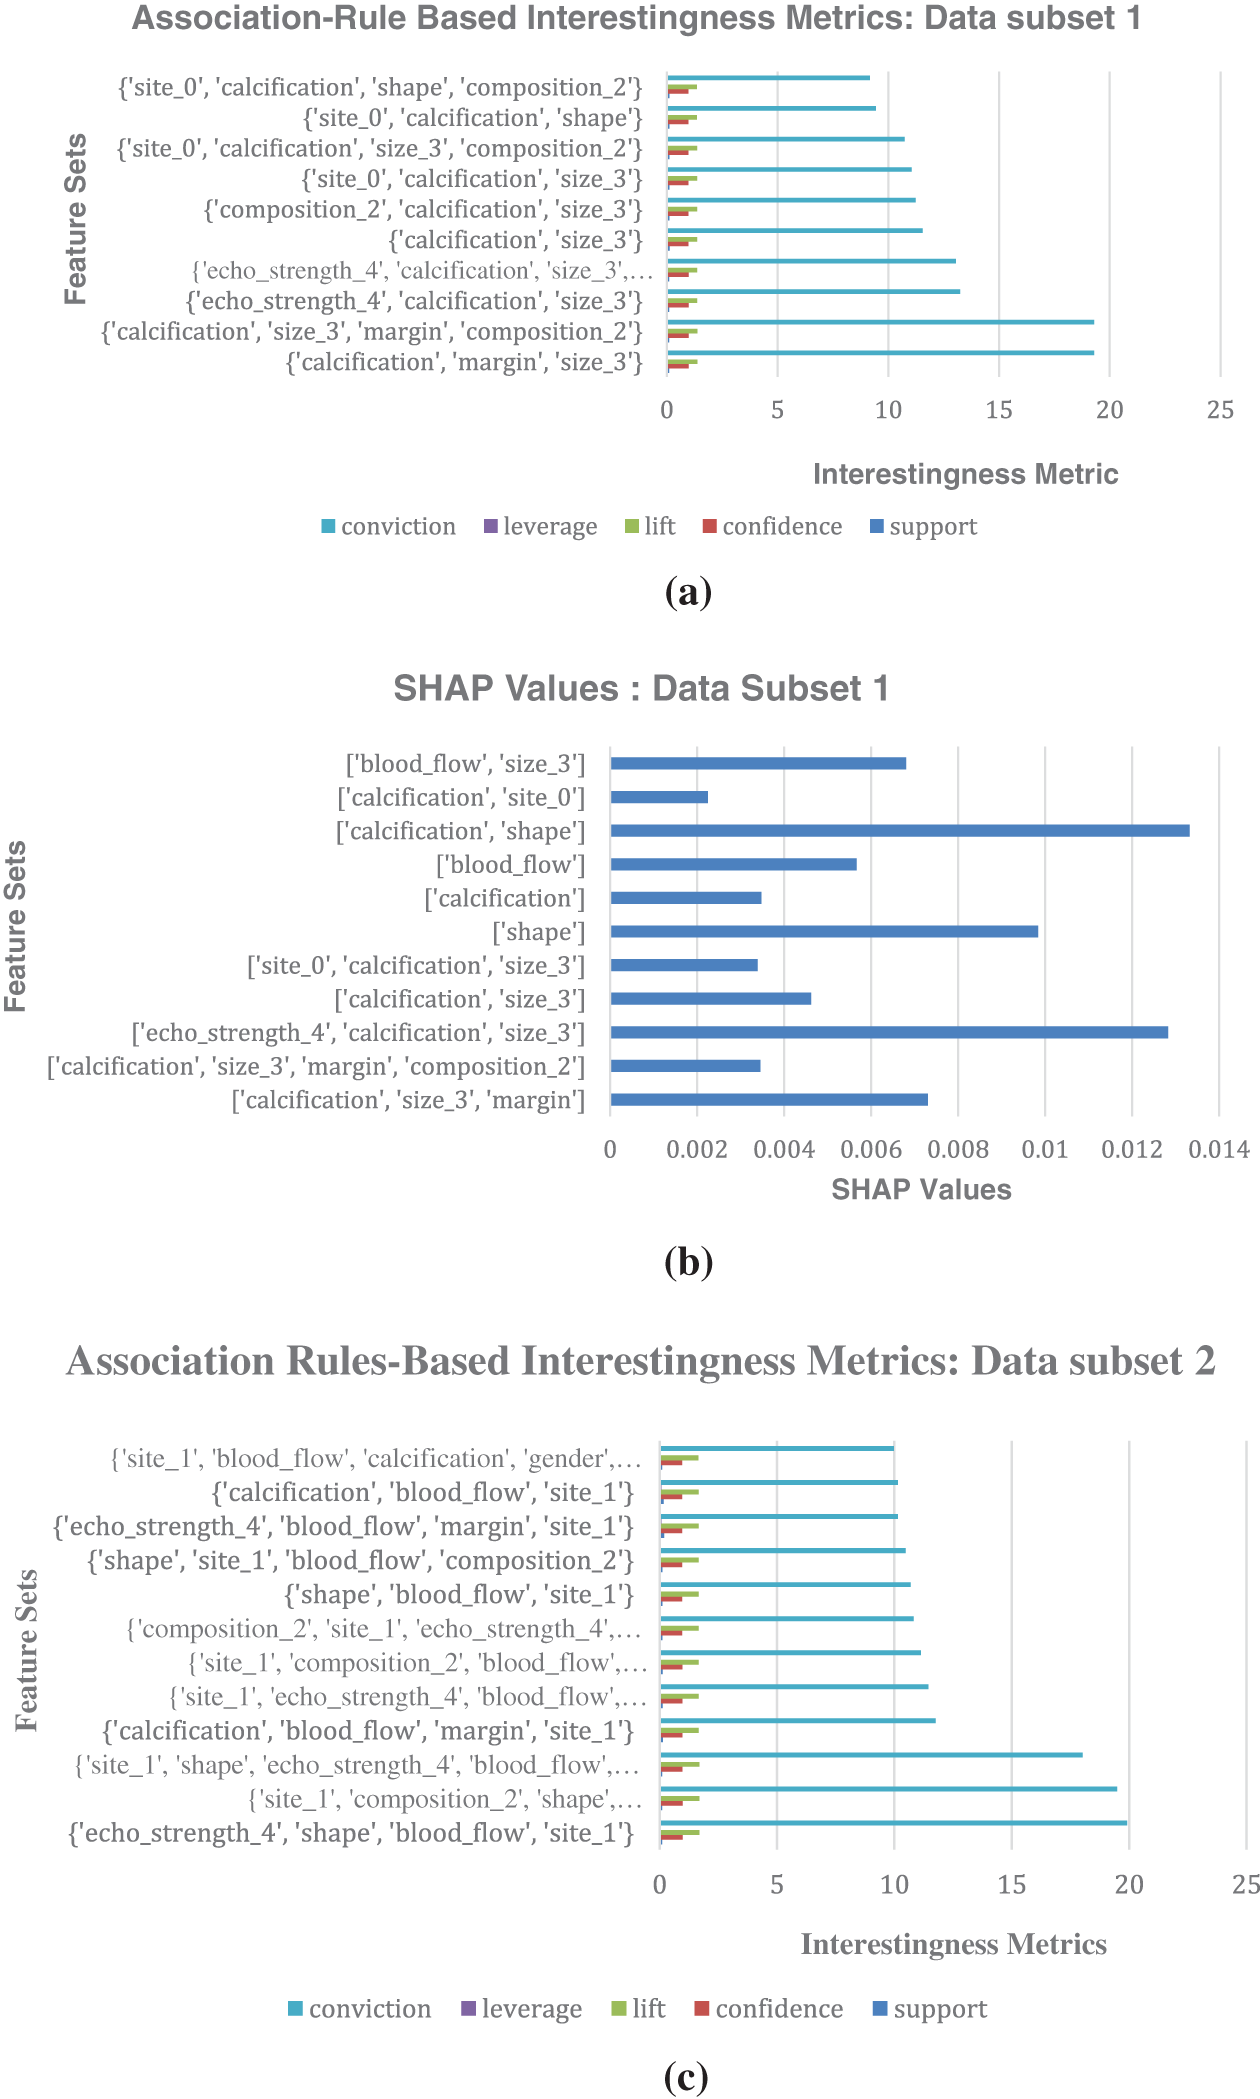
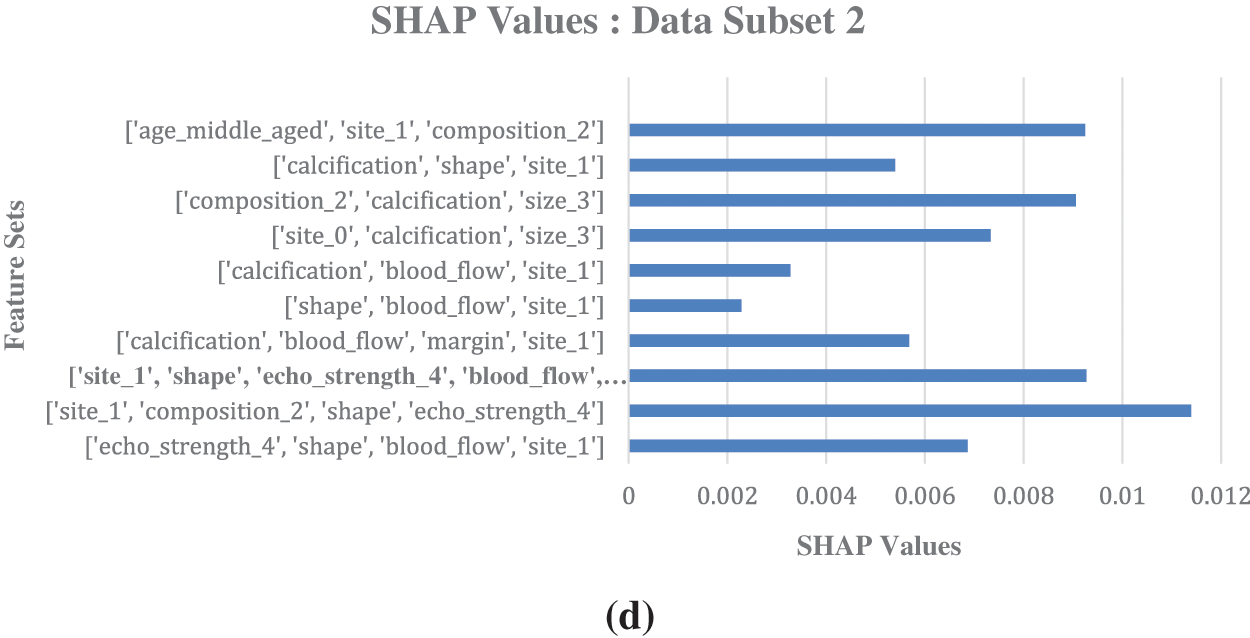
Figure 5: (a) Association-Rule Based Interestingness Metrics for data subset 1. (b) SHAP values generated for malignant prediction for the data subset 1, with integrated association rules feature sets. (c) Association-Rule Based Interestingness Metrics for data subset 2. (d) SHAP values generated for malignant prediction for the data subset 2, with integrated association rules feature sets
The attributes that ranked high in association-rule based interestingness metric analysis in the second level validation in data subset 1 are found to be {calcification, size_3, margin, compostition_2}, {calcification, margin, size_3}, {echo_strength_4, calcification, size_3}, etc. The corresponding SHAP values of the features generated for ML models trained on this data subset 1 show the following features as having high SHAP values which impacted malignancy prediction: {calcification, shape}, {echo_strength_4, calcification, size_3}, {calcification, size_3, margin}. This provides evidence in favor of a genuine association between the rankings given by the two methods. So, the rules are found to align with the SHAP values, and it reinforces the confidence in the identified associations between malignancy and the dominant features. Thus, the predictions made by the machine learning model can be explained in terms of the dominant features identified. The prediction process can be termed as transparent.
Domain experts are consulted for their expert opinion and the features of importance in their opinion match with the features selected as dominant features through our association-rule based interestingness metric study. According to domain experts, features such as micro calcification (calcification = 1), irregular shape (shape = 1), hypoechogenic (echostrength = 4), female gender (gender =1), solid composition (composition = 2), nodule size of 1.5–2.4 cm (size = 3), and unclear margins (margin = 1) are the characteristics of malignant nodules. From these features, calcification, hypoechogenic, and solid nodules of size bigger than 2.5 cm are the most important of all features for the diagnosis of thyroid malignancy. This corroborates with our findings. The web resources [24] also support these relevant features which are found to be major symptoms of thyroid cancer by our framework.
Fig. 4a shows SHAP explainer plots with thyroid cancer models trained on original dataset. Fig. 4a shows SHAP waterfall plot and each bar represent the contribution of a specific feature to the final prediction shift. Fig. 4b shows SHAP summary plot for malignancy where the Y-axis indicates the feature names in order of importance from top to bottom, and X-axis represents the SHAP values. The colour of each point on the graph with red indicates high values and blue indicates low values. Each point represents a row of data from the original dataset.
Fig. 5 shows the comparison of association rules interestingness metrics values with the label malignant as consequent generated for the horizontally divided dataset and its corresponding SHAP values generated for malignant prediction. Fig. 5a shows association rules based interestingness metrics for data subset 1; Fig. 5b shows SHAP values for the data subset 1; Fig. 5c displays association rules based interestingness metrics for data subset 2; Fig. 5d shows SHAP values for the data subset 2. SHAP values shows the relative importance of individual features, including those derived from association rules, providing a clear picture of feature contributions. Analysing the SHAP values revealed potential interactions between individual features and rule-based patterns, and provided valuable insights into the model’s behavior.
The performance of our proposed rule-base feature set integrated models showed better accuracy as well as slight improvements in other performance metrics such as Precision, Recall, F1-score, and AUC compared to the original baseline models generated with the original dataset. The comparisons are shown in Figs. 6a–6d. The Area Under the Receiver Operating Characteristic curve (AUROC) is a performance metric commonly used in binary classification problems to evaluate the discrimination ability of a model across different classification thresholds and provides a graphical representation of the trade-off between sensitivity and specificity at different classification thresholds. A higher AUROC indicates the proposed model’s robustness, demonstrating reduced sensitivity to variations and improved discrimination between positive and negative classes.
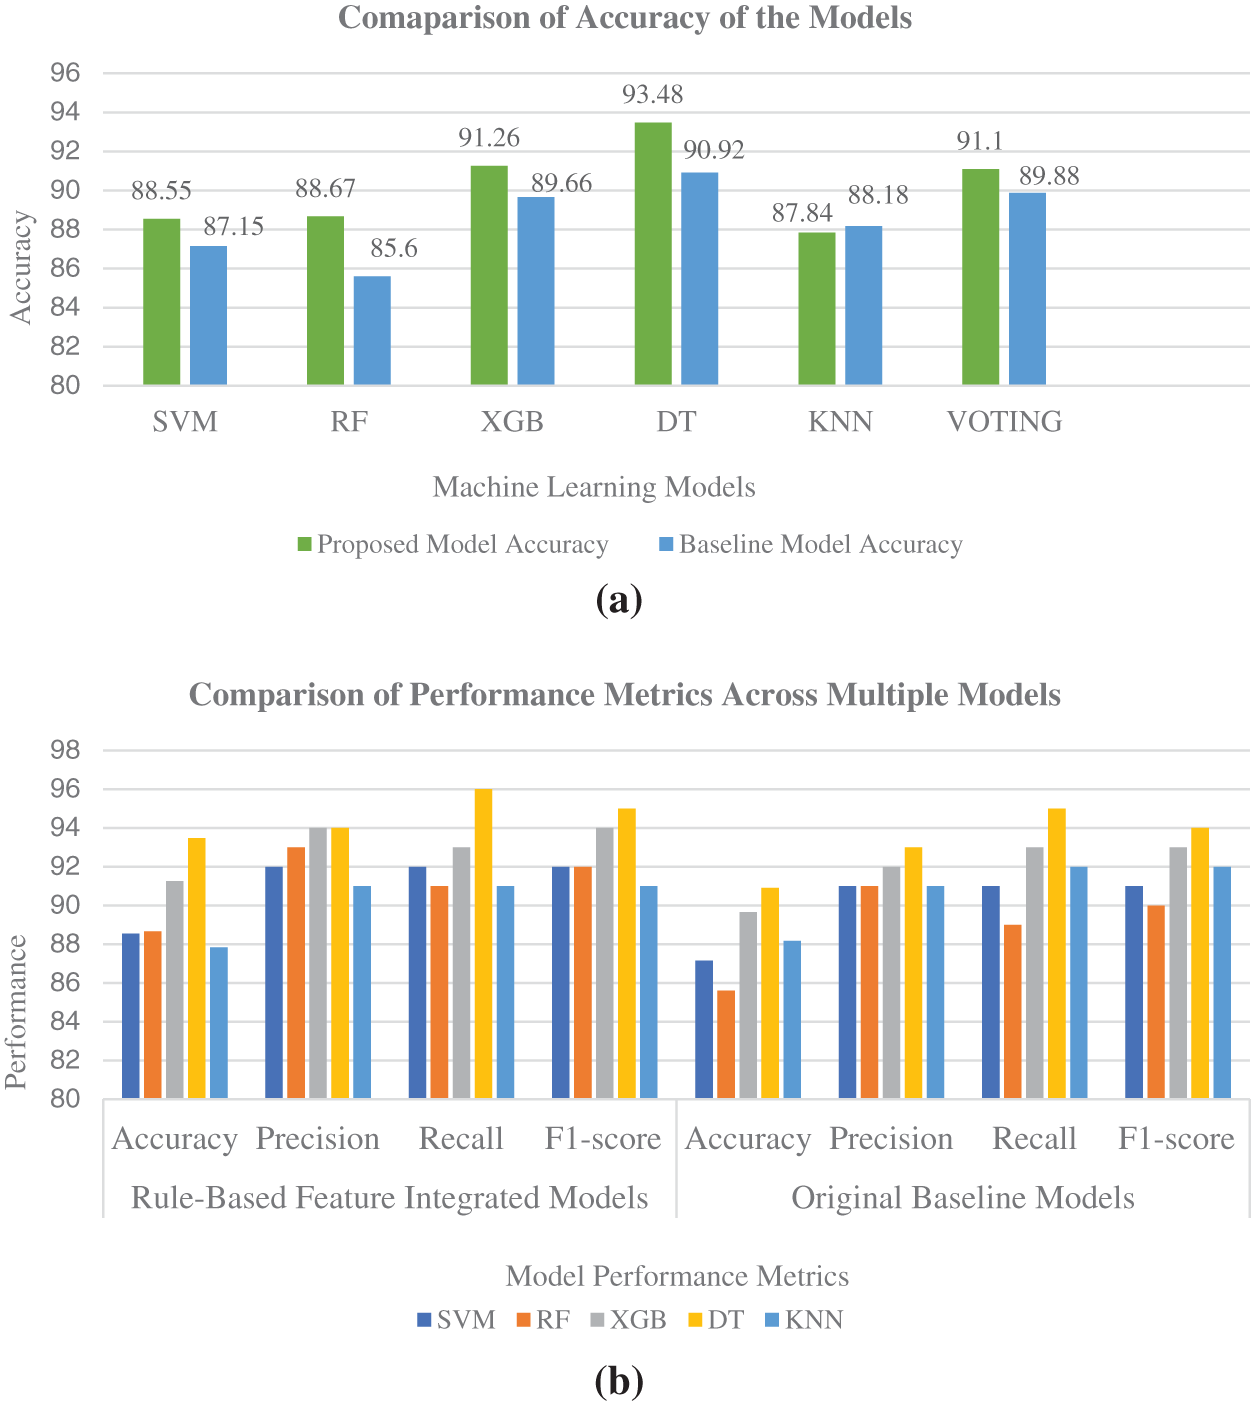
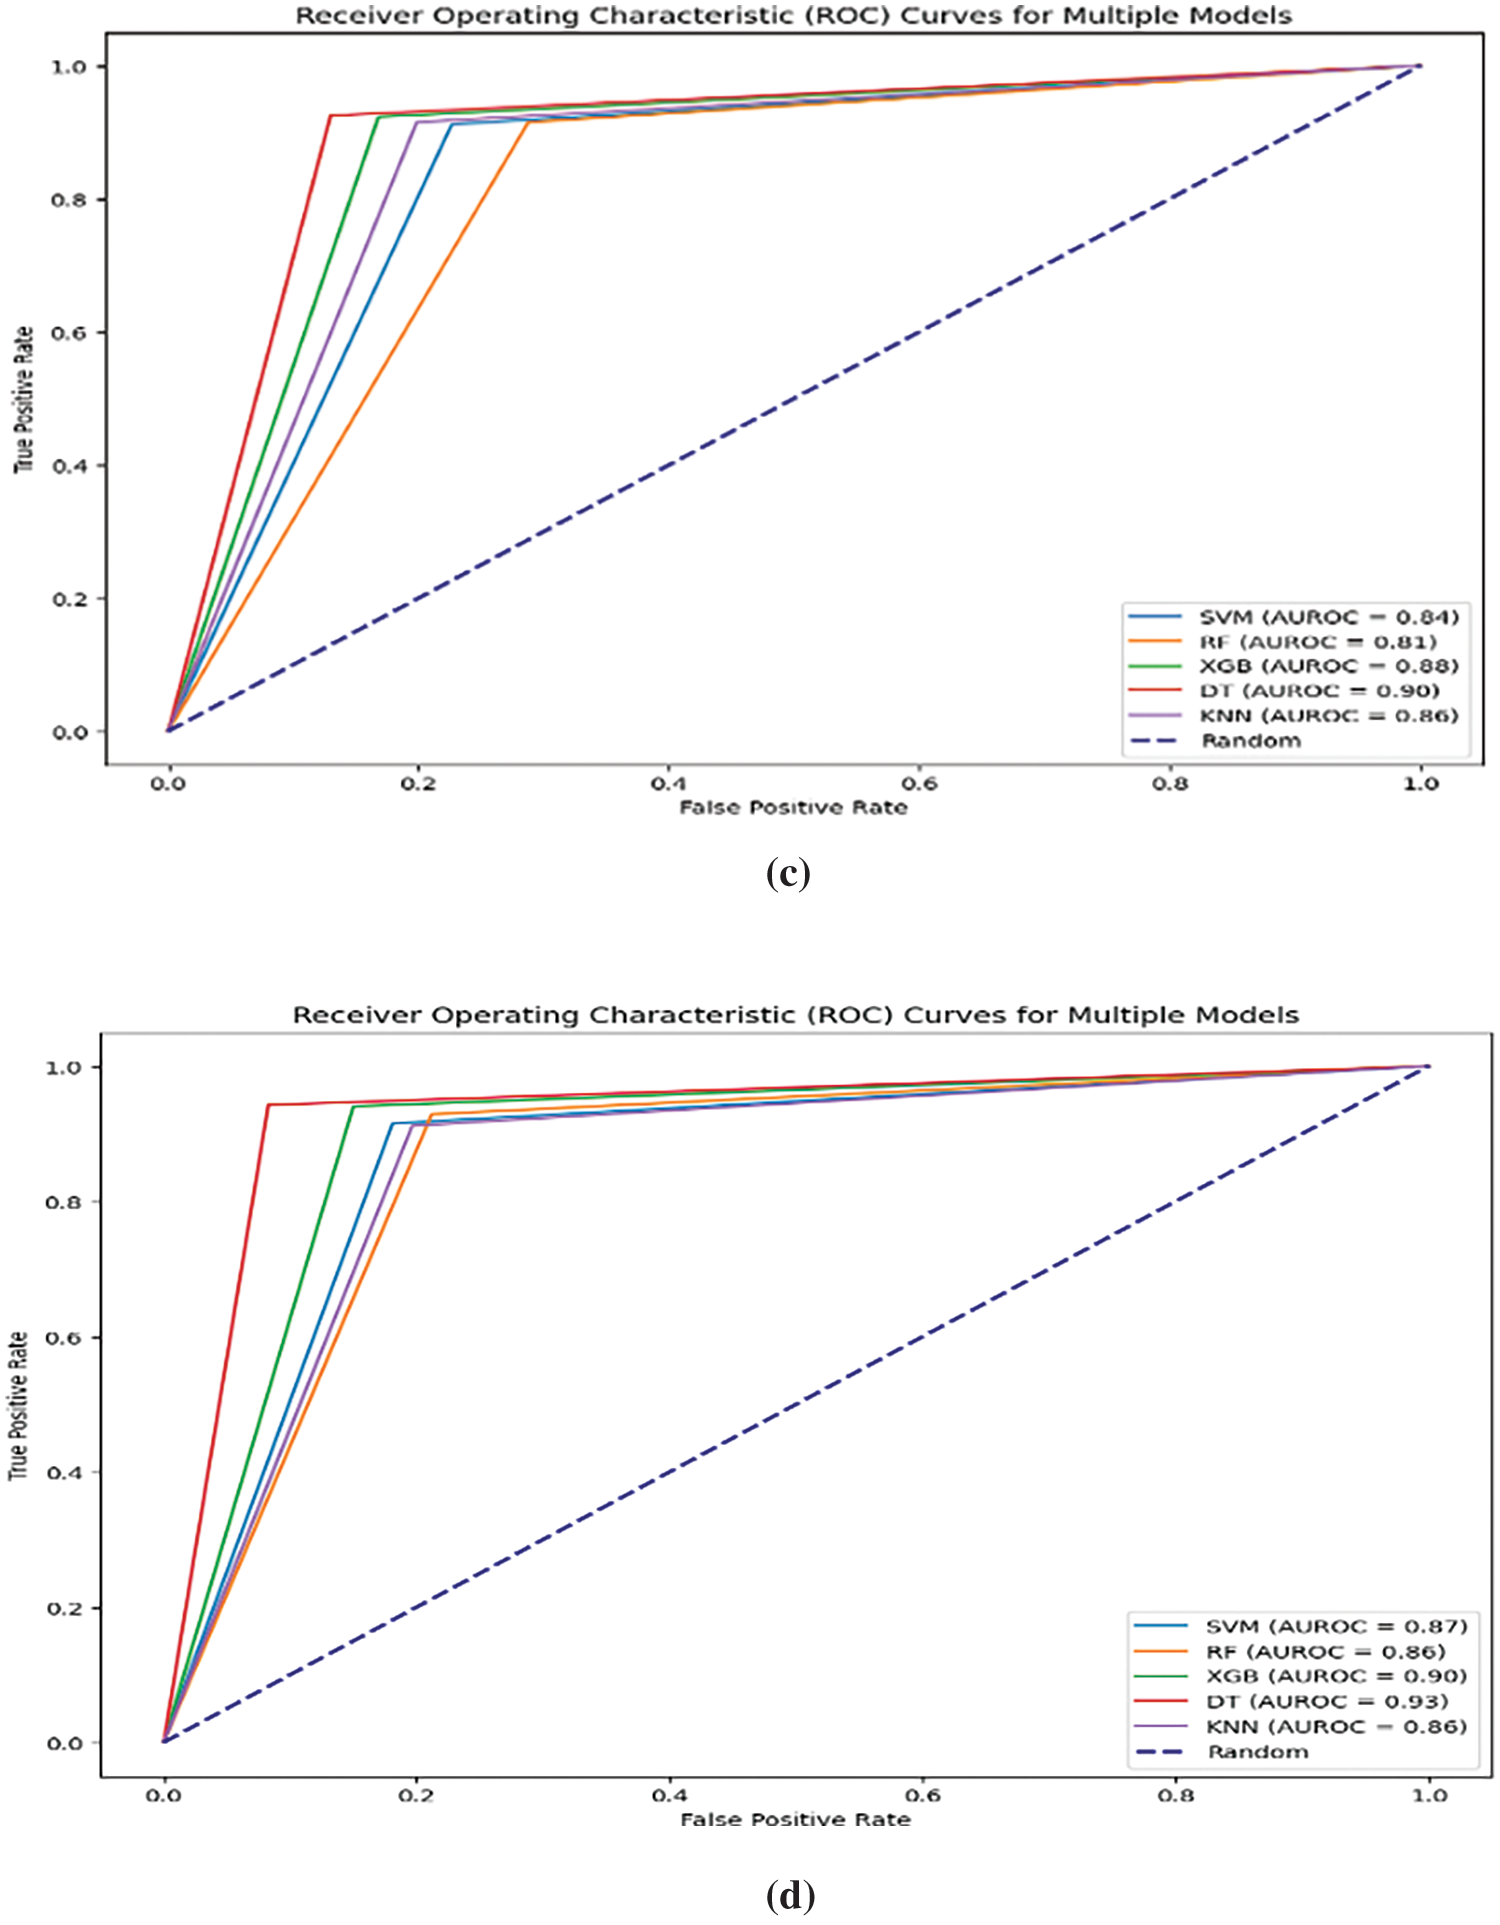
Figure 6: (a) Accuracy comparison of baseline ML models trained on original dataset and ML models trained on association-rule based feature-integrated dataset. (b) Performance metrics comparison of baseline models with rule-based feature-integrated models. (c) Area Under the ROC curve for ML models trained on original baseline dataset. (d) Area Under the ROC curve for ML models trained on association-rule based feature-integrated dataset
In the initial phase, our study used a limited set of association rules based on their importance and relevance to thyroid malignancy. SHAP values are visualised for association rules in conjunction with other regular features for improved understanding. In the next phase, association-rule based features are integrated into the dataset, and machine learning models are created with the new rule-based feature-integrated dataset. SHAP values are generated again for the new integrated dataset with feature combinations. Higher SHAP values are shown for the top features and feature sets with higher association-rule based interestingness metric values. The machine learning models trained on the new integrated dataset also showed overall improvement in all performance metrics, as shown in various Figs. 6a–6d. The Decision Tree model trained on association-rule based feature-integrated dataset showed the highest accuracy of 93.48%.
5.1 Comparison with Similar Models
To evaluate and compare the proposed model with other similar works, studies that worked on thyroid cancer and other thyroid datasets are selected. In a significant study in 2022, Xi et al. [29], employed gradient boosting machine (GBM), logistic regression, linear discriminant analysis (LDA), support vector machine (SVM) with radial or linear kernel, and Random Forest to build six machine learning models for predicting nodule malignancy. They performed ten-fold cross-validation to ensure an unbiased assessment of prediction accuracy. Among the various models, Random Forest (RF) emerged with the highest prediction accuracy (0.7931) and AUROC (0.8541) for distinguishing between benign and malignant nodules. The GBM model demonstrated superior sensitivity (0.8750) compared to the others.
In a study in 2022, Chaganti et al. [30] adopted forward feature selection, backward feature elimination, bidirectional feature elimination, and machine learning-based feature selection using extra tree classifiers. The dataset is obtained from the UCI thyroid disease datasets. Their models performed significantly better as they achieved a score of 0.99 in terms of all evaluation parameters. Results indicate that extra tree classifier-based selected features tend to provide the highest accuracy of 0.99 when used with the RF model.
In a research work conducted in 2021 by Aversano et al. [31], the aim was to predict the treatment trend for patients suffering from hypothyroidism. The dataset was built with patient information being treated in a hospital in Naples. In this study, different machine learning algorithms are used. The performance of the Extra-Tree Classifier accuracy showed was 84%.
Jha et al. [32] conducted a substantial study in 2022 using a real-life dataset focused on thyroid disease. Their experiments were carried out in a distributed environment. The proposed two-stage approach yielded a remarkable maximum accuracy of 99.95%. The study highlighted the effective utilisation of dimension reduction and data augmentation for achieving elevated accuracy in disease prediction.
In this significant research conducted by Hossain et al. [11], researchers used different machine-learning algorithms to predict hypothyroidism and hyperthyroidism. They identified the most significant features, which can be used to detect thyroid diseases by feature selection methods. Random Forest (RF) provided the best accuracy of 91.42%, precision of 92%, recall of 92%, and F1-score of 92%. They also validated the model as well as the features which influenced classification the most, by explainable AI methods.
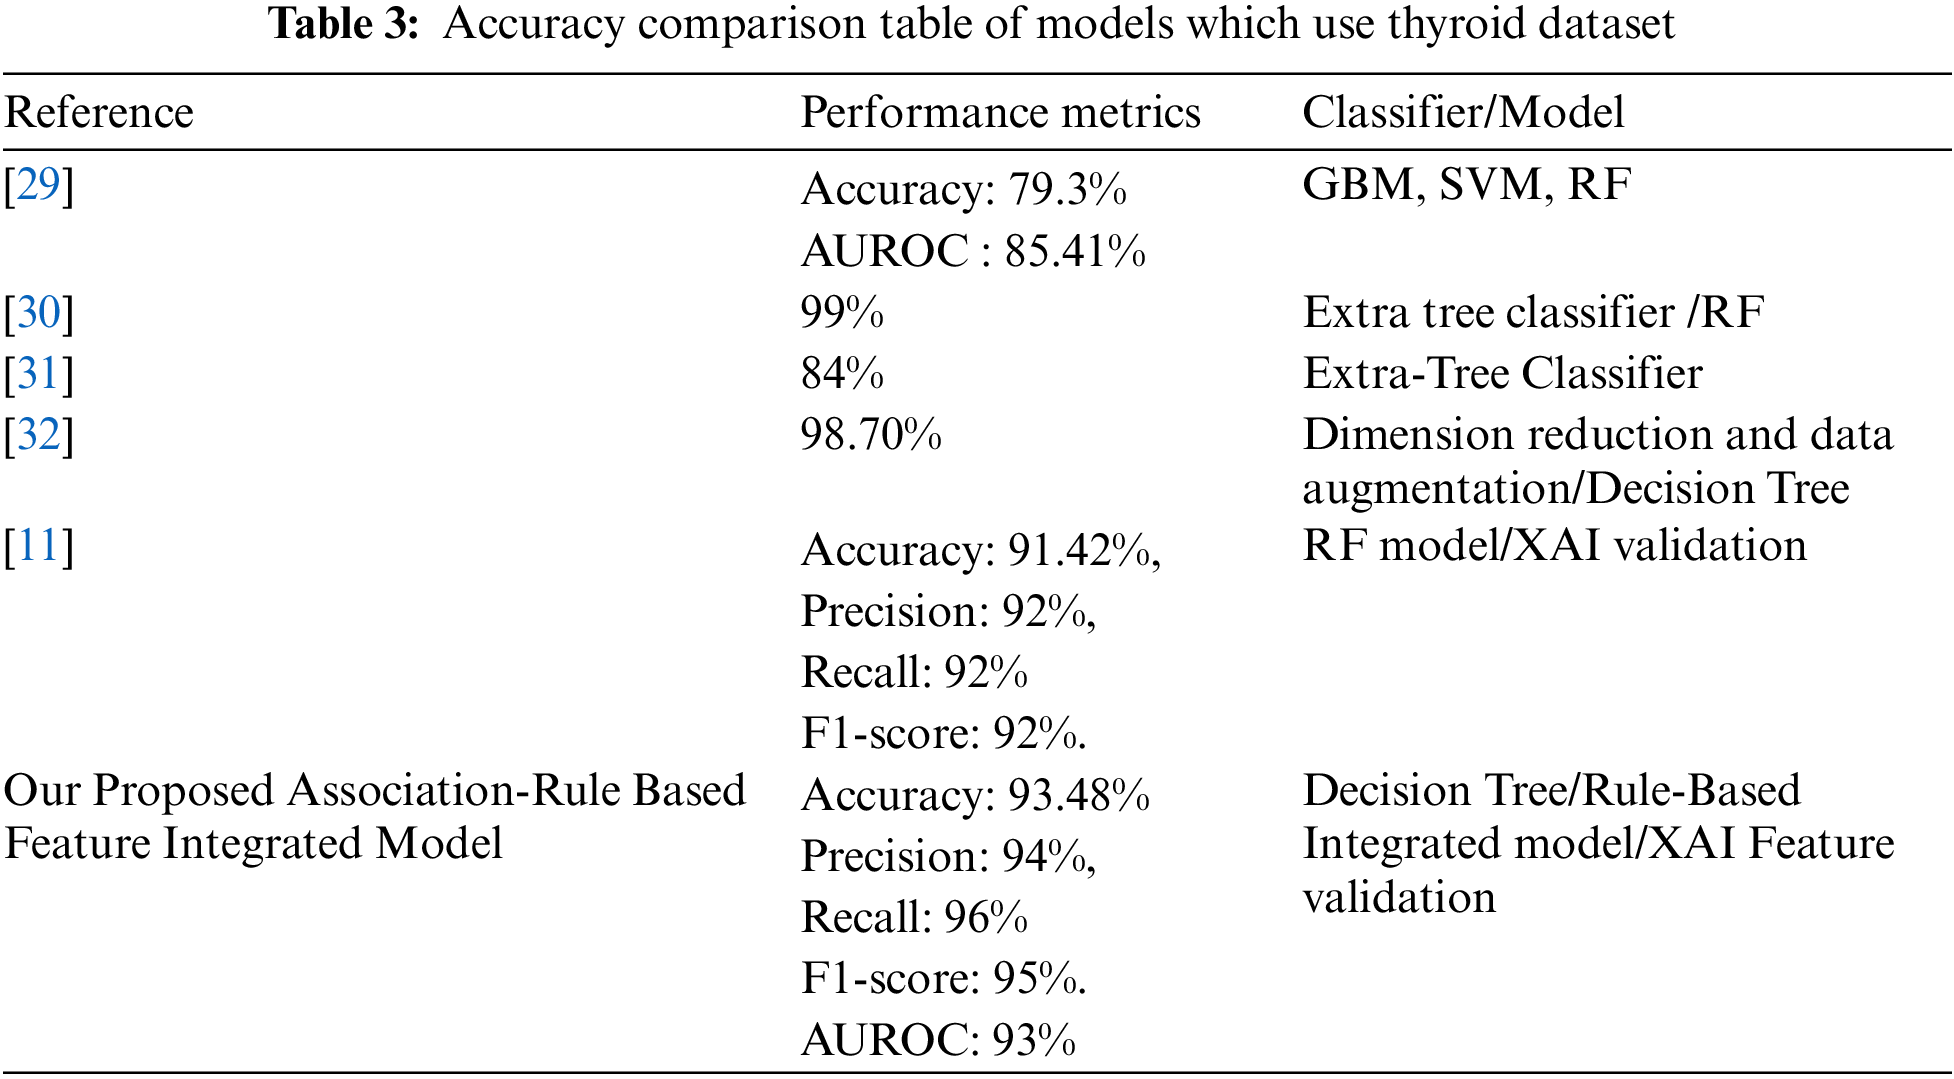
Table 3 shows the comparison between our proposed model and other similar state-of-the-art models that used various thyroid datasets. The proposed association-rule based feature-integrated framework identified dominant features. The proposed model integrated those feature sets in the dataset which contributed to the optimal performance of the model in predicting specific classes. Subsequently, eXplainable Artificial Intelligence (XAI) is used to validate the crucial feature sets in our dataset. The study findings exhibit a good level of comparability with previous research in this domain. The proposed thyroid cancer predictive model displays excellent performance compared to other similar models.
The integration of additional features into the thyroid cancer dataset, aimed at enhancing predictive capabilities, results in an expanded feature space. The augmented feature space contributes to increased computational complexity during model training and prediction. The inclusion of additional features leads to a higher dimensionality and affects the efficiency of machine learning algorithms like k-nearest neighbors, and support vector machines.
The findings and conclusions are drawn from a single dataset in our study, and so they might have limited generalisability to broader populations or diverse settings. Since a single dataset is used, the study’s findings should be interpreted within the context of the specific dataset. The dataset also exhibits a class distribution imbalance, with the benign class labels representing a minority. These limitations affect the robustness of the model and the reliability of the study’s conclusions.
The integration of association-rule based feature-integrated framework for machine learning models and SHAP values validation has proven to be a powerful framework for understanding feature relationships and their impact on thyroid cancer model classification and predictions. The validation process has provided insights into the consistency and reliability of feature rankings obtained through two distinct methodologies: Association-rule based feature-integrated framework, and SHAP values generation.
Through the proposed study, the features which came out as top-ranked features of thyroid malignancy are microcalcification (attribute name: Calcification), irregular shape (attribute name: Shape), hypoechogenic (attribute name: Echostrength_4), female gender (attribute name: Gender = 1), solid composition (attribute name: Composition_ 2), nodule size of 1.5–2.4 cm (attribute name: Size_3), and unclear margins (attribute name: Margin = 1). Among all features, {calcification}, and {shape} came out consistently as the highest-ranked causes of thyroid malignancy among all features using all data subsets, and with association-rule based interestingness metric values, as well as SHAP methods. Experts in the field are consulted to obtain their valuable insights, and their expert opinion aligns with the features identified as predominant by our studies. The domain experts emphasized that calcification, irregular shape, hypoechogenicity, and solid nodules larger than 2.5 cm are particularly crucial for diagnosing thyroid malignancy. This observation reinforces the significance of these identified features, affirming their status as major symptoms associated with thyroid cancer, within the framework we have developed.
The proposed rule-based feature-integrated machine learning models performed better than baseline models trained on the original dataset. The decision tree model outperformed all the other ML models with 93.48% accuracy, 94% precision, 96% Recall (Sensitivity), and 95% F1-score. The AUROC curve showed an impressive 93% for the Decision tree model. The proposed model is refined through an iterative validation process where the dataset is constantly improved with a feature integration process to achieve optimal performance. The proposed model shows better performance in comparison to state-of-the-art thyroid prediction models as shown in Table 3.
There are several avenues for further exploration and refinement of the proposed framework. An important challenge is the feature space expansion. Dimensionality reduction techniques can be employed to manage the increased feature space.
In our research, a single dataset is used in conducting all the studies. Future research can explore diverse datasets to confirm and strengthen the observed patterns. Various known dominant features in the thyroid cancer dataset can be selectively used to study the interdependence of features. Models trained on select features can be used in generating SHAP values, and feature-specific prediction explanations can be elucidated. In our study, malignancy is the major label that is considered in SHAP value generation. The benign label also needs to be studied deeply to have a comprehensive analysis of the explainability of the model prediction. The LIME explainability techniques can be employed in interpreting thyroid cancer predictions. The comparative study of the explainability results of SHAP and LIME is also another avenue for future research.
Our proposed framework enhances the interpretability and transparency of the SHAP values by linking them to interpretable association rules. This aids in building trust among stakeholders, as the model’s predictions are not only explained in terms of feature importance but also validated against known domain-specific patterns. Through our novel approach, the power of both association rule mining and SHAP values is leveraged to gain a comprehensive understanding of the model’s behavior and the underlying relationships within the thyroid cancer dataset. Thus, feature rankings of both methodologies are validated.
The proposed framework has the flexibility to be applied in developing clinical decision support systems and real-world applications across diverse industries.
Acknowledgement: The authors would like to acknowledge the support and kindness of Dr. Sandhya Susan Varghese, consultant physician, Dr. Indu Elizabeth Mathew, Endocrinologist and Dr. Bijoy Jacob Thomas, Radiologist, EMC, Ernakulam District, Kerala state, who were the medical domain experts for this research paper. We would also like to mention the names of Dr. P. Santhakumari, Dr. S. Ravisankar, Dr. Aparna Sankar R., Dr. Shyamgopal V., Dr. Divya Shyam, and Dr. Padma Raghavan Pillai, endocrinologist, for extending help in the form of medical opinions in this research. The authors wish to acknowledge the support of the Department of Research, Hindustan University, Chennai, TN, India in this study.
Funding Statement: The authors received no funding for this work.
Author Contributions: The authors confirm contribution to the paper as follows: Study conception and design: Sujithra Sankar; data collection: Sujithra Sankar; analysis and interpretation of results: Sujithra Sankar; draft manuscript preparation: Sujithra Sankar. All authors reviewed the results and approved the final version of the manuscript.
Availability of Data and Materials: The data that support the findings of this study are openly available in Zenodo repository at https://zenodo.org/record/6465436#.Y06MQ3ZBxZ.
Conflicts of Interest: The authors declare that they have no conflicts of interest to report regarding the present study.
References
1. American Cancer Society, Cancer Statistics Center, Accessed: Oct. 8, 2022. [Online]. Available: https://cancerstatisticscenter.cancer.org. [Google Scholar]
2. S. Lundberg, “SHAP Documentations,” 2018. Accessed: Oct. 10, 2023. [Online]. Available: https://shap.readthedocs.io/en/latest/index.html. [Google Scholar]
3. M. Ribeiro, S. Singh, and C. Guestrin, “Why should I trust you? Explaining the predictions of any classifier,” in Proc. ACM SIGKDD, San Francisco, CA, USA, Aug. 13–17, 2016, pp. 1135–1144. [Google Scholar]
4. S. M. Lundberg and S. I. Lee, “A unified approach to interpreting model predictions,” Adv. Neural Inf. Process. Syst., vol. 30, pp. 4765–4774, 2017. [Google Scholar]
5. Y. Du, A. Rafferty, F. McAuliffe, L. Wei, and C. Mooney, “An explainable machine learning-based clinical decision support system for prediction of gestational diabetes mellitus,” Sci. Rep., vol. 12, no. 1, pp. 1170, 2022. doi: 10.1038/s41598-022-05112-2. [Google Scholar] [PubMed] [CrossRef]
6. M. Naiseh, D. Al-Thani, N. Jiang, and R. Ali, “How the different explanation classes impact trust calibration: The case of clinical decision support systems,” Int. J. Man-Mach. Stud., vol. 169, no. 1, pp. 102941, 2023. doi: 10.1016/j.ijhcs.2022.102941. [Google Scholar] [CrossRef]
7. C. Panigutti et al., “Co-design of human-centered, explainable AI for clinical decision support,” ACM Trans. Interact. Intell. Syst., vol. 13, no. 4, pp. 1–35, 2023. doi: 10.1145/3587271. [Google Scholar] [CrossRef]
8. J. Amann et al., “To explain or not to explain?—Artificial intelligence explainability in clinical decision support systems,” PLoS Digit. Health, vol. 1, no. 2, pp. e0000016, 2022. doi: 10.1371/journal.pdig.0000016. [Google Scholar] [PubMed] [CrossRef]
9. S. Aljameel, “A proactive explainable artificial neural network model for the early diagnosis of thyroid cancer,” Computation, vol. 10, no. 10, pp. 183, 2022. doi: 10.3390/computation10100183. [Google Scholar] [CrossRef]
10. J. Wang et al., “An integrated AI model to improve diagnostic accuracy of ultrasound and output known risk features in suspicious thyroid nodules,” Eur. Radiol., vol. 32, no. 3, pp. 1–10, 2022. doi: 10.1007/s00330-021-08298-7. [Google Scholar] [PubMed] [CrossRef]
11. M. B. Hossain et al., “An explainable artificial intelligence framework for the predictive analysis of hypo and hyper thyroidism using machine learning algorithms, human-centric intel,” Hum.-Cent. Intell. Syst., vol. 3, no. 3, pp. 1–21, 2023. doi: 10.1007/s44230-023-00027-1. [Google Scholar] [CrossRef]
12. S. Arjaria, A. Rathore, and G. Chaubey, “Developing an explainable machine learning-based thyroid disease prediction model,” Int. J. of Business Analyt. (IJBAN), vol. 9, no. 3, pp. 1–18, 2022. doi: 10.4018/IJBAN.292058. [Google Scholar] [CrossRef]
13. A. K. M. S. Hosain and M. Golam Rabiul Alam, “Demystifying hypothyroidism detection with extreme gradient boosting and explainable AI,” in Proc. 25th ICCIT, Bangladesh, Cox’s Bazar, 2022, pp. 260–265. doi: 10.1109/ICCIT57492.2022.10055791. [Google Scholar] [CrossRef]
14. Z. Jin et al., “Thy-Wise: An interpretable machine learning model for the evaluation of thyroid nodules,” Int. J. Cancer, vol. 151, no. 12, pp. 2229–2243, 2022. doi: 10.1002/ijc.34248. [Google Scholar] [PubMed] [CrossRef]
15. T. T. H. Nguyen, V. B. Truong, V. T. K. Nguyen, Q. H. Cao, and Q. K. Nguyen, “Towards trust of explainable ai in thyroid nodule diagnosis,” in Int. Work. on Heal. Intell, Cham, Spr. Nat. Switz, Feb. 2023, pp. 11–26. [Google Scholar]
16. R. Sarno, R. Dewandono, T. Ahmad, M. Naufal, and F. Sinaga, “Hybrid association rule learning and process mining for fraud detection,” IAENG Int. J. Comput. Sci., vol. 42, no. 2, pp. 59–72, 2015. [Google Scholar]
17. A. Ogunde, O. Folorunso, and A. Sodiya, “The design of an adaptive incremental association rule mining system,” in Proc. World Cong. on Eng., vol. 1, pp. 172–177, 2015. [Google Scholar]
18. N. Kaoungku, K. Suksut, R. Chanklan, K. Kerdprasop, and N. Kerdprasop, “Data classification based on feature selection with association rule mining,” in Proc. Int. MultiConf. Eng. Comp. Scientists, Hong Kong, China, 2017, pp. 321–326. [Google Scholar]
19. Y. Wang and T. Murata, “Association rule mining with data item including independence based on enhanced confidence factor,” in Proc. Int. MultiConf. Eng. Comp. Scientists, vol. 1, pp. 359–363, 2017. [Google Scholar]
20. D. Li, D. Yang, J. Zhang, and X. Zhang, “AR-ANN: Incorporating association rule mining in an artificial neural network for thyroid disease knowledge discovery and diagnosis,” IAENG Int. J. Comput. Sci., vol. 47, no. 1, pp. 25–36, 2020. [Google Scholar]
21. J. Han and J. Pei, “Mining frequent patterns by pattern-growth: Methodology and implications,” ACM SIGKDD Explor. Newslett., vol. 2, no. 2, pp. 14–20, 2000. doi: 10.1145/380995.381002. [Google Scholar] [CrossRef]
22. R. Agrawal and R. Srikant, “Fast algorithms for mining association rules,” in Proc. Twentieth Int. Conf. VLDB, Santiago, Chile, vol. 1215, 1994, pp. 487–499. [Google Scholar]
23. X. Nan Miles, W. Lin, and Y. Chuanjia, “Improving the diagnosis of thyroid cancer by machine learning and clinical data,” Sci. Rep. Zenodo, vol. 12, no. 1, pp. 11143, 2022. [Google Scholar]
24. Radiology Assistant, TI-RADS-Thyroid Imaging Reporting and Data System, 2017. Accessed: Sep. 20 2023. [Online]. Available: https://radiologyassistant.nl/head-neck/ti-rads/ti-rads [Google Scholar]
25. E. Frank, M. Hall, and I. Witten, “The WEKA workbench. Online appendix for data mining: Practical machine learning tools and techniques,” 2016. Accessed: Nov. 11, 2022. [Online]. Available: https://waikato.github.io/weka-site/index.html. (accessed November 2022) [Google Scholar]
26. P. Tanna and Y. Ghodasara, “Using Apriori with WEKA for frequent pattern mining,” Int. J. of Eng. Trends Tech., vol. 12, no. 3, pp. 127–131, Jun. 2014. doi: 10.14445/22315381/IJETT-V12P223. [Google Scholar] [CrossRef]
27. S. Raschka, “MLxtend: Providing machine learning and data science utilities and extensions to Python’s scientific computing stack,” J. Open Source Softw., vol. 3, no. 24, pp. 638, Apr. 2018. doi: 10.21105/joss.00638. [Google Scholar] [CrossRef]
28. E. Strumbelj and I. Kononenko, “An efficient explanation of individual classifications using game theory,” The J. Mach. Learn. Research, vol. 11, pp. 1–18, 2010. [Google Scholar]
29. N. Xi, L. Wang, and C. Yang, “Improving the diagnosis of thyroid cancer by machine learning and clinical data,” Sci. Rep., vol. 12, no. 1, pp. 11143, 2022. doi: 10.1038/s41598-022-15342-z. [Google Scholar] [PubMed] [CrossRef]
30. R. Chaganti, F. Rustam, I. de la Torre Díez, J. L. V. Mazón, C. L. Rodríguez and I. Ashraf, “Thyroid disease prediction using selective features and machine learning techniques,” Cancers, vol. 14, no. 16, pp. 3914, 2022. doi: 10.3390/cancers14163914. [Google Scholar] [PubMed] [CrossRef]
31. L. Aversano et al., “Thyroid disease treatment prediction with machine learning approaches,” Procedia Comput. Sci., vol. 192, no. 6, pp. 1031–1040, 2021. doi: 10.1016/j.procs.2021.08.106. [Google Scholar] [CrossRef]
32. R. Jha, V. Bhattacharjee, and A. Mustafi, “Increasing the prediction accuracy for thyroid disease: A step towards better health for society,” Wireless Pers. Commun., vol. 122, no. 2, pp. 1921–1938, 2022. doi: 10.1007/s11277-021-08974-3. [Google Scholar] [CrossRef]
Cite This Article
 Copyright © 2024 The Author(s). Published by Tech Science Press.
This work is licensed under a Creative Commons Attribution 4.0 International License , which permits unrestricted use, distribution, and reproduction in any medium, provided the original work is properly cited.
 Downloads
 Citation Tools