
 Submit a Paper
 Propose a Special lssue
 Open Access
ARTICLE

A Novel Approach to Breast Tumor Detection: Enhanced Speckle Reduction and Hybrid Classification in Ultrasound Imaging
1 Department of Biomedical Engineering, KIT-Kalaignarkarunanidhi Institute of Technology, Coimbatore, 641402, India
2 Graduate School, Faculty of Information Technology, Duy Tan University, Da Nang, 550000, Viet Nam
3 Department of Biomedical and Instrumentation Engineering, Avinashilingam Institute for Home Science and Higher Education for Women, Coimbatore, 641043, India
4 Universidad Michoacana de San Nicolás de Hidalgo Avenida Francisco J. Múgica S/N Ciudad Universitaria, Morelia, CP, 58030, Mexico
5 Department of Pharmacology and Toxicology, College of Pharmacy, King Saud University, Riyadh, 11451, Saudi Arabia
6 Department of Mechanical Engineering, Gujarat Technological Univeristy, Nigam Nagar, Chandkheda, Ahmedabad, Gujarat, 382424, India
* Corresponding Authors: K. Umapathi. Email: ; Hitesh Panchal. Email:
Computers, Materials & Continua 2024, 79(2), 1875-1901. https://doi.org/10.32604/cmc.2024.047961
Received 23 November 2023; Accepted 08 March 2024; Issue published 15 May 2024
 View Full Text
 Download PDF
Abstract
Breast cancer detection heavily relies on medical imaging, particularly ultrasound, for early diagnosis and effective treatment. This research addresses the challenges associated with computer-aided diagnosis (CAD) of breast cancer from ultrasound images. The primary challenge is accurately distinguishing between malignant and benign tumors, complicated by factors such as speckle noise, variable image quality, and the need for precise segmentation and classification. The main objective of the research paper is to develop an advanced methodology for breast ultrasound image classification, focusing on speckle noise reduction, precise segmentation, feature extraction, and machine learning-based classification. A unique approach is introduced that combines Enhanced Speckle Reduced Anisotropic Diffusion (SRAD) filters for speckle noise reduction, U-NET-based segmentation, Genetic Algorithm (GA)-based feature selection, and Random Forest and Bagging Tree classifiers, resulting in a novel and efficient model. To test and validate the hybrid model, rigorous experimentations were performed and results state that the proposed hybrid model achieved accuracy rate of 99.9%, outperforming other existing techniques, and also significantly reducing computational time. This enhanced accuracy, along with improved sensitivity and specificity, makes the proposed hybrid model a valuable addition to CAD systems in breast cancer diagnosis, ultimately enhancing diagnostic accuracy in clinical applications.Keywords
As per World Health Organization (WHO), in the year 2020, there were about 2.3 million diagnosed breast cancer cases and 685,000 died of breast cancer worldwide. It constitutes about 12% of all cancer cases and 25% of cancer among women. In addition, the breast cancer mortality rate dropped by 40% between 1980 and 2020 in high-income countries especially. There are about 4 million breast cancer survivors in the world. The primary reason behind mortality reduction and survival is attributed to the early diagnosis of the disease supported by improved awareness among the population. The prima facia requirements given for tackling breast cancer are also the same (i) creating awareness and (ii) facilitating early diagnosis. As early diagnosis could result in early interventions and medications that could prevent the spread of malignancy hugely reducing the mortality risk factor. The risks associated with the malignancy being stated, the importance of diagnostic tools and their development are in the limelight. Though mammogram is a gold standard diagnostic tool, ultrasound imaging is a promising tool due to its effectiveness in diagnosing the disease stages from dense tissues easily. Thus, research that concentrates on improving ultrasound diagnosing efficiency is always gaining significance.
The paramount importance of early cancer detection and diagnosis cannot be overstated, especially when considering breast cancer, which stands as the most prevalent malignancy among women [1]. Alarmingly, 60% of cancer cases are diagnosed in advanced stages [2], highlighting the urgency of improving diagnostic methodologies. Current statistics reveal that about 2.26 million breast cancer cases are newly registered every year [3], further underscoring the pressing need for enhanced detection strategies for the early diagnosis of breast cancer.
The objectives of the paper are:
1. To conduct a comprehensive study and provide an enlightened literature review with regard to the state of the art in artificial intelligence powered Ultrasound imaging based breast cancer screening.
2. To propose a novel methodology for the effective classification of breast tumor lesions from Ultrasound images that could aid in early diagnosis and thus treatment. A novel image processing pipeline with excellent pre-processing of US images by tailored eSRAD filtering followed by accurate segmentation of tumor lesions by U-NET DNN and feature selection by GA facilitated early classification of breast cancer stages with highest accuracy. The novelty of the model lies in the combination of techniques selected for improving performance in each stage of image processing which collectively resulted in an improved accuracy of classification.
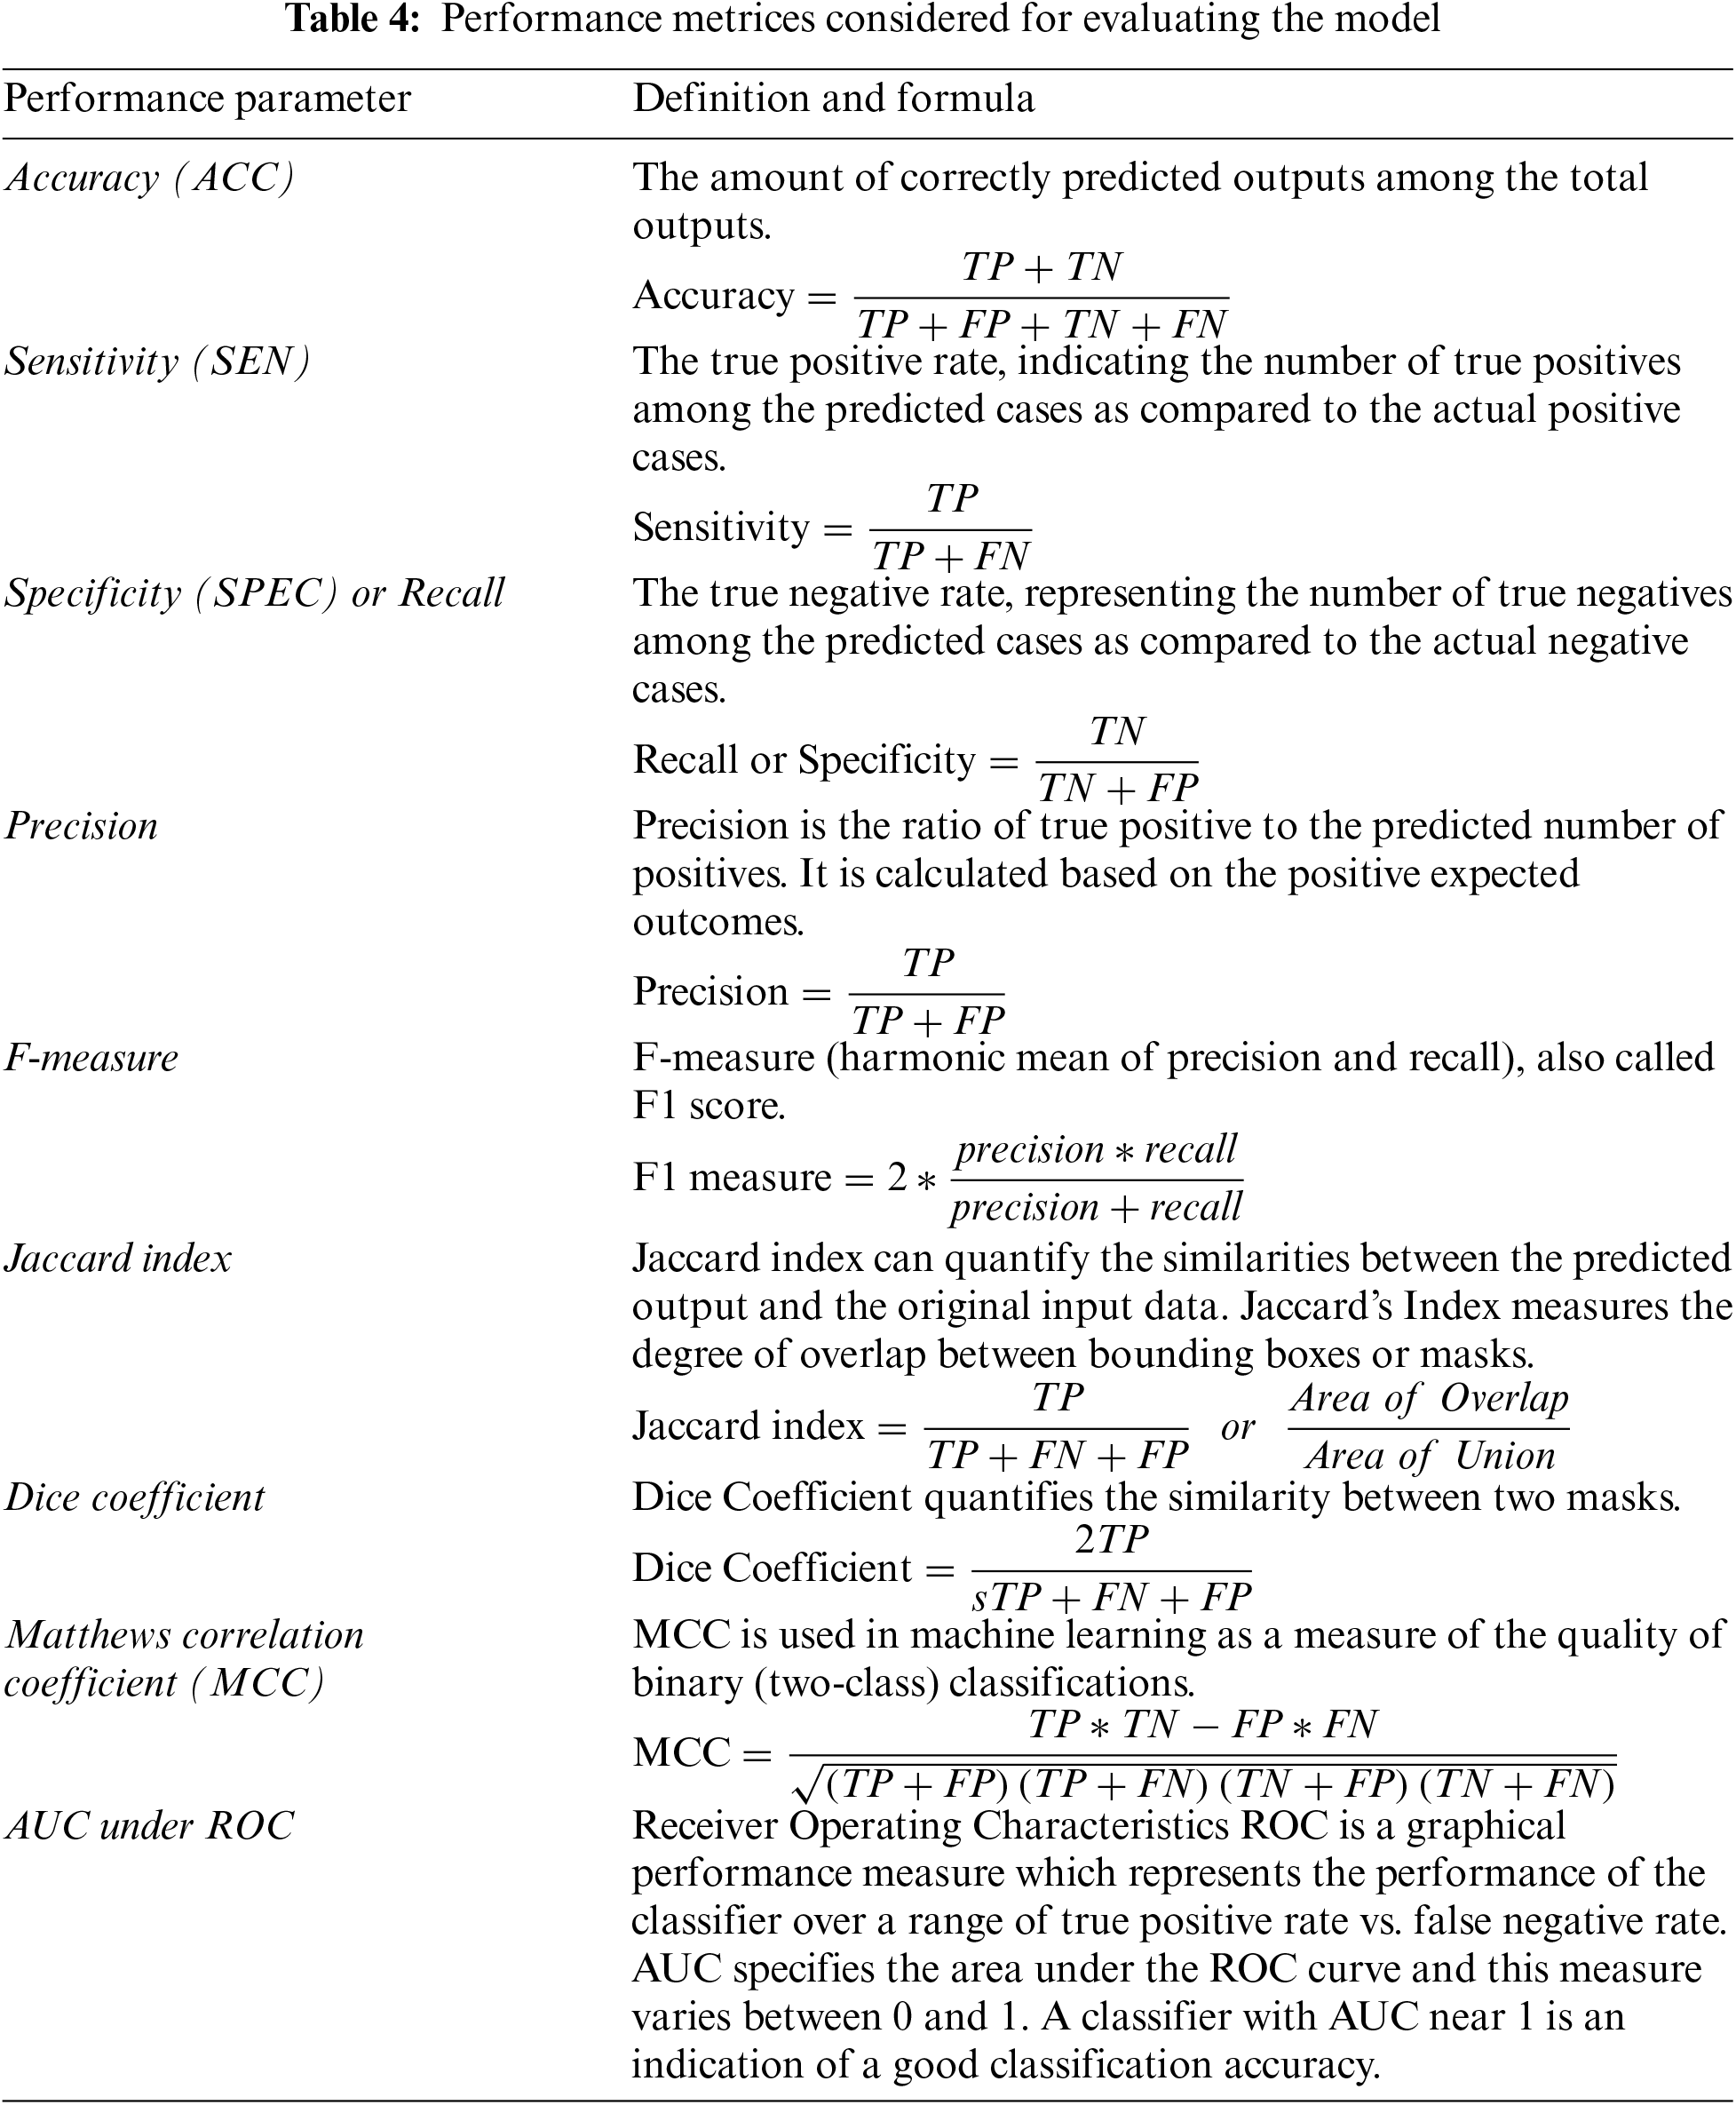
3. To test and validate the proposed methodology in terms of performance metrices accuracy, sensitivity, specificity, precision, F-measure, Jaccard index, dice coefficient, Matthews Correlation Coefficient and Area -Under the Receiver Operating Characteristics (ROC) Curve (AUC).
4. To compare the proposed methodology with existing techniques like Random Forest, U-NET, Selective Kernel U-NET and GLCM based classification models.
The rest of the paper is organized as: Section 2 enlitens related works with regard to Breast cancer embarking all the contributions done by diverse researchers across the world for improvising diagnostics in breast cancer. Section 3 discusses Materials and Methods. Section 4 highlights proposed methodology. Section 5 focusses on Experimentations, Resuls and Analysis. And, finally, Section 6 concludes the paper with future scope.
While mammography remains a stalwart in breast cancer screening, ultrasound (US) imaging offers a cost-effective and easily accessible alternative [3]. Beyond affordability and accessibility, ultrasound’s distinct advantage lies in its capacity to unveil the intricacies of dense breast tissue, a feat often elusive to mammography [4]. Breast tumor detection and classification in ultrasound imaging have been the focus of recent research efforts. Breast cancer is a significant health concern, and the accurate detection and classification of breast tumors are crucial for effective clinical management. Ultrasound imaging has emerged as a valuable tool for breast tumor detection, and recent research has focused on enhancing the accuracy of this modality through advanced image processing and classification techniques. Various novel approaches had been proposed to enhance the precision of breast ultrasound image analysis for identifying tissues, organs, and lesions. These approaches include the use of deep learning techniques such as convolutional neural networks (CNN), global average pooling (GAP)-guided attention loss function, generative adversarial networks (GAN), transfer learning (TL), and ensemble deep-learning-enabled clinical decision support systems.
A dual-input CNN with GAP-guided attention loss function was proposed for improved breast ultrasound tumor classification by Zou et al. [5], whereas a framework for breast mass classification from ultrasound images, incorporating GAN-based data augmentation and TL-based feature extraction was proposed by Chaudhary et al. [6]. Additionally, an ensemble deep-learning-enabled clinical decision support system was developed for breast cancer diagnosis and classification using ultrasound images by Ragab et al. [7]. Furthermore, the use of hybrid approaches, such as the CNN-Inception-V4-based hybrid approach for classifying breast cancer in mammogram images, was explored by Nazir et al. [8]. Several studies by diverse researchers had explored the application of deep learning algorithms for automatic breast tumor detection and classification using ultrasound images [9–11]. These studies had demonstrated the potential of deep learning techniques in improving the efficiency and accuracy of breast tumor diagnosis. Additionally, the development of automated systems for breast tumor detection and classification, including automatic tumor volume estimation, using deep learning techniques had been a focus of research. Furthermore, the combination of different imaging modalities, such as photoacoustic tomography and ultrasound, had shown promise in improving the detection of breast tumors [12]. Moreover, the integration of microwave imaging techniques had also been explored for breast cancer detection, highlighting the diverse range of imaging modalities being investigated for this application [13].
Moreover, the importance of early diagnosis in improving treatment outcomes for breast cancer patients had been emphasized by Anupama et al. [14] and this in turn required tailored processing steps in each stage of image processing. As a result, research efforts had been directed towards developing efficient pre-processing techniques and segmentation algorithms to classify lesions within breast cancer mammograms and ultrasound images [14,15]. These techniques aim to address challenges such as speckle noise and accurate segmentation of small tumors in ultrasound images. Bilateral filters [16], Speckle Reducing Anisotropic Diffusion filters [17], were introduced in the image pre-processing stages for the efficient removal of speckle noise. Additionally, the use of advanced image processing methods, such as speckle noise reduction algorithms, had been proposed to enhance the quality of ultrasound images for more accurate tumor detection [18]. A detailed case study of the importance of data augmentation in medical image processing was presented by Wulff et al. [19].
The efficiency of the segmentation stage is governed by the clear definition of linear boundaries, and avoiding the overprediction of certain classes. Segmentation of ultrasound images was effectively carried out using Active Contours [20] and enhanced level set Active Contours [21]. A dual-attention network-based concurrent segmentation method was introduced by Iqbal et al. [22] that improved the accuracy of lesion segmentation. A Deep learning approach with U-NET segmentation was presented by Tarighat [23] and Zhao et al. [24]. U-NET architectures had demonstrated effectiveness in enhancing segmentation quality, especially for varying-size objects, and had outperformed baseline models across different datasets and imaging modalities [25–28]. A combination of traditional methods in the early image processing stages and then using machine learning-based classification was experimentally found effective by many researchers. Convolution Neural Network CNN with Active Contours [29], Machine Learning (ML), and Genetic Optimization [30] were studied.
As a step above the detection and segmentation of lesions, the classification of tumors [31] and hence paving the way towards fully automated cancer diagnosis systems [32] is possible with the help of Artificial Intelligence (AI) techniques and is the topic of recent research. Optimization of AI-based techniques [33] is on the verge of development. A varied number of existing deep learning architectures were used in lesion detection from breast ultrasound (BUS) images [34]. Results could reveal that Convolutional Neural Network performs well in the detection and classification tasks [35]. A Deep neural network (DNN) model BUSnet that used an unsupervised bounding box regression algorithm was introduced by Li et al. [36]. A fusion of Reformed Differential Evaluation (RDE) techniques along with the Reformed Gray Wolf (RGW) optimization algorithm was used for the feature selection in the classification of the BUS dataset [37]. Detection and classification of the BUS dataset based on the TV model and GoogleLeNet model was proposed by Chen et al. [38]. Random forest-based classification was found effective in classifying BUS images [39]. A modified Random Forest classifier enhanced by a GridSearchCV was proposed by Li et al. [40].
Challenges such as identifying smaller lesions from noisy regions in (automated breast ultrasound) ABUS images were addressed with a stereoscopic attention network (SA-Net) [41]. The multi-view SA-Net unit uses a split output design to construct the 3D localization tensor and classification was done based on two features stereoscopic view and plane view to achieve excellent accuracy in the classification of ABUS images. Transfer learning based on combining different features is used effectively in prediction tasks [42]. While ultrasound imaging has shown promise in breast tumor detection, challenges such as differentiating between benign and malignant tumors persist. Some studies highlighted the limitations of current imaging modalities in accurately distinguishing between benign and malignant tumors [43]. This underscores the ongoing need for advanced diagnostic tools and techniques to address these challenges. While significant progress has been made, further research is needed to address the remaining challenges and advance the state-of-the-art in breast tumor detection and classification.
Major challenges associated with processing Ultrasound images for the classification of breast cancer are (i) the presence of speckle noise which reduces image’s contrast and resolution (ii) lack of well-annotated datasets which makes machine learning difficult (iii) over prediction of certain classes in segmentation which affects classification accuracy (iv) selecting the most appropriate features that could reduce overtraining and thus produce good classification accuracy. The proposed hybrid model addresses these challenges to achieve good classification accuracy.
The fundamental cornerstone of this research lies in the utilization of the Breast Ultrasound Images (BUSI) Database, a meticulously curated collection accessible at https://scholar.cu.edu.eg/Dataset_BUSI.zip. This repository comprises a diverse array of breast ultrasound images, meticulously selected and annotated for research purposes. The dataset encompasses 780 images, consisting of 133 normal (N), 437 benign (B), and 210 malignant (M) images.
Each image within the BUSI Database is endowed with crucial attributes vital for tumor classification, including patient information, lesion type (benign or malignant), image quality metrics, and pertinent clinical metadata. For this research, a subset of 160 images was strategically employed for both training (100 images) and testing (60 images). The training dataset comprises 30 normal (N), 30 malignant (M), and 40 benign (B) images, while the testing dataset encompasses 20 images from each class.
The significance of this dataset lies in its representation of diverse breast tissue conditions, enabling comprehensive training and evaluation of the classification models. Fig. 1 visually represents samples from the dataset across various classes. Fig. 1 represents the sample images depicting different classes within the dataset: Normal, Benign, and Malignant.

Figure 1: Sample images from the input dataset revealing the different classes of infection
Before any analytical procedures, a rigorous pre-processing phase was undertaken to elevate the dataset’s quality and consistency. Speckle noise, a common challenge in ultrasound image processing, was specifically addressed through various techniques:
• Noise Reduction: The focal point of this phase was the reduction of speckle noise, achieved through an Enhanced Speckle-Reducing Anisotropic Diffusion technique. This approach adeptly eliminated speckle noise while preserving critical image details, thus enhancing image clarity.
• Image Enhancement: Additional techniques like contrast adjustment and brightness normalization were meticulously applied to augment image quality and ensure uniform illumination across all images.
• Normalization: Intensity normalization was meticulously performed to standardize pixel values, mitigating variations attributed to diverse image acquisition settings.
• Data Augmentation: The augmentation process encompassed a spectrum of techniques including rotation, scaling, flips, and various geometric transformations. Iteratively, these operations augmented the original dataset, diversifying and enriching it with additional samples. This augmentation strategy is pivotal, particularly in scenarios where limited data availability poses a challenge in training robust deep-learning models.
Enhanced SRAD for Noise Reduction
The Enhanced SRAD technique, an integral facet of the pre-processing stage, merits specific attention due to its role in effectively reducing speckle noise in ultrasound images. This subsection elaborates on the theoretical underpinnings of Enhanced SRAD, delineating its mathematical models for noise reduction.
Conventional Anisotropic Diffusion (AD) effectively eliminates additive noise but tends to compromise edge information, especially when confronted with speckle noise. To overcome this limitation, the Enhanced SRAD technique incorporates the Instantaneous Coefficient of Variation (ICOV) to selectively reduce speckle noise while preserving edges.
The SRAD process operates via partial differential equations, as delineated by the Eqs. (1) through (10) provided below. These equations encapsulate the diffusion coefficient, threshold for diffusion, and the mathematical representation of the ICOV-based diffusion.
Let I(a, b) be the image intensity matrix without zeros and have finite power in the two-dimensional coordinate grid (Ω), a partial differential equation model of SRAD will produce an output I(a, b, t).
where, I(a, b) represents the image intensity matrix, div denotes divergence, ∇ is the gradient, c(f) is the diffusion coefficient, and T is the threshold. The characteristic of this diffusion coefficient is that it is more pronounced in homogenous regions and restricted around the image boundaries. Where,
Here f(a, b, t) is the instantaneous variation coefficient (ICOV) that is introduced to identify the edges in the image as it is more pronounced near the edges and less pronounced in the homogeneous regions. And
When
When
As T, the threshold is the determining factor of diffusion; T determines the amount of speckle reduction and edge information perseverance. Without using log compression, the SRAD filtering approach may process data immediately at the same time retaining the information content of the image.
The ICOV-based diffusion selectively acts as a filter during image pre-processing, enhancing images for subsequent machine learning-based segmentation. The quality of the image pre-processing step is verified by measurements such as SNR (Signal to Noise Ratio), Peak SNR (PSNR) that reveal the noise reduction capability, Mean Square Error (MSE) that shows the error, Structural Similarity Index Measure (SSIM) and the formula used for calculating the same are given by Eqs. (7) through (10) below:
Mathematical models govern the diffusion process, wherein a threshold parameter (T) plays a pivotal role in determining the balance between speckle reduction and edge information preservation. A meticulous evaluation of the pre-processing quality ensued, as showcased by the quantitative metrics in Table 1 and visualized in Fig. 2.
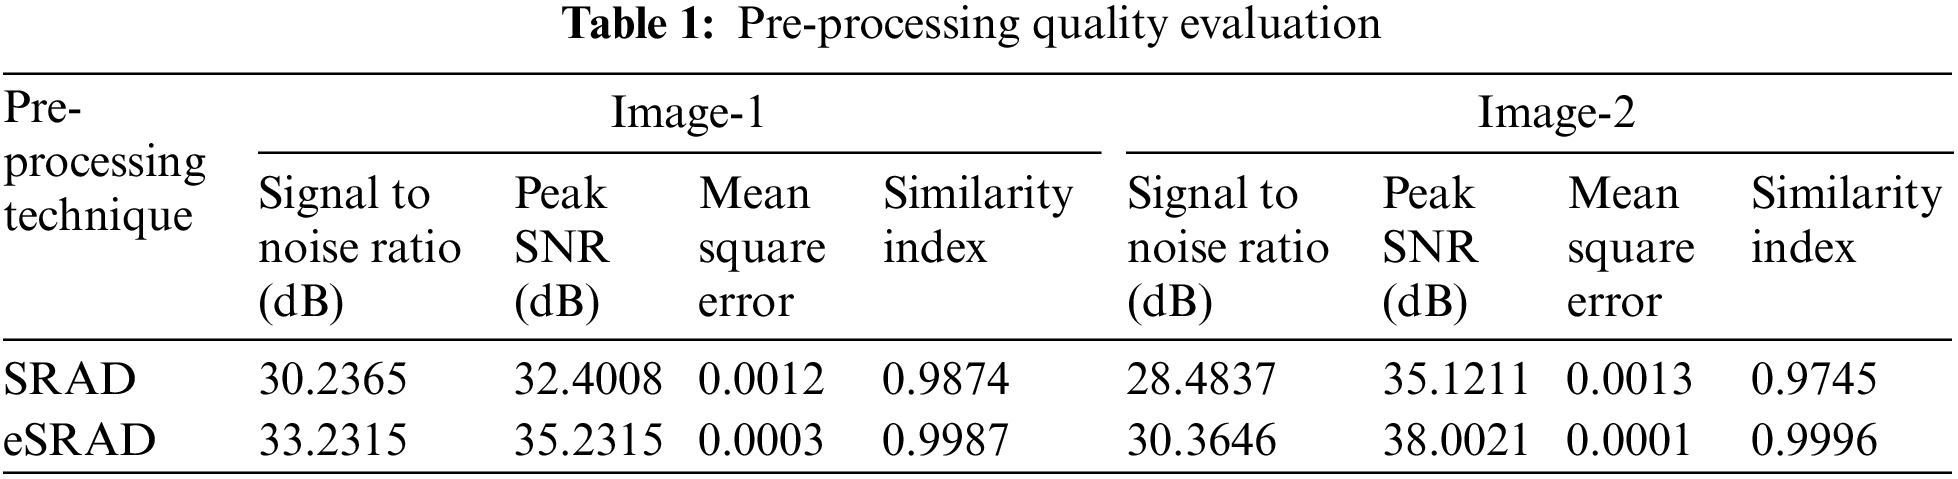

Figure 2: Sample input images (a & d), Noise removed output images (b, c, e & f)
The effective prediction and classification accuracy of a Deep Learning architecture fundamentally hinges upon the quantity and diversity of data samples used for training. In medical image processing scenarios where data scarcity prevails, data augmentation plays a pivotal role in enriching the training dataset. In our research, data augmentation strategies encompassed an array of operations including translation, rotation, gray value variation, and elastic deformations. These operations iteratively augmented the original dataset, ultimately diversifying it to accommodate an extensive sample set. This augmentation process significantly expanded the dataset to a total of 9000 samples, ensuring a more comprehensive and diverse representation across normal, malignant, and abnormal images.
3.2.1 U-NET-Based Image Segmentation
Segmentation plays an essential role in both image processing and pattern recognition. It facilitates the identification and separation of abnormalities for improved diagnosis. In our Computer-Aided Diagnosis (CAD) system, we employ segmentation to delineate Regions of Interest (ROIs). U-NET-based architecture dependent entirely on the convolution network is found to enhance the segmentation of ultrasound images effectively. Whereas, an Active Contour (snake model) is also a commonly used method for ROI separation. In many medical applications, active contour is widely adopted and hence a comparison between the active contour and U-NET architecture is carried out. U-NET is chosen for the framework and a tailored U-NET architecture is constructed for image segmentation. To achieve an optimal performance in time and complexity, a novel pre-processing is done and a tailored 5-stage U-NET is used for segmenting the pre-processed and augmented dataset. The equations that define the U-NET working include its activation function and its energy function. The U-NET energy function is given by
where, this summation is taken over
where, Pk = approximation of maximum function, ak(x) is an activation in feature channel k at pixel position x, and k is the number of classes.
The network learns the distinct borders between cells by making use of morphological operations. The weight map is given by
where, wc is the weight map to balance class frequencies, d1 is the distance to the border of the nearest cell, d2 is the distance to the border of the second nearest cell. Initial weights are assigned from Gaussian distribution with standard deviation
The pre-processed image is segmented in the next step and U-NET segmentation is governed by the energy function defined by Eq. (11). Softmax activation is used for U-NET and the segmented output obtained is used for classification of tumor lesions. Fig. 3 presents the architecture of U-NET.

Figure 3: Architecture of U-NET
The U-NET architecture presents a reliable and quick network for segmenting ultrasound images. It comprises of three sections: Contraction, Bottleneck, and Expansion. The Contraction phase consists of CNN layers, Rectified Linear Unit—(ReLU) layer, and down-sampling max-pooling layers. The Bottleneck layer mediates between Contraction and Expansion, while the Expansion section consists of CNN layers, ReLU layer, and up-sampling layers. The combination of these operations results in the U-shaped network architecture called the U-NET.
Inherent to the U-NET architecture are the contracting or down-sampling stages constructed from 2D convolution layers with fixed kernels and doubling channels or feature maps, followed by a tracking unit to converge cost functions faster and a max-pooling layer to divide the input at each stage. In our experiment, each of the contracting stages consists of two 2D convolution layers of kernel size 3 × 3 followed by a ReLU that thresholds the pixels less than zero and smoothens the image and a max-pooling layer that downsamples the image by a pool size of [5,5]. The first stage of the U-NET starts with a feature map of 32 which doubles in each stage up to 512 features. The image at the bottleneck is up-sampled by a transposed 2D convolution function of a 3 × 3 kernel and a feature map size of 256. Now, the expanding or up-sampling stages are constructed from two 2D CNNs with a kernel size of 3 × 3 followed by ReLU layers and a transposed 2D convolution layer of 3 × 3 kernel, feature map of size half that of the previous stage. The U-NET in total consists of 18-2D convolution layers, 4 transposed convolution layers, 18 ReLU layers, 4 max-pooling layers, one fully connected layer, and one soft-max layer. A pixel classification layer follows the soft-max to label each pixel for the segmentation step. The flowchart depicting the process involved with segmenting an image using the U-NET algorithm is given in Fig. 4.

Figure 4: U-NET segmentation flowchart
The efficiency of the classification stage is dependent on the effectiveness of feature extraction and selection. Twelve different combinations of classification experiments are conducted to determine the best-performing classification stage. The experiments are framed by using (i) Three different classifiers say Random Forest, Neural Network, and Bagging tree, (ii) Two feature selection algorithms say Genetic Algorithm and Leave One Out Cross-Validation (LOOCV) algorithm and (iii) Two feature extraction algorithms say Wavelet transforms and Gray Level Co-occurrence Matrix (GLCM). Each of them is explained below.
Texture feature extractions can be classified as statistical, structural, transform-based, model-based, graph-based, learning-based, and entropy-based approaches and in this experiment, the most frequently used transform-based approach say multiscale wavelet transform is compared with Gray Level Co-occurrence Matrix (GLCM) for texture feature extraction. Textural features are calculated using wavelet transforms and GLCM to gain insights into image content. Wavelet transforms and—GLCM-based textural feature extractions were found to perform well in the extraction of features from ultrasound images and thus they are chosen for the extraction process.
Wavelet coefficients when employed for feature extraction from hyperspectral data involve calculating entropy, standard deviation, energy, waveform length, and variance from the image. GLCM serves as a fundamental tool for extracting second-order statistical texture features which include Mean, Contrast, Standard Deviation, Correlation, Energy, Homogeneity, Skewness, Kurtosis, and Entropy. The formulae for these features are provided in Table 2.

In this phase, we assess two commonly used feature selection methods Genetic Algorithm (GA) and Leave One Out Cross-Validation (LOOCV) to determine the most efficient approach.
LOOCV Algorithm: LOOCV is a type of K-fold validation technique that estimates machine learning model performance. It involves leaving one observation out for validation while the rest serve as the training set. The model is then used to make predictions on the left-out observation, and the Mean Square Error (MSE) is computed. This process is repeated ‘n’ times, as illustrated by Eqs. (14) and (15). LOOCV provides deterministic and accurate results. The advantage of using LOOCV is that it is highly deterministic and tends to be accurate.
Genetic Algorithm: Genetic Algorithms (GA) are stochastic methods employed for optimizing machine learning-based systems. GA is particularly effective for feature selection in image processing, hyperparameter tuning in Artificial Neural Networks (ANNs), and pipeline optimization in machine learning. Here in our experiment the classification accuracy is used to select the most relevant features alone from the feature set and this is found to result in better accuracy. Table 3 presents the LOOCV and Genetic Algorithm based algorithms being used for feature selection.

Mean Square Error
Three different models Random Forest, Bagging tree, and Neural Network classifiers are chosen for evaluating the best model for lesion classification. Their classification efficiencies are compared to select the best classifier for our model. The theoretical explanations, mathematical modeling, and algorithmic descriptions of the classifiers are discussed below.
Random Forest (RF) Classifier: Random Forest (RF) is a versatile ML algorithm used for prediction and classification tasks. It builds decision trees from random samples and combines their results through majority voting or averaging. Capable of handling both continuous and discrete variables, random forest improves accuracy while reducing error rates when multiple decision trees are involved. The RF accuracy depends on the number of trees created in the forest and it uses batching and randomisation in constructing each tree which is prescribed by the Gini index given by
Bagging Tree Classifier: The Bagging Tree is an ensemble-based Bootstrap Aggregation algorithm that efficiently optimizes classifier robustness and accuracy, especially in high-dimensional data with missing values. It reduces inconsistency in machine learning models, making it useful for handling variations in datasets. An ensemble method of numerous models predicts the class with the highest probability of the chosen category. The formula to determine the class with the highest probability is given by
Neural Network Classifier: Artificial Neural Networks (ANNs) mimic the behavior of the human brain and have been effectively employed for ultrasound image classification. ANNs consist of input, hidden, and output layers, with interconnected nodes applying thresholds and weights. They are particularly suited for classification tasks.
Early diagnosis remains the cornerstone of saving lives from cancer and thus has motivated researchers to explore the potential of computer-aided diagnosis (CAD) for cancer detection and classification tasks. Our proposed image processing model aims to improve the classification and segmentation accuracy of breast ultrasound images. The model is capable of categorizing the ultrasound images into normal, affected benign, or malignant. The image processing model is developed in steps by comparing the efficiencies of the most popular algorithms used in each image processing stage. A block diagram representation of the techniques and algorithms studied in each stage of the hybrid model development is illustrated in Fig. 5. A hybrid model is developed comparing the experimental results obtained from each stage of image processing.

Figure 5: Different techniques and algorithms studied in the development of proposed hybrid model system
4.1 Hybrid Model Architecture—Flowchart and Its Algorithm
Highlighting feature of the proposed hybrid model is the collective use of best techniques in every stage of US image processing. The image processing pipeline starts with an efficient pre-processing stage powered by tailored eSRAD filtering that uses anisotropic diffusion (AD) filtering which is efficient towards reducing speckle noise in US images. A major limitation with AD filtering is its inability to preserve edges, which is addressed in eSRAD filtering by fixing the diffusion threshold based on the instantaneous variation coefficient (ICOV). Edge preserved, speckle reduced US images are segmented by using U-NET DNN. The U-NET architecture introduced in the model uses a 5-stage encoding powered by 2D Convolutional layers, ReLU layer, Max-pooling layer ending up in a bottleneck layer which is followed by 5-stage decoding carried out by transposed convolution layer, 2D convolution layer and ReLU layer. A fully connected layer and softmax layer follows the decoding stage and feeds the pixel classification layer which could effectively descriminate the background and the foreground pixels. Segmentation by U-NET is chosen, as it is experimentally proven effective compared to the conventional active contour (Snake) model. US image pre-processing and segmentation being done by tailored diffusion filtering and U-NET DNN, respectively, the classification stage of the hybrid model is chosen by conducting twelve different experiments to select the best techniques for feature extraction, selection and classification tasks. Based on experimental results, Genetic algorithm that uses classification accuracy based fitness function is used to select the most appropriate texture features extracted by GLCM. Comparing the classification accuracies, Bagging tree classifier is used in the proposed hybrid model for effective classification of lesions. Flowchart of the proposed model is given in Fig. 6 whereas its algorithm is detailed in Algorithm 3.

Figure 6: Flowchart depicting the hybrid model algorithm
Image classification represents the final stage in image analysis. In our CAD system, ultrasound images are used and lesions are classified into normal, benign, or malignant. The Bagging Tree is an ensemble-based Bootstrap Aggregation algorithm that efficiently optimizes classifier robustness and accuracy, especially in high-dimensional data with missing values. Missing data values characterised by incomplete information about the patient or the anomaly being studied is a common issue with healthcare data analysis problems. Such a situation results from (i) information lost with time, (ii) missed data entry, (iii) incomplete data provided by patient or (iv) unskilled data annotation. Missing values result in degrading the prediction accuracy of an AI model. And thus developing AI model with robustness against missing values are gaining importance nowadays. Tree-based approaches and penalised regression approaches were found effective in handling high-dimensional data with missing values. One such approach is the Bagging tree classifier.

5 Experimentation, Results and Analysis
The experiment was conducted on a workstation with an Intel(R) Core(TM) i5 Processor, 8 GB RAM, Intel Iris Xe Graphics Card, and 512 GB SSD. The proposed novel hybrid model for the effective classification after segmentation of lesions from the BUSI database suggests the uses of eSRAD filtering in the pre-processing stage, U-NET-based Segmentation methodology followed by feature extraction and feature selection by using GLCM and Genetic Algorithm and classification by bagging tree algorithm. The effectiveness of the above hybrid model is proven compared to the most competitive algorithm in each step of image processing. The experiment is carried out using MATLAB software and the BUSI online dataset.
The efficiency of our proposed model evaluated for various performance metrics is presented in this section. Image samples were obtained from an online open-source database. We quantitatively assessed the algorithm’s performance using metrics such as sensitivity, specificity, and accuracy. Among them, the Bagging Tree classifier demonstrated the highest performance. Error rates are measured from the false predictions say false positive and false negative values whereas the accuracy of a prediction is measured from the true positive and true negative results as compared to total predictions, respectively. Where, True Positive (TP) results when predicted output as well as the actual value are both true, and True Negative (TN) results when both predicted as well as the actual value are false. Similarly, False positive (FP) represents a condition when the predicted output is positive while the actual output is negative, and false negative (FN) results when the prediction is negative when the actual value is positive. The performance parameters used for evaluation are defined in Table 4 below
5.3 Results and Compartive Analysis
5.3.1 Results Cum Comparison of Active Contour and U-NET-Based Segmentation
The training images were sourced from the augmented image datastore to train the network effectively by providing a slightly different dataset for each epoch of training. The dataset is divided into testing and training sets in the ratio 70:30. In addition, the name-value pair of (ColorPreProcessing, gray2rgb) is used to obtain uniform-sized images that contain the same number of channels as the input of the U-NET layer. The images are then normalized and fed to the neural network.
The U-NET neural network used in the segmentation step is 5 levels deep with each encoding stage consisting of 2 layers of 2D CNN, one ReLU, and one Max-pooling layer. The first stage of encoding has 32 neurons and, in each stage, the number of neurons doubles whereas the images are down-sampled. This network at the bottleneck has 512 neurons and the expanding stage has layers in which the image is up-sampled and the number of neurons reduced by half in each stage. Finally, a fully connected layer and softmax layer send the output to the pixel classification layer. The dice function is used to find the similarity coefficient of the segmentation result from the ground truth.
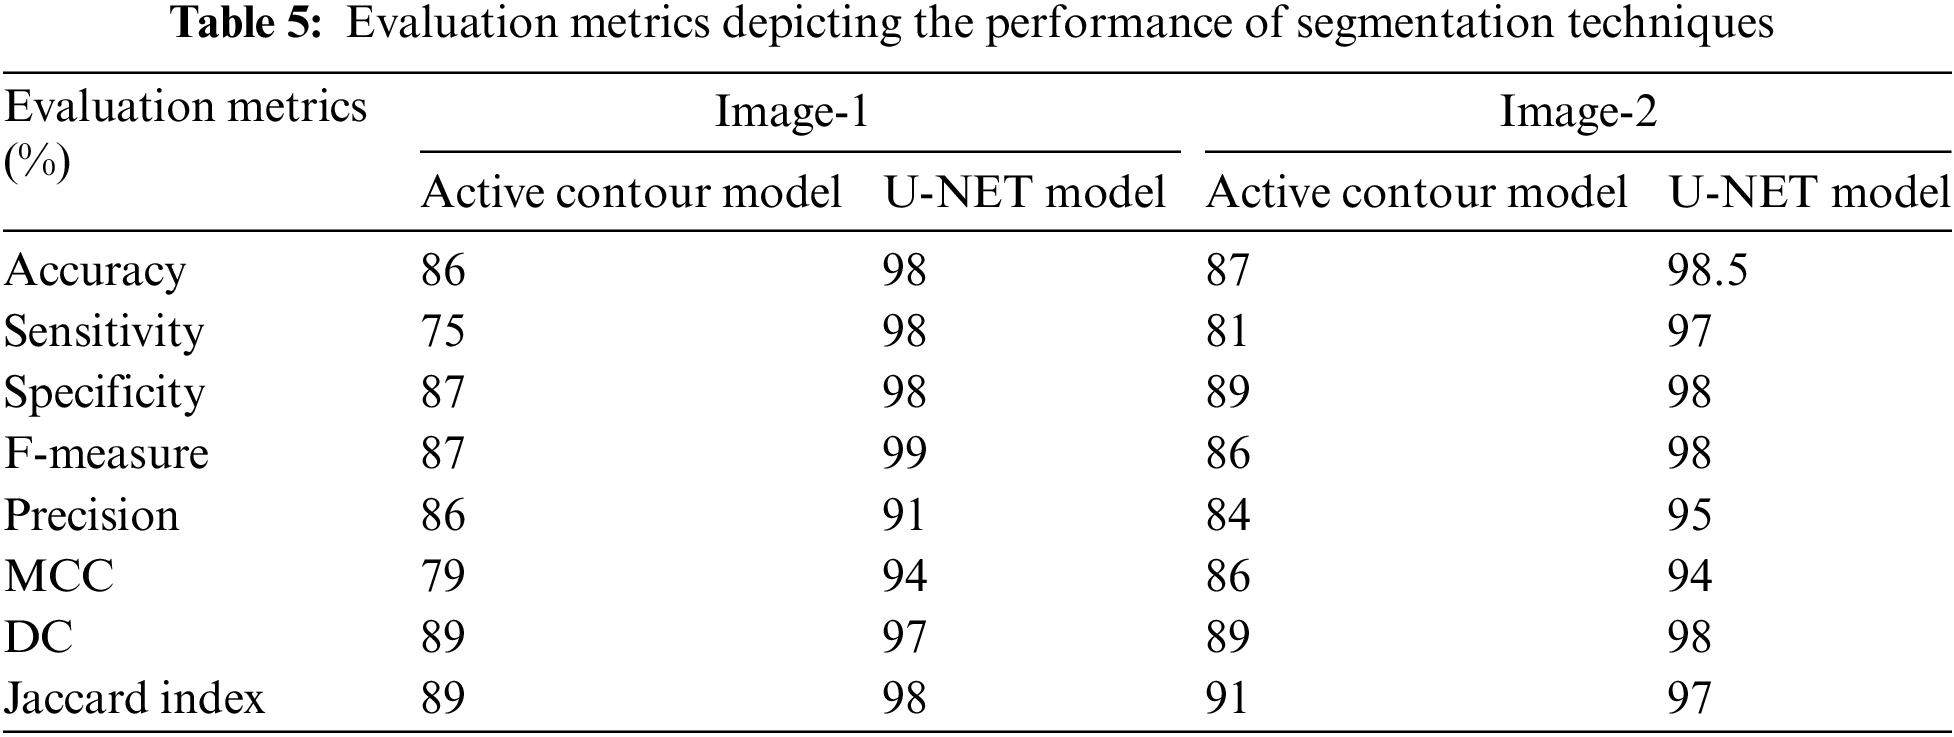
The Active Contours segmentation without edges [44] is used for comparison of segmentation performance. Such an active contour method is chosen as they are recommended for images whose foregrounds and backgrounds are statistically different and homogeneous similar to our source images. The active contour-based segmentation function implemented is run for a larger number of iterations to get a good segmentation response. Samples corresponding to 500 and 200 iterations are presented as examples. The performance parameters say Accuracy, Sensitivity, F-measure, Precision, MCC, Dice, Jaccard, and Specificity of segmentation are calculated using the function “EvaluateImageSegmentationScores” for the two different segmentation steps and it is found that U-NET outperformed the traditional active contour-based segmentation. Fig. 7 reveals the comparison of accuracy achieved in the case of using Active contour and U-NET algorithms for segmentation. Whereas the image outputs in Figs. 8 and 9 show the input image and the output images corresponding to the Benign and Malignant classes after being segmented by the Active contour model and Figs. 10a and 10b reveal the segmentation results from the UNET model. Table 5 presents the performance metrics of the segmentation step.
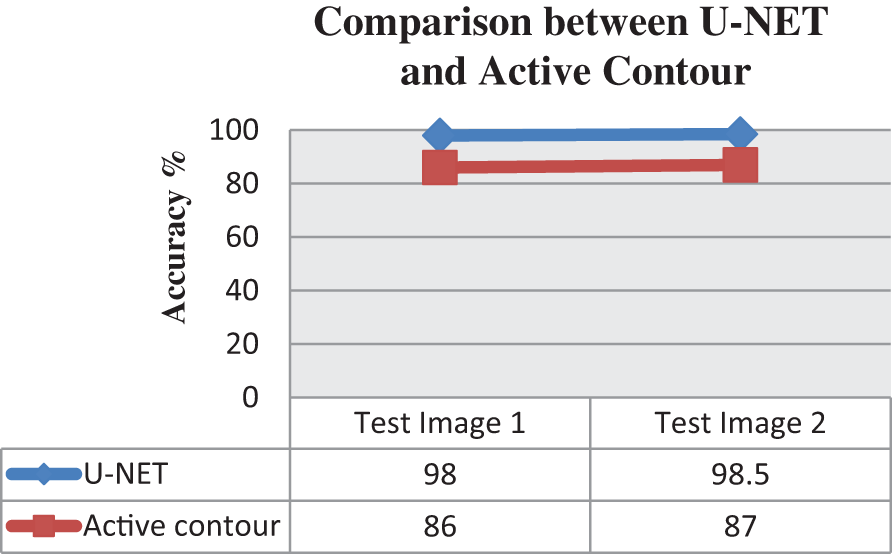
Figure 7: Graphical representation between U-NET and active contour

Figure 8: Active contour-based segmentation on Benign

Figure 9: Active contour-based segmentation on Malignant

Figure 10: (a) The segmented output of benign. (b) The segmented output of malignant
5.3.2 Comparison of Classification Accuracy by Different Machine Learning Classifiers
A Multi-scale wavelet transform with a window size of 5, window spacing of 5, and a sampling frequency of 50 is used to extract the features of the image dataset say Energy, Variance, Standard Deviation, and Waveform Length. A Grey Level Co-occurrence matric is created for the images as GLCM is a direct indication of the horizontal proximity of the pixels and thus could better reveal the correlation between the pixels in an image. As a classification of the lesions mainly depends on the texture of the image, the texture features of the image say contrast—a measure of the variance, correlation—probability of occurrence, energy—the sum of the square of each element, homogeneity—the closeness of each element is extracted from the properties of GLCM matrix.
Feature selection by Leave one-out cross-validation and genetic algorithm is done followed by a classification task to determine the best feature selection algorithm and classifier for the hybrid model. LOOCV feature selection uses the mean squared error values as the determining factor to select a feature and the different classifiers are run to determine the classification accuracy. Genetic algorithm is an evolutionary algorithm though initially developed to obtain optimized solutions, that are found effective in selecting the best features for classification tasks. The selection operator finds the best fitting features whereas the mutation and cross-over operators diversify the search space. The classification accuracy is considered as the fitness function to determine the features to be selected for classification. Classification of the images by three classifiers random forest, neural network, and bagging tree is carried out to determine the best classifier.
The performance of the classifier for different combinations of feature extraction, feature selection, and classification resulted in running 12 different combinations of experiments, and the corresponding performances are measured by parameters say Accuracy, sensitivity, specificity, and ROC. Accuracy, sensitivity, and specificity are measures based on confusion matrices whereas ROC is measured from the ROC curves. Receiver Operating Characteristics ROC is a graphical performance measure which represents the performance of the classifier over a range of true positive rate vs. false negative rate. A good classifier will have a ROC above 95% and the area under the ROC curve will be nearing 1, i.e., with an AUC value nearing 1. The ROC curves for the 12 different experiments are depicted in Figs. 11a to 11l. The performance of the classification task is represented graphically in Fig. 12 and Table 6 provides the observed values of performance parameters for different combinations of feature extraction algorithms, feature selection algorithms, and classifiers. It highlights the varying performance across different scenarios, emphasizing the Bagging Tree classifier’s superiority in several cases.
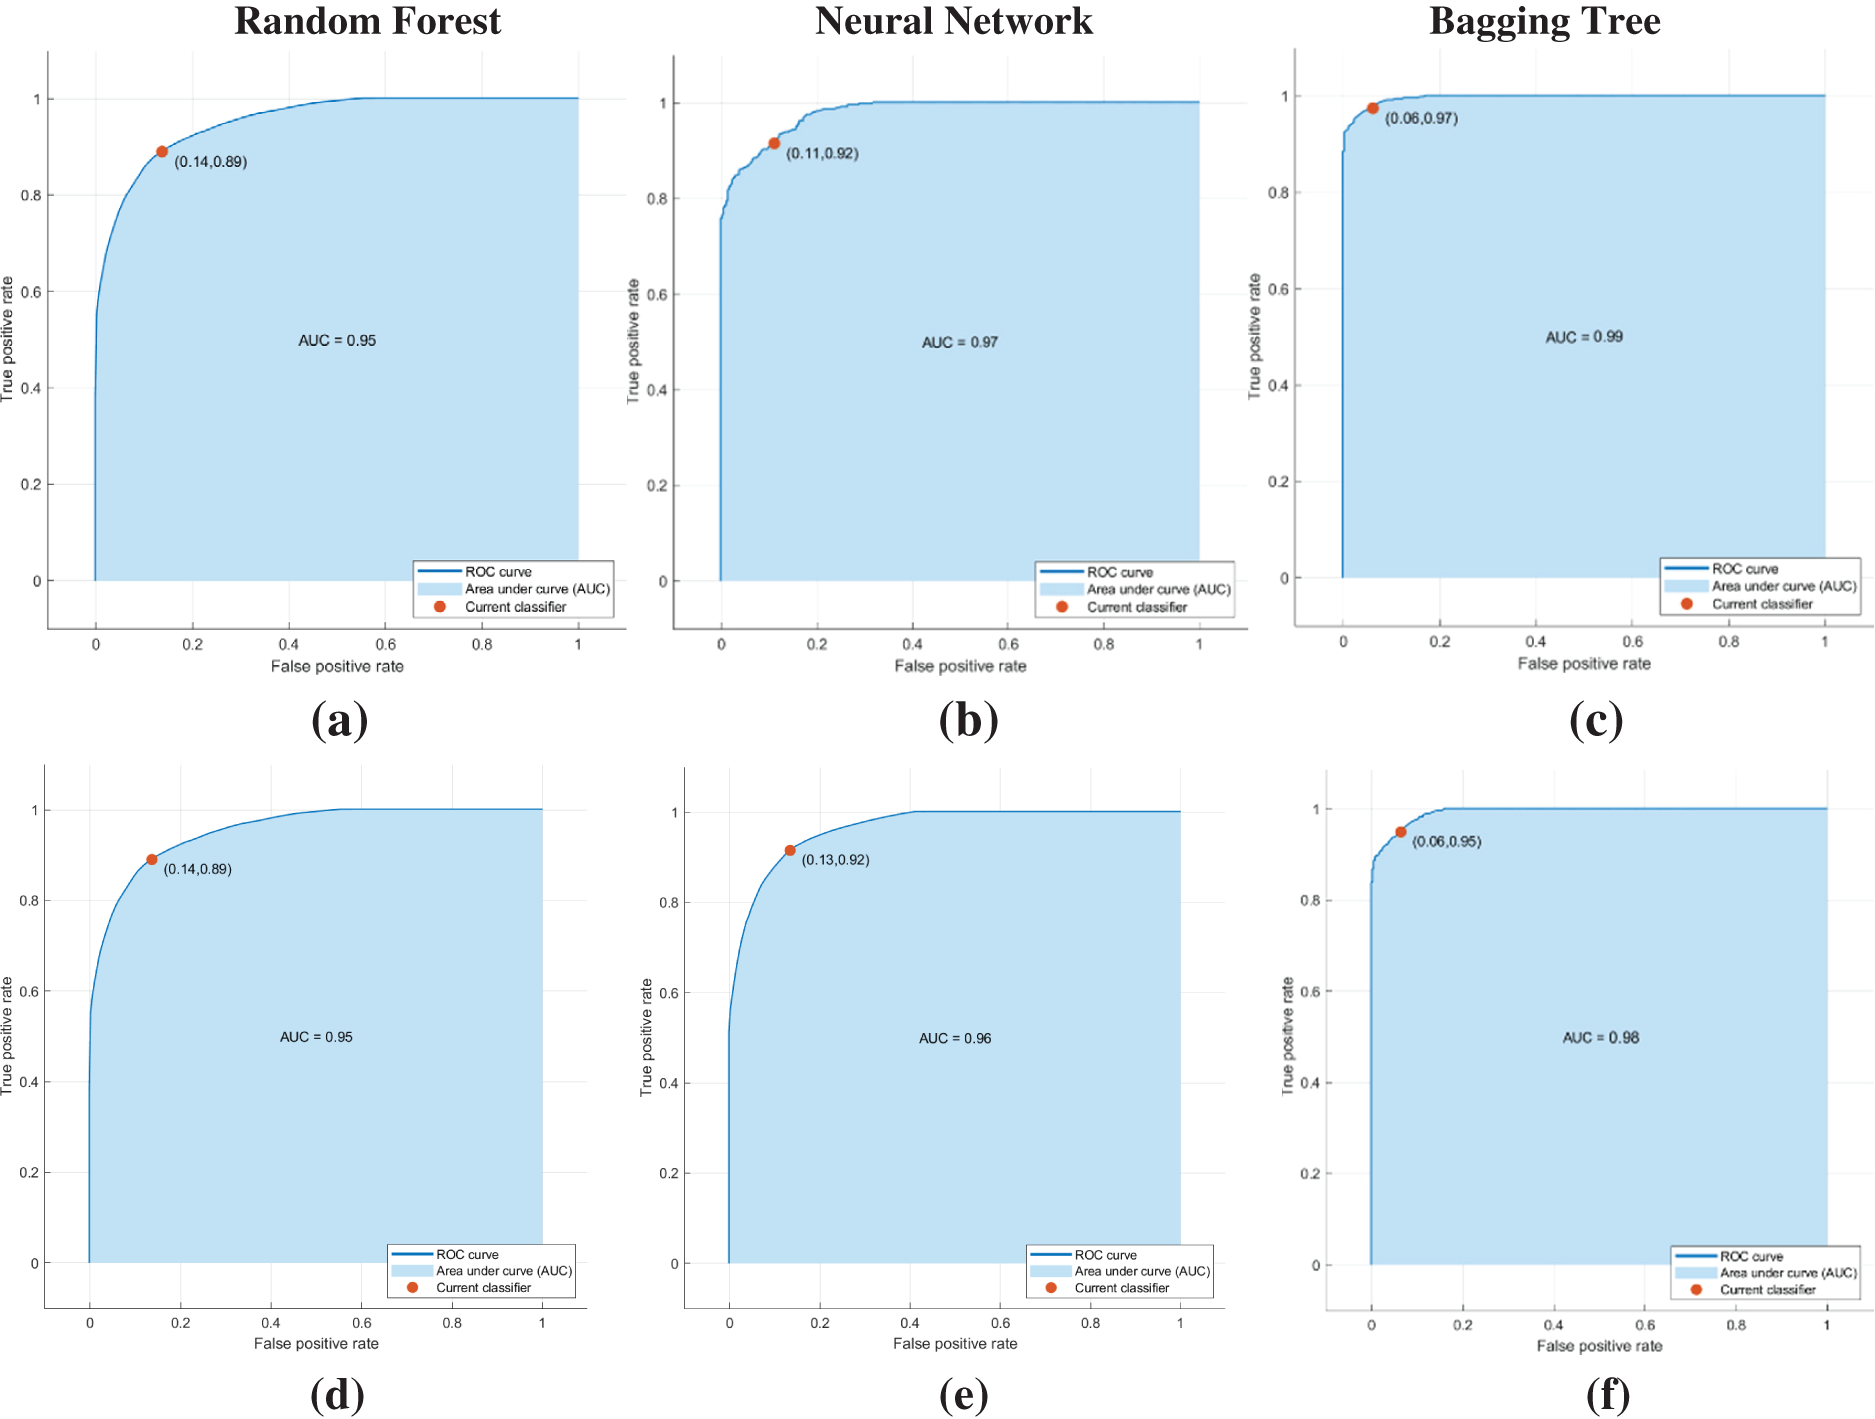

Figure 11: (a–c) ROC curves obtained when wavelet transformed feature extraction and LOOCV-based feature selection are used for classification. (d–f) ROC curves obtained when wavelet transformed feature extraction and Genetic Algorithm based feature selection is used (g–i) ROC curves obtained when GLCM based feature extraction and LOOCV based feature selection (j–l) ROC curves obtained when GLCM based feature extraction and Genetic Algorithm based feature selection

Figure 12: Accuracy of the classifiers
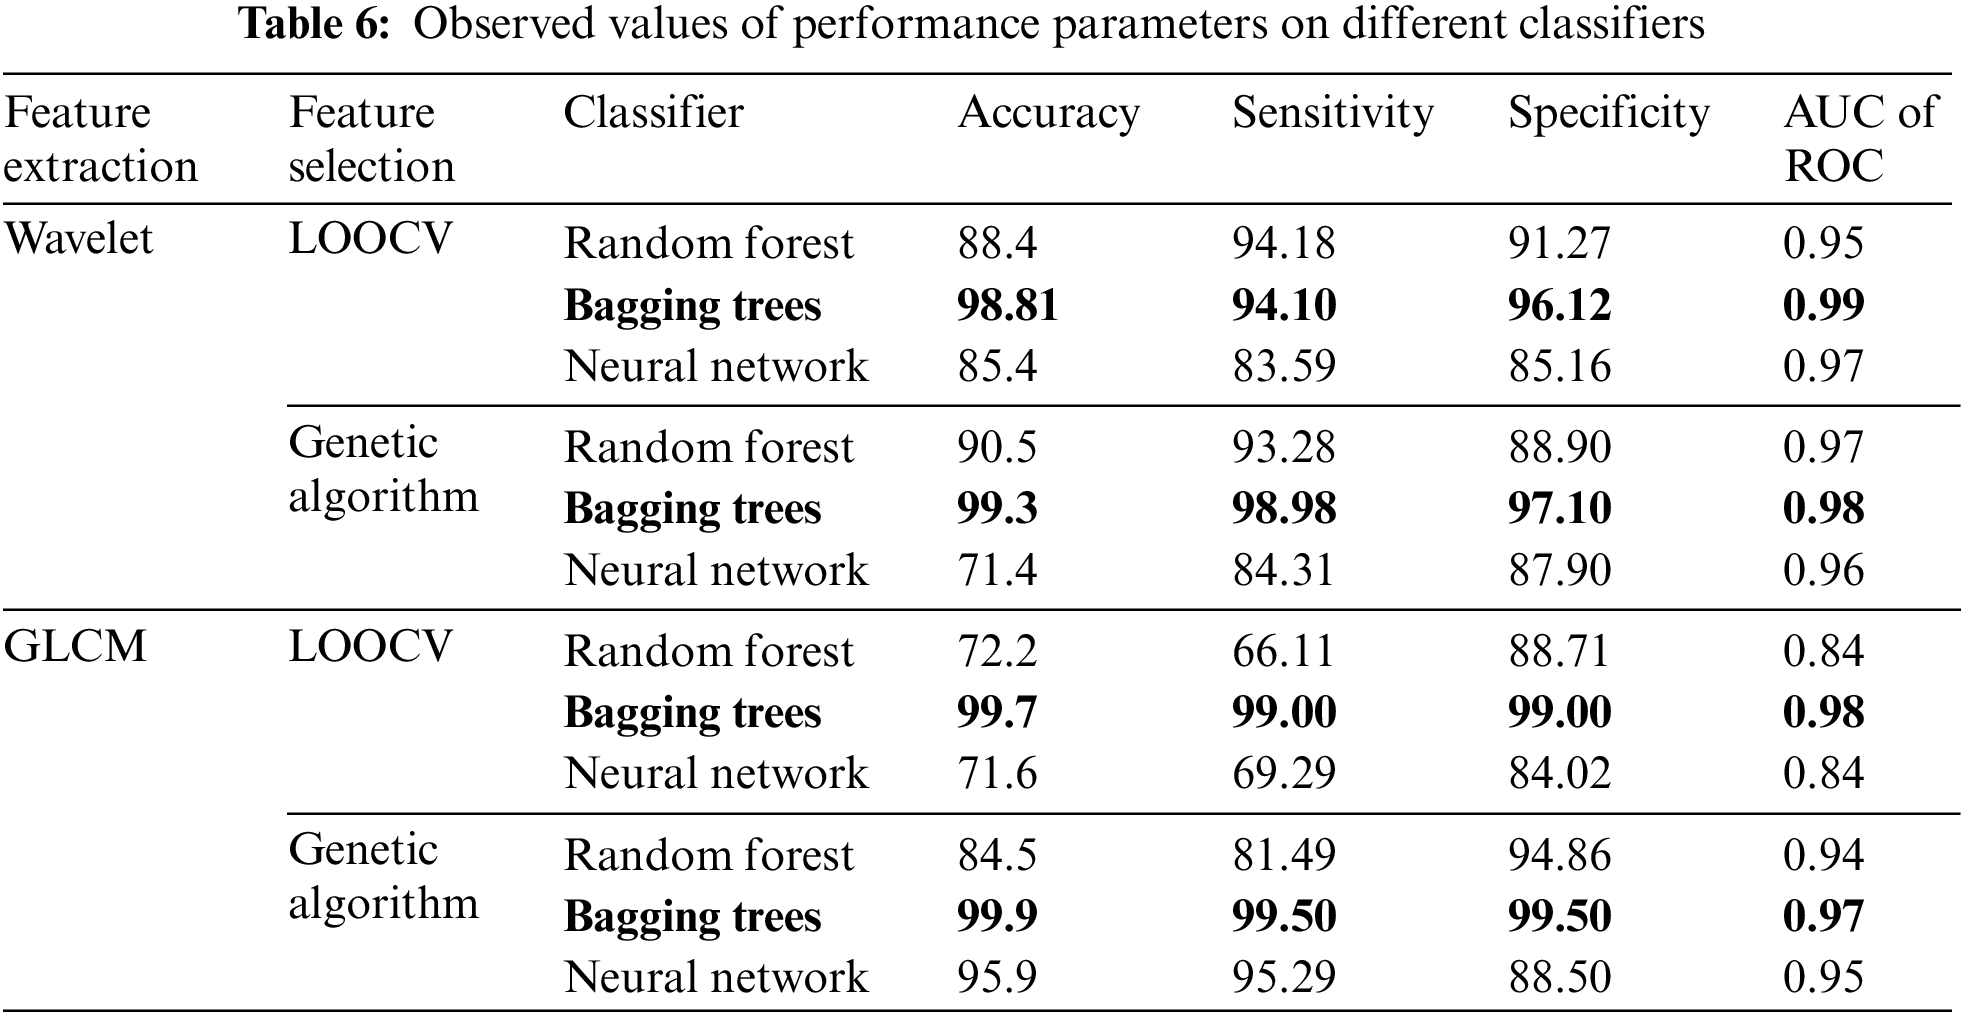
The comparison of various performance parameters from Table 6 reveals that the classification by the Bagging Tree algorithm consistently outperforms Random Forest and Neural Network when features were extracted and selected using GLCM and GA.
5.3.3 Comparison of the Proposed Model with Models Existing in the Literature
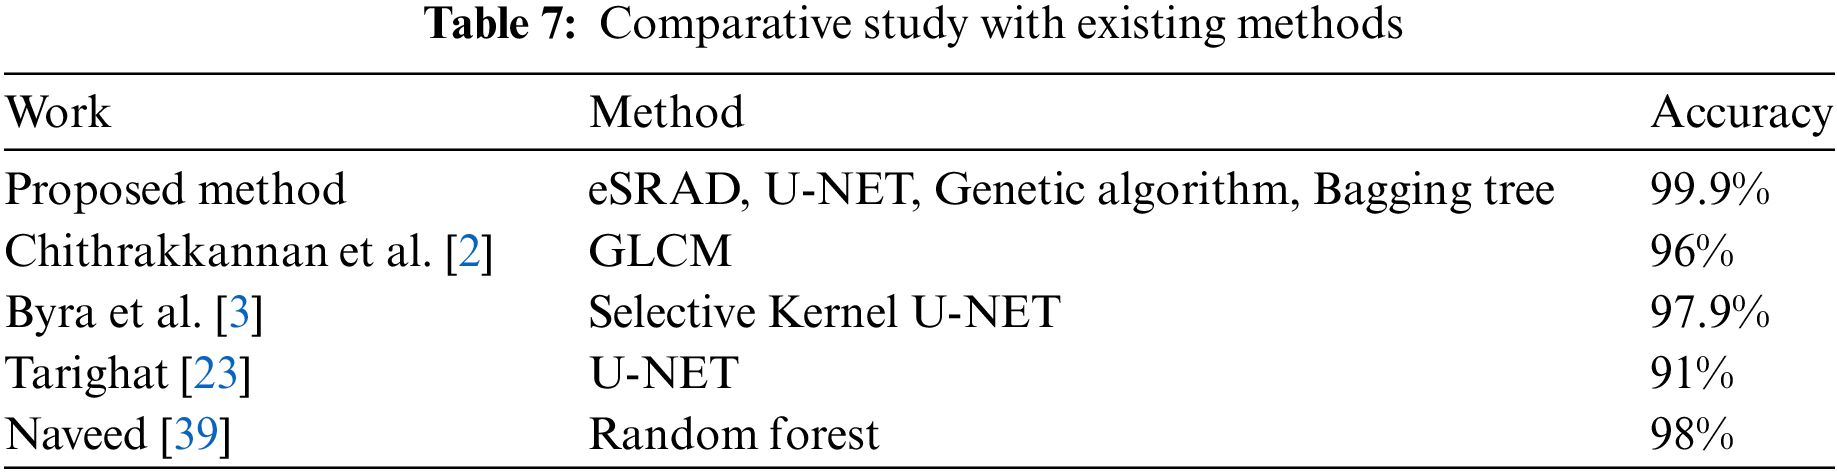
To evaluate the performance of our proposed method, we have conducted a comparative study with different research papers and existing techniques. Some of these papers employed similar techniques but with different algorithms [21,23,45,46], while others explored ensemble methods with distinct datasets [29] and [47]. Table 7, provided below, showcases our proposed method’s performance in comparison to other studies. The proposed method consistently outperforms existing work, achieving superior accuracy levels. This comparison highlights that the proposed approach, which combines U-NET, Genetic Algorithm, and Bagging Trees, achieved the highest accuracy of 99.9% which surpasses the performance of other techniques and underscores the effectiveness of our methodology.
The proposed model could achieve the highest accuracy of 99.9% due to its inherent tailored image processing stages. The pre-processing and the subsequent image-processing stages are carefully curated after comparing the most effective algorithms in each stage. The highlighting features that pawed way for achieving this high result include (i) eSRAD filtering: Ultrasound images are corrupted by speckle noise and hence effective speckle reduction is carried out by an enhanced Speckle Reducing Anisotropic Diffusion filter with diffusion coefficients tailored by an instantaneous coefficient of variance, ICOV and the output PSNR reveals the effectiveness of the eSRAD filtering (ii) 5-level deep U-NET based segmentation that could segment the lesions which are proven from the accuracy of the results achieved and (iii) ensemble-based bagging tree classifier that utilizes an ensemble of different classifiers to predict the classifier with the highest probable prediction accuracy. Thus, the trained hybrid model could make predictions with the highest accuracy.
The research heralds a ground-breaking methodology for breast ultrasound image classification, presenting innovative approaches and demonstrating remarkable achievements. The hybrid model, comprising Enhanced SRAD for speckle noise reduction, U-NET-based segmentation, Genetic Algorithm-driven feature selection, and classification employing Bagging Trees, stands as a testament to meticulous development through rigorous comparisons, with the overarching aim to enhance the accuracy and efficiency of ultrasound image classification. The culmination of these efforts resulted in an astounding 99.9% accuracy rate in classifying breast lesions into normal, malignant, or benign tissues. The significance of our research lies in its potential to revolutionize breast cancer diagnosis, promising increased accuracy and efficiency in clinical settings.
The main highlights of our work revolve around Enhanced SRAD’s noise reduction capabilities, the precision of U-NET-based Segmentation, the efficacy of Genetic Algorithm-driven Feature Selection, and the robustness of Bagging Trees Classification. However, our study is not without limitations. Expanding the dataset to encompass a broader and more diverse range of ultrasound images presents a critical avenue for further validation of the robustness and generalizability of our methodology. A more extensive dataset can fortify the model’s capabilities to adapt to varied scenarios and patient demographics, enhancing its real-world applicability and reliability. Moreover, while our methodology has showcased impressive accuracy, continual refinement and optimization remain imperative. Efforts to reduce computational overhead while maintaining or even enhancing accuracy will pave the way for more seamless integration into clinical practice.
In the near future, we plan to perform collaborations with medical institutions for real-time validation and integration of the proposed methodology into clinical workflows that can propel its adoption and ensure its utility in aiding healthcare professionals. And, in addition, there is a plan to test and validate the proposed hybrid methodology on more advanced datasets.
Acknowledgement: The authors acknowledge and extend their appreciation to the Researchers Supporting Project Number (RSPD2024R996), King Saud University, Riyadh, Saudi Arabia for funding this study.
Funding Statement: This research was funded through Researchers Supporting Project Number (RSPD2024R996), King Saud University, Riyadh, Saudi Arabia.
Author Contributions: The authors confirm contribution to the paper as follows: study conception and design: S. Shobana; data collection: Judith Justin; analysis and interpretation of results: R. Vanithamani, Miguel Villagómez Galindo, Mushtaq Ahmad Ansari, draft manuscript preparation and critical revision: K. Umapathi, Anand Nayyar, Hitesh Panchal. All authors reviewed the results and approved the final version of the manuscript.
Availability of Data and Materials: Data will be made available on request.
Conflicts of Interest: The authors declare that they have no conflicts of interest to report regarding the present study.
References
1. J. Baek, A. M. O’Connell, and K. J. Parker, “Improving breast cancer diagnosis by incorporating raw ultrasound parameters into machine learning,” Mach. Learn.: Sci. Technol., vol. 3, no. 4, pp. 045013, Dec. 2022. doi: 10.1088/2632-2153/ac9bcc. [Google Scholar] [PubMed] [CrossRef]
2. R. Chithrakkannan, P. Kavitha, T. Mangayarkarasi, and R. Karthikeyan, “Breast cancer detection using machine learning,” Int. J. Innov. Technol. Expl. Eng. (IJITEE), vol. 8, no. 11, pp. 3123–3126, Sept. 2019. doi: 10.35940/ijitee.K2498.0981119. [Google Scholar] [CrossRef]
3. M. Byra et al., “Breast mass segmentation in ultrasound with selective kernel U-Net convolutional neural network,” Biomed. Signal Process. Control, vol. 61, pp. 102027, Jun. 2020. doi: 10.1016/j.bspc.2020.102027. [Google Scholar] [PubMed] [CrossRef]
4. M. Amiri, R. Brooks, B. Behboodi, and H. Rivaz, “Two-stage ultrasound image segmentation using U-Net and test time augmentation,” Int. J. Comput. Assist. Radiol. Surg., vol. 15, no. 6, pp. 981–988, Apr. 2020. doi: 10.1007/s11548-020-02158-3. [Google Scholar] [PubMed] [CrossRef]
5. X. Zou et al., “Improved breast ultrasound tumor classification using dual-input CNN with GAP-guided attention loss,” Math. Biosci. Eng., vol. 20, no. 8, pp. 15244–15264, Jul. 2023. doi: 10.3934/mbe.2023682. [Google Scholar] [PubMed] [CrossRef]
6. S. Chaudhury and K. Sau, “Classification of breast masses using ultrasound images by approaching GAN, transfer learning and deep learning techniques,” J. Artif. Intell. Technol., vol. 3, pp. 142–153, May 2023. doi: 10.37965/jait.2023.0175. [Google Scholar] [CrossRef]
7. M. Ragab, A. Albukhari, J. Alyami, and R. Mansour, “Ensemble deep-learning-enabled clinical decision support system for breast cancer diagnosis and classification on ultrasound images,” Biol., vol. 11, no. 3, pp. 439, Mar. 2022. doi: 10.3390/biology11030439. [Google Scholar] [PubMed] [CrossRef]
8. M. Nazir et al., “A novel CNN-inception-V4-based hybrid approach for classification of breast cancer in mammogram images,” Wirel. Commun. Mobile Comput., vol. 2022, pp. 1–10, Jul. 2022. doi: 10.1155/2022/5089078. [Google Scholar] [CrossRef]
9. P. Labcharoenwongs, S. Vonganansup, O. Chunhapran, D. Noolek, and T. Yampaka, “An automatic breast tumor detection and classification including automatic tumor volume estimation using deep learning technique,” Asian Pac. J. Cancer Prev., vol. 24, no. 3, pp. 1081–1088, Mar. 2023. doi: 10.31557/APJCP.2023.24.3.1081. [Google Scholar] [PubMed] [CrossRef]
10. M. Hassanien, V. Singh, D. Puig, and M. Abdel-Nasser, “Predicting breast tumor malignancy using deep ConvNeXt radiomics and quality-based score pooling in ultrasound sequences,” Diagnostics, vol. 12, no. 5, pp. 1053, 2022. doi: 10.3390/diagnostics12051053. [Google Scholar] [PubMed] [CrossRef]
11. Y. Wang, T. Kuo, Y. Chou, Y. Su, S. Huang, and C. Chen, “Breast tumor classification using short—ResNet with pixel-based tumor probability map in ultrasound images,” Ultrasonic Imaging, vol. 45, no. 2, pp. 74–84, Mar. 2023. doi: 10.1177/01617346231162906. [Google Scholar] [PubMed] [CrossRef]
12. G. Sangha et al., “Assessment of photoacoustic tomography contrast for breast tissue imaging using 3D correlative virtual histology,” Sci. Rep., vol. 12, no. 1, pp. 438, Feb. 2022. doi: 10.1038/s41598-022-06501-3. [Google Scholar] [PubMed] [CrossRef]
13. F. Zerrad et al., “Microwave imaging approach for breast cancer detection using a tapered slot antenna loaded with parasitic components,” Mater., vol. 16, no. 4, pp. 1496, Feb. 2023. doi: 10.3390/ma16041496. [Google Scholar] [PubMed] [CrossRef]
14. Y. Anupama, S. Amutha, and R. Ramesh, “An efficient preprocessing technique for multimodality breast cancer images,” Int. J. Online Biomed. Eng. (IIOE), vol. 19, no. 8, pp. 88–96, Jun. 2023. doi: 10.3991/ijoe.v19i08.40043. [Google Scholar] [CrossRef]
15. M. Elbaz, H. Elwahsh, and I. El-Henawy, “Proposed framework for detection of breast tumors,” Comput. Mater. Continua, vol. 74, no. 2, pp. 2927–2944, Oct. 2023. doi: 10.32604/cmc.2023.033111. [Google Scholar] [CrossRef]
16. A. E. Ilesanmi, O. P. Idowu, U. Chaumrattanakul, and S. S. Makhanov, “Multiscale hybrid algorithm for pre-processing of ultrasound images,” Biomed. Signal. Process. Control, vol. 66, no. 3, pp. 102396, Jan. 2021. doi: 10.1016/j.bspc.2020.102396. [Google Scholar] [CrossRef]
17. H. Choi and J. Jeong, “Despeckling algorithm for removing speckle noise from ultrasound images,” Symmetry, vol. 12, no. 6, pp. 938, Jun. 2020. doi: 10.3390/sym12060938. [Google Scholar] [CrossRef]
18. X. Li, Y. Wang, Y. Zhao, and Y. Wei, “Fast speckle noise suppression algorithm in breast ultrasound image using three-dimensional deep learning,” Front. Physiol., vol. 13, pp. zsaa112, Apr. 2022. doi: 10.3389/fphys.2022.880966. [Google Scholar] [PubMed] [CrossRef]
19. D. Wulff, M. Mehdi, F. Ernst, and J. Hagenah, “Cross data set generalization of ultrasound image augmentation using representation learning: A case study,” Curr. Dir. Biomed. Eng., vol. 7, no. 2, pp. 755–758, Oct. 2021. doi: 10.1515/cdbme-2021-2193. [Google Scholar] [CrossRef]
20. C. Keatmanee, U. Chaumrattanakul, K. Kotani, and S. S. Makhanov, “Initialization of active contours for segmentation of breast cancer via fusion of Ultrasound, Doppler, and elasticity images,” Ultrasonics, vol. 94, no. 6, pp. 438–453, 2019. doi: 10.1016/j.ultras.2017.12.008. [Google Scholar] [PubMed] [CrossRef]
21. A. Rodtook, K. Kirimasthong, W. Lohitvisate, and S. S. Makhanov, “Automatic initialization of active contours and level set method in ultrasound images of breast abnormalities,” Pattern Recognit., vol. 79, no. 4, pp. 172–182, Jul. 2018. doi: 10.1016/j.patcog.2018.01.032. [Google Scholar] [CrossRef]
22. A. Iqbal and M. Sharif, “MDA-Net: Multiscale dual attention-based network for breast lesion segmentation using ultrasound images,” Comput. Inf. Sci., vol. 34, no. 9, pp. 7283–7299, Oct. 2022. doi: 10.1016/j.jksuci.2021.10.002. [Google Scholar] [CrossRef]
23. A. P. Tarighat, “Breast tumor segmentation using deep learning by U-Net network,” J. Telecommun.—Electron. Comput. Eng. (JTEC), vol. 13, no. 2, pp. 49–54, Jun. 2021. [Google Scholar]
24. T. Zhao and H. Dai, “Breast tumor ultrasound image segmentation method based on improved residual U-Net network,” Comput. Intell. Neurosci., vol. 2022, pp. 9, Jun. 2022. doi: 10.1155/2022/3905998. [Google Scholar] [PubMed] [CrossRef]
25. Z. Zhou, M. Siddiquee, N. Tajbakhsh, and J. Liang, “UNet++: Redesigning skip connections to exploit multiscale features in image segmentation,” IEEE Trans. Med. Imaging, vol. 39, no. 6, pp. 1856–1867, Jun. 2020. doi: 10.1109/TMI.2019.2959609. [Google Scholar] [PubMed] [CrossRef]
26. N. Siddique, P. Sidike, C. Elkin, and V. Devabhaktuni, “U-net and its variants for medical image segmentation: A review of theory and applications,” IEEE Access, vol. 9, pp. 82031–82057, Jun. 2021. doi: 10.1109/access.2021.3086020. [Google Scholar] [CrossRef]
27. T. Liu, H. Wang, M. Christian, C. Chang, F. Lai and H. Tai, “Automatic segmentation and measurement of pressure injuries using deep learning models and a lidar camera,” Sci. Rep., vol. 13, no. 680, pp. 39, Jan. 2023. doi: 10.1038/s41598-022-26812-9. [Google Scholar] [PubMed] [CrossRef]
28. N. Ibtehaz and M. Rahman, “MultiResUNet: Rethinking the u-net architecture for multimodal biomedical image segmentation,” Neural Netw., vol. 121, pp. 74–87, Jan. 2020. doi: 10.1016/j.neunet.2019.08.025. [Google Scholar] [PubMed] [CrossRef]
29. Y. Hu et al., “Automatic tumor segmentation in breast ultrasound images using a dilated fully convolutional network combined with an active contour model,” Med. Phys., vol. 46, no. 1, pp. 215–228, Oct. 2018. doi: 10.1002/mp.13268. [Google Scholar] [PubMed] [CrossRef]
30. F. Torres et al., “Lesion detection in breast ultrasound images using a machine learning approach and genetic optimization,” in Pattern Recognition and Image Analysis, pp. 289–301. doi: 10.1007/978-3-030-31332-6_26. [Google Scholar] [CrossRef]
31. V. Jackins, S. Vimal, M. Kaliappan, and M. Y. Lee, “AI-based smart prediction of clinical disease using random forest classifier and Naive Bayes,” J. Supercomput., vol. 77, no. 5, pp. 5198–5219, Nov. 2020. doi: 10.1007/s11227-020-03481-x. [Google Scholar] [CrossRef]
32. M. Kumari and V. Singh, “Breast cancer prediction system,” Procedia Comput. Sci., vol. 132, no. 1, pp. 371–376, Jun. 2018. doi: 10.1016/j.procs.2018.05.197. [Google Scholar] [CrossRef]
33. S. Chaudhary, Y. Arora, and N. Yadav, “Optimization of random forest algorithm for breast cancer detection,” Int. J. Innov. Res. Comput. Sci. Technol. (IJIRCST), vol. 8, no. 3, pp. 63–66, May 2020. doi: 10.21276/ijircst.2020.8.3.4. [Google Scholar] [CrossRef]
34. Z. Cao, L. Duan, G. Yang, T. Yue, and Q. Chen, “An experimental study on breast lesion detection and classification from ultrasound images using deep learning architectures,” BMC Med. Imaging., vol. 19, no. 51, pp. 299, Jul. 2019. doi: 10.1186/s12880-019-0349-x. [Google Scholar] [PubMed] [CrossRef]
35. Y. Gu et al., “Deep learning based on ultrasound images assists breast lesion diagnosis in China: A multicenter diagnostic study,” Insights Imaging, vol. 13, no. 1, pp. 115, Jul. 2022. doi: 10.1186/s13244-022-01259-8. [Google Scholar] [PubMed] [CrossRef]
36. Y. Li, H. Gu, H. Wang, P. Qin, and J. Wang, “BUSnet: A deep learning model of breast tumor lesion detection for ultrasound images,” Front. Oncol., vol. 12, pp. 900, Mar. 2022. doi: 10.3389/fonc.2022.848271. [Google Scholar] [PubMed] [CrossRef]
37. K. Jabeen et al., “Breast cancer classification from ultrasound images using probability-based optimal deep learning feature fusion,” Sens., vol. 22, no. 3, pp. 807, Jan. 2022. doi: 10.3390/s22030807. [Google Scholar] [PubMed] [CrossRef]
38. S. Chen, Y. Wu, C. Pan, L. Lian, and Q. Su, “Breast ultrasound image classification and physiological assessment based on GoogLeNet,” J. Radiat. Res. Appl. Sci., vol. 16, no. 3, pp. 100628, Sept. 2022. doi: 10.1016/j.jrras.2023.100628. [Google Scholar] [CrossRef]
39. S. S. Naveed, “Prediction of breast cancer through random forest,” Curr. Med. Imaging, vol. 19, no. 10, pp. 12, Nov. 2022. doi: 10.2174/1573405618666220930150625. [Google Scholar] [PubMed] [CrossRef]
40. J. Li, J. Shi, J. Chen, Z. Du, and L. Huang, “Self-attention random forest for breast cancer image classification,” Front. Oncol., vol. 13, pp. 101880, Feb. 2023. doi: 10.3389/fonc.2023.1043463. [Google Scholar] [PubMed] [CrossRef]
41. W. Ding, H. Zhang, S. Zhuang, Z. Zhuang, and Z. Gao, “Multi-view stereoscopic attention network for 3D tumor classification in automated breast ultrasound,” Expert. Syst. Appl., vol. 234, no. 1, pp. 120969, Dec. 2023. doi: 10.1016/j.eswa.2023.120969. [Google Scholar] [CrossRef]
42. D. A. Dattatray, H. Mehadi, M. Vijay, and R. Chittibabu, “Deep learning-based feature fusion and transfer learning for approximating pIC value Of COVID-19 medicine using drug discovery data,” J. Mech. Med. Biol.,World Scientific Publishing Co., pp. 2350100, 2023. doi: 10.1142/S0219519423501002. [Google Scholar] [CrossRef]
43. M. Wei et al., “A benign and malignant breast tumor classification method via efficiently combining texture and morphological features on ultrasound images,” Comput. Math. Methods Med., vol. 2020, pp. 1–12, 2020. doi: 10.1155/2020/5894010. [Google Scholar] [PubMed] [CrossRef]
44. T. F. Chan and L. A. Vese, “Active contours without edges,” IEEE Trans. Image Process., vol. 10, no. 2, pp. 266–277, Feb. 2001. doi: 10.1109/83.902291. [Google Scholar] [PubMed] [CrossRef]
45. K. Yu, S. Chen, and Y. Chen, “Tumor segmentation in breast ultrasound image by means of res path combined with dense connection neural network,” Diagnostics, vol. 11, no. 9, pp. 1565, Aug. 2021. doi: 10.3390/diagnostics11091565. [Google Scholar] [PubMed] [CrossRef]
46. P. Wahdan, P. Nagy, A. Saad, and A. Shoukry, “Automated breast tumour detection in ultrasound images using support vector machine and ensemble classification,” J. Biomed. Eng. Biosci., vol. 3, pp. 4–11, May 2016. doi: 10.11159/jbeb.2016.002. [Google Scholar] [CrossRef]
47. K. Naga Durga and K. V. Krishnam Raju, “An improved prediction of breast cancer using deep neural networks (DNN),” Int. J. Modern Trends Sci. Technol., vol. 7, no. 0706221, pp. 25–30, Jul. 2021. doi: 10.46501/IJMTST0707005. [Google Scholar] [CrossRef]
Cite This Article
 Copyright © 2024 The Author(s). Published by Tech Science Press.
This work is licensed under a Creative Commons Attribution 4.0 International License , which permits unrestricted use, distribution, and reproduction in any medium, provided the original work is properly cited.
 Downloads
 Citation Tools