
 Submit a Paper
 Propose a Special lssue
 Open Access
ARTICLE

An Implementation of Multiscale Line Detection and Mathematical Morphology for Efficient and Precise Blood Vessel Segmentation in Fundus Images
1 Department of Electrical and Computer Engineering, COMSATS University Islamabad, Abbottabad Campus, Abbottabad, 22060, Pakistan
2 Department of Computer Engineering, College of Computer and Information Sciences, King Saud University, P. O. Box 51178, Riyadh, 11543, Saudi Arabia
3 Faculty of Information and Communication Technology, University Tunku Abdul Rehman, Kampar Campus, Kampar, 31900, Malaysia
4 Centre for Intelligent Signal and Imaging Research, University Teknologi PETRONAS, Bandar Seri Iskandar, Perak, 32610, Malaysia
5 School of Computing Sciences, University of East Anglia, Norwich, NR47TJ, UK
* Corresponding Authors: Syed Ayaz Ali Shah. Email: ; Aamir Shahzad. Email:
(This article belongs to the Special Issue: Recent Advances in Ophthalmic Diseases Diagnosis using AI)
Computers, Materials & Continua 2024, 79(2), 2565-2583. https://doi.org/10.32604/cmc.2024.047597
Received 10 November 2023; Accepted 15 March 2024; Issue published 15 May 2024
 View Full Text
 Download PDF
Abstract
Diagnosing various diseases such as glaucoma, age-related macular degeneration, cardiovascular conditions, and diabetic retinopathy involves segmenting retinal blood vessels. The task is particularly challenging when dealing with color fundus images due to issues like non-uniform illumination, low contrast, and variations in vessel appearance, especially in the presence of different pathologies. Furthermore, the speed of the retinal vessel segmentation system is of utmost importance. With the surge of now available big data, the speed of the algorithm becomes increasingly important, carrying almost equivalent weightage to the accuracy of the algorithm. To address these challenges, we present a novel approach for retinal vessel segmentation, leveraging efficient and robust techniques based on multiscale line detection and mathematical morphology. Our algorithm’s performance is evaluated on two publicly available datasets, namely the Digital Retinal Images for Vessel Extraction dataset (DRIVE) and the Structure Analysis of Retina (STARE) dataset. The experimental results demonstrate the effectiveness of our method, with mean accuracy values of 0.9467 for DRIVE and 0.9535 for STARE datasets, as well as sensitivity values of 0.6952 for DRIVE and 0.6809 for STARE datasets. Notably, our algorithm exhibits competitive performance with state-of-the-art methods. Importantly, it operates at an average speed of 3.73 s per image for DRIVE and 3.75 s for STARE datasets. It is worth noting that these results were achieved using Matlab scripts containing multiple loops. This suggests that the processing time can be further reduced by replacing loops with vectorization. Thus the proposed algorithm can be deployed in real time applications. In summary, our proposed system strikes a fine balance between swift computation and accuracy that is on par with the best available methods in the field.Graphic Abstract
Keywords
The study of retinal images is a non-intrusive technique of choice for diagnosing different diseases such as cardiovascular illnesses, glaucoma, age-related macular degeneration, diabetic retinopathy, etc. It is one of the most important areas of medical image processing. It deals with the extraction of clinically applicable knowledge or information from retinal images. Retinal images are images of the fundus or the back of the eye. These are acquired using a fundus photography apparatus. The fundus images are obtained either with a color filter (called color fundus images or retinal images) or using specialized dyes, e.g., fluorescein (in that case they are called fluorescein fundus images or fundus fluorescein angiograms). The obtained images are then analyzed by an ophthalmologist manually. Contrary to fluorescein fundus images where the contrast-enhancing agent is used [1,2], color fundus images have low and inconsistent contrast [3]. Shown in Fig. 1 are parts of an image of the same patient using two different fundus images namely the fluorescein fundus image and the color fundus image [4]. It could be easily noticed that the blood vessels are well contrasted in the fluorescein fundus image. While in color fundus images not only vessels have comparatively low contrast, but many fine vessels are also missing. Thus diagnostic systems using color retinal images are expected to have inferior performance, and overcoming low and varying contrast remains an open research problem [5].

Figure 1: (a) Fluorescein fundus image, (b) color fundus image
The clinically important features in retinal images include optic disc, blood vessels, pathological structures such as exudates, Microaneurysms, hemorrhages, etc., (if exist) as shown in Fig. 2. Medical practitioners monitor the blood vessel structure to get an insight into patient health. The structure of retinal blood vessels reveals several indications which can be used to predict the disease and precautions can be advised. Accurately segmenting blood vessels is an important task in diagnosing hypertension, stroke, diabetic retinopathy, etc. [3]. While there are several state-of-the-art methods for detecting blood vessels, high accuracy could only be achieved at the cost of high complexity and computation in terms of memory and execution time. With recent developments in technology, new alternatives such as 4-D retinal videos and high-resolution images become available to provide even more information about the retina. With the surge of now available big data, the speed of the algorithm becomes increasingly important, carrying almost equivalent weightage to the accuracy of the algorithm [6,7]. Thus, it means that we need to design a blood vessel segmentation system with both comparable accuracy and high speed in computation.

Figure 2: Labelled are some of the clinically important features
In general, segmenting retinal vessels is a difficult task because of (a) low and varying contrast, (b) low uniformity in illumination, (c) pathologies that appear as bright objects in retinal images such as exudates, (d) dark pathologies such as hemorrhages and microaneurysms, which might further deteriorate the effectiveness of retinal vessel segmentations, and (e) having a central reflex, i.e., a brighter strip over the central line in several thick blood vessels, as shown in Fig. 3. To overcome these issues, we propose an algorithm based on image preprocessing, multiscale line detector (MSLD) and mathematical morphology approach. The green channel in the preprocessing stage was selected since the vessels are relatively well contrasted. The green channel was first normalized by subtracting the mean value from each pixel and dividing by its standard deviation. The background of the normalized image was then estimated using median filtering and removed from the normalized image to obtain the preprocessed image. Using the fast operations of a multiscale line detector, top-hat transform with disc shape, and simple thresholding, candidate blood vessel pixels were obtained. These operations were done with the hope of overcoming the aforementioned issues. The candidate blood vessel pixels were post-processed again by using a top-hat transform but this time with a linear structuring element to remove non-elongated objects such as pixels from hemorrhages/microaneurysms and other objects. This might help address the issues of dark pathologies. The rationale of this research work is the need for a fast and relatively accurate blood vessel segmentation method that addresses the issues of the complexity of algorithms and required accuracy. The major contribution of the proposed algorithm is to combine MSLD and mathematical morphology which were fast and noise-resilient in producing results similar to the state-of-the-art, albeit with a relatively small amount of time.

Figure 3: Central reflex: (a) colored, (b) green channel, (c) inverted green channel, top row part of image from DRIVE dataset and bottom row part of image from STARE dataset
The main contributions of the proposed work are as follows:
1. To develop an accurate fast and efficient blood vessel segmentation method.
2. To propose a hybrid fast and noise-resilient method by combining MSLD and mathematical morphology.
The proposed algorithm has been examined using two readily accessible datasets, i) Digital Retinal Images for Vessel Extraction dataset, DRIVE [8] and ii) Structure Analysis of Retina, STARE [9]. Using the proposed algorithm, the average sensitivity, accuracy, and specificity values obtained are 0.9467, 0.9535 0.6952, 0.6809, and 0.9838, 0.9847 for the DRIVE and STARE datasets, respectively. More importantly, the proposed algorithm achieved the above results on an average of 3.73 and 3.75 s per image on DRIVE and STARE datasets, respectively. The rest of this paper is organized as follows: Section 2 presents the literature review, Section 3 presents the theoretical background, Section 4 presents the proposed methodology, Section 5 reports the results and discussion of the proposed methodology, and Section 6 concludes this paper.
Retinal blood vessel segmentation is an ongoing research area being studied by many. Based on the literature review, the methods of segmentation of the retinal vessels can be generally categorized as either supervised or unsupervised schemes. In general, the supervised approach achieves finer accuracy compared to the unsupervised methods [10,11]. They could be further categorized according to the strategies used to segment the retinal blood vessel, namely i) multiscale, ii) matched filtering, iii) mathematical morphology, iv) hierarchical, v) model, and vi) deep learning approaches [12]. Example filter-based approaches are [8,13–15] and morphology based on mathematics [16–19]. Retinal vessel segmentation according to hierarchical detections are given in [20–23], and model-based approaches are [24,25]. Deep learning-based approaches are getting attention due to their high accuracy [26,27]. Example deep learning approaches are [28–32]. However, deep learning approaches require large datasets for training and also, they require computer systems with much higher computational capabilities. On the contrary, conventional methods are still preferred due to their applicability for real-time use and the lower demand for training data.
Among all the state-of-the-art, multiscale line detector is among the time-efficient approaches for retinal vessel segmentation [33]. To overcome the central reflex problem, Ricci et al. [34] proposed a technique utilizing a support vector and line detector machine. The line detector approach was later modified by Nguyen et al. [33]. They called it a multiscale line detector (MSLD) and used multiple scales.
To summarize, we can divide the existing methods into three categories namely i) Supervised methods based on manual features, ii) Deep Learning based methods, and iii) Unsupervised methods based on manual features. The first category requires extensive training while the second category requires high computational resources including high-performance expansive hardware and a lot of training data which is normally not available in the case of medical image analysis. The first two categories achieve better accuracy. In the case of the third category, which does not require training and expansive hardware resources is thus the preferred category. So the problem of achieving better accuracy using an unsupervised method is addressed here by proposing a combination of MSLD and Mathematical Morphology. The proposed unsupervised method not only achieves results similar to state-of-the-art but also takes less time.
The blood vessels and other red objects appear dark (having low-intensity values) in the green channel. By inverting the green channel (IGC) the darkened objects, like blood vessels shown as bright objects. The basic line detector proposed by [34] uses IGC. It uses a window of size W × W pixels, positioned at each pixel, and computes the average gray level denoted by
where
where
where
Mathematical morphology (MM) is linked to the shape or morphology of the features in an image. The MM has been used for the detection of different objects in an image. Images are thought of as a set in this case, and necessary elements can be recovered by delving into the image with a different group of recognized shapes images. The revealing form is called the structuring element [38]. The structuring element can have a range of sizes and forms based on the elements that need to be eliminated. Among the different morphological operations available, we used top-hat transform in the proposed system. Top-hat transform can be used for grayscale images and binary images. For the grayscale image I, is defined in Eq. (4).
where IoB represents the Image (I) opening with structuring element B. Based on the shapes of the objects to be detected, B is chosen. The opening operation eliminates all the objects of interest from the image. Subtracting the opened image from the original image (top-hat transform) will lead to the removal of all other items and retain only the objects of interest. By utilizing the top-hat transform in this manner, we may maintain a list of all the items of interest based on morphology or shape. Details can be found in [38]. Thus, we need to know the shape of the object of interest to be detected in the image. Hence, to detect elongated objects such as blood vessels, which are in different orientations, linear structuring elements in multiple orientations can be used. Top-hat transform with linear structuring elements applied in different orientations will keep the blood vessels and remove the non-elongated objects. Similarly, to detect other shapes such as ROI/Optic disc boundary, disc-shaped structuring elements can be used to detect objects of disc shapes.
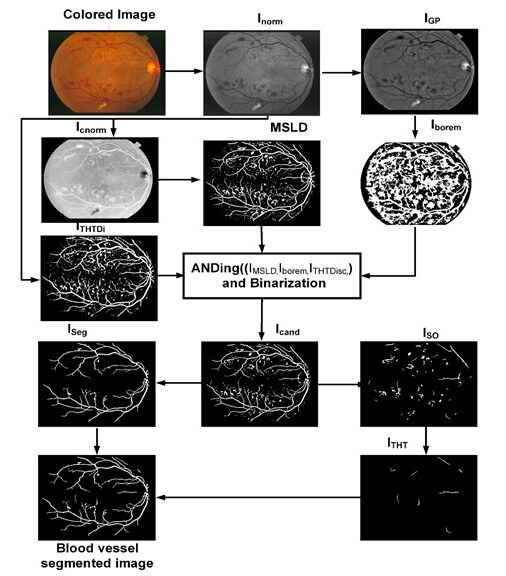
The proposed algorithm consists of image preprocessing, application of a multiscale line detector, and post-processing based on length filtering and mathematical morphology. The flow chart of the algorithm along with images obtained after each step is shown in Fig. 4. The color retinal images suffer from low and varying contrast and non-uniform illumination, therefore, normally they are preprocessed. In the proposed research work we use green channel only as it offers better contrast relative to red and blue channel. The green channel is first normalized by subtracting the mean value from each pixel and dividing by the standard deviation. The normalized image thus obtained is denoted by Inorm. After image normalization, its background is estimated using the median filter of length 35 × 35 for both DRIVE and STARE and subtracted from the normalized image and the resulting image is again median filtered using the filter of length 3 × 3 to remove noise. Thus, obtaining preprocessed images denoted by IGP.
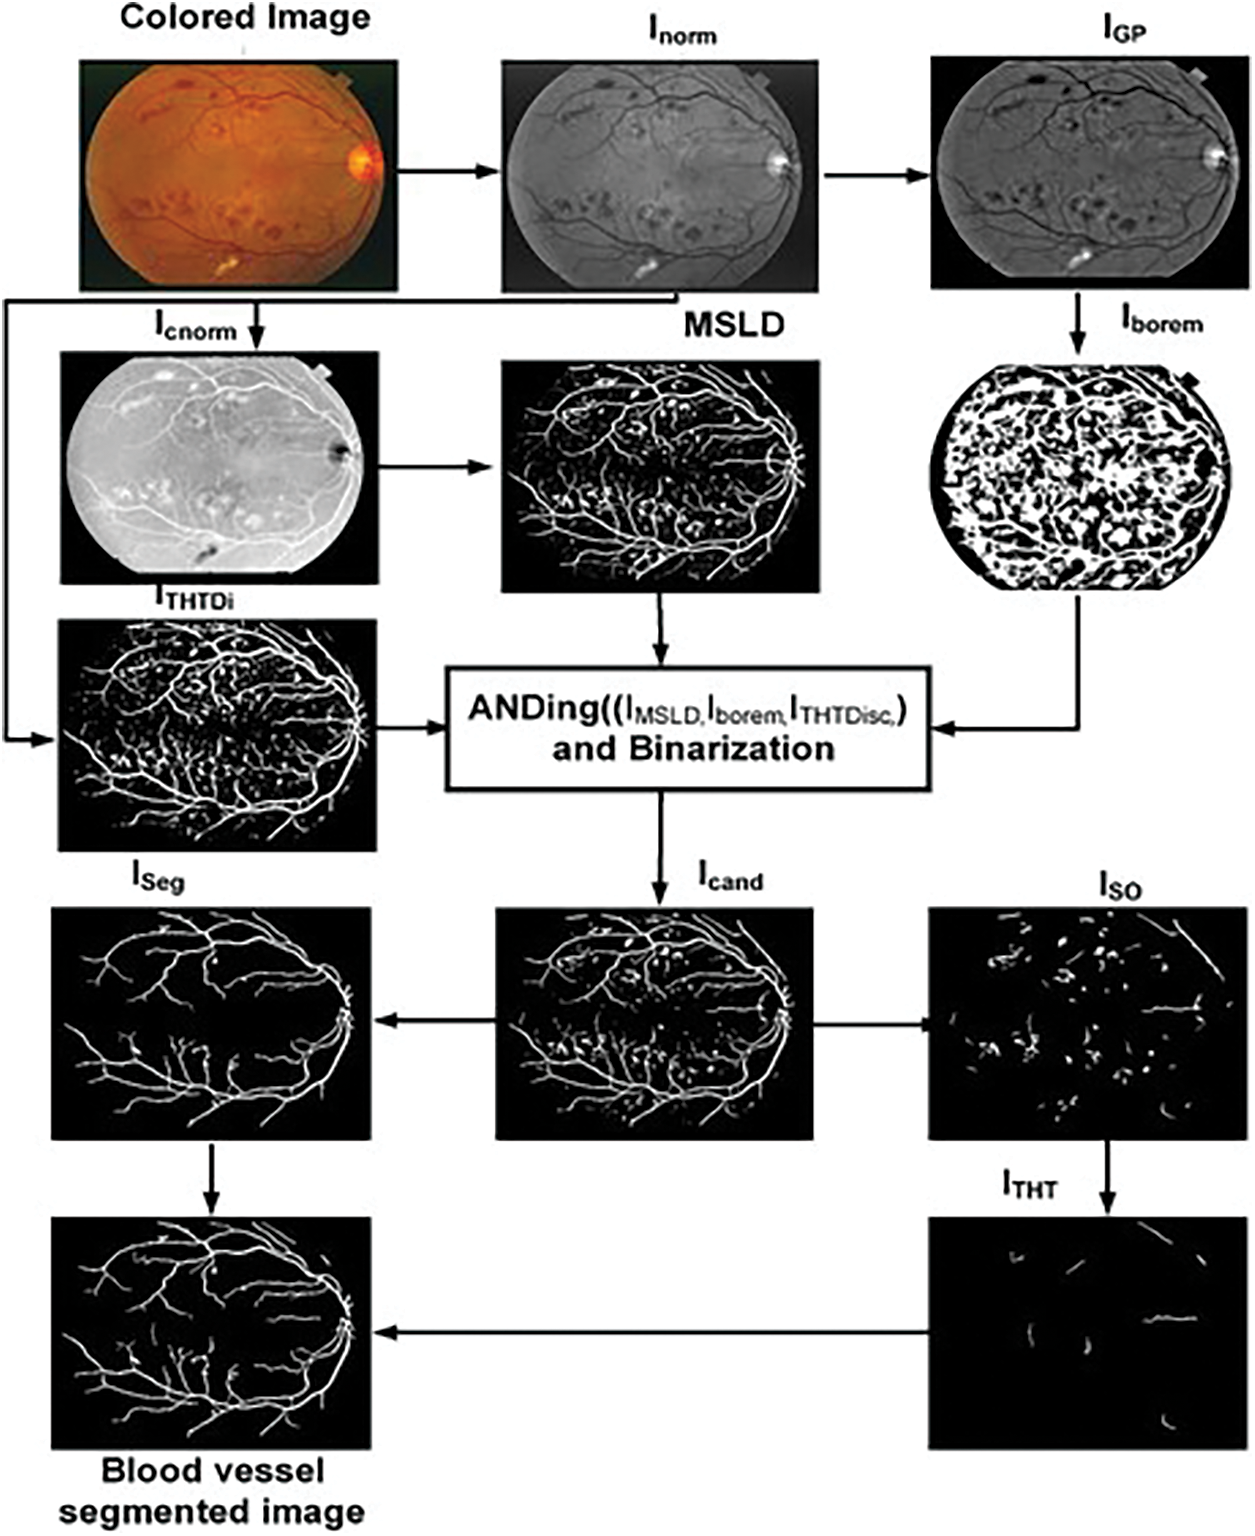
Figure 4: Flow chart of the proposed algorithm
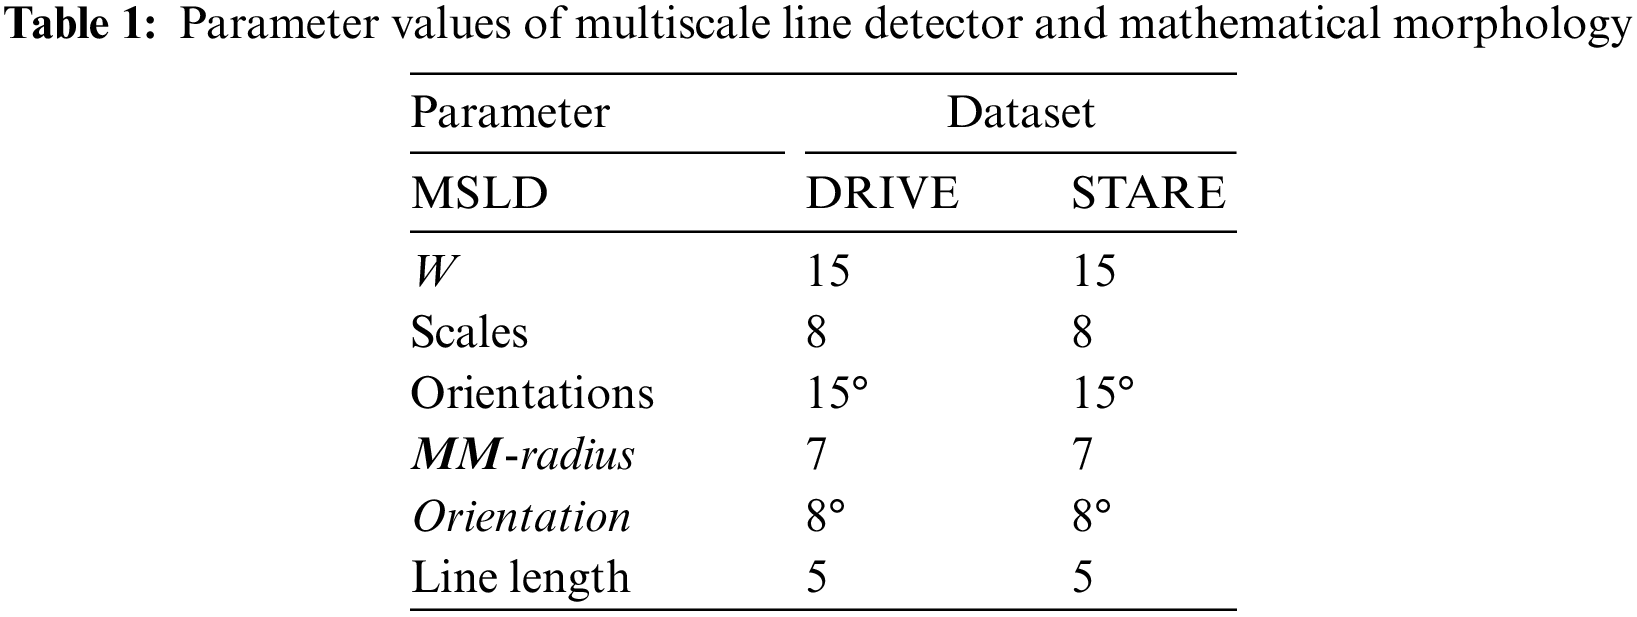
Multiscale line detector is capable of detecting elongated objects in general and also for those suffering central reflex problems. The algorithm typically involves applying filters or convolution operations at different scales to identify edges or lines of varying widths. By considering multiple scales, the detector can effectively capture both fine and coarse features in the image, providing a more comprehensive representation of the underlying structures. A multiscale line detector as used by [33] is applied on a complemented normalized image, Icnorm to obtain an IMSLD image. The parameters of the multiscale line detector are the orientation, window size, W, and the number of scales, L. We have used a multiscale line detector with the angular resolution of 15°, W = 15 pixels, and line responses at 8 scales were linearly combined for both the DRIVE and STARE datasets as depicted in Table 1. Values of all the parameters in this research work are empirically determined using the training images.
The IMSLD image contains the blood vessel, false positives due to the dark lesions and bright lesions/objects, and ROI/Optic disc boundary which can be noticed in Fig. 4. To remove false positives due to the bright lesion/objects, a two-step parallel mechanism is adopted, i.e., thresholding and top-hat transformation using a disc-shaped structuring element. In the first step, we threshold the green channel preprocessed image IGP and complement the thresholded image to obtain Iborem. In Iborem, the bright lesions/objects are pixels having zero intensity value while dark objects such as blood vessels and microaneurysms/hemorrhages have an intensity value equal to one. In the second step, we used a top-hat transform with a disc-shaped element, having a radius equal to 7, to detect the circular objects such as the ROI/optic disc boundary and other bright objects that contribute to false positives. The top hat operation is one of the morphological operations that consists of two parts: The opening of an image and the subtraction of this opened image from the original. The opening operation involves erosion (removing pixels at the boundaries) followed by dilation (adding pixels at the boundaries). The result of the top hat operation highlights local intensity variations or small structures in an image that might otherwise be overlooked. The top-hat transform with a disc-shaped element was applied to a grayscale image, where light-intensity pixels are considered as foreground and dark-intensity pixels are considered as background. Thus, blood vessels and other red lesions are considered as part of the background whereas the bright objects such as ROI/optic disc boundary and lesions such as exudates, etc., are in the foreground. In this way, we can remove false positives due to bright objects, but not those from dark objects. The obtained image of the top hat with disc structuring element is denoted by ITHTDisc. The IMSLD image is multiplied (ANDed) with Iborem and ITHTDisc. The resulting image obtained after ANDing the three images is denoted by Icand. Those candidate blood vessel pixels in the IMSLD image are assigned zero intensity values whose intensity in the preprocessed image is either higher than the specified threshold or those objects that are somehow circular. In this way, we get rid of the false positives due to bright lesions/objects and from ROI/optic disc boundary region as shown in the figure. After removing most of the bright pixels in this way from the IMSLD, the obtained Icand is binarized. The binarized image is denoted by IBz, which contains blood vessels and dark objects/lesions and the remaining parts of some of the bright lesions/objects. To further remove the false positives, length filtering is applied. Based on the number of pixels, IBz is divided into two images, i.e., ISO and ISeg image. The ISO image contains those objects that are smaller than 1500 pixels, while the ISeg image contains all those objects greater than 1500 pixels. The image ISO contains both vessel pixels and pixels from other objects/remaining parts of the non-vessel objects. Now to remove these false candidate objects (bright and dark), we use a mathematical morphology-based approach called top-hat transform with a linear structuring element (length of 5 at an angular resolution of 8° for both DRIVE and STARE datasets). The top-hat transform applied once again is on the binary image to remove false positives due to dark lesions or those missed by the earlier parts of the proposed system. Thus, ISO is tested using the top-hat transform for whether the objects it contains are elongated and greater than 100 pixels. After top-hat transform with linear structuring element in multiple orientations, we got an image that contains elongated objects with pixels greater than 100, denoted by ITHT. Finally, we had a binary addition of ISeg image and ITHT, which resulted in a blood vessel segmented image, as shown in Fig. 4.
The proposed algorithm is for color fundus images of the retina. To exploit the strengths and weaknesses of the proposed algorithm, multiresolution datasets with challenging images would be required. Therefore, we have used two different publicly available datasets for testing and training the algorithm. The initial dataset used in this research work is the DRIVE or Digital Retinal Images for Vessel Extraction dataset [8]. The dataset has 40 images with ground truth and a mask for each image. It has a separate training set and test set consisting of 20 images each. The images are captured at 768 × 584 pixels at 45° FOV. The FOV of each image is around 540 pixels in diameter. There is one manual segmentation for training images or ground truth while the test images have two manual segmentations. Most of the researchers use the second manual segmentation for comparison and the first manual segmentation as ground truth which is also followed in this research work. The second dataset we have used is called STARE or Structure Analysis of Retina [9]. The dataset consists of 20 images which are captured at 700 × 605 pixels resolution at 35° FOV. Fifty percent (ten images out of twenty) contain pathologies such as hemorrhages and exudates. The images are also provided with manual segmentations or ground truths. Two different sets of manual segmentations are there for each image. However, the dataset is not split into training and test sets.
The suggested system is evaluated in terms of Sensitivity (Se) or true positive rate, specificity (Sp), accuracy (Acc), and Matthews Correlation Coefficient (MCC). Sensitivity is defined as the ratio of detected vessel pixels (
where
The proposed system is tested using DRIVE and STARE datasets. Table 2 presents comparative results based on different variants of line detectors. These are the mean sensitivity, mean specificity, and average time to process an image. At sensitivities of 0.7617 and 0.7606, we have specificity values of 0.9678 and 0.9694 respectively on DRIVE and STARE datasets. It may be noted that all the values of our method, presented in this paper, are calculated from ROI only and not from the full image. The proposed method takes an average of 3.73 and 3.75 s on the DRIVE and STARE datasets, respectively. For time calculation we have used tic and toc, the Matlab’s built-in function. We run the simulations on each of the dataset (entire dataset) three times and then the average time taken per image for each dataset is calculated. It is clear from the values in Table 2 for both the datasets (DRIVE and STARE), that the proposed algorithm is fast and only the first two and the fifth entries in Table 2 are faster than the proposed algorithm. However, we achieve better sensitivity and specificity than the first two entries in Table 2 and consequently better accuracy. On the DRIVE dataset, at a sensitivity of 0.75 or greater, the proposed method achieves the best specificity which is 0.9678. In terms of sensitivity, only Khan et al. [36] achieve slightly better sensitivity than the proposed method but we achieve slightly higher specificity and therefore, we achieve higher accuracy than their method on the DRIVE dataset. Similarly, at a sensitivity of 0.75 or greater, our method achieves the second highest specificity of 0.9694 after Khan et al. [36], but we achieve a slightly better sensitivity of 0.7606. Therefore, they achieve slightly better accuracy on the STARE dataset at a sensitivity of 0.75 or greater. Fig. 5 shows examples of the segmented images of the suggested technique for the DRIVE and STARE datasets, top row and bottom row, respectively. Shown in the first column are colored images, the second column is ground truth and the third column is a segmented vessel using the proposed method. From Fig. 5, it can be demonstrated that the suggested strategy works well for identifying the thick and medium-width blood vessels with few false positives. However, the proposed method is unable to detect the fine vessels. We have shown the comparison of our method with other methods based on multiline detectors in Fig. 6. Looking at Fig. 6, the proposed method is resilient on the images with pathologies, and most of them are not detected as false positives.
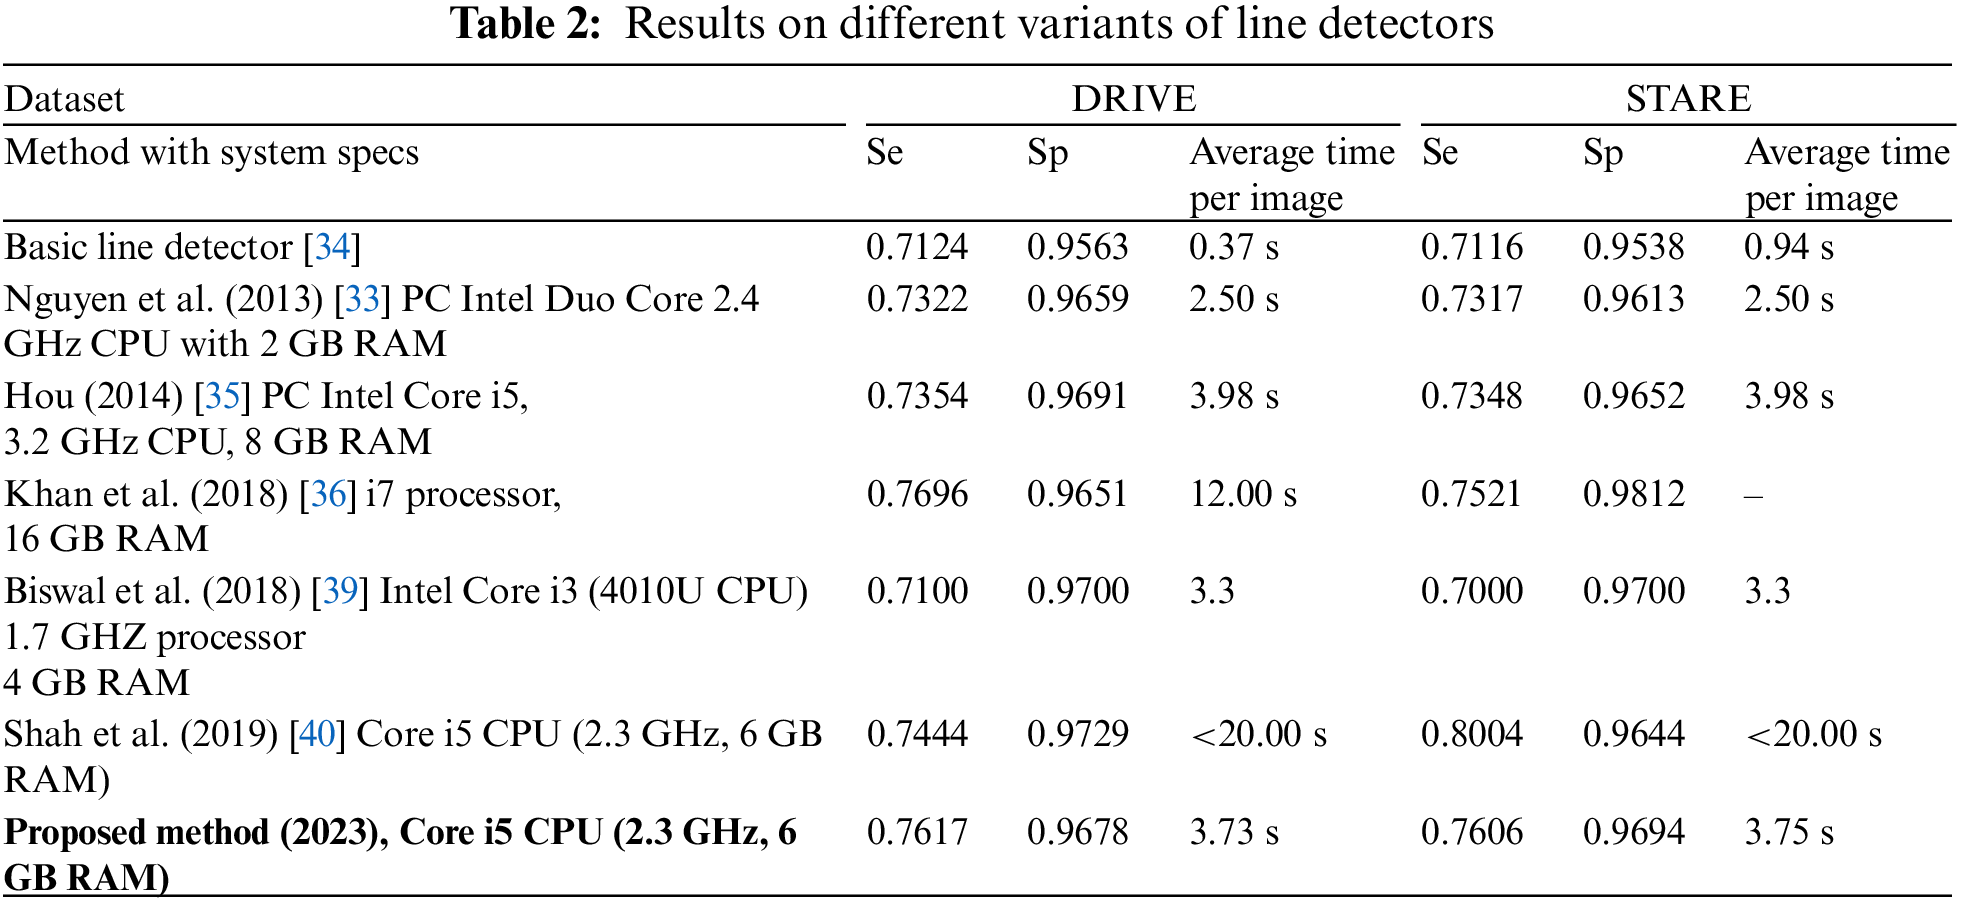
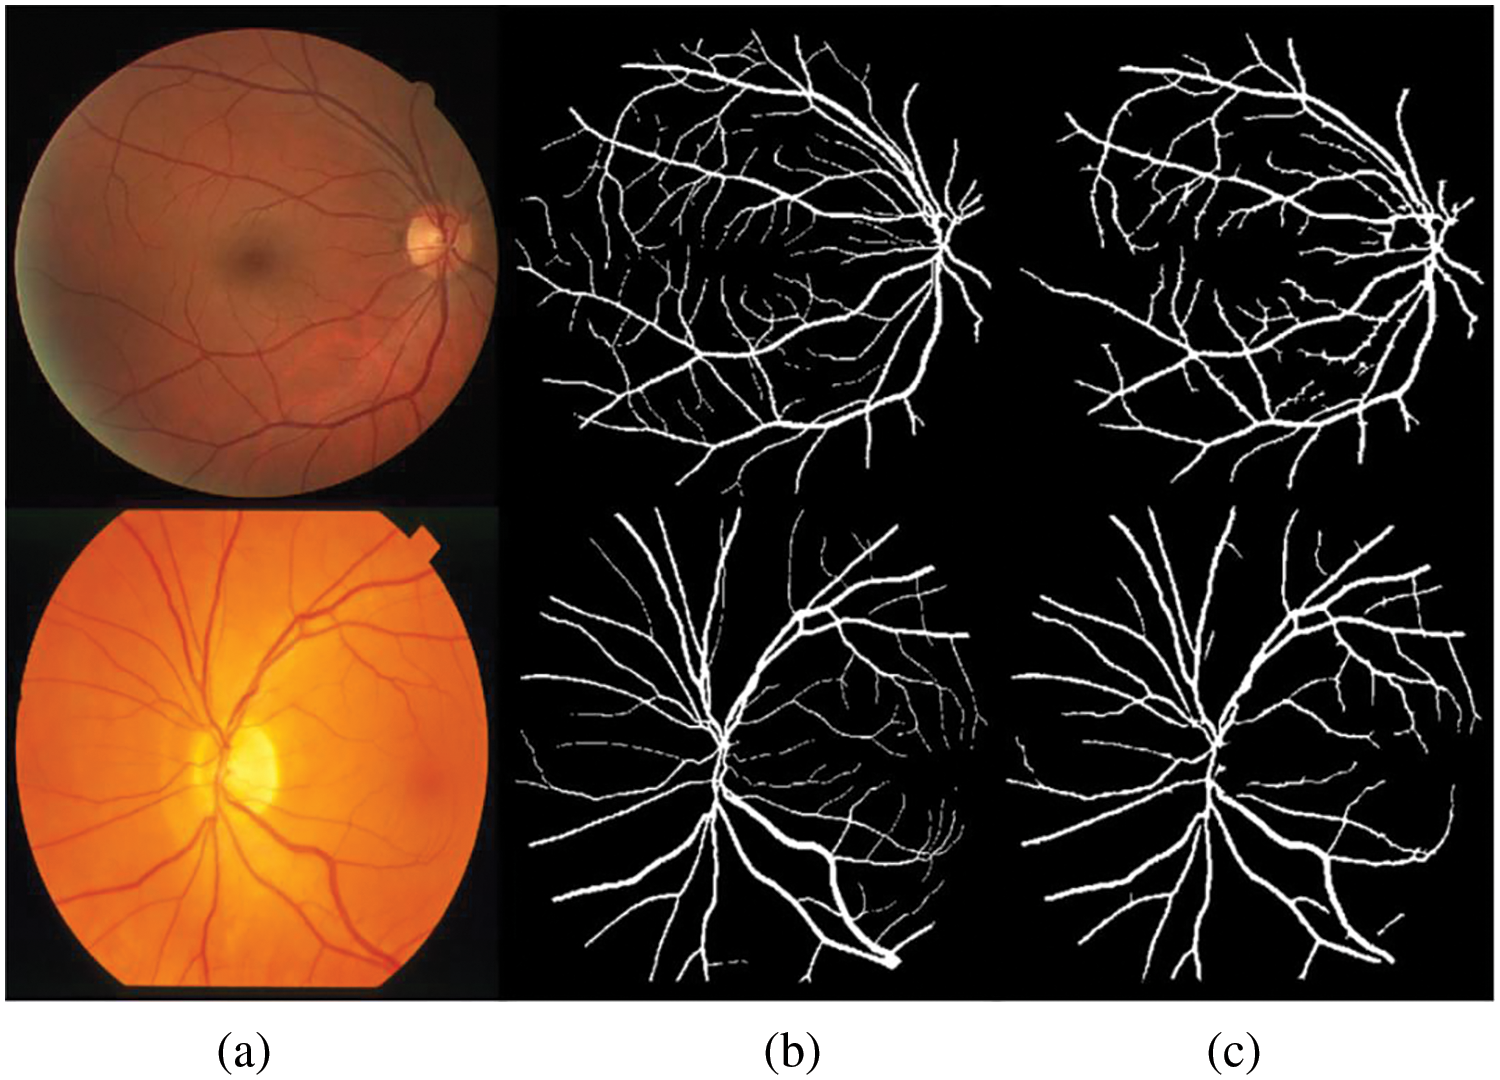
Figure 5: Blood vessels segmented images: (a) color fundus image, (b) ground truth and (c) segmented vessels using the proposed method
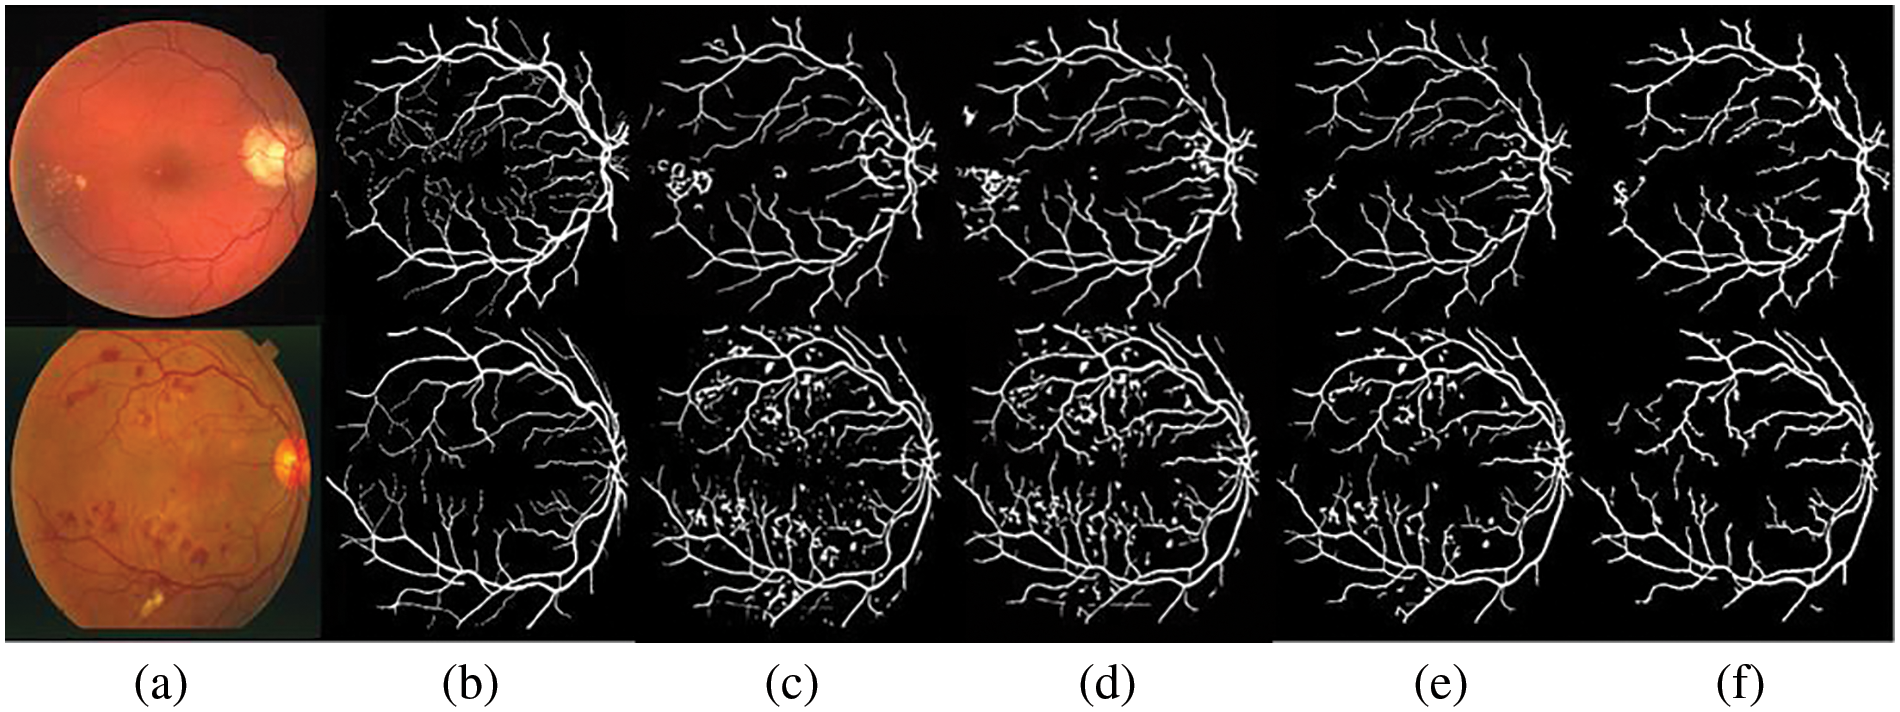
Figure 6: Comparative results: (a) colored image, (b) ground truth, (c) vessel segmented image by Nguyen et al. [33], (d) Hou [35], (e) Shah et al. [40], and (f) the proposed method
Table 3 gives image-by-image results on DRIVE and STARE test datasets. The results of comparison with the state-of-the-art methods are presented in Table 4. On the DRIVE dataset, the suggested system achieves the mean accuracy of 0.9467 with a mean sensitivity of 0.6952, mean specificity of 0.9838, and mean MCC value of 0.7451. Shown in Fig. 7a is the ROC curve of the proposed system on the DRIVE dataset and in Fig. 7b is the ROC curve of the proposed system on the STARE dataset. At the sensitivity value of 0.7399, the suggested system has an accuracy of 0.9440 while at a sensitivity of 0.6952, the proposed system has an accuracy of 0.9467 which is better than many of the supervised and unsupervised methods shown in Table 4. The image-by-image outcomes obtained on the DRIVE dataset are shown in Table 3, left three columns.
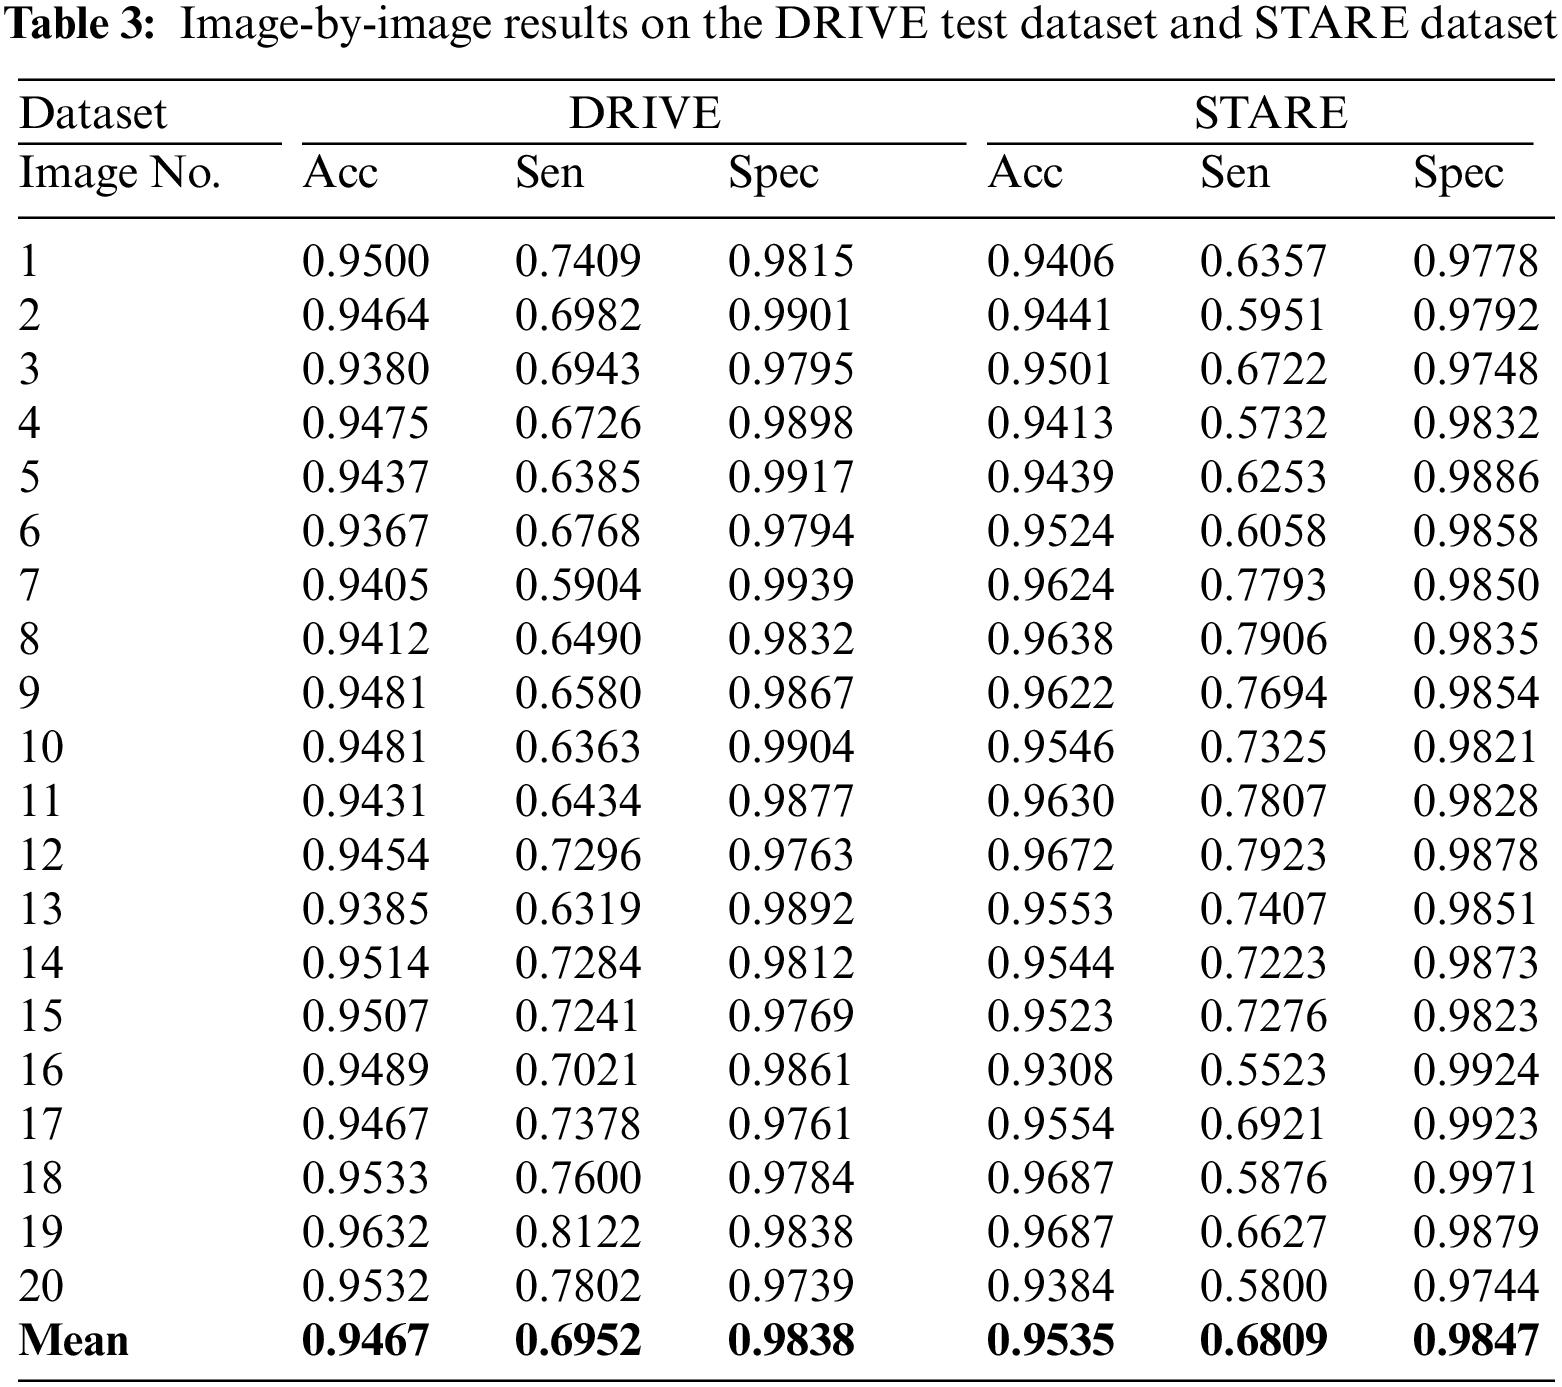
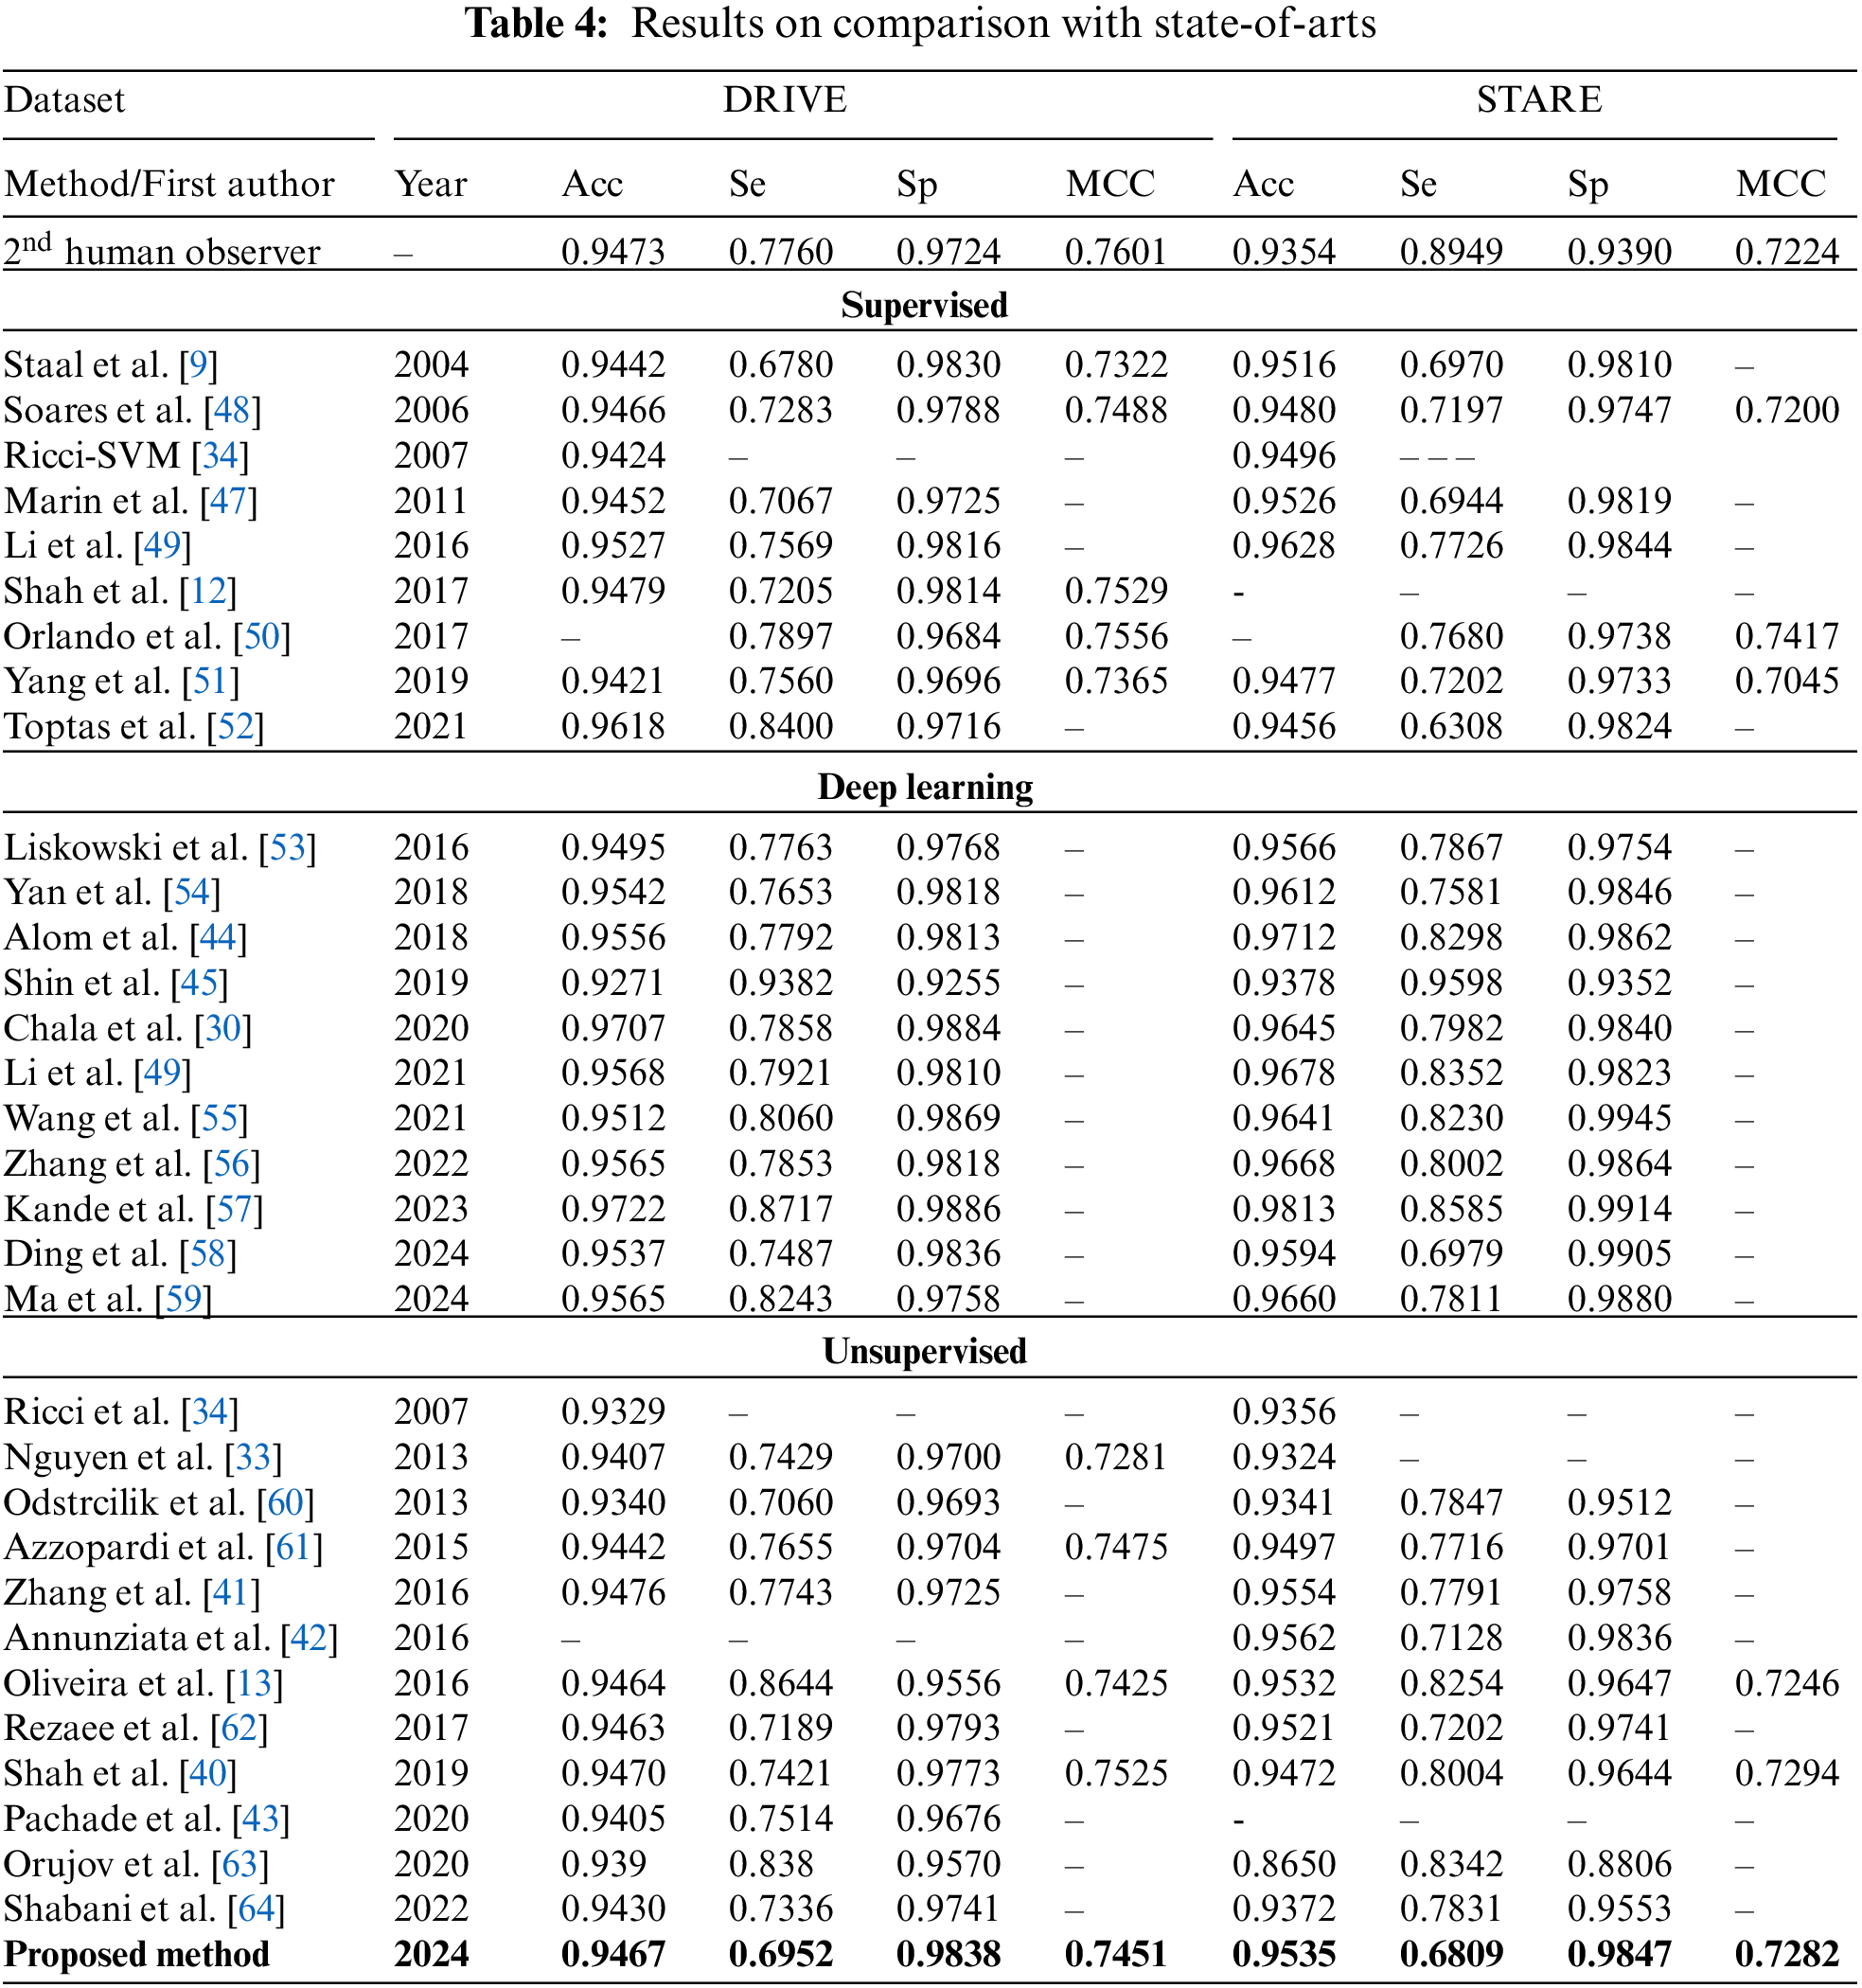
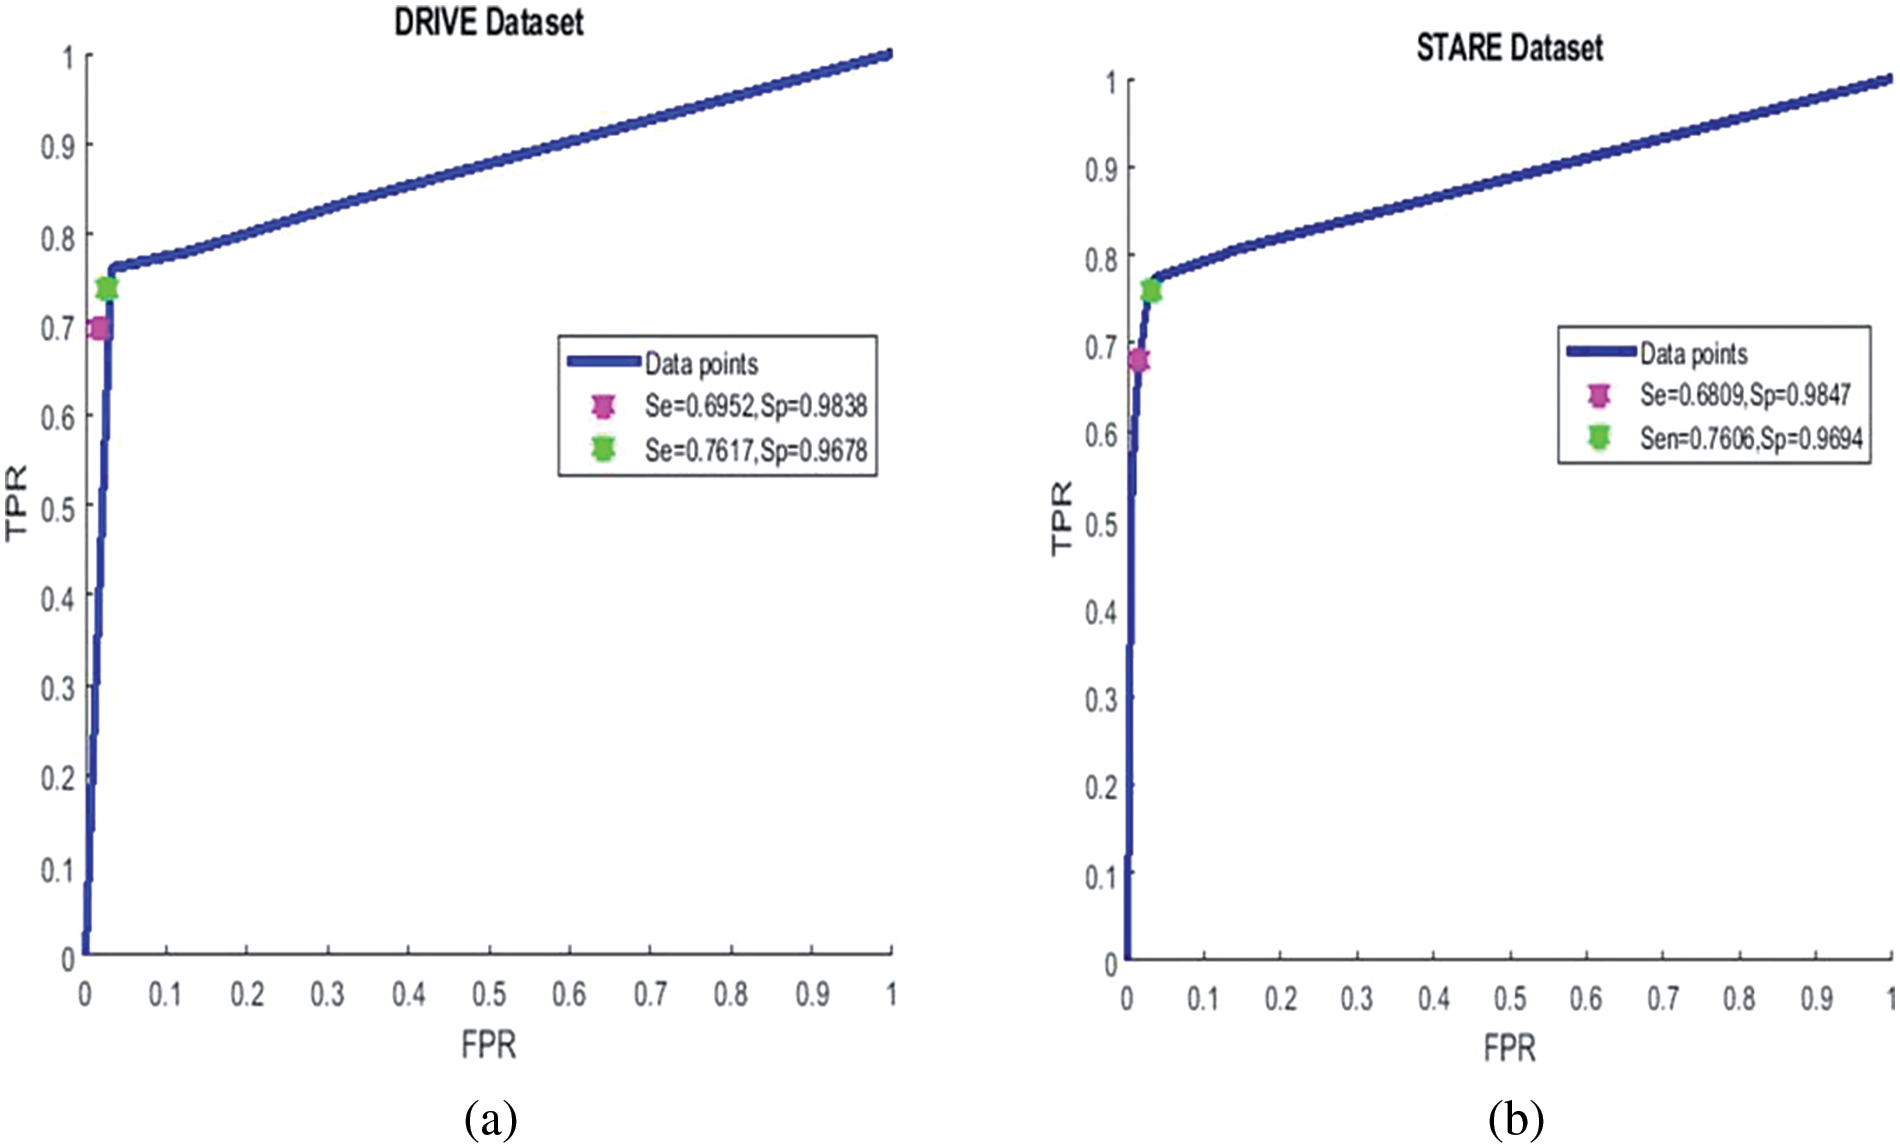
Figure 7: ROC curve of the proposed system: Left for DRIVE dataset, right for STARE dataset
On the STARE dataset, we obtained a sensitivity of 0.6809 0.9535, 0.9807, and 0.7282 for precision, specificity, and MCC, respectively. In the unsupervised category, the overall mean accuracy value is preferable to most techniques presented in Table 3 except [41,42] and [43]. These methods which are better in accuracy are more computationally hungry and require more time to process an image on average. Fig. 6 bottom row presents the result of the suggested system using the pathological images from the STARE dataset. It is clear that the suggested system is better at detecting thick and medium-width blood vessels with very few false positives, but in the case of fine vessels, the proposed algorithm is unable to detect them. The image-by-image results obtained on the STARE dataset are presented in Table 3, right most of the three columns. The ROC curve of the proposed system on the STARE dataset is shown in Fig. 7 right ROC. At a sensitivity of 0.7706, the suggested system has an accuracy of 0.9479, while at a sensitivity of 0.6809, the accuracy is 0.9535 as shown in Fig. 7 right ROC. Based on the values in Table 4, it can be seen that the highest values are from deep learning-based methods such as [44–46], but they require very powerful machines and extensive training.
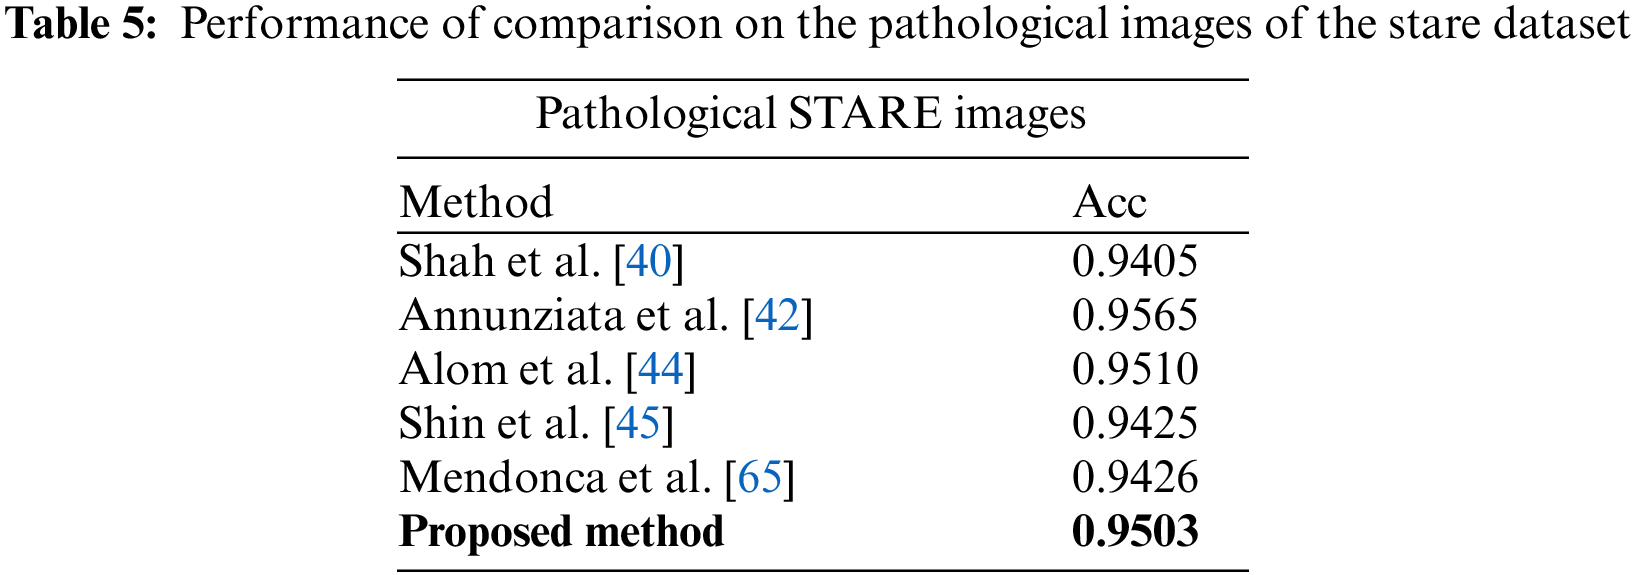
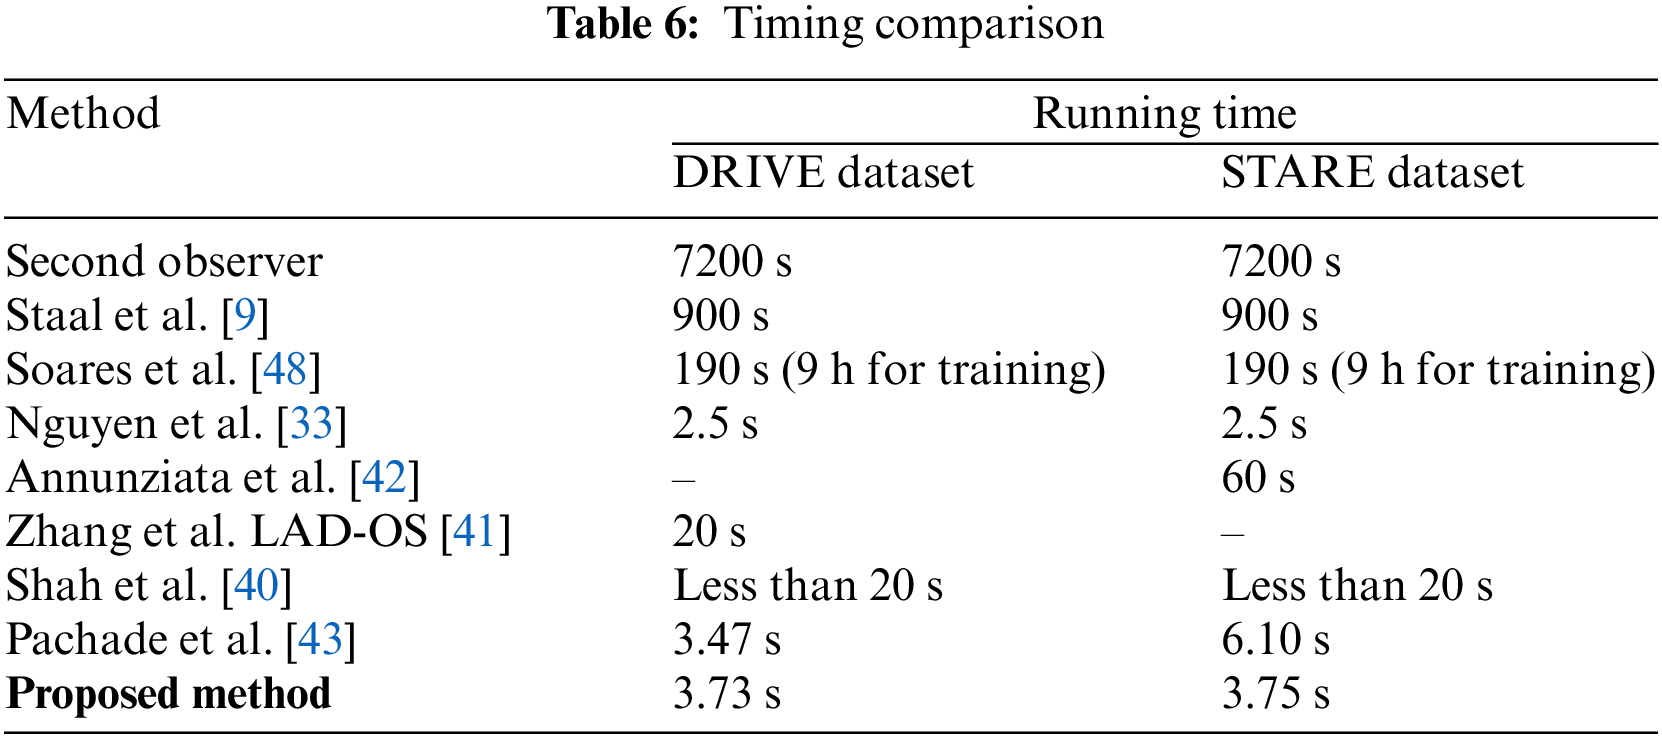
In Table 5, comparative results on state-of-the-art are presented for abnormal images. The STARE dataset contains ten images with abnormalities. It can be seen that the suggested system achieves better accuracy than most of the state-of-the-art methods, except Annunziata et al. [42] and Marin et al. [47] method, however, the proposed method is much faster than [42] which takes one minute to process an image. The details of the comparison of time required to process an image are presented in Table 6. The proposed system is implemented using unoptimized software in Matlab 2018 with a system having a Core i5 CPU and 6 GB RAM. These hardware specifications are generally considered moderate specifications that can support a variety of applications, however in current time more robust and custom hardware with better processing power can be used for a close to real-time implementation of the method. From Table 6, it can be noticed that the suggested algorithm requires less time than all the methods except the Nguyen method on the STARE dataset.
This paper introduces an innovative retinal vessel segmentation method, leveraging the Multiscale Line Detector (MSLD) and mathematical morphology. By combining these techniques, the algorithm demonstrates a commendable capability to swiftly produce results comparable to state-of-the-art methods, while exhibiting resilience to noise. The methodology undergoes rigorous testing on widely accessible datasets like DRIVE and STARE, achieving a sensitivity of over 68% with accuracy comparable to existing benchmarks. However, it is crucial to highlight areas for future work. Although the proposed method proves efficient in detecting thick vessels, it currently falls short in identifying finer vessels. To address this limitation, potential enhancements could involve refining the algorithm to enhance sensitivity to finer structures. Moreover, the average processing time for a single image could be further optimized through script optimization and potential implementation in platforms like C-language, paving the way for real-time application. Notably, the proposed technique exhibits promising results, surpassing 95% accuracy in identifying pathological images, particularly those with pathologies like STRAE. Looking ahead, there is potential for the system’s deployment in healthcare units to assist medical practitioners as the proposed method shows comparable accuracy along with less processing time. By reducing their workload in diagnosing relevant diseases, the proposed system could become an invaluable tool in medical settings, driven by its impressive accuracy, speed, and modest hardware requirements.
Acknowledgement: The authors would like to express their sincere gratitude to the individuals who have made invaluable contributions to this article. We extend our thanks to our research team for their research assistance and valuable insights. Their dedication and expertise have greatly enriched the quality of this work.
Funding Statement: This Research is funded by Researchers Supporting Project Number (RSPD2024R947), King Saud University, Riyadh, Saudi Arabia.
Author Contributions: SAAS designed the model and the computational framework and analysed the data, AS carried out the implementation and acted as corressponding author, MA reviewed manuscript, suggested important revisions and supported the work finacianly, CMG helped in drafting work and reviewed manuscript, KA reviewed manuscript critically for important intellectual contents, helped in study design and did partial revisions, TBT initialy conceived the study and contributed to the analysis of the results, MA participated detailed analysis and final revisions of manuscript as per the comments of reviewers.
Availability of Data and Materials: The experiments are performed on two publicly available datasets named DRIVE and STRE dataset. The following are the links for the used datasets i.e., DRIVE and STARE, respectively. https://drive.grand-challenge.org/. https://cecas.clemson.edu/~ahoover/stare/.
Ethics Approval: The research conducted for this paper, which utilizes publicly available datasets, has been carried out in adherence to the highest ethical standards and principles. Publicly available datasets used in this study have been accessed and employed in accordance with the terms of use and licensing agreements set forth by the respective data providers.
Conflicts of Interest: The authors declare that they have no conflicts of interest to report regarding the present study.
References
1. H. R. Novotny and D. L. Alvis, “A method of photographing fluorescence in circulating blood in the human retina,” Circulation, vol. 24, no. 1, pp. 82–86, 1961. doi: 10.1161/01.CIR.24.1.82. [Google Scholar] [PubMed] [CrossRef]
2. R. P. C. Lira, C. L. A. Oliveira, M. V. R. B. Marques, A. R. Silva, and C. C. Pessoa, “Adverse reactions of fluorescein angiography: A prospective study,” Arquivos Brasileiros de Oftalmologia, vol. 70, no. 4, pp. 615–618, 2007. doi: 10.1590/S0004-27492007000400011. [Google Scholar] [PubMed] [CrossRef]
3. M. D. Abràmoff, M. K. Garvin, and M. Sonka, “Retinal imaging and image analysis,” IEEE Rev. Biomed. Eng., vol. 3, pp. 169–208, 2010. doi: 10.1109/RBME.2010.2084567. [Google Scholar] [PubMed] [CrossRef]
4. H. M. A. Shirin, H. Rabbani, and M. R. Akhlaghi, “Diabetic retinopathy grading by digital curvelet transform,” Comput. Math. Methods Med., vol. 2012, 2012. [Google Scholar]
5. S. A. Ali Shah, A. Laude, I. Faye, and T. B. Tang, “Automated microaneurysm detection in diabetic retinopathy using curvelet transform,” J. Biomed. Opt., vol. 21, no. 10, pp. 101404, 2016. doi: 10.1117/1.JBO.21.10.101404. [Google Scholar] [PubMed] [CrossRef]
6. R. Schwartz, J. Dodge, N. A. Smith, and O. Etzioni, “Green AI,” Commun. ACM, vol. 63, no. 12, pp. 54–63, 2020. doi: 10.1145/3381831. [Google Scholar] [CrossRef]
7. P. Bibiloni, M. González-Hidalgo, and S. Massanet, “A real-time fuzzy morphological algorithm for retinal vessel segmentation,” J. Real Time Image Process., vol. 16, no. 6, pp. 2337–2350, 2019. doi: 10.1007/s11554-018-0748-1. [Google Scholar] [CrossRef]
8. A. Hoover, V. Kouznetsova, and M. Goldbaum, “Locating blood vessels in retinal images by piecewise threshold probing of a matched filter response,” IEEE Trans. Med. Imaging, vol. 19, no. 3, pp. 203–210, 2000. doi: 10.1109/42.845178. [Google Scholar] [PubMed] [CrossRef]
9. J. Staal, M. D. Abràmoff, M. Niemeijer, M. A. Viergever, and B. van Ginneken, “Ridge-based vessel segmentation in color images of the retina,” IEEE Trans. Med. Imaging, vol. 23, no. 4, pp. 501–509, 2004. doi: 10.1109/TMI.2004.825627. [Google Scholar] [PubMed] [CrossRef]
10. U. Erkan, “A precise and stable machine learning algorithm: Eigenvalue classification (EigenClass),” Neural Comput. App., vol. 33, no. 10, pp. 5381–5392, 2021. doi: 10.1007/s00521-020-05343-2. [Google Scholar] [CrossRef]
11. S. Memiş, S. Enginoğlu, and U. Erkan, “A classification method in machine learning based on soft decision-making via fuzzy parameterized fuzzy soft matrices,” Soft Comput., vol. 26, no. 3, pp. 1165–1180, 2022. doi: 10.1007/s00500-021-06553-z. [Google Scholar] [CrossRef]
12. S. A. A. Shah, T. B. Tang, I. Faye, and A. Laude, “Blood vessel segmentation in color fundus images based on regional and Hessian features,” Graefe’s Archive Clinic. Exp. Ophthalmol., vol. 255, no. 8, pp. 1525–1533, 2017. doi: 10.1007/s00417-017-3677-y. [Google Scholar] [PubMed] [CrossRef]
13. W. S. Oliveira, J. V. Teixeira, T. I. Ren, G. D. Cavalcanti, and J. Sijbers, “Unsupervised retinal vessel segmentation using combined filters,” PLoS One, vol. 11, no. 2, pp. e0149943, 2016. [Google Scholar] [PubMed]
14. B. Zhang, L. Zhang, L. Zhang, and F. Karray, “Retinal vessel extraction by matched filter with first-order derivative of Gaussian,” Comput. Biol. Med., vol. 40, no. 4, pp. 438–445, 2010. [Google Scholar] [PubMed]
15. N. Muzammil, S. A. A. Shah, A. Shahzad, M. A. Khan, and R. M. Ghoniem, “Multifilters-based unsupervised method for retinal blood vessel segmentation,” Appl. Sci., vol. 12, no. 13, pp. 6393, 2022. [Google Scholar]
16. F. Zana and J. C. Klein, “Segmentation of vessel-like patterns using mathematical morphology and curvature evaluation,” IEEE Trans. Image Process., vol. 10, no. 7, pp. 1010–1019, 2001. doi: 10.1109/83.931095. [Google Scholar] [PubMed] [CrossRef]
17. M. M. Fraz et al., “An approach to localize the retinal blood vessels using bit planes and centerline detection,” Comput. Methods Programs Biomed., vol. 108, no. 2, pp. 600–616, 2012. [Google Scholar] [PubMed]
18. E. Chakour et al., “Blood vessel segmentation of retinal fundus images using dynamic preprocessing and mathematical morphology,” in IEEE 8th Int. Conf. Control, Decis. Inf. Tech. (CoDIT), Istanbul, Turkey, Jun. 30, 2022, pp. 1473–1478. doi: 10.1109/CoDIT55151.2022.9804004. [Google Scholar] [CrossRef]
19. A. Chouchene, W. Barhoumi, and A. Ahmad, “Retinal blood vessel segmentation in fundus images based on morphological operators within entropy information,” in SPIE Thirteenth Int. Conf. Mach. Vision, Rome, Italy, Jan. 2021, vol. 11605. [Google Scholar]
20. S. Roychowdhury, D. D. Koozekanani, and K. K. Parhi, “Blood vessel segmentation of fundus images by major vessel extraction and subimage classification,” IEEE J. Biomed. Health Inf., vol. 19, no. 3, pp. 1118–1128, 2014. [Google Scholar]
21. S. Wang, Y. Yin, G. Cao, B. Wei, Y. Zheng and G. Yang, “Hierarchical retinal blood vessel segmentation based on feature and ensemble learning,” Neurocomput., vol. 149, pp. 708–717, 2015. doi: 10.1016/j.neucom.2014.07.059. [Google Scholar] [CrossRef]
22. E. S. Varnousfaderani, S. Yousefi, C. Bowd, A. Belghith, and M. H. Goldbaum, “Vessel delineation in retinal images using leung-malik filters and two levels hierarchical learning,” in AMIA Annu. Symp. Proc., American Medical Informatics Association, 2015, vol. 2015, pp. 1140. [Google Scholar]
23. Y. Xu and Y. Fan, “Dual-channel asymmetric convolutional neural network for an efficient retinal blood vessel segmentation in eye fundus images,” Biocyber. Biomed. Eng., vol. 42, no. 2, pp. 695–706, 2022. doi: 10.1016/j.bbe.2022.05.003. [Google Scholar] [CrossRef]
24. Y. Zhao, Y. Liu, X. Wu, S. P. Harding, and Y. Zheng, “Retinal vessel segmentation: An efficient graph cut approach with retinex and local phase,” PLoS One, vol. 10, no. 4, pp. e0122332, 2015. doi: 10.1371/journal.pone.0122332. [Google Scholar] [PubMed] [CrossRef]
25. K. A. Vermeer, F. M. Vos, H. G. Lemij, and A. M. Vossepoel, “A model based method for retinal blood vessel detection,” Comput. Biol. Med., vol. 34, no. 3, pp. 209–219, 2004. doi: 10.1016/S0010-4825(03)00055-6. [Google Scholar] [PubMed] [CrossRef]
26. G. Altan, “DeepOCT: An explainable deep learning architecture to analyze macular edema on OCT images,” Eng. Sci. Tech., Int. J., vol. 34, no. 23, pp. 101091, 2022. doi: 10.1016/j.jestch.2021.101091. [Google Scholar] [CrossRef]
27. G. Altan, Y. Kutlu, and N. Allahverdi, “Deep learning on computerized analysis of chronic obstructive pulmonary disease,” IEEE J. Biomed. Health Inf., vol. 24, no. 5, pp. 1344–1350, 2019. doi: 10.1109/JBHI.2019.2931395. [Google Scholar] [PubMed] [CrossRef]
28. Z. Jiang, H. Zhang, Y. Wang, and S. B. Ko, “Retinal blood vessel segmentation using fully convolutional network with transfer learning,” Comput. Med. Imaging Graph, vol. 68, no. 1, pp. 1–15, 2018. doi: 10.1016/j.compmedimag.2018.04.005. [Google Scholar] [PubMed] [CrossRef]
29. Y. Jiang, H. Zhang, N. Tan, and L. Chen, “Automatic retinal blood vessel segmentation based on fully convolutional neural networks,” Symmetry, vol. 11, no. 9, pp. 1112, 2019. doi: 10.3390/sym11091112. [Google Scholar] [CrossRef]
30. M. Chala, B. Nsiri, M. H. El yousfi Alaoui, A. Soulaymani, A. Mokhtari and B. Benaji, “An automatic retinal vessel segmentation approach based on convolutional neural networks,” Expert. Syst. App., vol. 184, no. 3, pp. 115459, 2021. doi: 10.1016/j.eswa.2021.115459. [Google Scholar] [CrossRef]
31. M. E. Gegundez-Arias, D. Marin-Santos, I. Perez-Borrero, and M. J. Vasallo-Vazquez, “A new deep learning method for blood vessel segmentation in retinal images based on convolutional kernels and modified U-Net model,” Comput. Methods Programs Biomed., vol. 205, no. 4, pp. 106081, 2021. doi: 10.1016/j.cmpb.2021.106081. [Google Scholar] [PubMed] [CrossRef]
32. M. Z. Alom, C. Yakopcic, M. Hasan, T. M. Taha, and V. K. Asari, “Recurrent residual U-Net for medical image segmentation,” J. Med. Imaging, vol. 6, no. 1, pp. 014006, 2019. doi: 10.1117/1.JMI.6.1.014006. [Google Scholar] [PubMed] [CrossRef]
33. U. T. Nguyen, A. Bhuiyan, L. A. Park, and K. Ramamohanarao, “An effective retinal blood vessel segmentation method using multi-scale line detection,” Pattern Recognit., vol. 46, no. 3, pp. 703–715, 2013. doi: 10.1016/j.patcog.2012.08.009. [Google Scholar] [CrossRef]
34. E. Ricci and R. Perfetti, “Retinal blood vessel segmentation using line operators and support vector classification,” IEEE Trans. Med. Imaging, vol. 26, no. 10, pp. 1357–1365, 2013. doi: 10.1109/TMI.2007.898551. [Google Scholar] [PubMed] [CrossRef]
35. Y. Hou, “Automatic segmentation of retinal blood vessels based on improved multiscale line detection,” J. Comput. Sci. Eng., vol. 8, no. 2, pp. 119–128, 2014. doi: 10.5626/JCSE.2014.8.2.119. [Google Scholar] [PubMed] [CrossRef]
36. M. A. Khan, T. M. Khan, D. G. Bailey, and T. A. Soomro, “A generalized multi-scale line-detection method to boost retinal vessel segmentation sensitivity,” Pattern Anal. App., vol. 22, no. 3, pp. 1177–1196, 2019. doi: 10.1007/s10044-018-0696-1. [Google Scholar] [CrossRef]
37. A. Khawaja, T. M. Khan, M. A. Khan, and S. J. Nawaz, “A multi-scale directional line detector for retinal vessel segmentation,” Sensors, vol. 19, no. 22, pp. 4949, 2019. doi: 10.3390/s19224949. [Google Scholar] [PubMed] [CrossRef]
38. M. Foracchia, E. Grisan, and A. Ruggeri, “Detection of optic disc in retinal images by means of a geometrical model of vessel structure,” IEEE Trans. Med. Imaging, vol. 23, no. 10, pp. 1189–1195, 2004. doi: 10.1109/TMI.2004.829331. [Google Scholar] [PubMed] [CrossRef]
39. B. Biswal, T. Pooja, and N. B. Subrahmanyam, “Robust retinal blood vessel segmentation using line detectors with multiple masks,” IET Image Process., vol. 12, no. 3, pp. 389–399, 2018. doi: 10.1049/iet-ipr.2017.0329. [Google Scholar] [CrossRef]
40. S. A. A. Shah, A. Shahzad, M. A. Khan, C. K. Lu, and T. B. Tang, “Unsupervised method for retinal vessel segmentation based on Gabor wavelet and multiscale line detector,” IEEE Access, vol. 7, pp. 167221–167228, 2019. doi: 10.1109/ACCESS.2019.2954314. [Google Scholar] [CrossRef]
41. J. Zhang, B. Dashtbozorg, E. Bekkers, J. P. Pluim, R. Duits and B. M. ter Haar Romeny, “Robust retinal vessel segmentation via locally adaptive derivative frames in orientation scores,” IEEE Trans. Med. Imaging, vol. 35, no. 12, pp. 2631–2644, 2016. doi: 10.1109/TMI.2016.2587062. [Google Scholar] [PubMed] [CrossRef]
42. R. Annunziata, A. Garzelli, L. Ballerini, A. Mecocci, and E. Trucco, “Leveraging multiscale hessian-based enhancement with a novel exudate inpainting technique for retinal vessel segmentation,” IEEE J. Biomed. Health Inf., vol. 20, no. 4, pp. 1129–1138, 2015. doi: 10.1109/JBHI.2015.2440091. [Google Scholar] [PubMed] [CrossRef]
43. S. Pachade, P. Porwal, M. Kokare, L. Giancardo, and F. Meriaudeau, “Retinal vasculature segmentation and measurement framework for color fundus and SLO images,” Biocybern. Biomed. Eng., vol. 40, no. 3, pp. 865–900, 2020. doi: 10.1016/j.bbe.2020.03.001. [Google Scholar] [CrossRef]
44. M. Z. Alom, C. Yakopcic, M. Hasan, T. M. Taha, and V. K. Asari, “Recurrent residual convolutional neural network based on U-Net (R2U-Net) for medical image segmentation,” J. Med. Imaging, vol. 6, no. 1, pp. 014006, 2019. [Google Scholar]
45. S. Y. Shin, S. Lee, I. D. Yun, and K. M. Lee, “Deep vessel segmentation by learning graphical connectivity,” Med. Image Anal., vol. 58, no. 4, pp. 101556, 2019. doi: 10.1016/j.media.2019.101556. [Google Scholar] [PubMed] [CrossRef]
46. X. Li, Y. Jiang, M. Li, and S. Yin, “Lightweight attention convolutional neural network for retinal vessel image segmentation,” IEEE Trans. Ind. Inform., vol. 17, no. 3, pp. 1958–1967, 2021. doi: 10.1109/TII.2020.2993842. [Google Scholar] [CrossRef]
47. D. Marín, A. Aquino, M. E. Gegúndez-Arias, and J. M. Bravo, “A new supervised method for blood vessel segmentation in retinal images by using gray-level and moment invariants-based features,” IEEE Trans. Med. Imaging, vol. 30, no. 1, pp. 146–158, 2010. doi: 10.1109/TMI.2010.2064333. [Google Scholar] [PubMed] [CrossRef]
48. J. V. Soares, J. J. Leandro, R. M. Cesar, H. F. Jelinek, and M. J. Cree, “Retinal vessel segmentation using the 2-D Gabor wavelet and supervised classification,” IEEE Trans. Med. Imaging, vol. 25, no. 9, pp. 1214–1222, 2006. doi: 10.1109/TMI.2006.879967. [Google Scholar] [PubMed] [CrossRef]
49. Q. Li, B. Feng, L. Xie, P. Liang, H. Zhang and T. Wang, “A cross-modality learning approach for vessel segmentation in retinal images,” IEEE Trans. Med. Imaging, vol. 35, no. 1, pp. 109–118, 2015. doi: 10.1109/TMI.2015.2457891. [Google Scholar] [PubMed] [CrossRef]
50. J. I. Orlando, E. Prokofyeva, and M. B. Blaschko, “A discriminatively trained fully connected conditional random field model for blood vessel segmentation in fundus images,” IEEE Trans. Biomed. Eng., vol. 64, no. 1, pp. 16–27, 2016. doi: 10.1109/TBME.2016.2535311. [Google Scholar] [PubMed] [CrossRef]
51. Y. Yang, F. Shao, Z. Fu, and R. Fu, “Discriminative dictionary learning for retinal vessel segmentation using fusion of multiple features,” Signal Image Video Process., vol. 13, no. 8, pp. 1529–1537, 2019. doi: 10.1007/s11760-019-01501-9. [Google Scholar] [CrossRef]
52. B. Toptaş and D. Hanbay, “Retinal blood vessel segmentation using pixel-based feature vector,” Biomed. Signal Process. Control, vol. 70, pp. 103053, 2021. doi: 10.1016/j.bspc.2021.103053. [Google Scholar] [CrossRef]
53. P. Liskowski and K. Krawiec, “Segmenting retinal blood vessels with deep neural networks,” IEEE Trans. Med. Imaging, vol. 35, no. 11, pp. 2369–2380, 2016. doi: 10.1109/TMI.2016.2546227. [Google Scholar] [PubMed] [CrossRef]
54. Z. Yan, X. Yang, and K. T. Cheng, “Joint segment-level and pixel-wise losses for deep learning based retinal vessel segmentation,” IEEE Trans. Biomed. Eng., vol. 65, no. 9, pp. 1912–1923, 2018. doi: 10.1109/TBME.2018.2828137. [Google Scholar] [PubMed] [CrossRef]
55. C. Wang, Z. Zhao, and Y. Yu, “Fine retinal vessel segmentation by combining Nest U-net and patch-learning,” Soft Comput., vol. 25, no. 7, pp. 5519–5532, 2021. doi: 10.1007/s00500-020-05552-w. [Google Scholar] [CrossRef]
56. Y. Zhang, M. He, Z. Chen, K. Hu, X. Li and X. Gao, “Bridge-Net: Context-involved U-net with patch-based loss weight mapping for retinal blood vessel segmentation,” Expert. Syst. App., vol. 195, no. 70, pp. 116526, 2022. doi: 10.1016/j.eswa.2022.116526. [Google Scholar] [CrossRef]
57. G. B. Kande et al., “MSR U-Net: An improved U-Net model for retinal blood vessel segmentation,” IEEE Access, vol. 12, pp. 534–551, 2023. [Google Scholar]
58. W. Ding et al., “RCAR-UNet: Retinal vessel segmentation network algorithm via novel rough attention mechanism,” Inf. Sci., vol. 657, no. 3, pp. 120007, 2024. doi: 10.1016/j.ins.2023.120007. [Google Scholar] [CrossRef]
59. Z. Ma, X. Li, “An improved supervised and attention mechanism-based U-Net algorithm for retinal vessel segmentation,” Comput. Biol. Med., vol. 168, no. 2, pp. 107770, 2024. doi: 10.1016/j.compbiomed.2023.107770. [Google Scholar] [PubMed] [CrossRef]
60. J. Odstrcilik et al., “Retinal vessel segmentation by improved matched filtering: Evaluation on a new high-resolution fundus image database,” IET Image Process., vol. 7, no. 4, pp. 373–383, 2013. [Google Scholar]
61. G. Azzopardi, N. Strisciuglio, M. Vento, and N. Petkov, “Trainable COSFIRE filters for vessel delineation with application to retinal images,” Med. Image Anal., vol. 19, no. 1, pp. 46–57, 2015. doi: 10.1016/j.media.2014.08.002. [Google Scholar] [PubMed] [CrossRef]
62. K. Rezaee, J. Haddadnia, and A. Tashk, “Optimized clinical segmentation of retinal blood vessels by using combination of adaptive filtering, fuzzy entropy and skeletonization,” Appl. Soft Comput., vol. 52, pp. 937–951, 2017. doi: 10.1016/j.asoc.2016.09.033. [Google Scholar] [CrossRef]
63. F. Orujov, R. Maskeliūnas, R. Damaševičius, and W. Wei, “Fuzzy based image edge detection algorithm for blood vessel detection in retinal images,” Appl. Soft Comput., vol. 94, no. 1, pp. 106452, 2020. doi: 10.1016/j.asoc.2020.106452. [Google Scholar] [CrossRef]
64. M. Shabani and H. Pourghassem, “An active contour model using matched filter and Hessian matrix for retinalvessels segmentation,” Turkish J. Electr. Eng. Comput. Sci., vol. 30, no. 1, pp. 295–311, 2022. doi: 10.3906/elk-2106-3. [Google Scholar] [CrossRef]
65. A. M. Mendonca and A. Campilho, “Segmentation of retinal blood vessels by combining the detection of centerlines and morphological reconstruction,” IEEE Trans. Med. Imaging, vol. 25, no. 9, pp. 1200–1213, 2006. doi: 10.1109/TMI.2006.879955. [Google Scholar] [PubMed] [CrossRef]
Cite This Article
 Copyright © 2024 The Author(s). Published by Tech Science Press.
This work is licensed under a Creative Commons Attribution 4.0 International License , which permits unrestricted use, distribution, and reproduction in any medium, provided the original work is properly cited.
 Downloads
 Citation Tools