
 Submit a Paper
 Propose a Special lssue
 Open Access
ARTICLE

Enhanced Object Detection and Classification via Multi-Method Fusion
1 Department of Computer Science, Air University, Islamabad, 44000, Pakistan
2 Department of Information Systems, College of Computer and Information Sciences, Princess Nourah bint Abdulrahman University, P.O. Box 84428, Riyadh, 11671, Saudi Arabia
3 Department of Computer Science, College of Computer Science and Information System, Najran University, Najran, 55461, Saudi Arabia
4 Department of Computer Sciences, Faculty of Computing and Information Technology, Northern Border University, Rafha, 91911, Saudi Arabia
5 Department of Computer Engineering, Tech University of Korea, 237 Sangidaehak-ro, Siheung-si, Gyeonggi-do, 15073, South Korea
* Corresponding Author: Jeongmin Park. Email:
(This article belongs to the Special Issue: Machine Vision Detection and Intelligent Recognition)
Computers, Materials & Continua 2024, 79(2), 3315-3331. https://doi.org/10.32604/cmc.2024.046501
Received 04 October 2023; Accepted 10 January 2024; Issue published 15 May 2024
 View Full Text
 Download PDF
Abstract
Advances in machine vision systems have revolutionized applications such as autonomous driving, robotic navigation, and augmented reality. Despite substantial progress, challenges persist, including dynamic backgrounds, occlusion, and limited labeled data. To address these challenges, we introduce a comprehensive methodology to enhance image classification and object detection accuracy. The proposed approach involves the integration of multiple methods in a complementary way. The process commences with the application of Gaussian filters to mitigate the impact of noise interference. These images are then processed for segmentation using Fuzzy C-Means segmentation in parallel with saliency mapping techniques to find the most prominent regions. The Binary Robust Independent Elementary Features (BRIEF) characteristics are then extracted from data derived from saliency maps and segmented images. For precise object separation, Oriented FAST and Rotated BRIEF (ORB) algorithms are employed. Genetic Algorithms (GAs) are used to optimize Random Forest classifier parameters which lead to improved performance. Our method stands out due to its comprehensive approach, adeptly addressing challenges such as changing backdrops, occlusion, and limited labeled data concurrently. A significant enhancement has been achieved by integrating Genetic Algorithms (GAs) to precisely optimize parameters. This minor adjustment not only boosts the uniqueness of our system but also amplifies its overall efficacy. The proposed methodology has demonstrated notable classification accuracies of 90.9% and 89.0% on the challenging Corel-1k and MSRC datasets, respectively. Furthermore, detection accuracies of 87.2% and 86.6% have been attained. Although our method performed well in both datasets it may face difficulties in real-world data especially where datasets have highly complex backgrounds. Despite these limitations, GA integration for parameter optimization shows a notable strength in enhancing the overall adaptability and performance of our system.Keywords
Object detection and classification are important tasks in computer vision with applications spanning human detection [1], image retrieval [2], video analysis [3], and autonomous driving [4] Traditional machine learning methods face challenges with complex data scenarios, leading to a shift with the introduction of Convolutional Neural Networks (CNNs). CNNs excel in automatically extracting hierarchical features, particularly in detecting subtle changes in images, contributing to significant advancements in deep learning-based object recognition and classification. The use of object proposals, generated through methods like region proposal networks and sliding windows, further refines the search space in the identification process [5]. Features are extracted using CNN from these regions which allows to capture of the diverse representations from data at different scales and levels of abstraction. The features extracted from the data are inputted into a classification model, which improves the ability to categorize objects and determine their spatial location. Notable architectures like region-based convolutional neural networks (R-CNN) and You Only Look Once (YOLO) [6] have demonstrated exceptional performance on benchmark datasets such as PASCAL VOC and MS COCO.
Existing models for object detection and classification although have achieved remarkable success still have certain limitations. Detecting small objects and accommodating varying sizes remain crucial. Techniques like multi-scale feature extraction, anchor-based, and anchor-free methods improve precise localization and recognition of objects of different sizes [7]. A key obstacle is the need for extensive annotated datasets of significant size to train these models with optimal effectiveness. Although transfer learning has made significant progress by fine-tuning pre-trained models on extensive datasets for specific tasks, the need to have diverse and thorough training data remains essential. These models frequently encounter difficulties when faced with scenarios that are not adequately represented in the training data, resulting in problems such as biased and erroneous classifications in unfamiliar contexts. Moreover, these models face problems while detecting small objects and in real-world scenarios [8].
As the field progresses there are many notable methods and techniques are produced to overcome these challenges. The situations where data is limited Generative models play a very critical role in assisting object recognition by producing the data for training the models. An important concern is the vulnerability to adversarial attacks, in which even little, undetectable changes to input images might result in incorrect classifications [8]. One significant drawback arises from the high computational requirements of advanced models, which impede their use on devices with limited capabilities or in real-time scenarios. It is important to note that current models may face difficulties when dealing with differences in size, geographical position, and lighting circumstances [9,10]. To address these limitations, we must focus on efforts in developing robust architectures improving model interpretability, and enhancing computing performance. In this study, an innovative approach to object recognition and categorization is introduced with a combination of image processing and machine learning techniques. The key features of this study are:
• To enhance the quality of the input image for subsequent analysis Gaussian filter has been used which effectively removes noise during the initial preprocessing step.
• To divide an image into distinct sections based on intensity gradients, the Fuzzy C-Mean Clustering technique has been employed successfully.
• To identify the most important and distinctive regions of the image, a saliency map is created using composite features.
• To carry out feature detection and description tasks, the oriented fast and rotated brief (ORB) method has been utilized, demonstrating its adeptness in identifying and describing significant components within images.
• To enhance the performance of the random forest classifier, a genetic algorithm has been employed which finely adjusts classifier parameters and thereby enhances its accuracy.
The subsequent divisions of the article are structured as follows: Section 2 provides a comprehensive literature review. Section 3 outlines the methodology of our proposed system, including a detailed exposition of the model’s architecture. Section 4 presents the experimental outcomes, and employed datasets, and includes a comparison to existing methodologies. Section 5 concludes by drawing conclusions from the study and exploring opportunities for future study.
The detection and classification of natural objects in computer vision have numerous applications. A novel method combines region-based segmentation and decision tree classification for efficient object detection and classification in outdoor scenes. To identify potential object regions in the images region-based segmentation is employed which is based on factors such as color, texture, and location. The refinement procedure involves consolidating and differentiating these areas and then using a classification algorithm based on decision trees using a diverse dataset [11].
Geometric moment invariants in combination with Support Vector Machines (SVM) and K-Nearest Neighbor (KNN) have been used for object recognition tasks. To determine the K nearest neighbors it first extracts image features and then computes the Euclidean Distance. If K neighbor labels are identical then the query is labeled and terminates. It also calculates pairwise distances and applies SVM to the kernel matrix. This innovative approach merges SVM and KNN strengths for better object recognition [12].
The technique of salient segmentation entails identifying visually prominent portions of an image that are deemed significant. Subsequently, a hybrid genetic transformation is employed to achieve the dual objectives of object localization and object identification. Through comparative analysis between the proposed algorithms and their existing counterparts, it is evident that the former exhibits superior performance. This provides a dependable solution for the evaluation of intricate environments [13].
2.2 Object Segmentation and Deep Learning Advancements
Object segmentation, which involves dividing an image into pixels using masks or identifiers, has been studied extensively. However, to effectively segment things in complex contexts, we must bridge knowledge gaps. A novel framework for salient object recognition that makes use of multiscale contrast, a histogram that extends from the center to the periphery, and color-based spatial distribution. The addition of a Random Geometric Prior Forest improved subsequent image segmentation This method estimates the saliency map, locates the salient object’s boundary, and then labels and conceals salient object instances [14]. Fuzzy C-Means (FCM) and Graph Cut algorithms were used to solve image segmentation and color separation issues. It used Turbopixel to divide colors into super-pixels before retrieving histogram data to form clusters. Clusters and graph-cut objects are extracted [15]. A novel distance-based model that combines relative spatial information with visual distance and angles. The strategies and characteristics of these approaches facilitate object segmentation. They aid in identifying objects quickly and separating them from complex environments [11].
Due to the development of Deep Neural Networks (DNNs) and, more specifically, Convolutional Neural Networks (CNNs), the discipline of object detection has made significant progress. R-CNN has served as the foundation for many proposed enhanced models, such as Fast R-CNN, which simultaneously optimizes classification and bounding box regression. In contrast to YOLO’s [6] implementation of fixed-grid regression for object recognition, the Faster R-CNN [16] model includes a distinct subnetwork for generating region recommendations. The above models have shown different levels of improvement over the basic R-CNN [17], which makes it more likely that real-time and accurate object identification will be possible.
The section introduces a unique framework designed to improve the performance of object detection and classification in complex and challenging environments. The general design of the system includes preprocessing, segmentation, composite saliency map generation, feature extraction, genetic algorithm optimization, and random forest for classification. The efficacy of the framework in managing the intricacies of object detection and categorization is significantly augmented by the division of these activities into distinct stages. Fig. 1 presents a schematic depiction of the overarching architecture of the proposed paradigm.
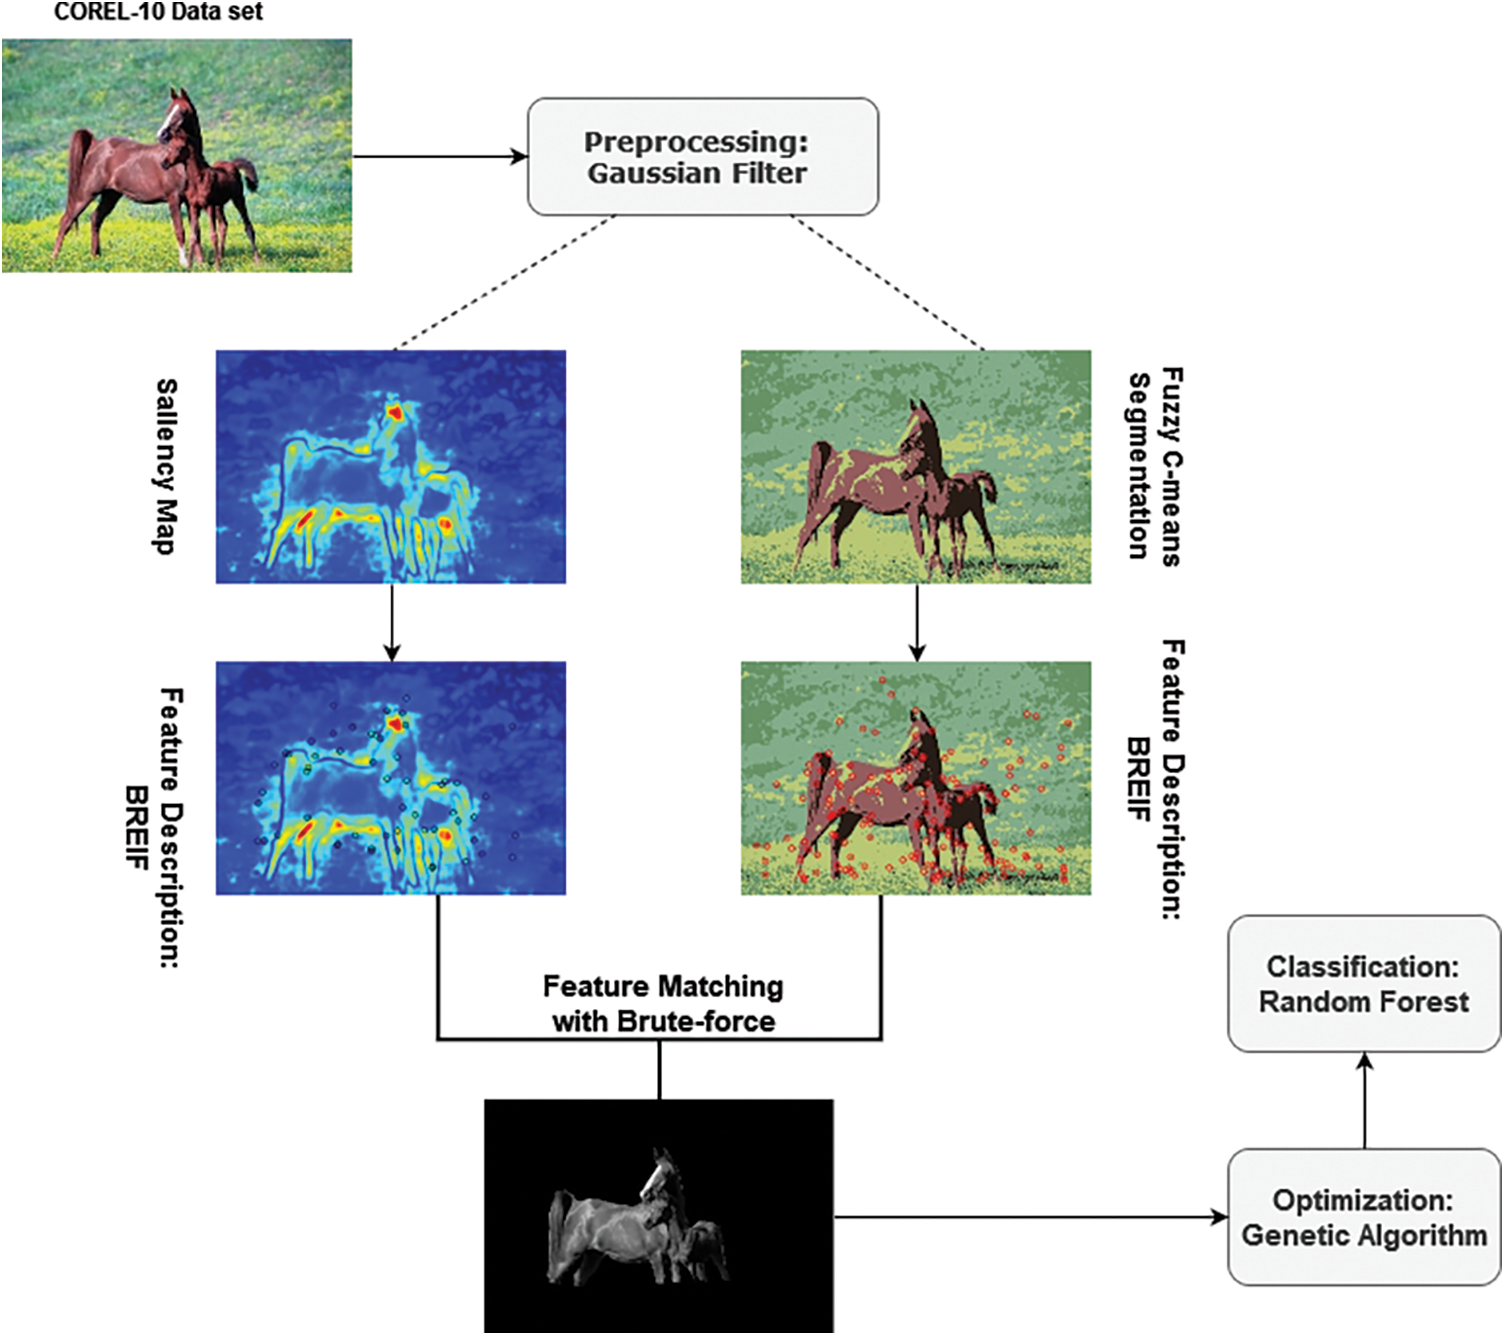
Figure 1: Architectural framework of the proposed model for object classification
The approach presented in this study employs a Gaussian filter to preprocess the input images. Gaussian filter helps in smoothing the image and reducing noise which enhances its suitability for subsequent processing. The Gaussian filter applies a convolution operation between the input image and the Gaussian kernel to achieve the desired effect [18]. The kernel assigns a weight to each adjoining pixel based on its distance from the center pixel. The significance of a pixel inside the filtering process increases as its proximity to the center of the image grows. An expression for the Gaussian filter is as follows:
where G (x, y) represents the value of the Gaussian kernel at coordinates (x, y), σ (sigma) denotes the standard deviation of the Gaussian distribution. The term σ2 in the equation represents the variance that controls the amount of smoothing applied to the image. The higher σ value results in more pronounced smoothing and indicates a broader spread of the Gaussian distribution which leads to a more extensive convolution effect and, consequently, stronger image smoothing. This relationship between σ and image smoothing is a critical aspect of the Gaussian filter’s functionality.
3.2 Fuzzy C-Mean-Based Segmentation
Next, we have applied Fuzzy C-Mean (FCM) for the segmentation selected for its adaptability in addressing challenges such as fuzziness and uncertainty in pixel memberships. FCM’s distinctive feature, allowing partial pixel memberships to multiple clusters, is well-suited for scenarios with indistinct boundaries. Its robustness in handling variations in image intensity and noise, combined with the incorporation of spatial information, enhances performance particularly in scenarios where boundaries between image regions are not sharply defined, dealing with variations in image intensity and noise levels, handling complex image structures, sparse or incomplete data, and accommodating non-uniform illumination [19,20]. This review emphasizes the effectiveness of FCM in different image segmentation tasks, such as medical imaging [21] and remote sensing [22]. The preprocessed image is first converted into a vector of color values which is then used as input to the FCM algorithm [23]. The FCM algorithm assigns a membership value to each pixel in the image based on its color value. The clustering process continues until convergence, which is reached when the membership values for all pixels reach a state of stability and no longer exhibit significant changes. The segmentation process produces a collection of clusters that have corresponding membership values. Each cluster represents a unique area within the image which is determined by its color [15]. Eqs. (2) and (3) show the mathematical representation of FCM image segmentation using color features and the centroid calculation procedure of clusters.
where D(v, w) is the distance between the color value of pixel v and the center of cluster w, n is the fuzziness coefficient, l is the number of clusters, and D(v, p) is the distance between the color value of pixel p and the center of cluster w. Cw represents the center of cluster w. The membership degree and cluster centroids are updated by using these equations iteratively until convergence. The algorithm aims to minimize the objective function that represents the “fuzziness” of the memberships and the closeness of data points to their respective cluster centroids. The resulted segmented images are shown in Fig. 2. The objective function is represented by Eq. (4) where J is the membership matrix, C is the center matrix, n represents the number of pixels, and l represents the number of clusters.
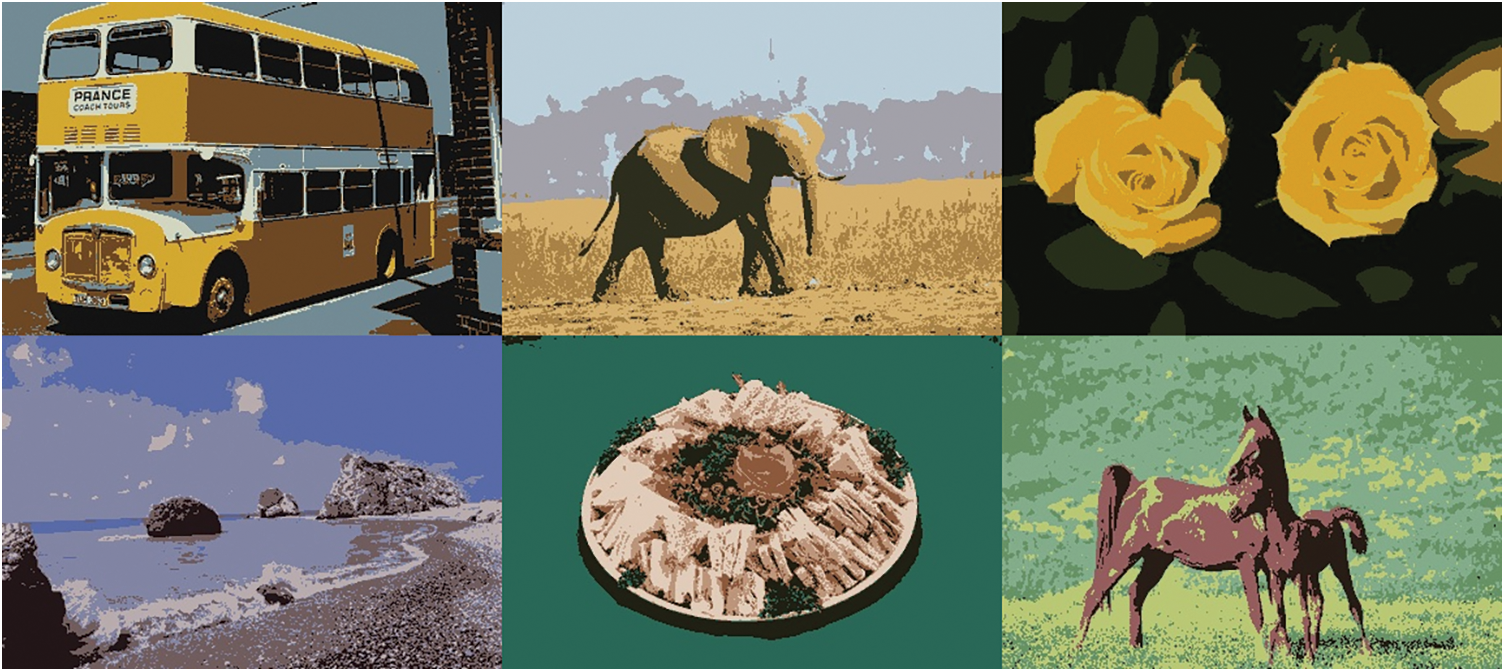
Figure 2: Fuzzy C-Mean segmented images
In this section, we conducted a parallel application of the composite saliency map on the preprocessed images after applying the Gaussian filter. The concept of visual saliency detection models involves emulating the human visual system to interpret scenes and has found widespread applications in various visual tasks. In the domain of RGB image saliency detection, the emphasis is on identifying significant regions within RGB images. This involves capturing visual cues from colors and patterns to enhance the accuracy of saliency detection. The composite saliency model introduces inter-image correspondence as a constraint. This helps identify objects that hold saliency across a group of images. It consists of three main feature maps: Color, intensity, and orientation [24]. Each feature map focuses on different aspects of the image and is calculated as follows and is depicted in Fig. 3.
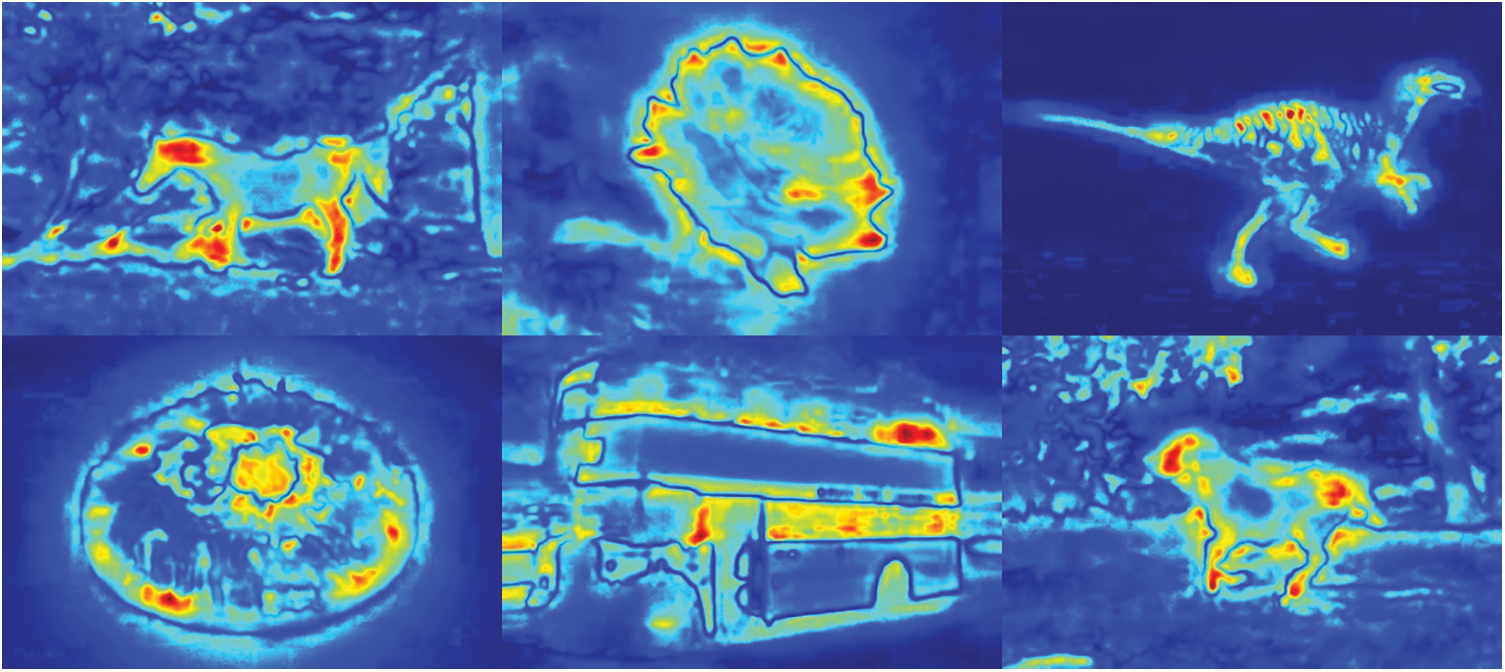
Figure 3: Saliency map applied on corel dataset
3.3.1 Preprocessing and Color Space Conversion
The color feature map C (x, y) captures image color variations. It computes the Euclidean distance between each pixel’s color values (R (x, y), G (x, y), B (x, y)) and the image’s average color (MR, MG, MB). This contrast measurement effectively identifies areas with noticeable color differences shown in Eq. (5).
3.3.2 Intensity Feature Map (I)
The intensity feature map quantifies grayscale intensity variations across the image. It measures the extent of intensity change for each pixel relative to the average intensity. This aids in detecting edges and boundaries associated with intensity changes. The Eq. (6) calculates the intensity feature map (I) at each pixel (x, y) as follows:
Let I (x, y) represent the intensity value of the pixel located at (x, y) within the image. The symbol MI symbolizes the average intensity value of all pixels in the image.
3.3.3 Orientation Feature Map (O)
The orientation feature map evaluates pixel alignment with predetermined orientations (horizontal, vertical, diagonal). Gradients along horizontal and vertical axes measure edge strength. The orientation feature map highlights strong edges aligned in specific directions [25]. The Eq. (7) for computing the orientation feature map (O) at each pixel (x, y) is as follows:
Let Gx (x, y) denote the horizontal gradient value at the pixel location (x, y), and Gy (x, y) represent the vertical gradient value at the pixel location (x, y).
3.3.4 Combining Feature Maps into Saliency Map (S)
The saliency map (S) is the final output that represents the combined information from the color feature map (C), intensity feature map (I), and orientation feature map (O) and is displayed in Fig. 3. The saliency map highlights regions in the image that are considered more visually salient based on their color contrasts, intensity variations, and edge orientations [26]. The Eq. (8) computes the saliency map (S) using the feature maps (C, I, O) and their respective weights:
where S (x, y) is the saliency map value at pixel location (x, y), C (x, y) is the color feature map value at pixel location (x, y), I (x, y) is the intensity feature map value at pixel location (x, y), O (x, y) is the orientation feature map value at pixel location (x, y) and Wc, Wi and Wo are the weights assigned to the color, intensity, and orientation feature maps, respectively.
The process of feature detection is accomplished by using the ORB (Oriented Fast and Rotated BRIEF) algorithm which is a very effective method for feature detection. The combination makes ORB particularly suitable for real-time applications and scenarios with limited computational resources [27].
The Features from Accelerated Segment Test (FAST) algorithm detects key points in the image. It operates by analyzing the pixel intensities in a circular pattern around each pixel (x, y) and determining if a sufficient number of contiguous pixels are brighter than the central pixel. A key point is considered when at least 9 contiguous pixels are brighter than the central pixel [28]. The computation of the FAST score is performed in the following equation:
where I (p) is the intensity value at pixel p located in a 9-pixel circular pattern around (x, y) and I (x, y) is the intensity value at the central pixel (x, y).
3.4.2 Feature Description with BRIEF
Once the key points are detected, ORB computes a binary descriptor for each key point using the BRIEF algorithm as depicted in Fig. 4. The BRIEF algorithm produces a binary code by evaluating the pixel intensities at predetermined points surrounding the key point. The comparison results in a binary pattern where the presence of a 1 indicates a higher intensity, while the presence of a 0 indicates a lower intensity. The binary pattern is used as the descriptor for the key point in a subsequent step. The BRIEF algorithm utilizes a predetermined collection of pixel coordinate pairs and evaluates the corresponding pixel intensities to output binary codes [29]. It offers adjustable parameters that can be used to control performance in tasks related to feature recognition and description. A 100-keypoint limit is set for image identification to manage point concentration and algorithm computation. Moreover, 8 pyramid layers are chosen for ORB, providing scale invariance for varied object sizes and perspectives. Multiple pyramid levels efficiently detect diverse feature sizes.
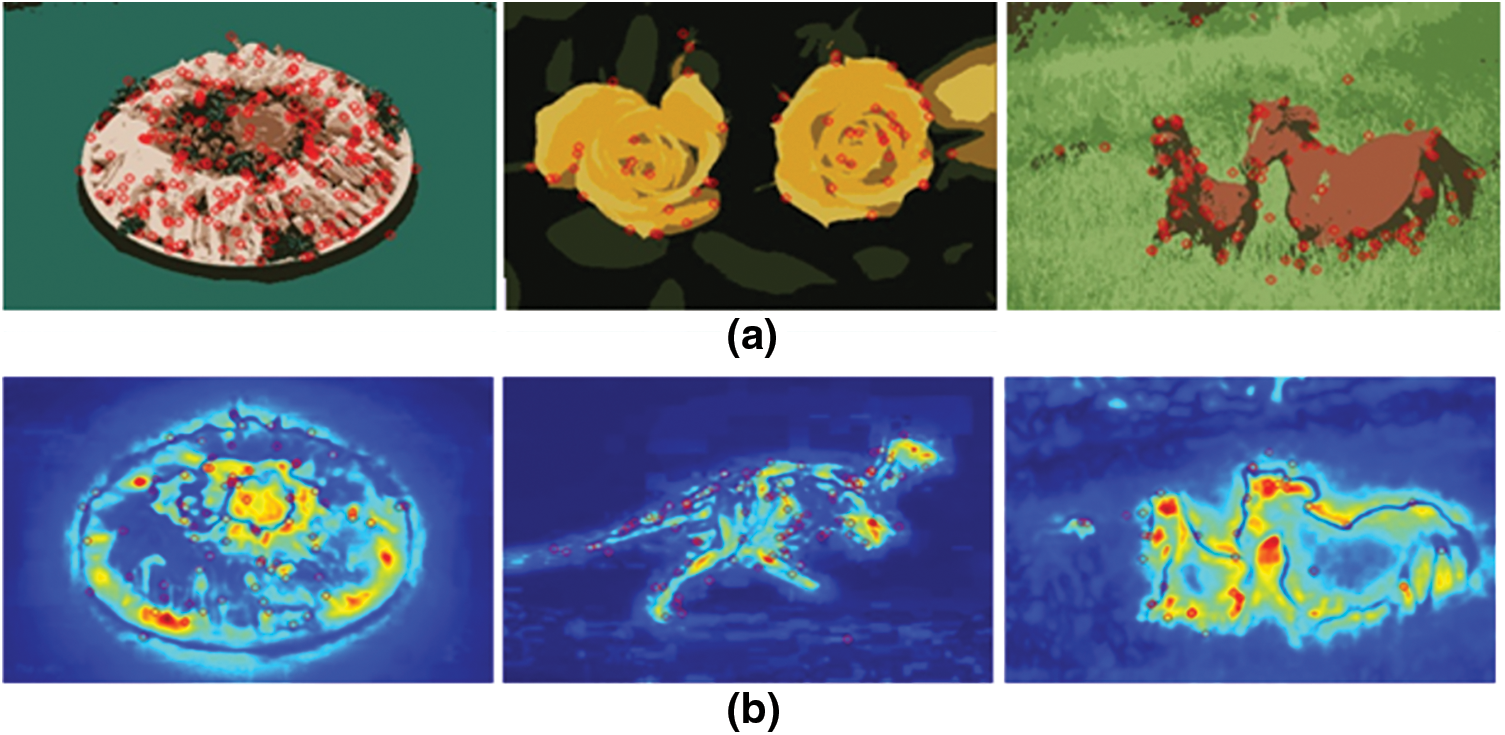
Figure 4: BRIEF key point mapping on Fuzzy C-Mean (a) and saliency-mapped images (b)
3.4.3 Feature Matching with Brute-Force
The process of feature matching is essential to the extraction of objects, as it involves establishing connections between key points in both the segmented image and the saliency map. Every feature in one image is matched to every feature in the other image using the brute-force matcher, which is a basic method for matching features. Hamming distance is used to calculate the distance between key points in both images where shorter distance represents the stronger correspondence. Extracted key points represent corresponding positions shared between the segmented image and the saliency map. Fig. 5 depicts extracted objects using ORB.
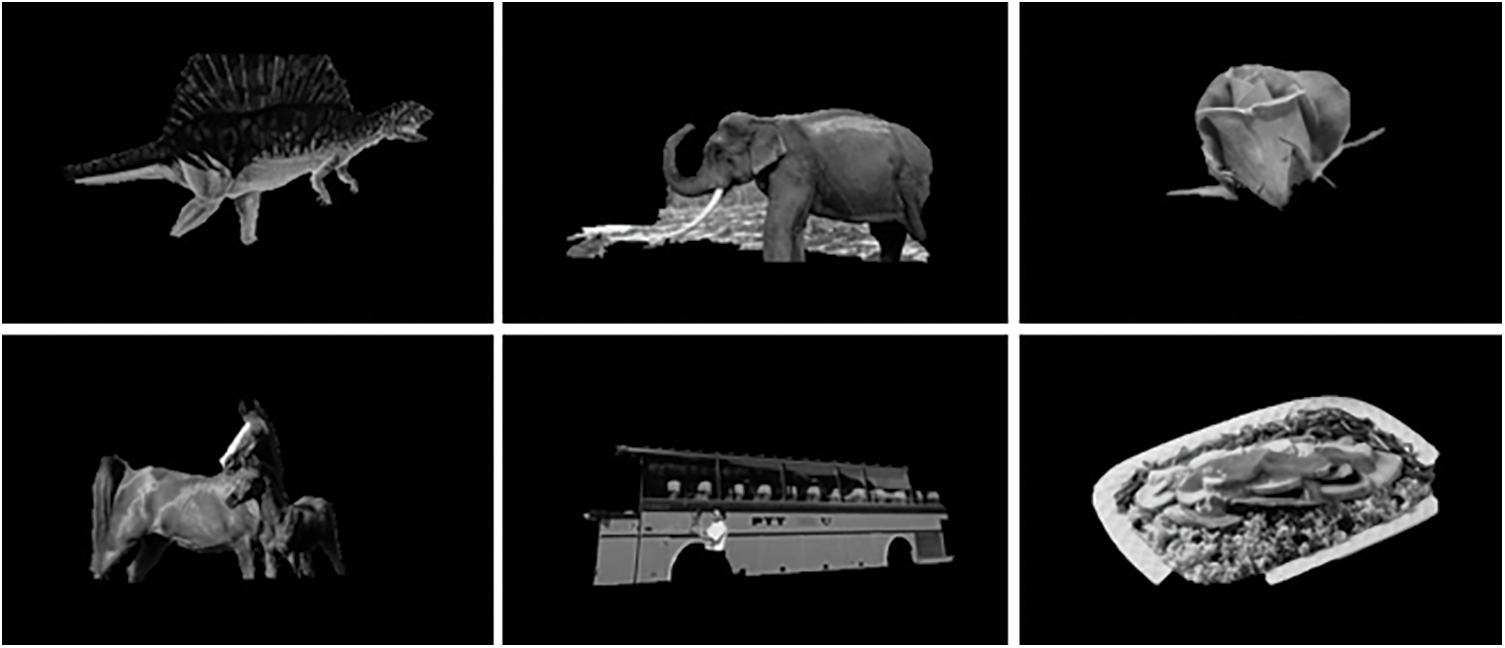
Figure 5: Extracted objects using oriented fast and rotated BRIEF
3.5 Genetic Algorithm For Optimizing Random Forest Classifier
We utilized Genetic Algorithms (GAs) for optimizing Random Forest hyperparameters in image classification. GAs excel in parallel searches, mitigating local optima and enhancing the chance of finding near-optimal configurations. Their use of probabilistic selection helps to explore different solutions effectively which makes it easy to find the best configuration for the model. After a careful literature review, Genetic Algorithms have been selected for hyperparameter optimization, with a particular emphasis on their efficacy in ensemble methods such as Random Forests. Moreover, research findings, exemplified in related studies, underscore the efficacy of Genetic Algorithms (GAs) in comparable contexts [30]. Our deliberate utilization of GAs is geared towards methodically exploring and pinpointing optimal configurations, thereby boosting the performance of the Random Forest classifier in image classification tasks.
We extracted the objects using BRIEF and brute force and combined the extracted features from all the images into a single feature dataset. These features are converted into a numerical format along with the corresponding labels for each image, which were used for training and evaluation [31]. We initialized our population by randomly generating sets of parameter values for the Random Forest classifier, including the number of trees in the forest, the maximum depth of each tree, and the minimum number of samples required to split an internal node. We used accuracy as our fitness metric, which was calculated by evaluating its performance on a validation set [32]. We used a cross-validation approach to ensure that the accuracy score was robust and not overfitting to the training data. Eq. (10) represents fitness function.
where the error rate is the classification error rate and complexitypenalty is a penalty term that accounts for the complexity of the model. We selected the fittest individuals in the population to undergo crossover, where their parameter values were combined to create new offspring. We used the Recursive Feature Elimination approach to select the most informative features for each parent and combine them to create a new set of features for the offspring. Mutation was introduced to prevent premature convergence and promote diversity in the population [33]. The model randomly selected a subset of features to add or remove from the offspring. The termination criterion is set based on a target accuracy score. The model is monitored for the convergence of the population and the algorithm early if it appears to have reached a stable solution. The complexity can be claulated by using Eq. (11).
The hyperparameter alpha governs the magnitude of the penalty term, numtrees represents the number of trees within the forest, and maxdepth denotes the upper limit on the depth of each tree. Fig. 6 depicts the optimization strategy of the Genetic algorithm for the classification of random forests.
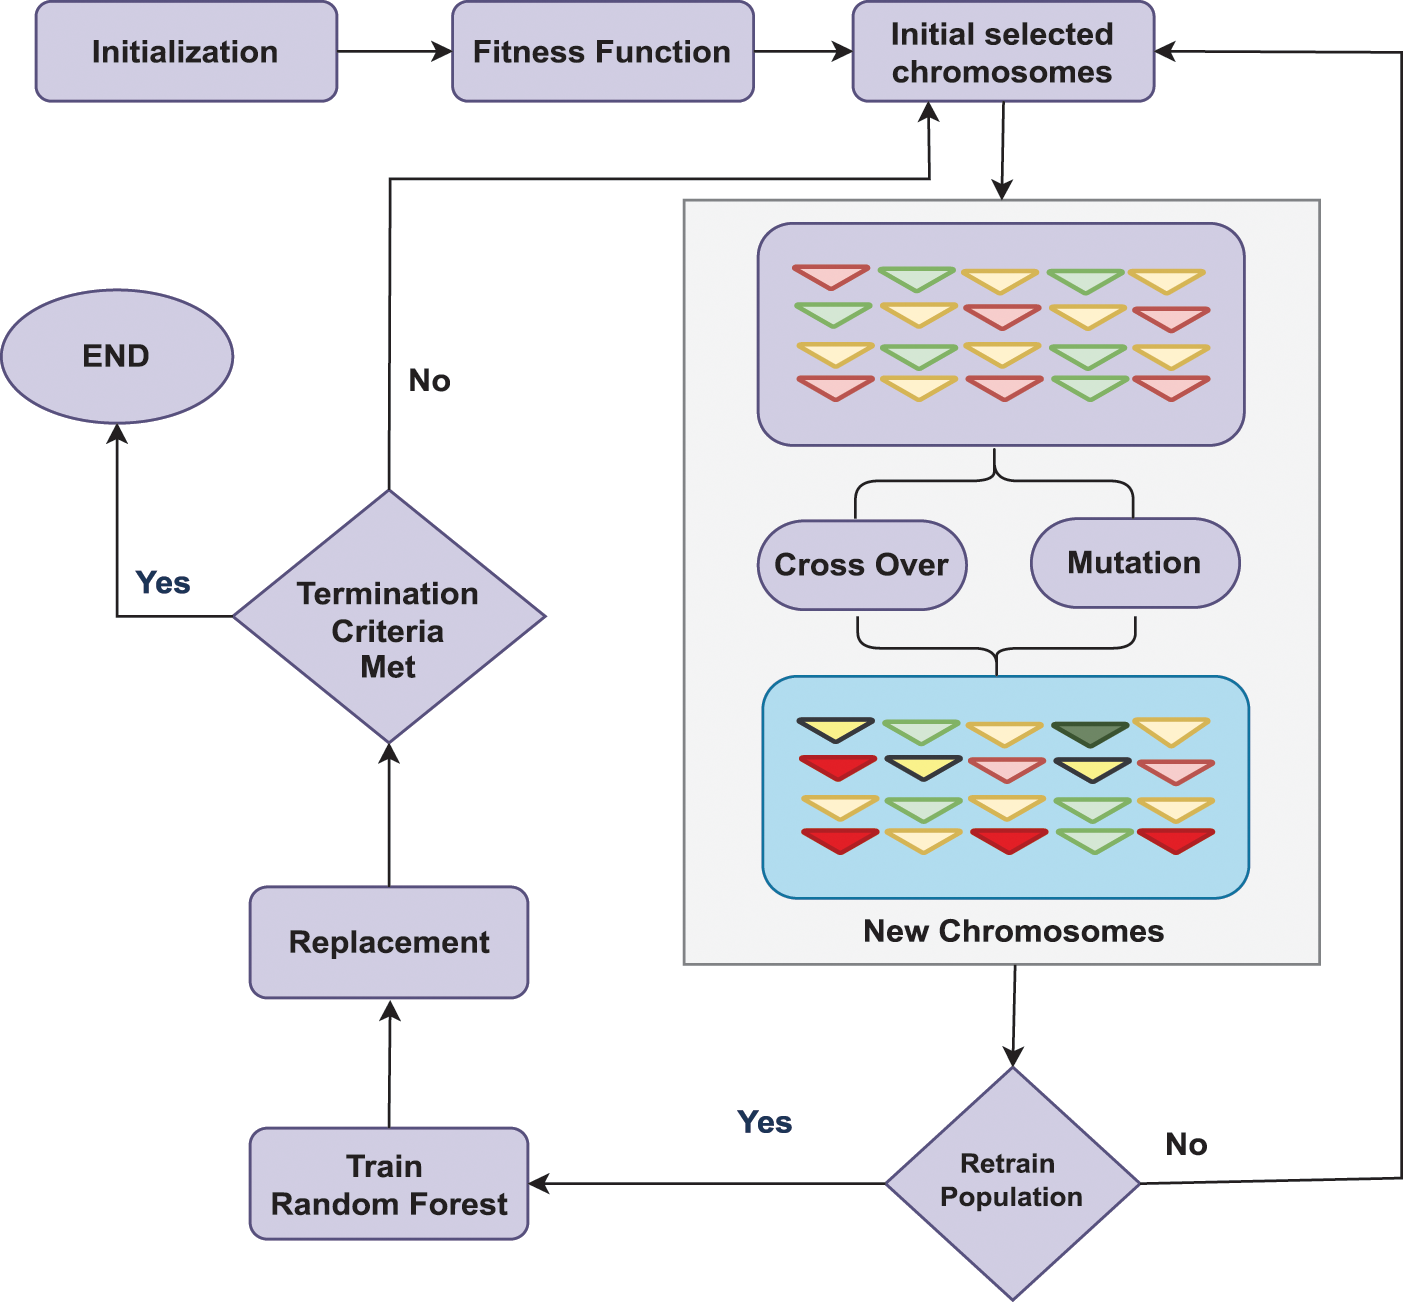
Figure 6: Structural diagram genetic algorithm for optimizing random forest classifier
In this section, we present the experimental procedures conducted as part of this study and the corresponding results obtained to showcase the effectiveness and importance of the proposed model.
To assess the performance of our system, we conducted evaluations on two of the most popular datasets, the Corel dataset and the MSRC dataset. Below, we provide detailed information about these datasets:
The Corel-1k dataset [34] comprises 10 classes, each containing 100 images of 384 × 256 resolution. The dataset includes object classes such as buses, beaches, elephants, horses, people, buildings, dishes, flowers, mountains, and dinosaurs. The dataset consists of a total of 1000 images, which are divided into 70 images for training and 10 images for testing within each class group.
The MSRC dataset [10] comprised an object of 591 various categories with dynamic environments including street buildings, landscapes with hills, traffic signs, seaside, etc. The dataset is a collection of 15 different classes from which we have selected 10 for our model including bench, cow, car, horse, sheep, person, tree, grass, airplane, and building. The resolution of the images in the dataset is 213 × 320 and images are a combination of single and multiple objects.
4.2 Performance Measurement and Result Analysis
In the following section, the recognition accuracies of our proposed model, based on a random forest classifier are illustrated using two benchmark datasets: Corel-1k and MSRC. To evaluate the model’s performance, we have computed the confusion matrices for object recognition on both datasets, and the results are displayed in Table 1 for Corel-1k and Table 2 for MSRC. The results from the two datasets, Corel-1k and MSRC, offer valuable insights into the performance of our image classification model. On the Corel-1k dataset, our model demonstrates high accuracy in numerous categories, with “AT,” “B,” “BD,” “BS,” and “EL” achieving impressive accuracy rates above 90%. “HR” stands out with a remarkable accuracy of 96%, which highlights the effectiveness of our models’ performance. However, categories like “FL” and “MT” present challenges and produced slightly lower accuracy scores which suggest room for improvement. The overall image classification accuracy on Corel-1k is a meritorious 90.9%. On the MSRC dataset, our model also exhibits strong performance in several categories which include “AP,” “BC,” “BD,” “CA,” and “HS.” While the majority of classes performed well, “CW” and “PT” showed lower accuracy which indicates areas for potential improvement. The overall image classification accuracy on MSRC is 89.2%, reflecting the model’s overall effectiveness in classifying images across these categories.
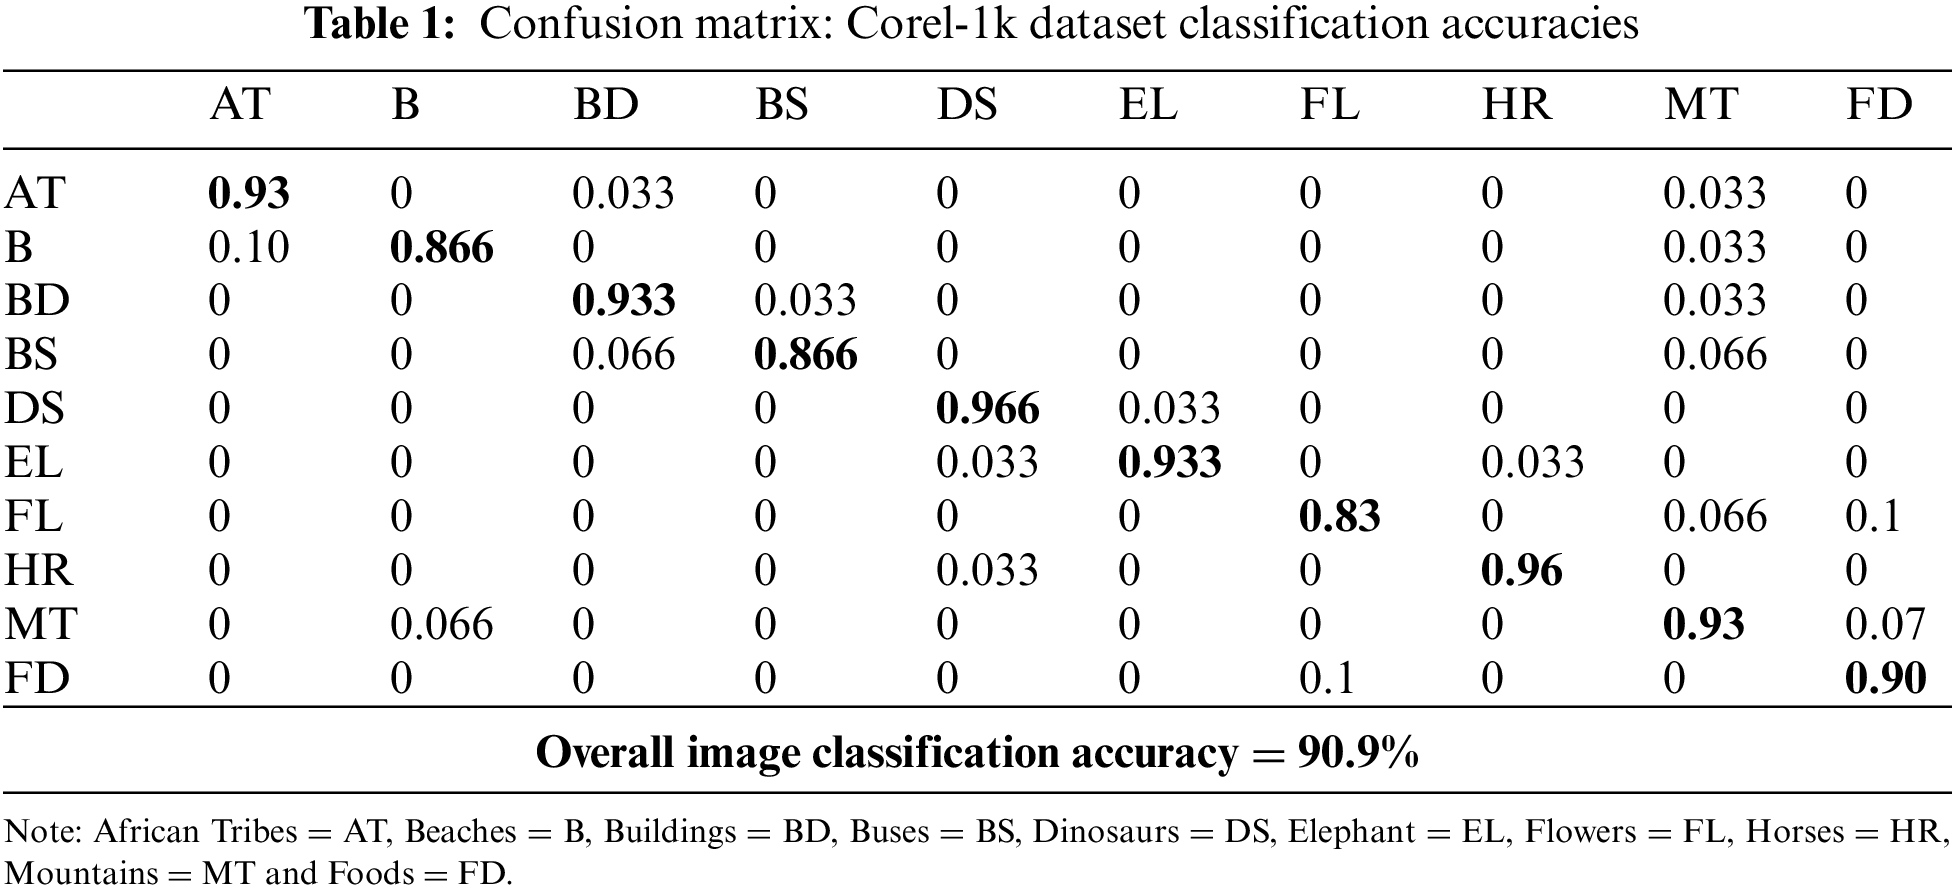
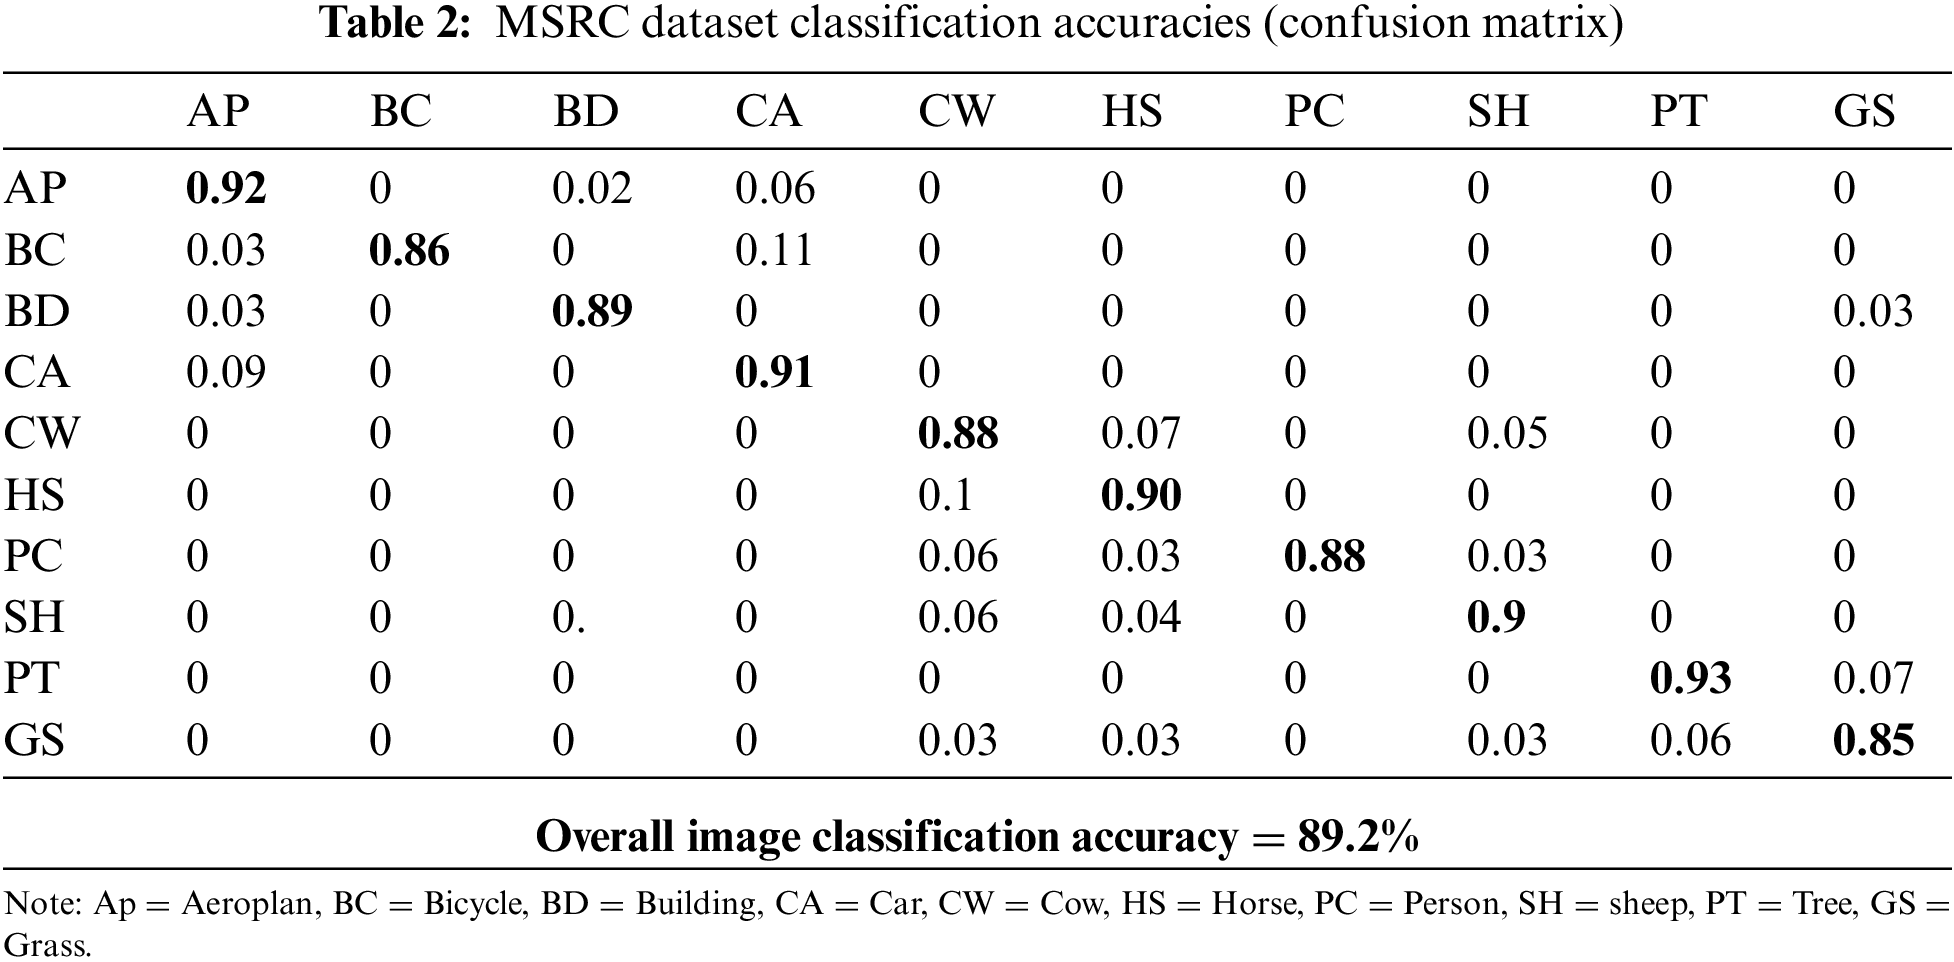
Table 3 compares the mean classification accuracy percentages of various state-of-the-art methods on both the Corel-1k and MSRC datasets. This comparative analysis provides valuable insights into the efficacy of our approach and its competitive edge over existing methods. On the Corel-1k dataset, the proposed method achieves an impressive mean classification accuracy of 90.9%. This indicates its substantial effectiveness in accurately categorizing objects within the images. The accuracy is comparable to that of Bappy et al. [34], which is widely acknowledged as one of the highest-performing methods, achieving an accuracy of 92.3%. Furthermore, it performs exceptionally well on the MSRC dataset, achieving a mean classification accuracy of 89.2%. This highlights the strength and reliability of our technique, since it consistently achieves good performance on both datasets.
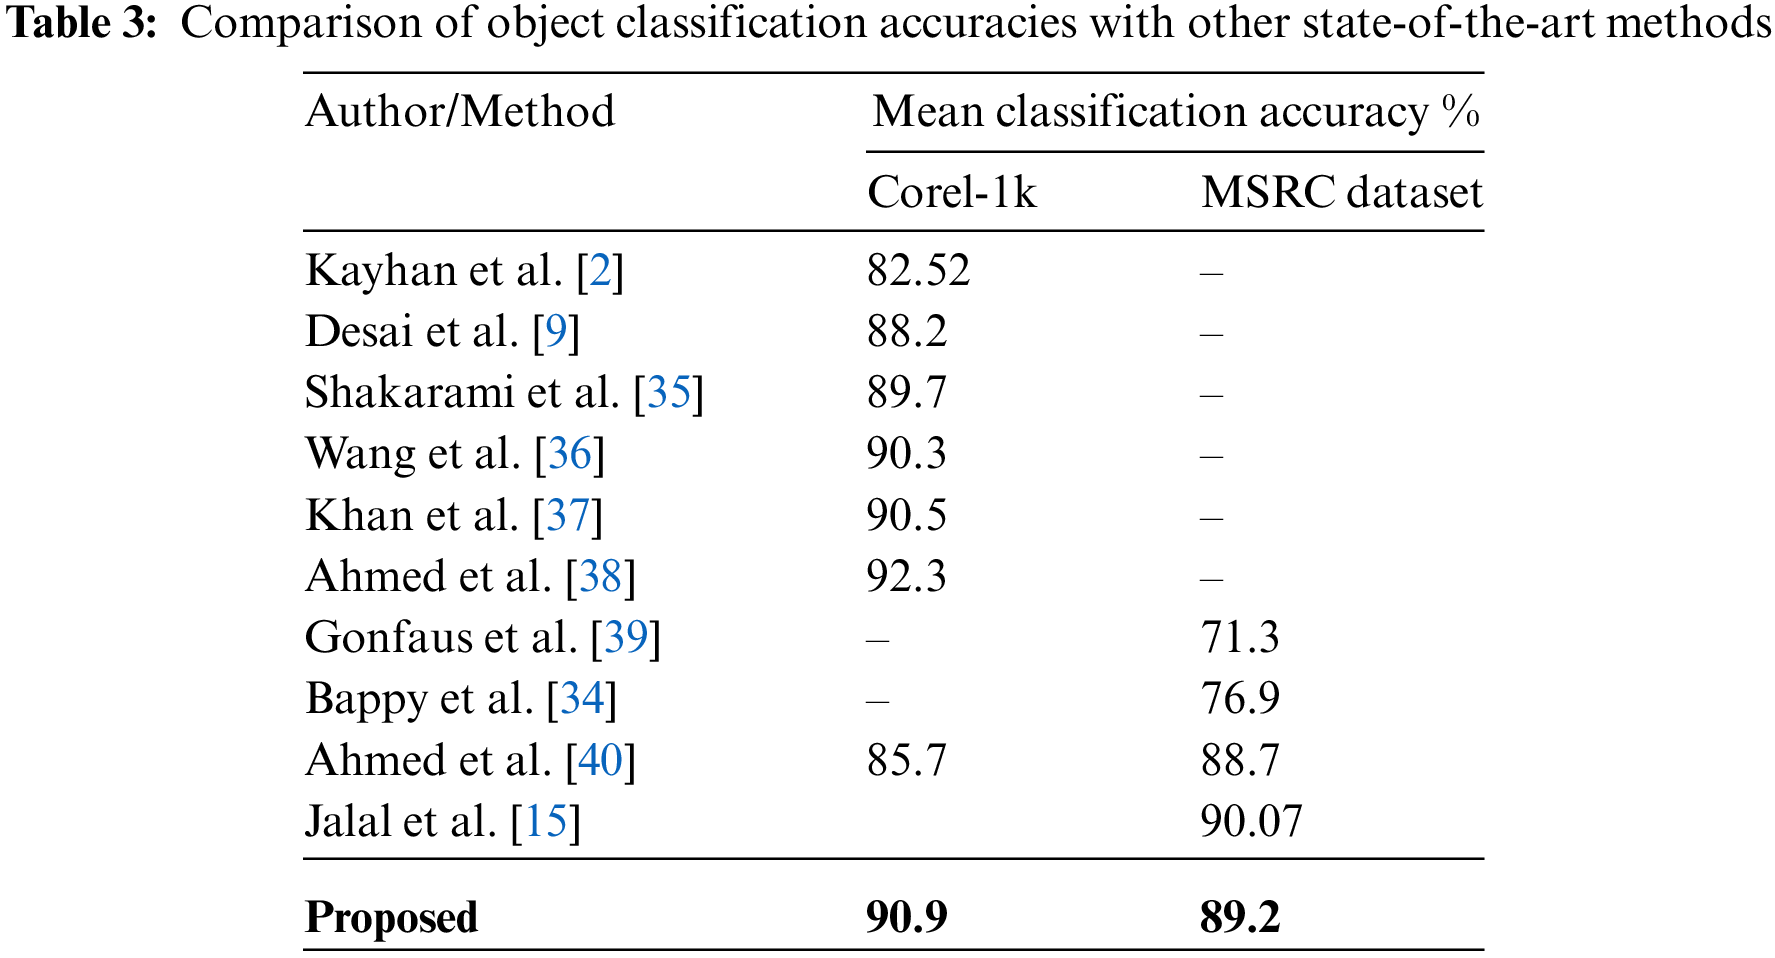
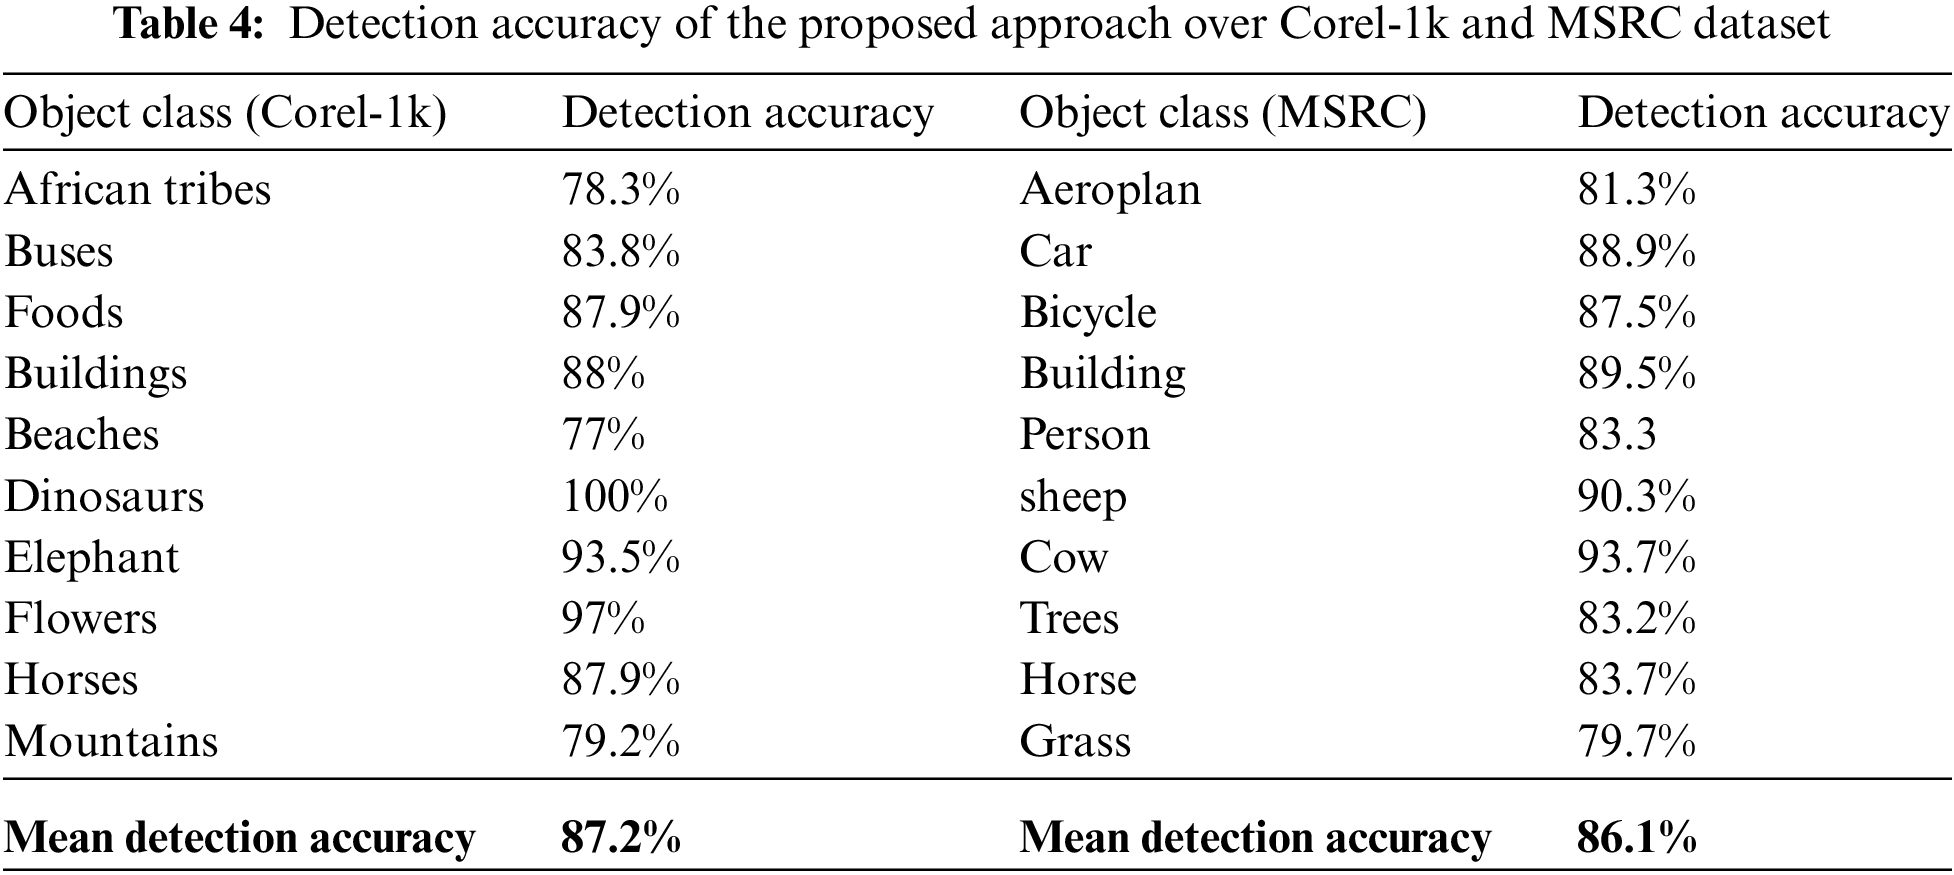
Table 4 displays the accuracy of object detection for each category in the Corel-1k and MSRC datasets. It obtains a mean detection accuracy of 87.2% on the Corel-1k dataset. Significantly, it achieves a flawless accuracy rate of 100% in identifying the dinosaur class. When tested on the MSRC dataset, the model consistently performs well, with a mean detection accuracy of 86.1%. The results emphasize the model’s adaptability and efficiency in accurately identifying a diverse range of object categories, rendering it a significant asset for practical use cases.
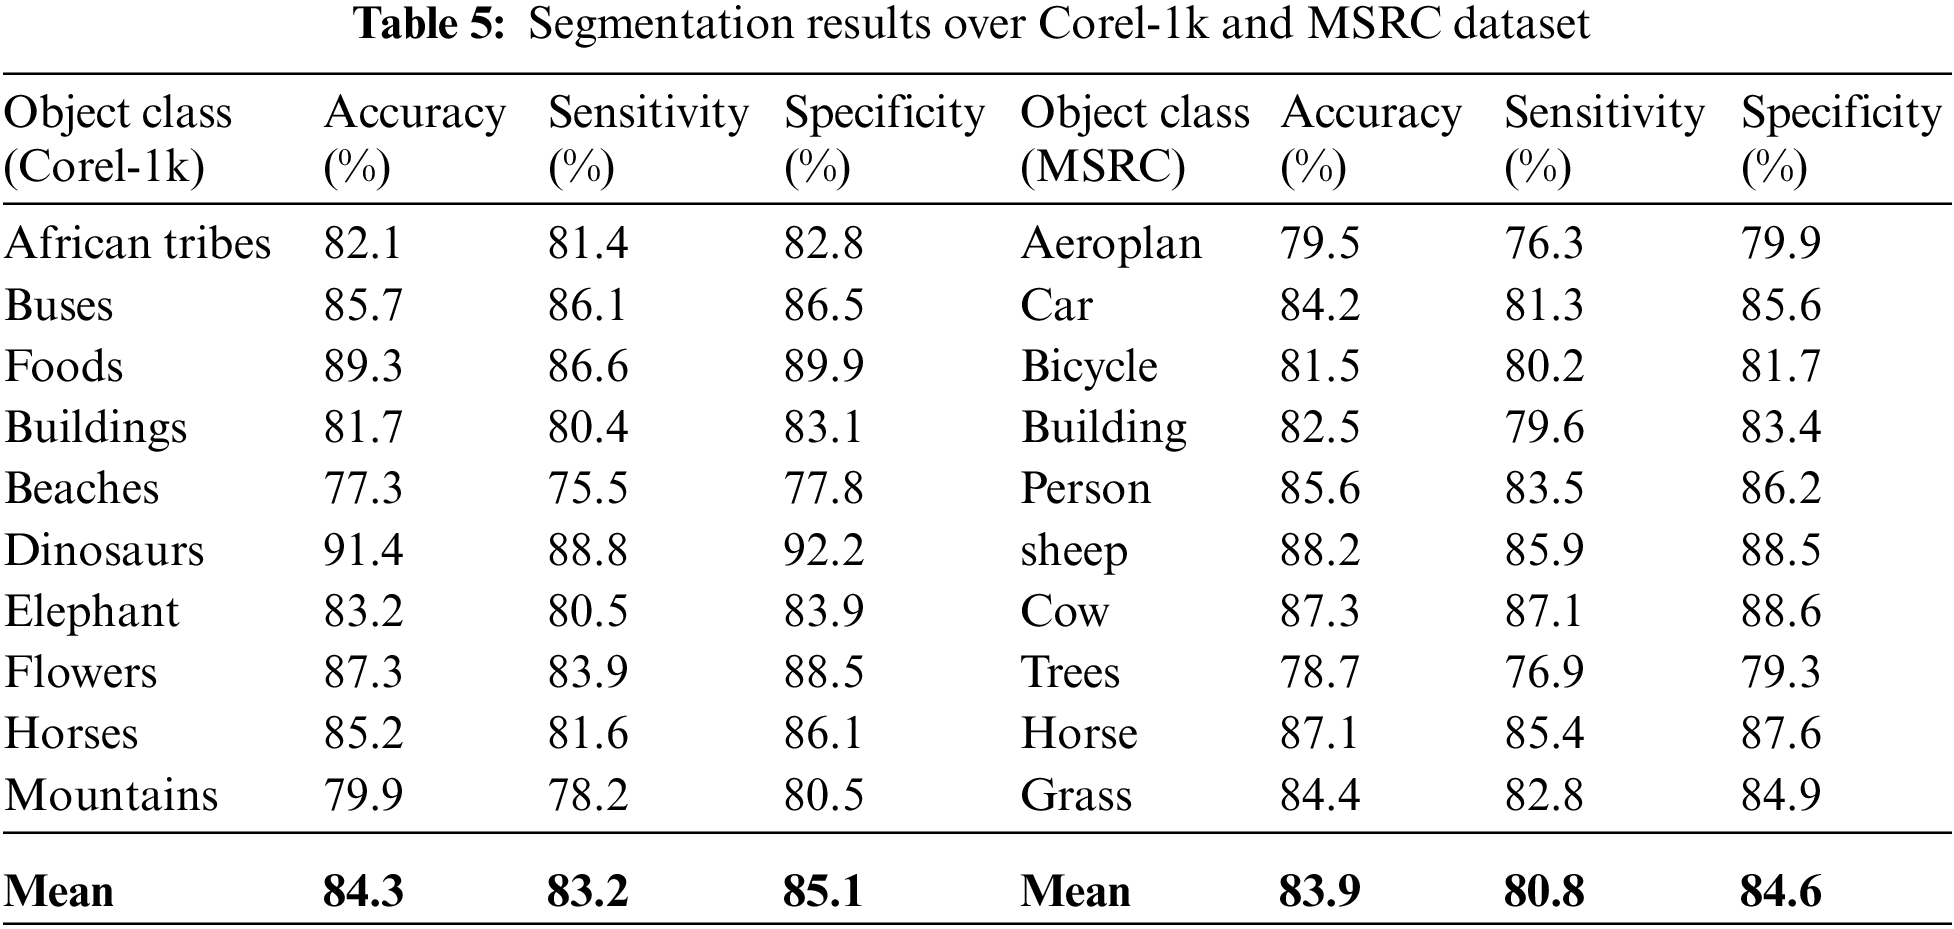
The segmentation results of Corel-1k and MSRC, are depicted in Table 5 which exhibits robust performance across several object categories, achieving a high degree of accuracy at the pixel level. The segmentation accuracy of Corel-1k, measured at a pixel-wise level, is exceptional, reaching 84.3%. The model achieves accuracy in delineating object boundaries by accurately detecting affirmative cases at the pixel level with a sensitivity of 83.2%. The model’s pixel prediction specificity, with a negative value of 85.1%, displays its ability to accurately differentiate between pixels belonging to objects and those belonging to the background. The method attains an accuracy of 83.9% in categorizing pixels into object classes on the MSRC dataset. Although the sensitivity (80.8%) and specificity (84.6%) at the pixel level are slightly lower compared to Corel-1k, depicting exceptional capability for pixel-wise segmentation.
We have conducted a series of four ablation experiments to evaluate the significance of each methodology in our research. Initially, we analyzed the consequences of omitting the saliency map component within our methodology. The omission of the saliency map following Fuzzy C-Means segmentation resulted in a notable decrease in object detection accuracy for Corel-1k (79.4%) and MSRC (77.5%). This highlights the importance of the saliency map in improving the performance of the methodology. The saliency map helps to prioritize relevant image regions which reduces the impact of noise interference and facilitates effective feature extraction. Furthermore, we have also conducted experiments to evaluate the impact of utilizing only the BRIEF or ORB feature extractor, while maintaining consistency in other components. The exclusion of the BRIEF descriptor resulted in a decrease in accuracy to 77.2% for Corel-1k and 79.7% for MSRC. We investigated the classification stage, specifically utilizing Random Forest as the only method without any optimization from the Genetic Algorithm. As a result of this modification, there was a decline in the average classification accuracy for Corel-1k, which decreased to 84.4%, and for MSRC, which decreased to 82.7%.
This work demonstrates the efficacy of employing a comprehensive methodology to improve the accuracy of image classification and object detection. The impressive results achieved on challenging datasets can be attributed to the integration of various techniques such as Gaussian filters, parallel segmentation, saliency mapping, BRIEF, ORB, and GA optimization. Future work should encompass the extension of this approach to larger and more diverse datasets by facilitating a broader evaluation of its performance and generalizability. Furthermore, considering the dynamic nature of videos the approach can be adopted for video analysis in which object detection would be a valuable avenue for exploration. Moreover, real-time implementation of the methodology on videos could be pursued, opening up opportunities for applications in surveillance, autonomous systems, and video understanding. We are currently planning the implementation of our method for biomedical images to advance medical imaging.
Acknowledgement: This research is supported and funded by Princess Nourah bint Abdulrahman University, Riyadh, Saudi Arabia.
Funding Statement: This work was supported by a grant from the Basic Science Research Program through the National Research Foundation (NRF) (2021R1F1A1063634) funded by the Ministry of Science and ICT (MSIT), Republic of Korea. This research is supported and funded by Princess Nourah bint Abdulrahman University Researchers Supporting Project Number (PNURSP2024R410), Princess Nourah bint Abdulrahman University, Riyadh, Saudi Arabia. The authors are thankful to the Deanship of Scientific Research at Najran University for funding this work under the Research Group Funding program Grant Code (NU/RG/SERC/12/6).
Author Contributions: The authors confirm contribution to the paper as follows: Study conception and design: Muhammad Waqas Ahmed and Nouf Abdullah Almujally; data collection: Asaad Algarni; Abdulwahab Alazeb and Jeongmin Park; draft manuscript preparation: Muhammad Waqas Ahmed, Nouf Abdullah Almujally and Jeongmin Park. All authors reviewed the results and approved the final version of the manuscript.
Availability of Data and Materials: The data that support the findings of this study are openly available in [MSRC] at [https://mldta.com/dataset/msrc-v2/] and [Corel-1k] at [https://figshare.com/articles/dataset/Corel-10/12103638].
Conflicts of Interest: The authors declare that they have no conflicts of interest to report regarding the present study.
References
1. S. Kamal, A. Jalal, and D. Kim, “Depth images-based human detection, tracking and activity recognition using spatiotemporal features and modified HMM,” J. Electr. Eng. Technol., vol. 11, no. 6, pp. 1857–1862, Nov. 2016. doi: 10.5370/JEET.2016.11.6.1857. [Google Scholar] [CrossRef]
2. N. Kayhan and S. Fekri-Ershad, “Content based image retrieval based on weighted fusion of texture and color features derived from modified local binary patterns and local neighborhood difference patterns,” Multimed. Tools Appl., vol. 80, no. 21–23, pp. 32763–32790, Sep. 2021. doi: 10.1007/s11042-021-11217-z. [Google Scholar] [CrossRef]
3. J. He, Y. Chen, N. Wang, and Z. Zhang, “3D video object detection with learnable object-centric global optimization,” in Proc. IEEE/CVF Conf. Comput. Vision Pattern Recognit. (CVPR), 2023. [Google Scholar]
4. M. Alqarqaz, M. Bani Younes, and R. Qaddoura, “An object classification approach for autonomous vehicles using machine learning techniques,” World Electric Veh. J., vol. 14, no. 2, pp. 41, Feb. 2023. doi: 10.3390/wevj14020041. [Google Scholar] [CrossRef]
5. A. Ahmed, A. Jalal, and K. Kim, “Multi-objects detection and segmentation for scene understanding based on texton forest and kernel sliding perceptron,” J. Electr. Eng. Technol., vol. 16, no. 2, pp. 1143–1150, Mar. 2021. doi: 10.1007/s42835-020-00650-z. [Google Scholar] [CrossRef]
6. J. Redmon, S. Divvala, R. Girshick, and A. Farhadi, “You only look once: Unified, real-time object detection,” in Proc. IEEE Conf. Comput. Vis. Pattern Recognit., Las Vegas, NV, USA, 2016, pp. 779–788. [Google Scholar]
7. W. Chen, Y. Li, Z. Tian, and F. Zhang, “2D and 3D object detection algorithms from images: A survey,” Array, vol. 19, pp. 100305, Sep. 2023. doi: 10.1016/j.array.2023.100305. [Google Scholar] [CrossRef]
8. C. Szegedy et al., “Intriguing properties of neural networks,” in Proc. Int. Conf. Learn. Rep., Banff National Park, Canada, 2014. [Google Scholar]
9. P. Desai, J. Pujari, Akhila, and C. Sujatha, “Impact of multi-feature extraction on image retrieval and classification using machine learning technique,” SN Comput. Sci., vol. 2, no. 3, pp. 1–9, May 2021. doi: 10.1007/s42979-021-00532-9. [Google Scholar] [CrossRef]
10. A. Ahmed, A. Jalal, and A. A. Rafique, “Salient segmentation based object detection and recognition using hybrid genetic transform,” in Proc. Int. Conf. Appl. Eng. Math. (ICAEM), London, UK, Aug. 2019, pp. 203–208. [Google Scholar]
11. A. Ahmed, A. Jalal, and K. Kim, “Region and decision tree-based segmentations for multi-objects detection and classification in outdoor scenes,” in Proc. Int. Conf. Front. Inf. Technol. (FIT), Islamabad, Pakistan, Dec. 2019, pp. 209–214. [Google Scholar]
12. C. Chandrasekar, “Object recognition using SVM-KNN based on geometric moment invariant 3D object recognition using multiclass support vector machine-K-nearest neighbor supported by local and global feature view,” Int. J. Comput. Trends Technol., vol. 1, no. 1, pp. 215–220, 2011. [Google Scholar]
13. U. Maulik, “Medical image segmentation using genetic algorithms,” IEEE Trans. Inf. Technol. Biomed., vol. 13, no. 2, pp. 166–173, 2009. doi: 10.1109/TITB.2008.2007301. [Google Scholar] [PubMed] [CrossRef]
14. X. Liu, M. Song, D. Tao, J. Bu, and C. Chen, “Random geometric prior forest for multiclass object segmentation,” IEEE Trans. Image Process., vol. 24, no. 10, pp. 3060–3070, Oct. 2015. [Google Scholar] [PubMed]
15. A. Jalal, A. Ahmed, A. A. Rafique, and K. Kim, “Scene semantic recognition based on modified fuzzy C-mean and maximum entropy using object-to-object relations,” IEEE Access, vol. 9, pp. 27758–27772, 2021. doi: 10.1109/ACCESS.2021.3058986. [Google Scholar] [CrossRef]
16. S. M. Abbas and S. N. Singh, “Region-based object detection and classification using faster R-CNN,” in Proc. Int. Conf. Comput. Intell. Commun. Technol. (CICT), Ghaziabad, India, Oct. 2018. [Google Scholar]
17. M. Liang and X. Hu, “Recurrent convolutional neural network for object recognition,” in Proc. IEEE Conf. Comput. Vis. Pattern. Recognit., Boston, MA, 2015, pp. 3367–3375. [Google Scholar]
18. S. K. Kopparapu and M. Satish, “Identifying optimal Gaussian filter for Gaussian noise removal,” in Proc. National Conf. Comput. Vis., Pattern Recognit., Image Process. Graph., (NCVPRIPG), Karnataka, India, 2011, pp. 126–129. [Google Scholar]
19. M. Alruwaili, M. H. Siddiqi, and M. A. Javed, “A robust clustering algorithm using spatial fuzzy C-means for brain MR images,” Egypt. Inform. J., vol. 21, no. 1, pp. 51–66, Mar. 2020. doi: 10.1016/j.eij.2019.10.005. [Google Scholar] [CrossRef]
20. T. Wei, X. Wang, J. Wu, and S. Zhu, “Interval type-2 possibilistic fuzzy clustering noisy image segmentation algorithm with adaptive spatial constraints and local feature weighting & clustering weighting,” Int. J. Approx. Reason., vol. 157, pp. 1–32, Jun. 2023. doi: 10.1016/j.ijar.2023.02.013. [Google Scholar] [CrossRef]
21. M. C. J. Christ and R. M. S. Parvathi, “Fuzzy c-means algorithm for medical image segmentation,” in Proc. Int. Conf. Electron. Comput. Technol. (ICECT), Kanyakumari, India, 2011, vol. 4, pp. 33–36. [Google Scholar]
22. G. Y. Du, F. Miao, S. L. Tian, and Y. Liu, “A modified fuzzy C-means algorithm in remote sensing image segmentation,” in Proc. Int. Conf. Environ. Sci. Inf. Appl. Technol. (ESIAT), Wuhan, China, 2009, vol. 3, pp. 447–450. [Google Scholar]
23. S. Madhukumar and N. Santhiyakumari, “Evaluation of k-means and fuzzy C-means segmentation on MR images of brain,” Egypt. J. Radiol. Nucl. Med., vol. 46, no. 2, pp. 475–479, 2015. doi: 10.1016/j.ejrnm.2015.02.008. [Google Scholar] [CrossRef]
24. R. Cong, J. Lei, H. Fu, M. M. Cheng, W. Lin and Q. Huang, “Review of visual saliency detection with comprehensive information,” IEEE Trans. Circuits Syst. Video Technol., vol. 29, no. 10, pp. 2941–2959, Mar. 2018. doi: 10.1109/TCSVT.2018.2870832. [Google Scholar] [CrossRef]
25. E. Ardizzone, A. Bruno, and G. Mazzola, “Saliency based image cropping,” in Lecture Notes in Computer Science, 2013, vol. 8156, pp. 773–782, doi: 10.1007/978-3-642-41181-6. [Google Scholar] [CrossRef]
26. S. Le Moan, A. Mansouri, J. Y. Hardeberg, and Y. Voisin, “Saliency for spectral image analysis,” IEEE J. Sel. Top. Appl. Earth Obs. Remote Sens., vol. 6, no. 6, pp. 2472–2479, Dec. 2013. [Google Scholar]
27. X. Wu, C. Sun, L. Chen, T. Zou, W. Yang and H. Xiao, “Adaptive ORB feature detection with a variable extraction radius in RoI for complex illumination scenes,” Robot. Auton. Syst., vol. 157, pp. 104248, Nov. 2022. doi: 10.1016/j.robot.2022.104248. [Google Scholar] [CrossRef]
28. S. Gupta, M. Kumar, and A. Garg, “Improved object recognition results using SIFT and ORB feature detector,” Multimed. Tools Appl., vol. 78, no. 23, pp. 34157–34171, Dec. 2019. doi: 10.1007/s11042-019-08232-6. [Google Scholar] [CrossRef]
29. T. Imsaengsuk and S. Pumrin, “Feature detection and description based on ORB algorithm for FPGA-based image processing,” in Proc. Int. Electr. Eng. Congr., (IEECON), Pattaya, Thailand, Mar. 2021, pp. 420–423. [Google Scholar]
30. K. Shaik et al., “Big data analytics framework using squirrel search optimized gradient boosted decision tree for heart disease diagnosis,” Appl. Sci., vol. 13, no. 9, pp. 5236, Apr. 2023. [Google Scholar]
31. D. Y. Tsai, Y. Lee, M. Sekiya, and M. Ohkubo, “Medical image classification using genetic-algorithm based fuzzy-logic approach,” Electron. Imaging, vol. 13, no. 4, pp. 780–788, Oct. 2004. [Google Scholar]
32. D. Ming, T. Zhou, M. Wang, and T. Tan, “Land cover classification using random forest with genetic algorithm-based parameter optimization,” Appl. Remote Sens., vol. 10, no. 3, pp. 035021, Sep. 2016. [Google Scholar]
33. S. A. Naghibi, K. Ahmadi, and A. Daneshi, “Application of support vector machine, random forest, and genetic algorithm optimized random forest models in groundwater potential mapping,” Water Res. Manag., vol. 31, no. 9, pp. 2761–2775, Jul. 2017. [Google Scholar]
34. J. H. Bappy and A. K. Roy-Chowdhury, “CNN based region proposals for efficient object detection,” in Proc. Int. Conf. Image Process. (ICIP), Arizona, USA, 2016, vol. 2016, pp. 3658–3662. [Google Scholar]
35. A. Shakarami and H. Tarrah, “An efficient image descriptor for image classification and CBIR,” Optik, vol. 214, pp. 164833, Jul. 2020. doi: 10.1016/j.ijleo.2020.164833. [Google Scholar] [PubMed] [CrossRef]
36. J. Wang, X. Zeng, S. Duan, Q. Zhou, and H. Peng, “Image target recognition based on improved convolutional neural network,” Math. Probl. Eng., vol. 2022, pp. 1–11, 2022. doi: 10.1155/2022/2213295. [Google Scholar] [CrossRef]
37. U. A. Khan, A. Javed, and R. Ashraf, “An effective hybrid framework for content based image retrieval (CBIR),” Multimed. Tools Appl., vol. 80, no. 17, pp. 26911–26937, Jul. 2021. doi: 10.1007/s11042-021-10530-x. [Google Scholar] [CrossRef]
38. K. T. Ahmed, S. Ummesafi, and A. Iqbal, “Content based image retrieval using image features information fusion,” Inf. Fusion, vol. 51, pp. 76–99, Nov. 2019. doi: 10.1016/j.inffus.2018.11.004. [Google Scholar] [CrossRef]
39. J. M. Gonfaus, X. Boix, J. van de Weijer, A. D. Bagdanov, J. Serrat and J. Gonzàlez, “Harmonypotentials for joint classification and segmentation’,” in Proc. IEEE Comput. Soc. Conf. Comput. Vis. Pattern Recognit., San Francisco, CA, 2010, pp. 3280–3287. [Google Scholar]
40. A. Ahmed, A. Jalal, and K. Kim, “A novel statistical method for scene classification based on multi-object categorization and logistic regression,” Sens., vol. 20, pp. 3871, Jul. 2020. [Google Scholar]
Cite This Article
 Copyright © 2024 The Author(s). Published by Tech Science Press.
This work is licensed under a Creative Commons Attribution 4.0 International License , which permits unrestricted use, distribution, and reproduction in any medium, provided the original work is properly cited.
 Downloads
 Citation Tools