
 Submit a Paper
 Propose a Special lssue
 Open Access
ARTICLE

Automatic Finding of Brain-Tumour Group Using CNN Segmentation and Moth-Flame-Algorithm, Selected Deep and Handcrafted Features
1 Faculty of Electronic Engineering Technology, University Malaysia Perils (UniMAP), Pauh Putra Campus, Arau, Perlis, 02600, Malaysia
2 Department of Electrical and Communication Engineering, National University of Science and Technology, AL Hail, AL Seeb, 130, Sultanate of Oman
3 Department of Research and Innovation, Saveetha School of Engineering, Saveetha Institute of Medical and Technical Sciences (SIMATS), Chennai, TamiNadu, 602105, India
* Corresponding Authors: Imad Saud Al Naimi. Email: ; Muhammad lmran Ahmad. Email:
(This article belongs to the Special Issue: Deep Learning in Medical Imaging-Disease Segmentation and Classification)
Computers, Materials & Continua 2024, 79(2), 2585-2608. https://doi.org/10.32604/cmc.2024.046461
Received 02 December 2023; Accepted 08 March 2024; Issue published 15 May 2024
 View Full Text
 Download PDF
Abstract
Augmentation of abnormal cells in the brain causes brain tumor (BT), and early screening and treatment will reduce its harshness in patients. BT’s clinical level screening is usually performed with Magnetic Resonance Imaging (MRI) due to its multi-modality nature. The overall aims of the study is to introduce, test and verify an advanced image processing technique with algorithms to automatically extract tumour sections from brain MRI scans, facilitating improved accuracy. The research intends to devise a reliable framework for detecting the BT region in the two-dimensional (2D) MRI slice, and identifying its class with improved accuracy. The methodology for the devised framework comprises the phases of: (i) Collection and resizing of images, (ii) Implementation and Segmentation of Convolutional Neural Network (CNN), (iii) Deep feature extraction, (iv) Handcrafted feature extraction, (v) Moth-Flame-Algorithm (MFA) supported feature reduction, and (vi) Performance evaluation. This study utilized clinical-grade brain MRI of BRATS and TCIA datasets for the investigation. This framework segments detected the glioma (low/high grade) and glioblastoma class BT. This work helped to get a segmentation accuracy of over 98% with VGG-UNet and a classification accuracy of over 98% with the VGG16 scheme. This study has confirmed that the implemented framework is very efficient in detecting the BT in MRI slices with/without the skull section.Keywords
The Central Nervous System (CNS) is a principal part of human physiology and infection/disease in the CNS is a medical emergency. The growth of atypical cells in the brain section is the prime cause of the brain tumor (BT). In 2021, the World Health Organisation (WHO) put forth a report in which guidelines were provided to categorize BT based on its cell origin and harshness [1]. As per this report, the BT is grouped into four grades, Grades I to IV, in which the severity of Grade IV class BT is the highest compared to the lowest grades [2].
The report of the Global Cancer Observatory (GCO) in the year 2020 confirmed that CNS-associated cancer infected 308,102 individuals globally and was the reason for 251,329 reported deaths [3]. Furthermore, a recent report confirms that BT/ CNS cancer holds the 10th rank in causes of death in the United States [4]. Additionally, this report also verified that in the year 2021, there was a reported death of 18,600 adults (10,500 men and 8,100 women) due to BT/CNS cancer.
Due to its significance, several screening protocols were developed and implemented in medical clinics to detect BT, and a medical imaging-supported imaging scheme was one of the commonly recommended procedures. The earlier works confirmed that BT can be efficiently diagnosed using magnetic resonance imaging (MRI). MRI is a radiological imaging procedure that helps to provide complete information about the brain using a reconstructed three-dimensional (3D) image, which permits examination in 2D form. Further, the MRI supports multiple radiological techniques, such as Flair, T1, T1C, and T2, and based on the recommendations by a doctor, the BT in a patient can be screened with chosen MRI modalities. After recording the brain section, the clinical-level examination uses the digital MRI images with a desired plane, namely axial, coronal, and sagittal.
Prior studies in the literature confirm that a 2D MRI slice of the axial plane is widely considered during a BT detection task. Several computerized algorithms are developed and implemented to support the segmentation and grading of BT [5–7]. The Prior studies confirm that integrating segmentation and classification enables superior screening than alternative methods [8,9]. Furthermore, the automatic examination of BT with Convolutional Neural Network (CNN) facilitates a superior result over machine-learning methods (MLM). Hence, the researchers have developed many CNN-supported BT detection procedures [10–15].
This objective of this work is to implement a CNN-supported segmentation and classification framework for detecting the BT in the Flair/T2 modality MRI slice. The multiple stages of this implementation include (i) Image collection, (ii) 3D to 2D conversion and resizing, (iii) CNN segmentation, (iv) Deep-feature mining, (v) Handcrafted Feature (HF) mining, (vi) Feature reduction using Moth-Flame-Algorithm and (vii) Assessment of performance and validation. In this work, the HF, such as Gray-Level Co-Occurrence Matrix (GLCM) and Discrete Wavelet Transform (DWT) were considered to improve the BT detection accuracy.
To establish the clinical significance of the proposed scheme, a clinical-grade brain MRI was collected from (i) the Multimodal Brain Tumour Image Segmentation (BRATS2015) database (Low/High-grade Glioma) and (ii) The Cancer Imaging Archive (TCIA) database (Glioma/Glioblastoma). In BRATS, the 2D MRI slices are accessible with the exclusion of the skull section, and in TCIA, the MRI slices are associated with the skull. Consequently, the experimental analysis was carried out separately for the BRATS and TCIA datasets, and the results are presented.
This work used the VGG-UNet scheme to segment and classify the BT from the dataset. During the segmentation task, the pre-trained VGG-UNet scheme was trained using the test images from the BRATS database and the corresponding ground-truth (GT) images. Later, the segmentation performance of pre-trained VGG-UNet was validated using the TCIA database. Finally, the classification performance of the VGG16 scheme was verified on the BRATS/TCIA dataset using a binary classification scheme with a 5-fold cross-validation. In this work, the performance of the classifiers, such as SoftMax, Decision Tree (DT), Random Forest (RF), Naive Bayes (NB), K-Nearest Neighbours (KNN), and Support-Vector-Machine (SVM) are presented. The experimental findings of this study confirm that VGG-UNet led to a segmentation accuracy of >98% on both datasets. For BRATS, the VGG16 and the KNN aided to achieving a classification accuracy of over 98%, and for TCIA, the VGG16 with DT classifier provided >98% accuracy. These results confirmed the clinical significance of the proposed scheme.
The major outcomes of the proposed work are:
i) Implementation of VGG-UNet supported simultaneous joint segmentation and classification of BT.
ii) Moth-Flame-Algorithm based feature selection to optimise result.
iii) Testing and validation of the brain MRI of with/without a skull section to substantiate clinical significance.
Another section of this research is structured as: Sections 2 and 3 which present the literature review and methodology. Sections 4 and 5 demonstrate the investigational outcomes and conclusion, respectively.
The incidence rate of BT is gradually rising in all countries; therefore, efficient screening and treatment procedures are necessary to reduce death rates. Due to its importance, a multitude of computerised BT detection techniques are proposed and implemented to support (i) Segmentation and (ii) Classification of the BT in 2D MRI slices of chosen modality [16]. The implementation of MLM and CNN procedures are widely found in literatures to efficiently detect the group of BT for appropriate decision making and treatment [17–19]. The CNN-supported schemes confirmed its superiority over other existing conventional and MLM techniques for the segmentation and classification of the BT in brain MRI.
Table 1 summarises the chosen CNN scheme supported segmentation and classifications found in earlier works along with the obtained performance metrics.

Along with the above discussed methods, a number of review works also exist in the literature to examine the BT in BRATS, TCIA and clinical datasets [34–39]. A recent survey by Biratu et al. [40] demonstrated the review on BT detection methods [41–44]. Moreover, a number of recent BT segmentation confirmed the need for the CNN-segmentation schemes to achieve better results [45,46]. The experimental outcome of these works confirms that the CNN-supported scheme provides improved BT detection compared to the machine-learning procedures.
Table 1 results confirm that the recent works of [33] provided a better result compared to other works in the literature. This work implemented a joint segmentation and classification, and based on this motivation, this research also implemented a segmentation + classification task. To achieve a better result during the BT segmentation and classification, a VGG-UNet supported procedure was executed. To verify the clinical significance of the proposed technique, the datasets, such as BRATS and TCIA were considered.
The performance and reliability of an automatic disease screening system depends mainly on the methodology which is employed to examine the medical images. In this work, the VGG-UNet scheme was used to segment and classify the BT from the Flair (BRATS) and T2 (TCIA) images. The merit of the proposed scheme was separately evaluated for segmentation and classification tasks, and obtained results are presented.
The developed BT screening framework is depicted in Fig. 1.
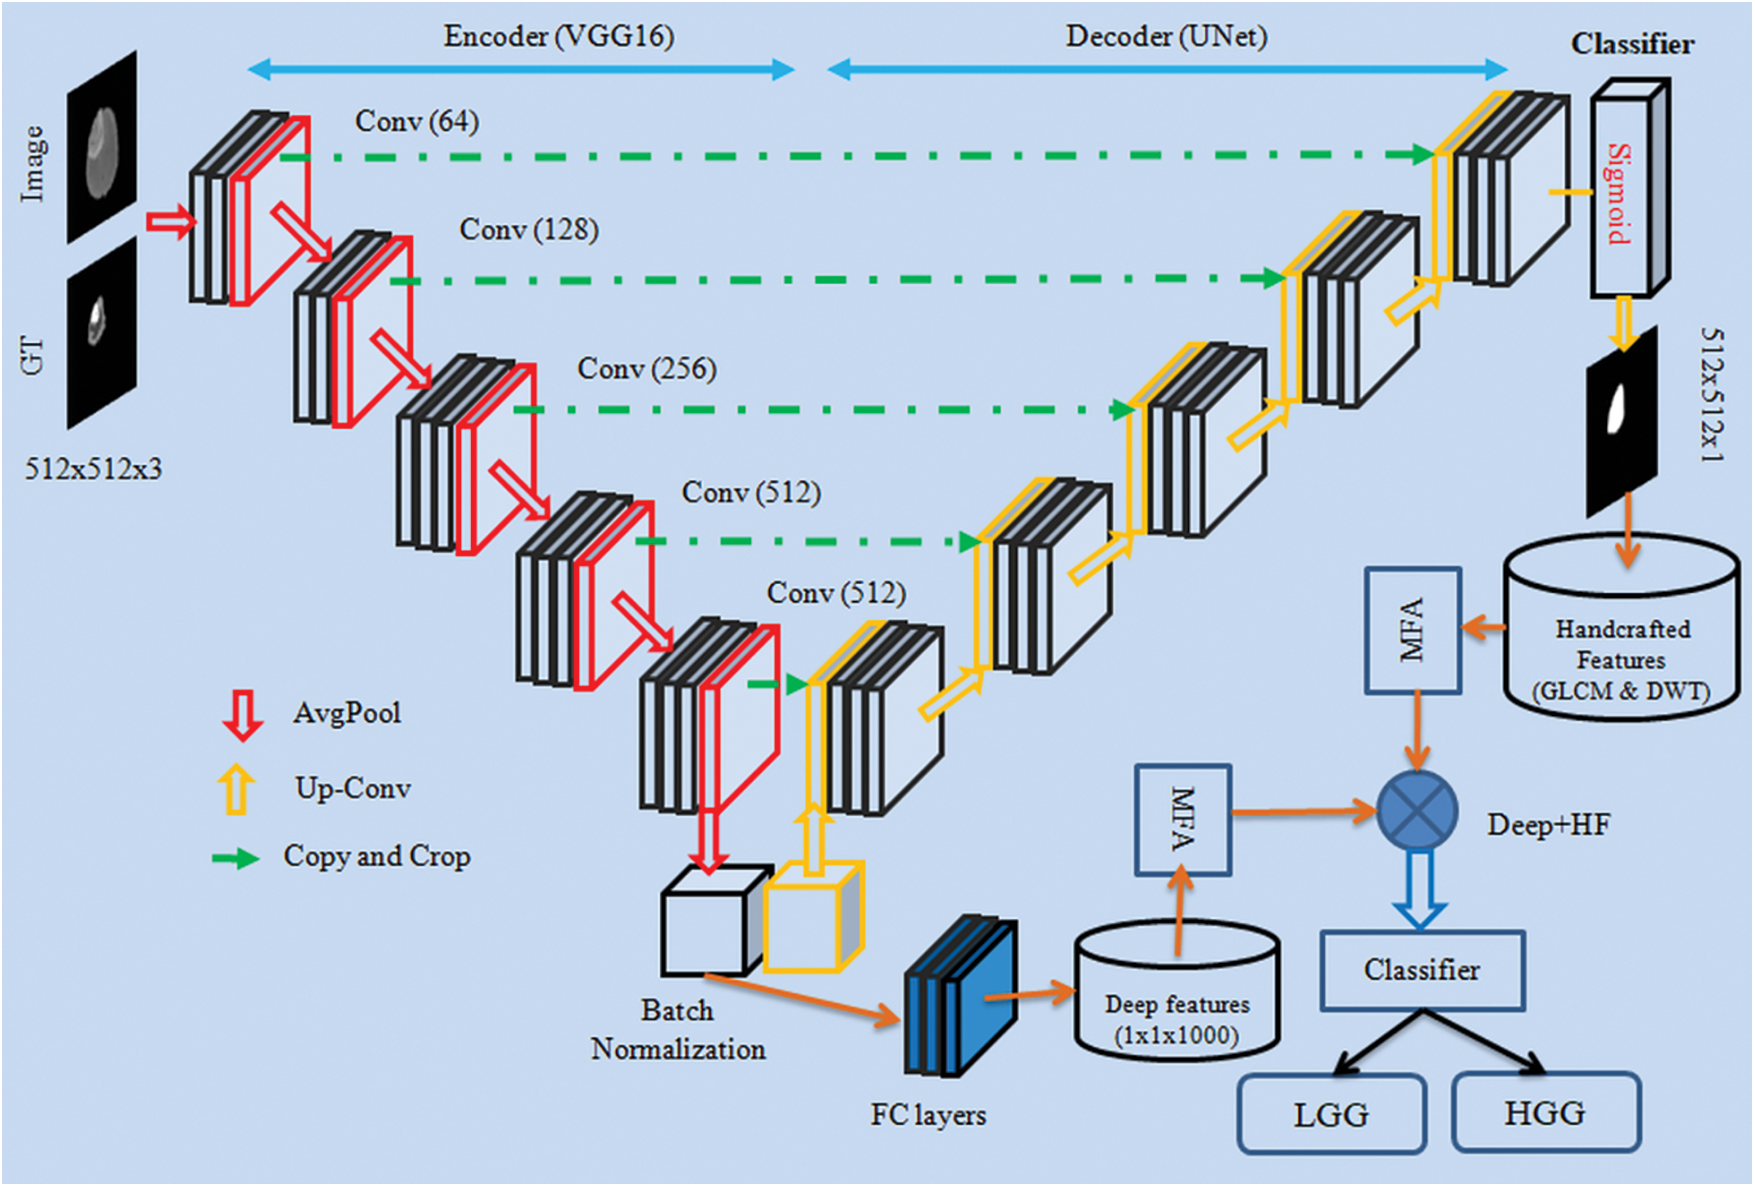
Figure 1: CNN framework for segmentation and evaluation of BT from 2D MRI slices
This research considered the MRI images of the BRATS2015 [47,48] and TCIA [49–51]. BRATS2015 database consists of 274 patient’s 3D images in which 220 images belong to High-Grade-Glioma (HGG) and 54 images belong to Low-Grade-Glioma (LGG), and 80 other patients’ (40 HGG and 40 LGG) images were also used for the investigation. Furthermore, from the TCIA dataset, 35 LGG [50] and 35 Glioblastoma (GBM) [51] images were also considered for the examination. The initial pixel dimension of the BRATS database is around
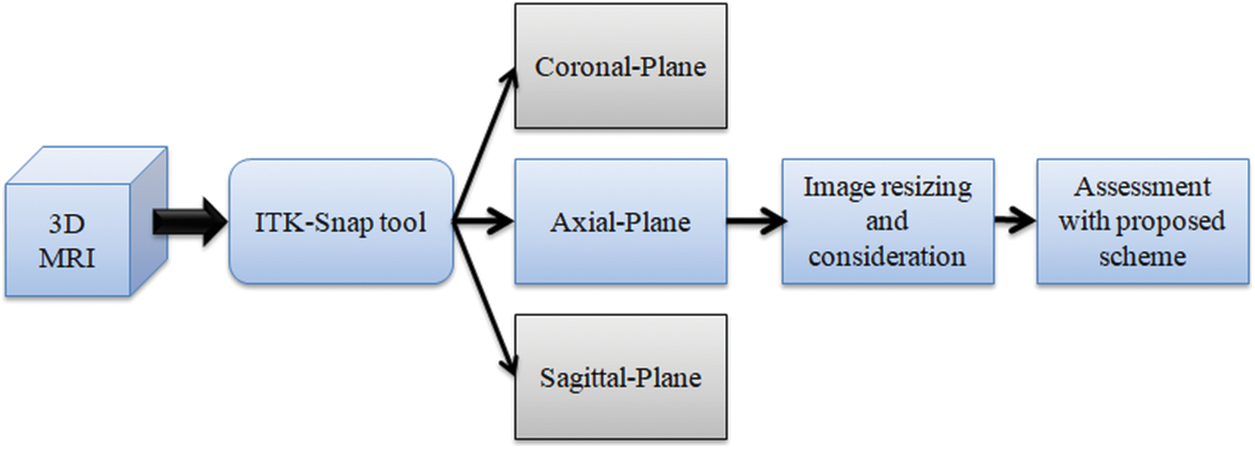
Figure 2: Extraction of 2D slices from 3D MRI with ITK-Snap
For the experimental evaluation, 4000 numbers of 2D slices (2000 LGG and 2000 HGG images) were considered for the BRATS2015 and 4000 numbers of 2D slices (2000 LGG and 2000 GBM images) were considered from TCIA. Among these images, 70% were considered to train the classifier, 20% to test the classifier and 10% to validate the classifier performance using a 5-fold cross validation. The sample test images of both these databases are depicted in Fig. 3 and Fig. S1 shows sample test images of various MRI modalities collected from BRATS2015.
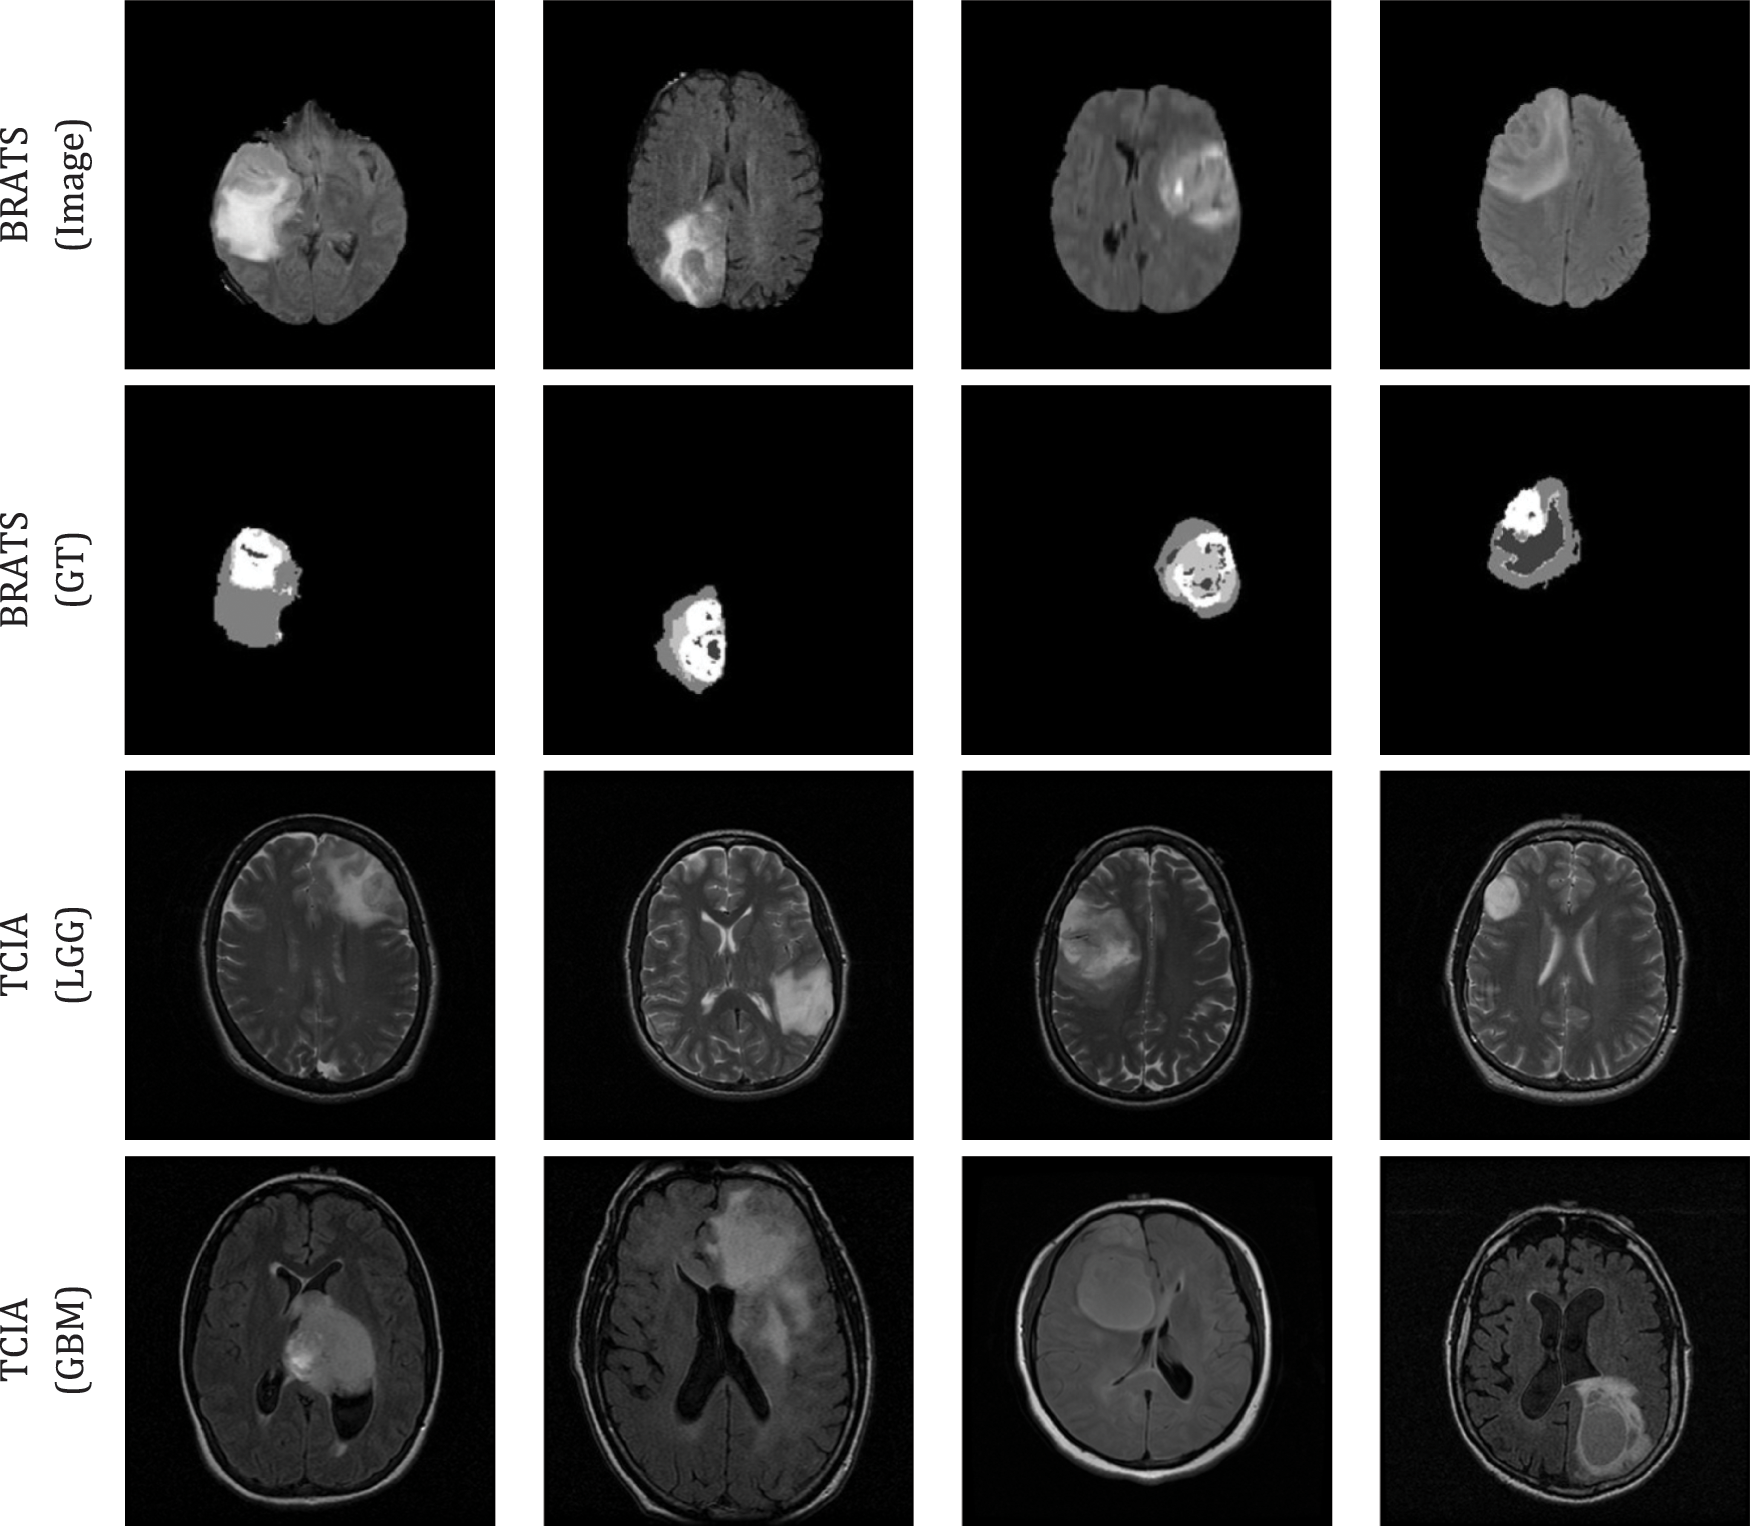
Figure 3: Sample test images considered in this research
The scheme of VGG-UNet is depicted in Fig. 1, in which the traditional VGG16 will act as the encoder unit and the modifier VGG16, which works like a UNet, will be the decoder. To support the essential feature extraction and segmentation process, every picture was resized to
In this work, pre-trained VGG-UNet was considered initially to segment the BT region from the test image. Then the deep-features obtained from the encoder unit (VGG16) were used to classify the images using the chosen binary classifiers. In this work, the initial parameters for the VGG-UNet were assigned as follows: Initial weights = ImageNet, epochs = 50 numbers, optimizer = Adam, pooling = average, number of convolutional layers = five groups for down/up convolution, hidden-layer-activation = Relu, classifier-activation = Sigmoid, evaluation metrics = dice and accuracy, training images = 70%, testing images = 20%, initial validation = 10% and final validation = 100% (i.e., BT in every image is extracted and stored for assessment).
During this implementation, the encoder unit (VGG16) helped to get the deep-feature and after passing it through the three numbers of fully connected layer (with 50% drop-out rate)
3.4 Handcrafted Feature Extraction
Earlier works in the literature confirm that the integration of deep and Handcrafted-Features (HF) helped to achieve improved results during the medical image examination. In this work, the HF, such as GLCM and DWT were extracted from the segmented binary section of the BT. The complete information about the GLCM [56–59] and DWT [60–62] can be found in the literatures. The GLCM approach is a well-known procedure in medical image analysis and this feature helped to get information about the area and texture of the BT. During the DWT feature evaluation, the test pictures were divided into four sections, such as approximate-(LL), vertical-(LH), horizontal-(HL) and diagonal-coefficients (HH) from every image, and essential features were mined as discussed in Mirniaharikandehei et al. [63].
Fig. 4 presents the DWT features obtained for a chosen MRI slice, which has the BT section. The essential information about the GLCM features (
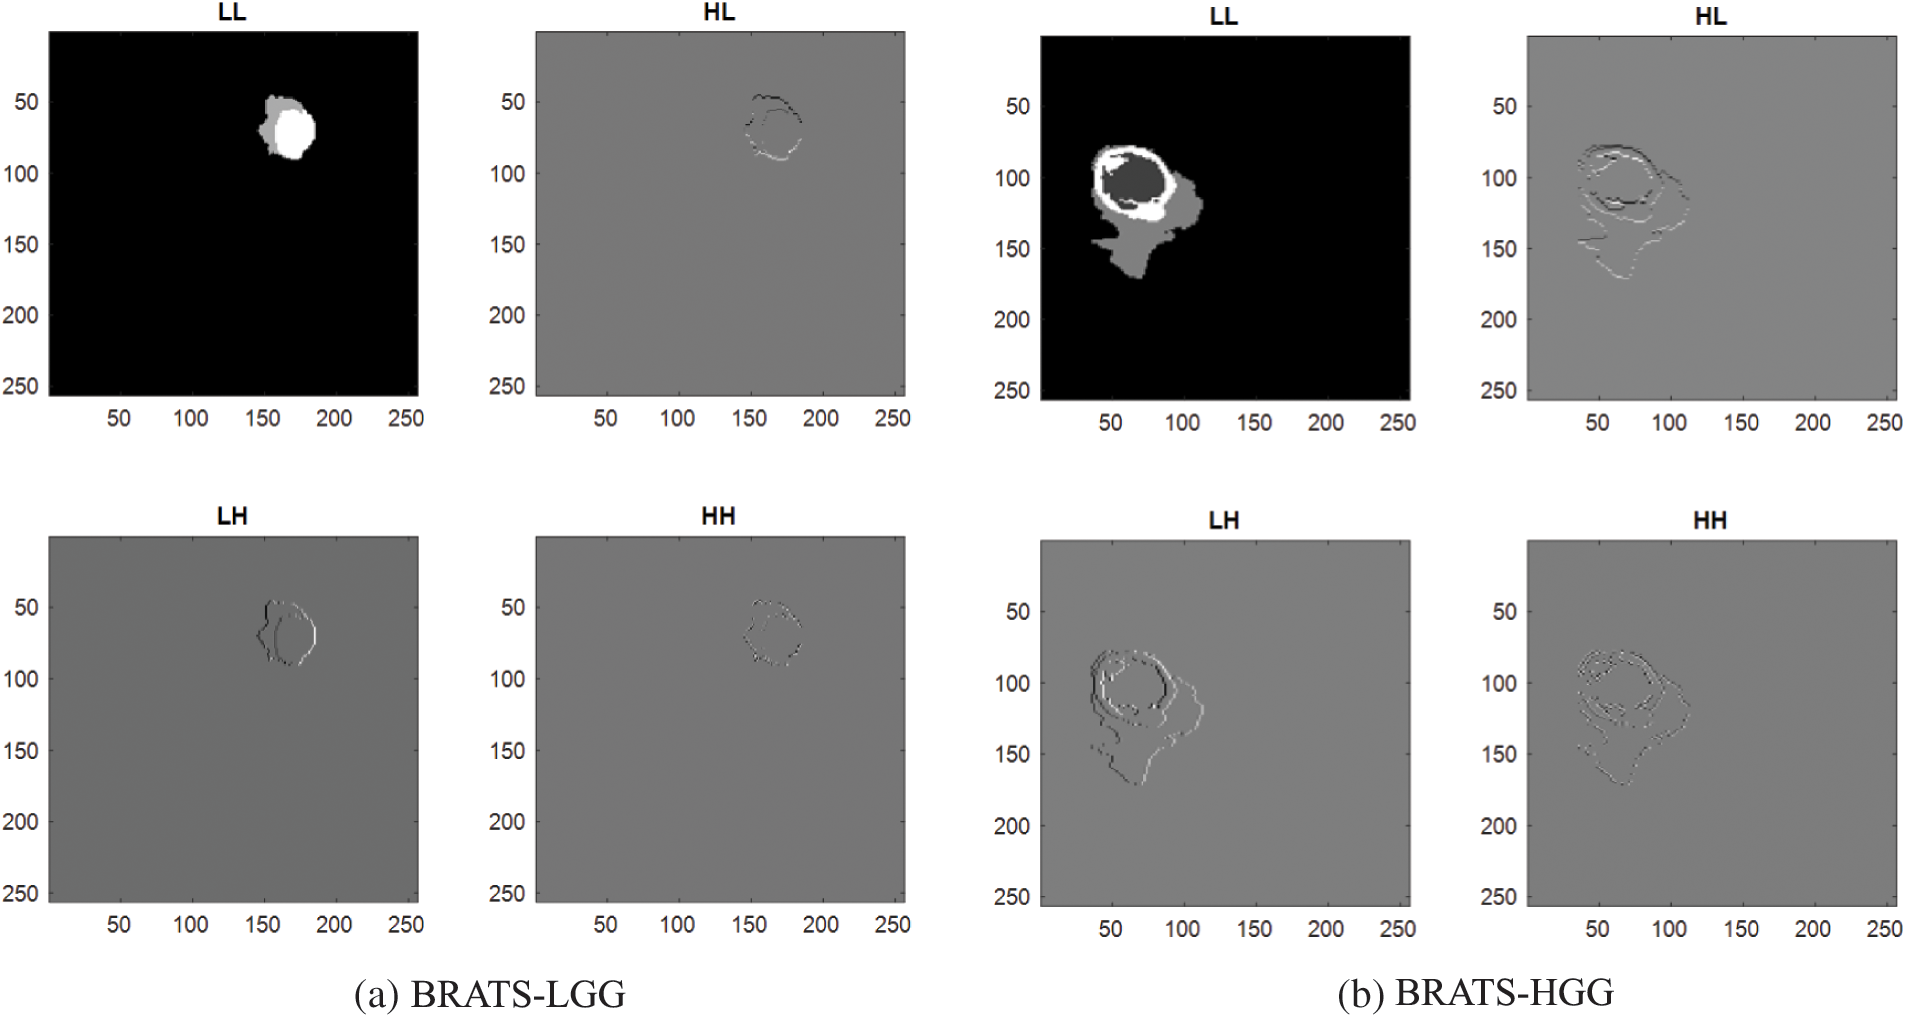
Figure 4: Sample DWT images achieved using LGG/HGG images of BRATS
The deep and HF features considered is presented in Eqs. (1) to (7).
These features were then optimized with the Moth-Flame-Algorithm (MFA) and selected features were then combined to verify the BT detection performance of the classifiers.
3.5 Feature Selection and Serial Concatenation
Feature reduction is an adequate practice in a class of machine learning [67,68] and deep learning [69,70] tasks. In this research the reduction of deep and HF were executed with MFA. The MFA is a nature inspired technique invented by Mirjalili in 2015 to find optimal solutions for a range of constrained/unconstrained problems [71,72]. The idea of MFA is related to the association of a Moth towards a Flame based on a pre-defined outline (spiral). In MFA, the moths are the investigating agents and the flame is the resolution for the task. If the search begins with assigned agents (moths), then each agent is permitted to achieve their associated flame (solution) by spiral search as depicted in Fig. 5. The essential information about the MFA can be found in [72–75].
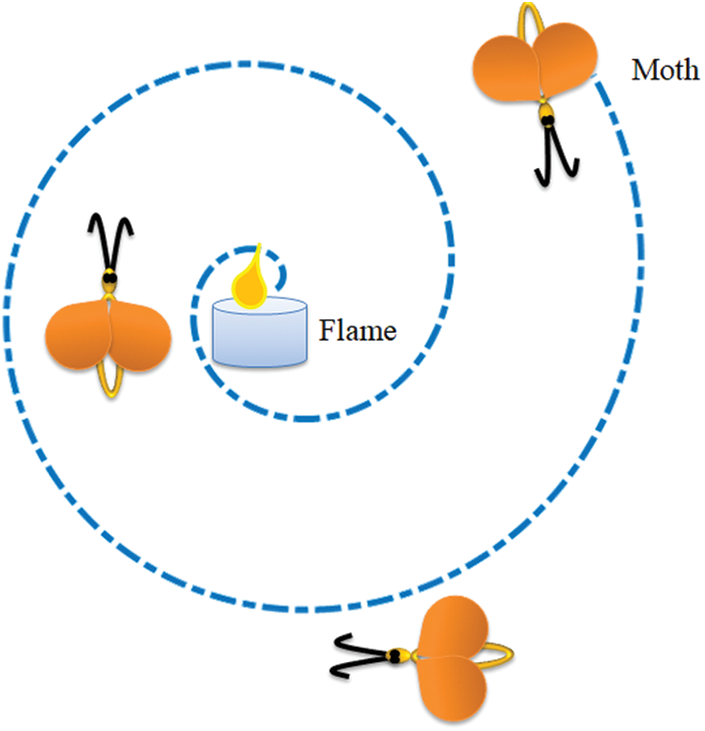
Figure 5: Search pattern of a moth towards a flame
To define MFA mathematically, a search space with a-number of moths (M) and b-number of flames (F) were chosen. The preliminary space between M and F are to be minimized; as
The expression for M which progress towards F can be defined as in Eq. (8):
where
Fig. 6 depicts the procedure followed in MFA feature selection. Fig. 7 depicts a sample feature reduction process for LGG/HGG features. Considering the fact that there exists

Figure 6: Flow chart of MFA based feature selection
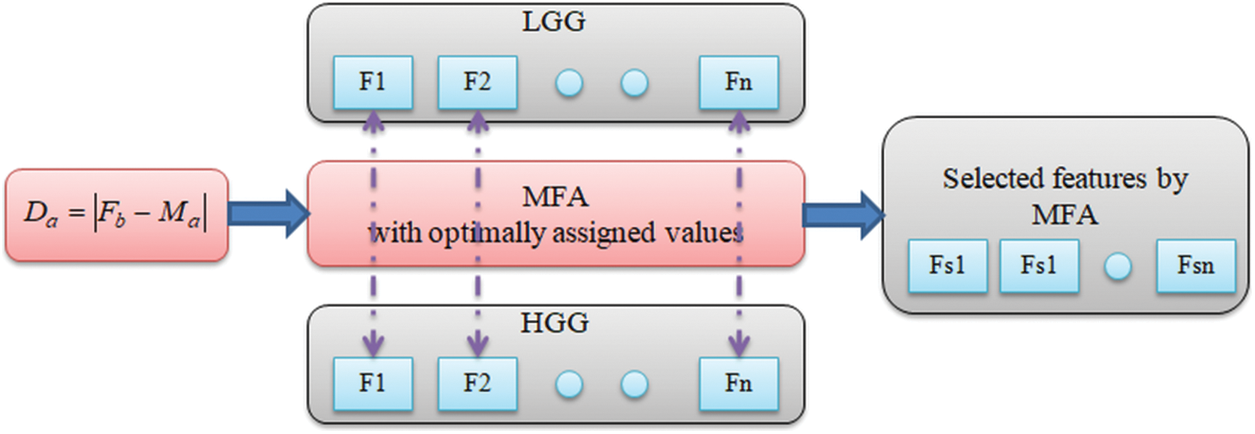
Figure 7: Feature selection with MFA
For the LGG/HGG images of BRATS, the selected features are depicted in Eqs. (9) and (10) and the serially integrated feature is shown in Eq. (11).
For the LGG/GBM of TCIA, Eqs. (12) to (14) present the attained results.
The features presented in Eqs. (11) and (14) are then considered to verify the performance of chosen binary classifiers.
3.6 Performance Evaluation and Validation
The merit of the proposed BT detection system relies on the classifiers employed to classify the MRI slices based on MFA optimized features. In this research, the well-known classifiers, such as SoftMax, DT, RF, NB, KNN and SVM with the linear kernel were considered [76,77] and the obtained results were compared to recognize the best classifier for the chosen task.
The commonly considered segmentation/classification metrics to appraise the performance are presented in Eqs. (15) to (21) [78,79].
where
The proposed scheme was executed using Python® software with a workstation of Inteli5 processor with 20 GB RAM and 2 GB VRAM. The developed CNN framework individually implements the VGG-UNet segmentation and classification to identify the BT with enhanced accuracy.
Initially, the BT region extraction from the chosen MRI slices was performed with the pre-trained VGG-UNet and the extracted BT region was then considered to extract the HF, such as GLCM and DWT. The ultimate aim of the work was to implement both the segmentation and classification task on the BRATS2015 and TCIA datasets.
Fig. 8 presents the results obtained with VGG-UNet for BRATS2015. Fig. 8a shows the training results, and Fig. 8b presents the convergence of accuracy and loss function during the training and validation process. Fig. 8c depicts the test image; GT and the extracted BT by the VGG-UNet and this outcome confirms that the VGG-UNet helped to get a better outcome on the chosen brain MRI slices. Fig. 9 presents sample results obtained for BRATS2015 and later comparison between the GT and segmented BT was performed and the necessary performance measure was computed. The sample and average performance metric are presented in Table 2, which confirmed that the VGG-UNet helped to get a better value of Jaccard, Dice and segmentation accuracy (>98%) on the BRATS2015 database. A similar procedure was implemented on the TCIA database and the extracted BT section was considered to mine the HF, like GLCM and DWT.

Figure 8: Results obtained with VGG-UNet

Figure 9: Sample segmentation results achieved with VGG-UNet

After validating the segmentation of VGG-UNet, its classification merit was then confirmed with deep-feature and deep + HF for the images of BRATS and TCIA. Initially, the BRATS database was considered and the performance of VGG16 was verified for LGG/HGG detection with different classifiers. A similar procedure was repeated with TCIA images and the results for LGG/GBM detection were then recorded. The different convolutional-layer (CL) outcomes (Conv1 to Conv5) attained for a sample GBM class picture with the VGG16 scheme is depicted in Fig. 10. In this task, the CL helped to extract the necessary information from the test picture and later, the result of one CL was passed to the successive section using average-pooling. This process continued until the outcome was reached in the form of features. The necessary features were extracted with a fully-connected-layer (FCL), a final section in the VGG16 unit. Fig. 9 presents the outcome of this experiment depicted as a Viridis-colour-map. Fig. 10a shows the sample test image of TCIA and Figs. 10b to 10f depict the outcome of the various CV of the VGG16. These results confirm that the VGG16 was efficient in learning and extracting the necessary features with better efficiency.
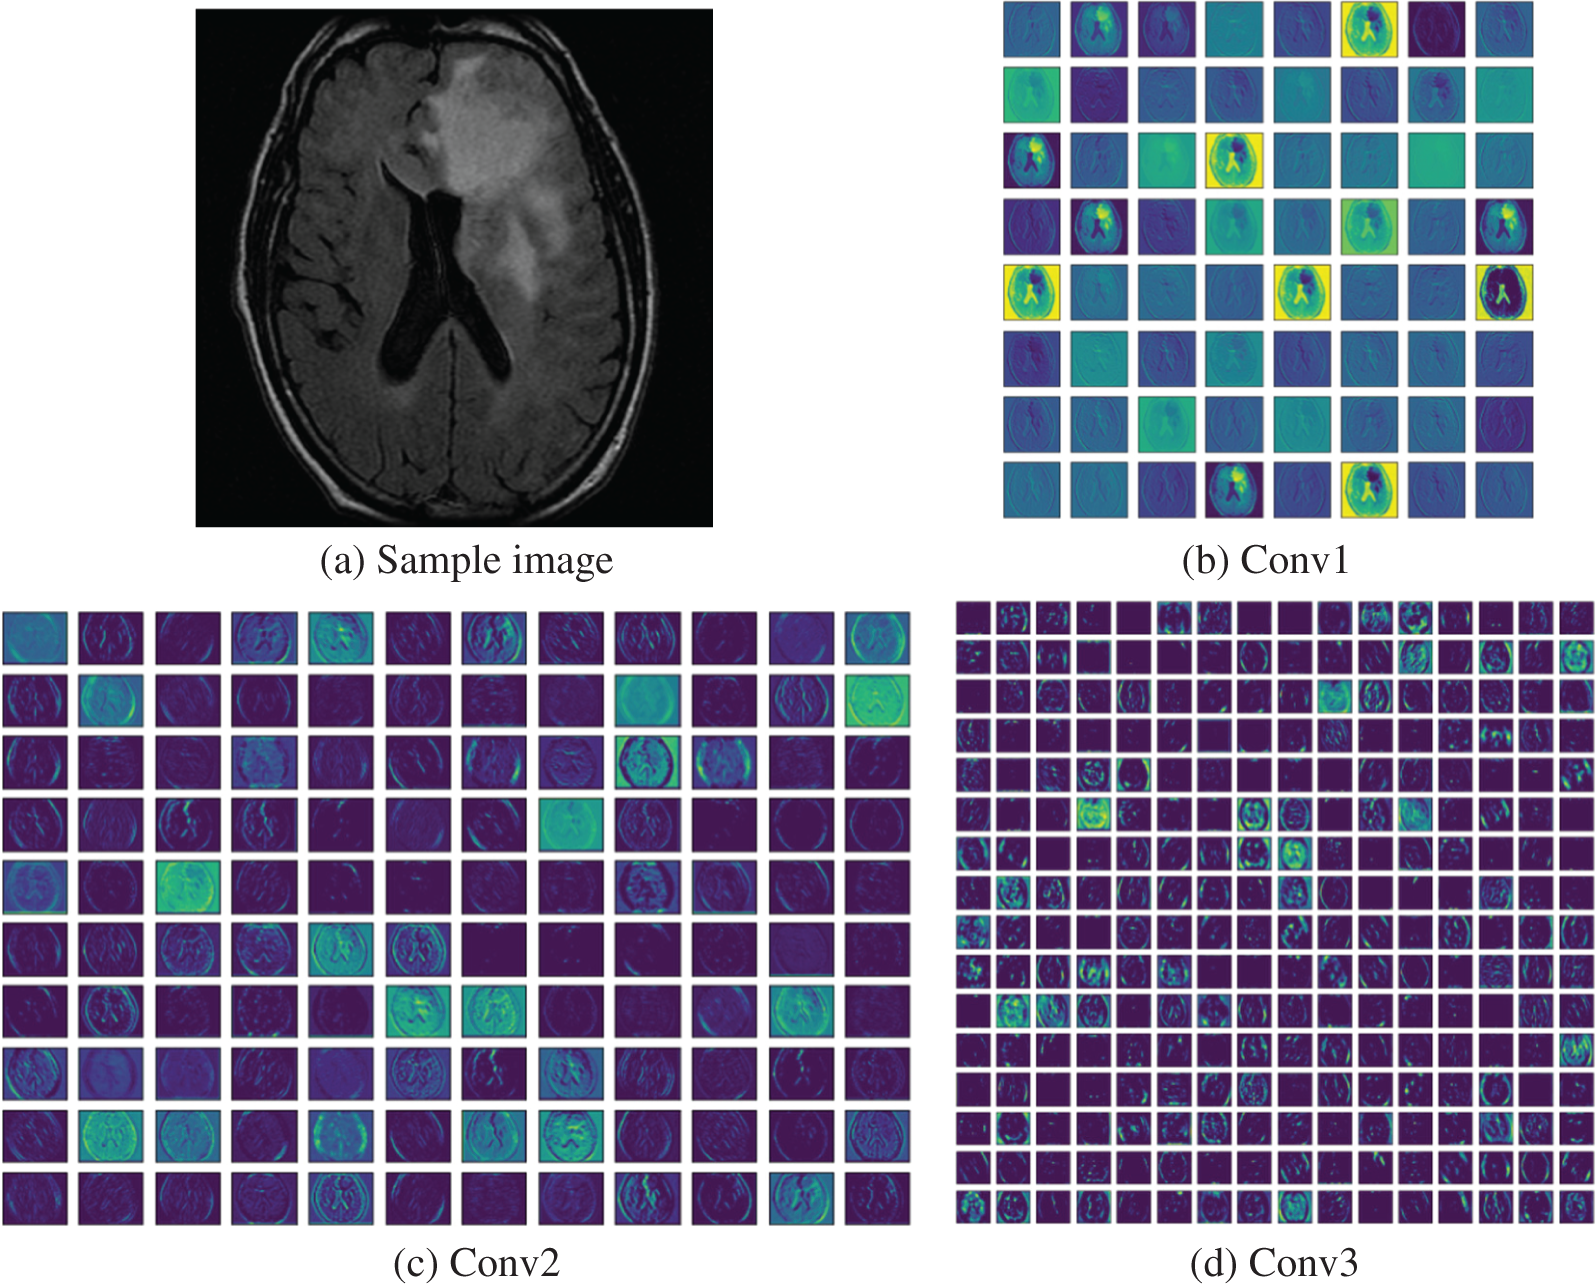
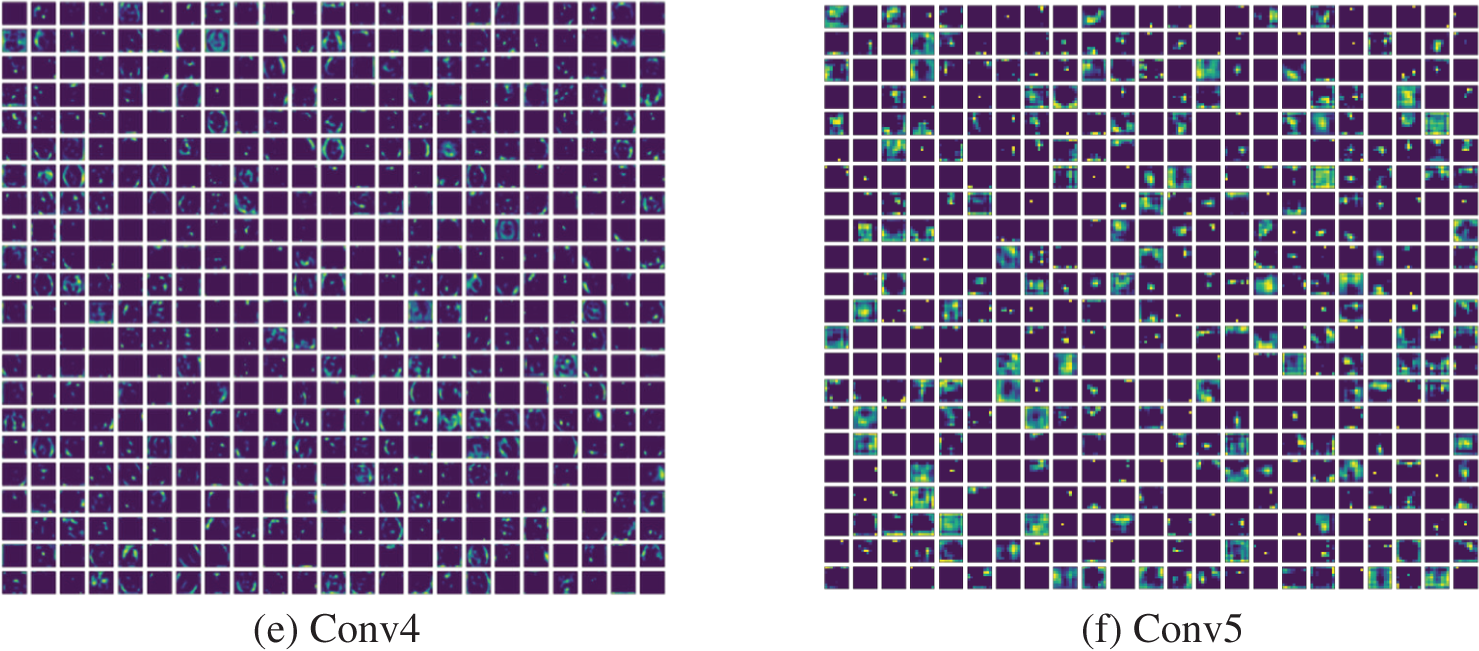
Figure 10: Different convolutional layer results by VGG16 obtained for a test image
After collecting the necessary results from the CL, the other essential metrics, such as Accuracy vs. Epoch, Loss vs. Epoch, Confusion-Matrix (CM) and Receiver-Operating-Characteristic (RoC) curve were recorded for further appraisal. Fig. 11 presents the results achieved for the BRATS database with deep + HF and KNN classifier. Figs. 11a and 11b show the accuracy and loss function achieved with this study. The accuracy confirmed that the proposed scheme helped to reach ≈99% accuracy when the epochs reach towards 100. Fig. 11c presents the CM with TP = 198, TN = 198, FP = 2 and FN = 2. The accuracy computed for these values was around 99%, which was the best result achieved in the study. Fig. 11d depicts that the RoC achieved is 0.9804 with a p-value of <0.001, which confirmed the merit of the study presented.

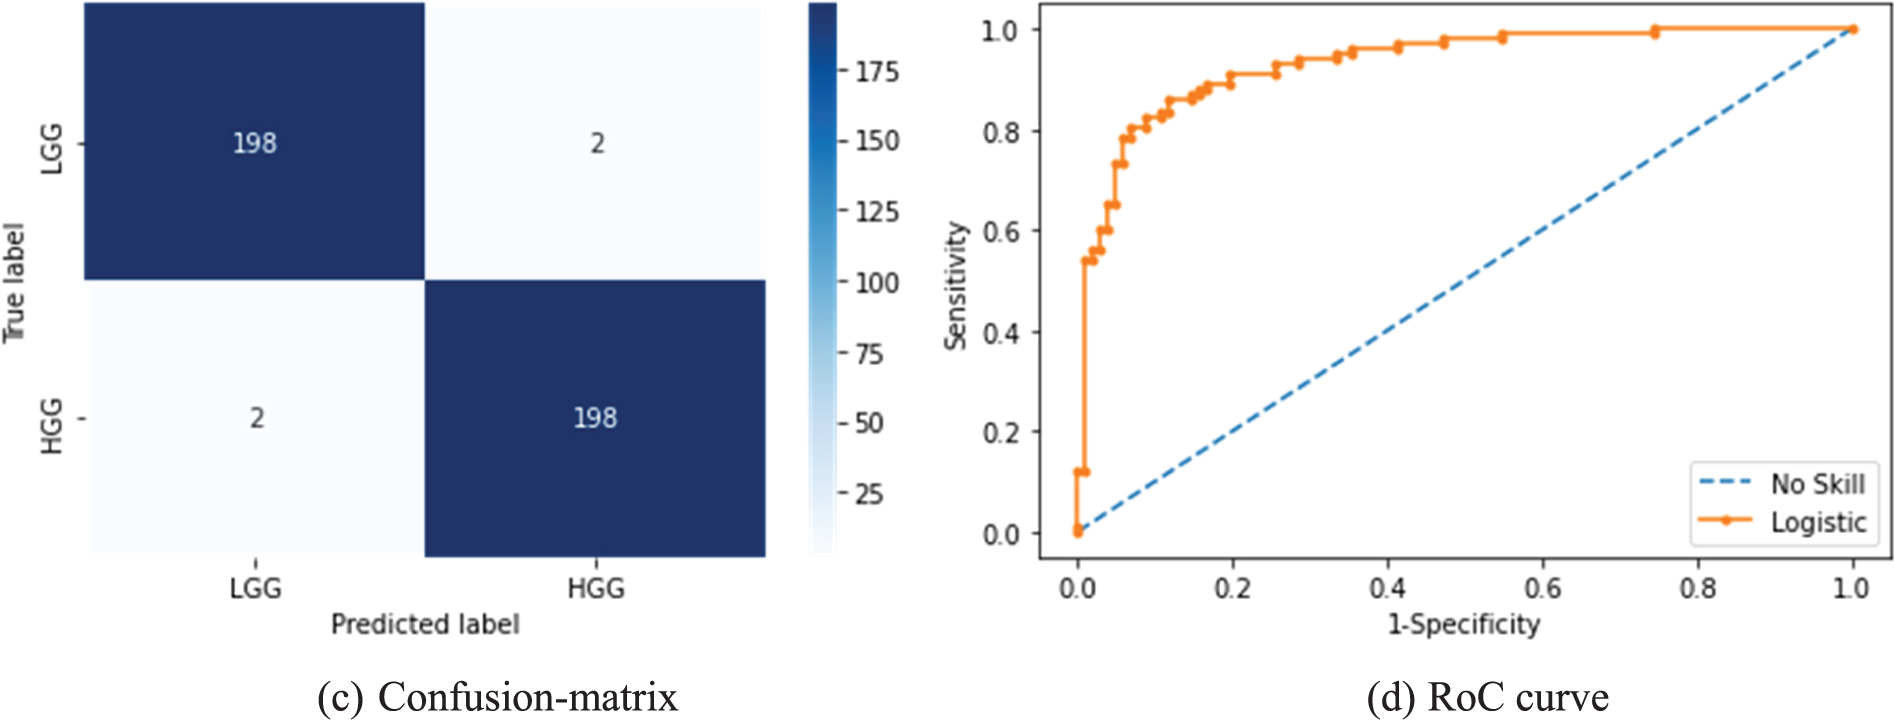
Figure 11: Results achieved from BRATS with MFA optimized deep + HF and KNN classifier
The quantitative results achieved in this study for various features are depicted in Table 3. In this table, separate outcomes for BRATS and TCIA are presented with deep-features and deep + HF. The binary classifiers, such as SoftMax, DT, RF, NB, KNN and SVM were considered and the outcome achieved for a 5-fold cross validation was recorded for the discussion.

The initial section of this table demonstrates the metrics achieved for the BRATS database in which the SVM classifier helped to achieve an accuracy of 95.75% for the deep-features, and the KNN classifier helped to provide an accuracy of 99% for deep + HF. Similarly, the TCIA database assessment helped to get a 96% accuracy with deep-features and KNN classifier, and 98.25% accuracy with SVM when executed using deep + HF. To demonstrate the overall performance of the classifiers with different features, a Glyph-plot was generated and the constructed images are shown in Fig. 12.
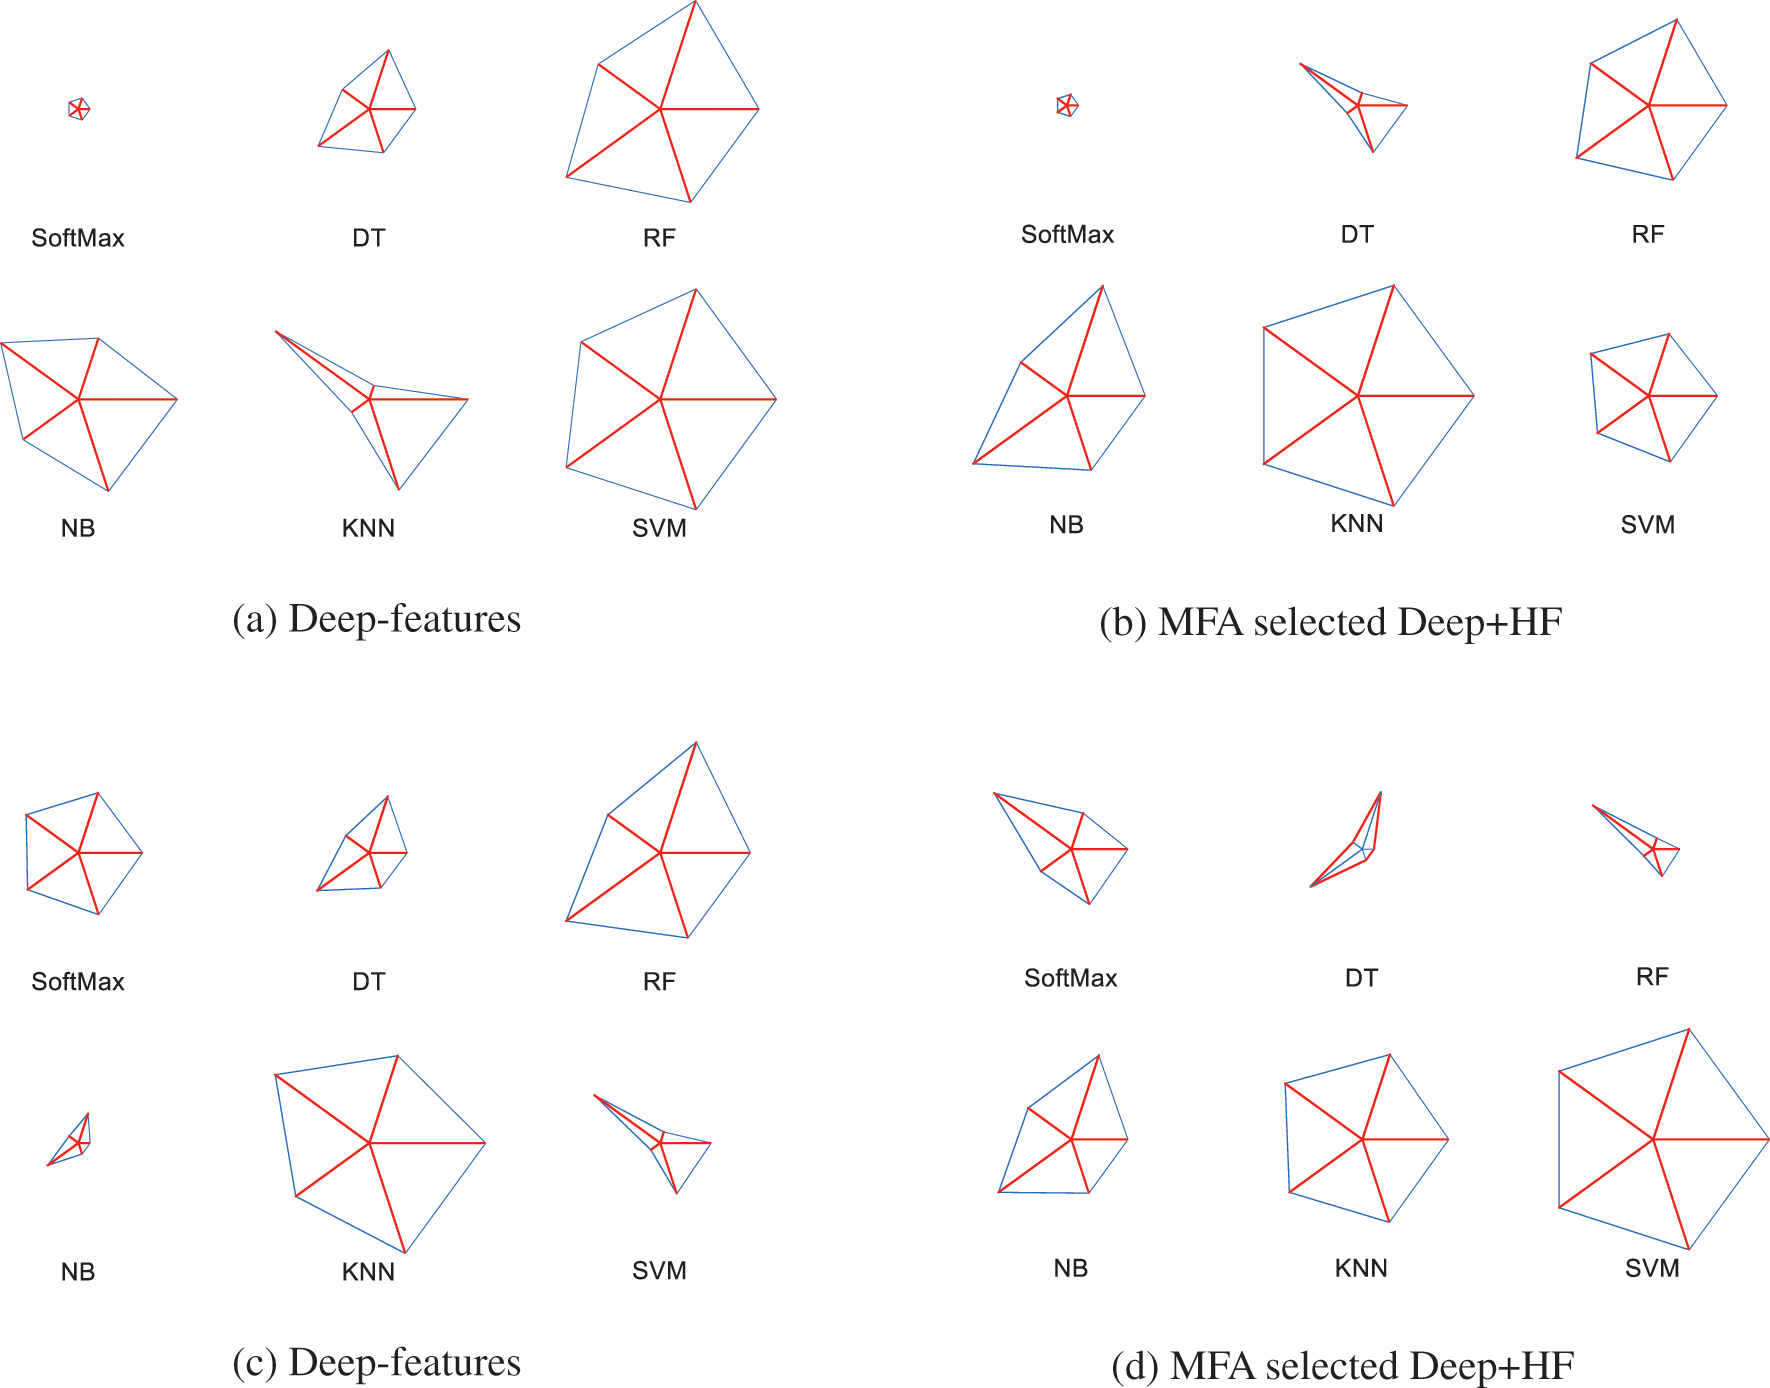
Figure 12: Glyph-plot to compare the metrics presented in Table 3
Figs. 12a and 12b demonstrate the Glyph-Plot for the BRATS images in which the pattern which covers more area is to be considered as superior. Fig. 11a confirms that the overall result by SVM is better and Fig. 12b ensures that the KNN provides a better performance compared to other classifiers. Similarly, other images demonstrate the outcome of TCIA, and this confirmed that in Fig. 12c, the result of KNN is superior and in Fig. 12d, the outcome of SVM is superior. Fig. 13 demonstrates the Spider-plot to further verify the merit of KNN and SVM on the chosen images. All these comparisons confirm that the KNN helped to provide a better BT detection for BRATS2015 compared to other methods considered in this study.

Figure 13: Spider-plot for the best results achieved in Table 2
In order to verify the performance of the proposed framework, the final result was compared against the existing results in the literature, and the presented analysis is depicted in Fig. 14. This image was constructed using the accuracy demonstrated in Table 1, and in this image, it can be noted that the maximum accuracy achieved during the BT classification is 99%. The earlier work of Sharif et al. [26] presented a similar accuracy with PSO based thresholding and CNN classification. The work presents a similar accuracy with VGG-UNet segmentation and classification. Compared to VGG-UNet of Rajinikanth et al. [30], the techniques used in this study provided better accuracy. The recent research works by Sahoo et al. [32–34] presented an improved detection result, which is superior compared to other methods presented in Table 1, and the results by the proposed technique. When compared to the works of Sahoo et al., the proposed scheme provided a closer accuracy on the BRATS image dataset. This result confirmed that the proposed scheme can be considered to examine the brain MRI slices with/without a skull section. In the future, this scheme can be considered to evaluate the BT in clinically collected MRI images of varied modalities.

Figure 14: Comparison of classification accuracy in the proposed and other methods in the literature
The limitations in the proposed work are the integration of the segmentation and classification, which is quite time consuming during the training and validation process. In the future, it can be avoided by considering the pre-processed MRI slices in which the tumour section is more visible compared to the raw image.
The future scope of the proposed scheme includes implementing the integrated BT examination scheme to achieve classification accuracy towards 100%. Furthermore, it includes implementing the proposed scheme to verify the performance on clinical data.
This research work proposes a BT examination technique using CNN segmentation and classification. This work considered the VGG-UNet scheme with VGG16 as the backbone for the encoder-decoder system. The work separately implemented the segmentation and classification task. The performance of the proposed system was verified on BRATS (Flair modality) and TCIA (T2 modality) datasets. The BRATS was considered for LGG/HGG detection and the TCIA was chosen for LGG/GBM recognition. The results achieved in this study confirmed that the proposed VGG-UNet helped to get a segmentation accuracy of >98% and a classification accuracy of ≈99% for the BRATS database. These results are closer to the state of the art results found in the literature. Further, this tool helped to achieve classification accuracy of 98.25% for TCIA with MFA selected deep + HF. These results confirmed that the proposed CNN scheme was efficient in examining the BT in brain MRI slices with/without the skull section. In the future, this scheme can be considered to examine the BT from the actual clinical images collected from hospitals.
Acknowledgement: None.
Funding Statement: This research received no external funding.
Author Contributions: The contribution to the paper is confirmed by the authors as follows: Study conception and design: Imad Saud Al Naimi, Syed Alwee Aljunid Syed Junid, Data collection by Muhammad lmran Ahmad; Analysis and interpretation of results by K. Suresh Manic, Syed Alwee Aljunid Syed Junid, Muhammad lmran Ahmad; draft manuscript preparation: Imad Saud Al Naimi, K. Suresh Manic, All authors reviewed the results and approved the final version of the manuscript.
Availability of Data and Materials: The authors confirm the dataset used in the study is publicly available.
Conflicts of Interest: The authors declare that they have no conflicts of interest to report regarding the present study.
References
1. D. N. Louis et al., “The 2021 WHO classification of tumors of the central nervous system: A summary,” Neurooncol., vol. 23, no. 8, pp. 1231–1251, 2021. [Google Scholar]
2. D. N. Louis et al., “The 2016 World Health Organization classification of tumors of the central nervous system: A summary,” Acta Neuropathol., vol. 131, no. 6, pp. 803–820, 2016. doi: 10.1007/s00401-016-1545-1. [Google Scholar] [PubMed] [CrossRef]
3. H. Sung et al., “Global cancer statistics 2020: GLOBOCAN estimates of incidence and mortality worldwide for 36 cancers in 185 countries,” CA: A Cancer J. Clinic., vol. 71, no. 3, pp. 209–249, Feb. 2021. doi: 10.3322/caac.21660. [Google Scholar] [PubMed] [CrossRef]
4. ASCO, “Brain Tumor-Statistics, Cancer.net,” Mar. 20, 2018. Accessed: Jun. 21, 2023. [Online]. Available: https://www.cancer.net/cancer-types/brain-tumor/statistics [Google Scholar]
5. L. Zhao and K. Jia, “Multiscale CNNs for brain tumor segmentation and diagnosis,” Comput. Math. Methods Medicine, vol. 2016, no. 7, pp. 1–7, 2016. doi: 10.1155/2016/8356294. [Google Scholar] [PubMed] [CrossRef]
6. A. H. Khan et al., “Intelligent model for brain tumor identification using deep learning,” Appl. Comput. Intell. Soft Comput., vol. 2022, pp. 1–10, Jan. 2022. [Google Scholar]
7. K. Tawbe, F. Cotton, and L. Vuillon, “Evolution of brain tumor and stability of geometric invariants,” Int. J. Telemed. Appl., vol. 2008, pp. 1–12, 2008. [Google Scholar]
8. A. Işın, C. Direkoğlu, and M. Şah, “Review of MRI-based brain tumor image segmentation using deep learning methods,” Procedia Comput. Sci., vol. 102, pp. 317–324, 2016. [Google Scholar]
9. N. Gordillo, E. Montseny, and P. Sobrevilla, “State of the art survey on MRI brain tumor segmentation,” Magn. Reson. Imaging, vol. 31, no. 8, pp. 1426–1438, Oct. 2013. [Google Scholar] [PubMed]
10. L. Liu, L. Kuang, and Y. Ji, “Multimodal MRI brain tumor image segmentation using sparse subspace clustering algorithm,” Comput. Math. Methods Med., vol. 2020, pp. 8620403, Jul. 2020. [Google Scholar] [PubMed]
11. M. Huml, R. Silye, G. Zauner, S. Hutterer, and K. Schilcher, “Brain tumor classification using AFM in combination with data mining techniques,” Biomed Res. Int., vol. 2013, no. 2, pp. 1–11, 2013. doi: 10.1155/2013/176519. [Google Scholar] [PubMed] [CrossRef]
12. S. Gull, S. Akbar, and H. U. Khan, “Automated detection of brain tumor through magnetic resonance images using convolutional neural network,” Biomed Res. Int., vol. 2021, no. 6, pp. 1–14, Nov. 2021. doi: 10.1155/2021/3365043. [Google Scholar] [PubMed] [CrossRef]
13. H. Lin et al., “An automatic method for brain tumors segmentation based on deep convolutional neural network,” in 2021 IEEE Int. Conf. Med. Imaging Phys. Eng. (ICMIPE), Hefei, China, 2021, pp. 1–8. doi: 10.1109/icmipe53131.2021.9698882. [Google Scholar] [CrossRef]
14. M. Havaei et al., “Brain tumor segmentation with deep neural networks,” Med. Image Anal., vol. 35, no. 4, pp. 18–31, Jan. 2017. doi: 10.1016/j.media.2016.05.004. [Google Scholar] [PubMed] [CrossRef]
15. A. H. Khan et al., “Intelligent model for brain tumor identification using deep learning,” Appl. Comput. Intell. Soft Comput., vol. 2022, no. 12, pp. 1–10, 2022. doi: 10.1155/2022/8104054. [Google Scholar] [CrossRef]
16. N. Pradhan, V. S. Dhaka, G. Rani, V. Pradhan, and E. Zumpano, “Conditional generative adversarial network model for conversion of 2 dimensional radiographs into 3 dimensional views,” IEEE Access, vol. 11, pp. 96283–96296, Jan. 2023. [Google Scholar]
17. A. Gurunathan and B. Krishnan, “A hybrid CNN-GLCM classifier for detection and grade classification of brain tumor,” Brain Imaging Behav., vol. 16, no. 3, pp. 1–18, Jan. 2022. doi: 10.1007/s11682-021-00598-2. [Google Scholar] [PubMed] [CrossRef]
18. D. R. Nayak, N. Padhy, P. K. Mallick, M. Zymbler, and S. Kumar, “Brain tumor classification using dense efficient-net,” Axioms, vol. 11, no. 1, pp. 34, Jan. 2022. doi: 10.3390/axioms11010034. [Google Scholar] [CrossRef]
19. M. F. Alanazi et al., “Brain tumor/mass classification framework using magnetic-resonance-imaging-based isolated and developed transfer deep-learning model,” Sens., vol. 22, no. 1, pp. 372, Jan. 2022. doi: 10.3390/s22010372. [Google Scholar] [PubMed] [CrossRef]
20. J. Amin, M. Sharif, M. Yasmin, and S. L. Fernandes, “Big data analysis for brain tumor detection: Deep convolutional neural networks,” Future Gener. Comput. Syst., vol. 87, no. 8, pp. 290–297, Oct. 2018. doi: 10.1016/j.future.2018.04.065. [Google Scholar] [CrossRef]
21. V. Rajinikanth, A. N. Joseph Raj, K. P. Thanaraj, and G. R. Naik, “A customized VGG19 network with concatenation of deep and handcrafted features for brain tumor detection,” Appl. Sci., vol. 10, no. 10, pp. 3429, May 2020. doi: 10.3390/app10103429. [Google Scholar] [CrossRef]
22. P. K. Mallick, S. H. Ryu, S. K. Satapathy, S. Mishra, and G. N. Nguyen, “Brain MRI image classification for cancer detection using deep wavelet autoencoder-based deep neural network,” IEEE Access, vol. 7, pp. 46278–46287, 2019. doi: 10.1109/ACCESS.2019.2902252. [Google Scholar] [CrossRef]
23. M. I. Sharif, J. P. Li, M. A. Khan, and M. A. Saleem, “Active deep neural network features selection for segmentation and recognition of brain tumors using MRI images,” Pattern Recognit. Lett., vol. 129, no. 10, pp. 181–189, Jan. 2020. doi: 10.1016/j.patrec.2019.11.019. [Google Scholar] [CrossRef]
24. A. Gudigar, U. Raghavendra, T. R. San, E. J. Ciaccio, and U. R. Acharya, “Application of multiresolution analysis for automated detection of brain abnormality using MR images: A comparative study,” Future Gener. Comput. Syst., vol. 90, no. 1, pp. 359–367, Jan. 2019. doi: 10.1016/j.future.2018.08.008. [Google Scholar] [CrossRef]
25. S. Khawaldeh, U. Pervaiz, A. Rafiq, and R. S. Alkhawaldeh, “Noninvasive grading of glioma tumor using magnetic resonance imaging with convolutional neural networks,” Appl. Sci., vol. 8, no. 1, pp. 27, Dec. 2018. doi: 10.3390/app8010027. [Google Scholar] [CrossRef]
26. M. Sharif, J. Amin, M. Raza, M. Yasmin, and S. C. Satapathy, “An integrated design of particle swarm optimization (PSO) with fusion of features for detection of brain tumor,” Pattern Recognit. Lett., vol. 129, pp. 150–157, Jan. 2020. doi: 10.1016/j.patrec.2019.11.017. [Google Scholar] [CrossRef]
27. M. A. Khan et al., “Multimodal brain tumor classification using deep learning and robust feature selection: A machine learning application for radiologists,” Diagnostics, vol. 10, no. 8, pp. 565, Aug. 2020. doi: 10.3390/diagnostics10080565. [Google Scholar] [PubMed] [CrossRef]
28. M. A. Naser and M. J. Deen, “Brain tumor segmentation and grading of lower-grade glioma using deep learning in MRI images,” Comput. Biol. Med., vol. 121, no. 7, pp. 103758, Jan. 2020. doi: 10.1016/j.compbiomed.2020.103758. [Google Scholar] [PubMed] [CrossRef]
29. L. Pei, L. Vidyaratne, M. M. Rahman, and K. M. Iftekharuddin, “Context aware deep learning for brain tumor segmentation, subtype classification, and survival prediction using radiology images,” Sci. Rep., vol. 10, no. 1, pp. 1–11, Nov. 2020. [Google Scholar]
30. V. Rajinikanth, S. Kadry, and Y. Nam, “Convolutional-neural-network assisted segmentation and SVM classification of brain tumor in clinical MRI slices,” Inf. Technol. Control., vol. 50, no. 2, pp. 342–356, Jun. 2021. doi: 10.5755/j01.itc.50.2.28087. [Google Scholar] [CrossRef]
31. E. S. Biratu, F. Schwenker, Y. M. Ayano, and T. G. Debelee, “A survey of brain tumor segmentation and classification algorithms,” J. Imaging, vol. 7, no. 9, pp. 179, Sep. 2021. doi: 10.3390/jimaging7090179. [Google Scholar] [PubMed] [CrossRef]
32. A. K. Sahoo, P. Parida, K. Muralibabu, and S. Dash, “Efficient simultaneous segmentation and classification of brain tumors from MRI scans using deep learning,” Biocyber. Biomed. Eng., vol. 43, no. 3, pp. 616–633, Jul. 2023. doi: 10.1016/j.bbe.2023.08.003. [Google Scholar] [CrossRef]
33. A. K. Sahoo, P. Parida, K. Muralibabu, and S. Dash, “An improved DNN with FFCM method for multimodal brain tumor segmentation,” Intell. Syst. Appl., vol. 18, pp. 200245, Jun. 2023. [Google Scholar]
34. A. K. Sahoo, P. Parida, and K. Muralibabu, “Hybrid deep neural network with clustering algorithms for effective gliomas segmentation,” Int. J. Syst. Assur. Eng. Manag., vol. 15, no. 3, pp. 1–17, Oct. 2023. [Google Scholar]
35. S. Bakas et al., “Advancing the cancer genome atlas glioma MRI collections with expert segmentation labels and radiomic features,” Sci. Data, vol. 4, no. 1, pp. 1–13, Sep. 2017. doi: 10.1038/sdata.2017.117. [Google Scholar] [PubMed] [CrossRef]
36. M. Nazir, S. Shakil, and K. Khurshid, “Role of deep learning in brain tumor detection and classification (2015 to 2020A review,” Comput. Med. Imaging Graph, vol. 91, pp. 101940, 2021. doi: 10.1016/j.compmedimag.2021.101940. [Google Scholar] [PubMed] [CrossRef]
37. S. A. Y. Al-Galal, I. F. T. Alshaikhli, and M. M. Abdulrazzaq, “MRI brain tumor medical images analysis using deep learning techniques: A systematic review,” Health Technol., vol. 11, no. 2, pp. 1–16, Jan. 2021. doi: 10.1007/s12553-020-00514-6. [Google Scholar] [CrossRef]
38. C. A. Silva, A. Pinto, S. Pereira, and A. Lopes, “Multi-stage deep layer aggregation for brain tumor segmentation,” in Int. MICCAI Brainlesion Workshop, Jan. 2022, vol. 12659, pp. 179–188. [Google Scholar]
39. Z. Khazaei, M. Langarizadeh, and M. E. Shiri Ahmad Abadi, “Glioma brain tumor identification using magnetic resonance imaging with deep learning methods: A systematic review,” J. Health Biomed. Inform., vol. 8, no. 2, pp. 218–233, Apr. 2021. [Google Scholar]
40. P. Afshar, K. N. Plataniotis, and A. Mohammadi, “Capsule networks for brain tumor classification based on MRI images and course tumor boundaries,” in 2019 IEEE Int. Conf. Acoust., Speech and Signal Process. (ICASSP), Brighton, UK, 2019, pp. 1368–1372, doi: 10.1109/ICASSP.2019.8683759. [Google Scholar] [CrossRef]
41. J. Sachdeva, V. Kumar, I. Gupta, N. Khandelwal, and C. K. Ahuja, “A package-SFERCB-“Segmentation, feature extraction, reduction and classification analysis by both SVM and ANN for brain tumors"," Appl. Soft Comput., vol. 47, no. 12B, pp. 151–167, Oct. 2016. doi: 10.1016/j.asoc.2016.05.020. [Google Scholar] [CrossRef]
42. B. Yin, C. Wang, and F. Abza, “New brain tumor classification method based on an improved version of whale optimization algorithm,” Biomed. Signal Process. Control, vol. 56, no. 6, pp. 101728, Feb. 2020. doi: 10.1016/j.bspc.2019.101728. [Google Scholar] [CrossRef]
43. C. Ge, I. Y. H. Gu, A. S. Jakola, and J. Yang, “Enlarged training dataset by pairwise gans for molecular-based brain tumor classification,” IEEE Access, vol. 8, pp. 22560–22570, Jan. 2020. doi: 10.1109/ACCESS.2020.2969805. [Google Scholar] [CrossRef]
44. E. S. S. Biratu, F. Schwenker, T. G. G. Debelee, S. R. R. Kebede, W. G. G. Negera and H. T. Molla, “Enhanced region growing for brain tumor MR image segmentation,” J. Imaging, vol. 7, no. 2, pp. 22, Feb. 2021. [Google Scholar] [PubMed]
45. R. Ranjbarzadeh, A. Bagherian Kasgari, S. Jafarzadeh Ghoushchi, S. Anari, M. Naseri and M. Bendechache, “Brain tumor segmentation based on deep learning and an attention mechanism using MRI multi-modalities brain images,” Sci. Rep., vol. 11, no. 1, pp. 10930, May 2021. doi: 10.1038/s41598-021-90428-8. [Google Scholar] [PubMed] [CrossRef]
46. R. Ranjbarzadeh, A. Caputo, E. B. Tirkolaee, S. J. Ghoushchi, and M. Bendechache, “Brain tumor segmentation of MRI images: A comprehensive review on the application of artificial intelligence tools,” Comput. Biol. Med., vol. 152, no. 4, pp. 106405, Jan. 2023. doi: 10.1016/j.compbiomed.2022.106405. [Google Scholar] [PubMed] [CrossRef]
47. B. H. Menze et al., “The multimodal brain tumor image segmentation benchmark (BRATS),” IEEE Trans. Med. Imaging, vol. 34, no. 10, pp. 1993–2024, Oct. 2014. doi: 10.1109/TMI.2014.2377694. [Google Scholar] [PubMed] [CrossRef]
48. B. H. Menze, K. V. Leemput, D. Lashkari, M. A. Weber, N. Ayache and P. Golland, “A generative model for brain tumor segmentation in multi-modal images,” in Int. Conf. Medical Image Comput. Comput.-Assist. Interven., Beijing, China, Sep. 2010, pp. 151–159. [Google Scholar]
49. K. Clark et al., “The Cancer Imaging Archive (TCIAMaintaining and operating a public information repository,” J. Digit. Imaging, vol. 26, no. 6, pp. 1045–1057, Jul. 2013. doi: 10.1007/s10278-013-9622-7. [Google Scholar] [PubMed] [CrossRef]
50. N. Pedano et al., “Radiology data from the cancer genome atlas low grade glioma [TCGA-LGG] collection,” Cancer Imaging Arch., 2016. doi: 10.7937/K9/TCIA.2016.L4LTD3TK. [Google Scholar] [CrossRef]
51. L. Scarpace et al., “Radiology data from the cancer genome atlas glioblastoma multiforme [TCGA-GBM] collection,” Cancer Imaging Arch., 2016. doi: 10.7937/K9/TCIA.2016.RNYFUYE9. [Google Scholar] [CrossRef]
52. V. Rao, M. S. Sarabi, and A. Jaiswal, “Brain tumor segmentation with deep learning,” in MICCAI Multimodal Brain Tumor Segment. Challenge (BraTS), Oct. 2015, vol. 59. [Google Scholar]
53. T. Saba, A. S. Mohamed, M. El-Affendi, J. Amin, and M. Sharif, “Brain tumor detection using fusion of hand crafted and deep learning features,” Cogn. Syst. Res., vol. 59, no. 1, pp. 221–230, Jan. 2020. doi: 10.1016/j.cogsys.2019.09.007. [Google Scholar] [CrossRef]
54. P. A. Yushkevich et al., “User-guided 3D active contour segmentation of anatomical structures: Significantly improved efficiency and reliability,” Neuroimage, vol. 31, no. 3, pp. 1116–1128, Jul. 2006. doi: 10.1016/j.neuroimage.2006.01.015. [Google Scholar] [PubMed] [CrossRef]
55. ITK-SNAP Home, “Itksnap.org,” 2018. Accessed: Sep. 21, 2023. [Online]. Available: http://www.itksnap.org/pmwiki/pmwiki.php [Google Scholar]
56. P. Mohanaiah, P. Sathyanarayana, and L. GuruKumar, “Image texture feature extraction using GLCM approach,” Int. J. Sci. Res. Pub., vol. 3, no. 5, pp. 1–5, May 2013. [Google Scholar]
57. B. O. Hua, F. L. Ma, and L. C. Jiao, “Research on computation of GLCM of image texture,” Acta Electron. Sinica, vol. 1, no. 1, pp. 155–158, Jan. 2006. [Google Scholar]
58. S. M. Mousavi, A. Asgharzadeh-Bonab, and R. Ranjbarzadeh, “Time-frequency analysis of EEG signals and GLCM features for depth of anesthesia monitoring,” Comput. Intell. Neurosci., vol. 2021, pp. e8430565, Aug. 2021. doi: 10.1155/2021/8430565. [Google Scholar] [PubMed] [CrossRef]
59. P. S. Shijin Kuma and V. S. Dharun, “Extraction of texture features using GLCM and shape features using connected regions,” Int. J. Eng. Technol., vol. 8, no. 6, pp. 2926–2930, Dec. 2016. doi: 10.21817/ijet/2016/v8i6/160806254. [Google Scholar] [CrossRef]
60. M. M. Fathima, D. Manimegalai, and S. Thaiyalnayaki, “Automatic detection of tumor subtype in mammograms based On GLCM and DWT features using SVM,” in 2013 Int. Conf. Inform. Commun. Embedded Syst. (ICICES), Feb. 2013, pp. 809–813. [Google Scholar]
61. W. Sun et al., “Prediction of near-term risk of developing breast cancer using computerized features from bilateral mammograms,” Comput. Med. Imaging Graph, vol. 38, no. 5, pp. 348–357, Jul. 2014. doi: 10.1016/j.compmedimag.2014.03.001. [Google Scholar] [PubMed] [CrossRef]
62. M. Heidari et al., “Applying a random projection algorithm to optimize machine learning model for breast lesion classification,” IEEE Trans. Biomed. Eng., vol. 68, no. 9, pp. 2764–2775, Sep. 2021. doi: 10.1109/TBME.2021.3054248. [Google Scholar] [PubMed] [CrossRef]
63. S. Mirniaharikandehei, M. Heidari, G. Danala, S. Lakshmivarahan, and B. Zheng, “A novel feature reduction method to improve performance of machine learning model,” Med. Imaging 2021: Comput.-Aided Diagnos., vol. 11597, pp. 1159726, Feb. 2021. [Google Scholar]
64. H. Kutlu and E. Avcı, “A novel method for classifying liver and brain tumors using convolutional neural networks, discrete wavelet transform and long short-term memory networks,” Sens., vol. 19, no. 9, pp. 1992, 2019. [Google Scholar]
65. S. A. Nawaz, D. M. Khan, and S. Qadri, “Brain tumor classification based on hybrid optimized multi-features analysis using magnetic resonance imaging dataset,” Appl. Artif. Intell., vol. 36, no. 1, pp. 2031824, Dec. 2022. doi: 10.1080/08839514.2022.2031824. [Google Scholar] [CrossRef]
66. L. Caroprese, E. Vocaturo, and E. Zumpano, “Argumentation approaches for explanaible AI,” Med. Inform., vol. 16, pp. 200109, Nov. 2022. [Google Scholar]
67. H. Mohsen, E. S. A. El-Dahshan, E. S. M. El-Horbaty, and A. B. M. Salem, “Classification using deep learning neural networks for brain tumors,” Future Comput. Inform. J., vol. 3, no. 1, pp. 68–71, Dec. 2018. doi: 10.1016/j.fcij.2017.12.001. [Google Scholar] [CrossRef]
68. K. Sharma, A. Kaur, and S. Gujral, “Brain tumor detection based on machine learning algorithms,” Int. J. Comput. Appl., vol. 103, no. 1, pp. 7–11, Jan. 2014. doi: 10.5120/18036-6883. [Google Scholar] [CrossRef]
69. J. Amin, M. Sharif, M. Raza, and M. Yasmin, “Detection of brain tumor based on features fusion and machine learning,” J. Ambient Intell. Humaniz. Comput., vol. 15, pp. 983–999, 2018. [Google Scholar]
70. X. Zhao, Y. Wu, G. Song, Z. Li, Y. Zhang, and Y. Fan, “A deep learning model integrating FCNNs and CRFs for brain tumor segmentation,” Med. Image Anal., vol. 43, pp. 98–111, Jan. 2018. doi: 10.1016/j.media.2017.10.002. [Google Scholar] [PubMed] [CrossRef]
71. J. S. Paul, A. J. Plassard, B. A. Landman, and D. Fabbri, “Deep learning for brain tumor classification,” Med. Imaging 2017: Biomed. Appl. Molecular, Structural, Functional Imaging, vol. 10137, pp. 1013710, Mar. 2017. [Google Scholar]
72. S. Mirjalili, “Moth-flame optimization algorithm: A novel nature-inspired heuristic paradigm,” Knowl. Based Syst., vol. 89, pp. 228–249, Nov. 2015. doi: 10.1016/j.knosys.2015.07.006. [Google Scholar] [CrossRef]
73. M. Shehab, L. Abualigah, H. Al Hamad, H. Alabool, M. Alshinwan and A. M. Khasawneh, “Moth-flame optimization algorithm: Variants and applications,” Neural Comput. Appl., vol. 32, no. 14, pp. 9859–9884, Jul. 2020. doi: 10.1007/s00521-019-04570-6. [Google Scholar] [CrossRef]
74. H. M. Zawbaa, E. Emary, B. Parv, and M. Sharawi, “Feature selection approach based on moth-flame optimization algorithm,” in 2016 IEEE Cong. Evolu. Comput. (CEC), Jul. 2016, pp. 4612–4617. [Google Scholar]
75. M. H. Nadimi-Shahraki, M. Banaie-Dezfouli, H. Zamani, S. Taghian, and S. Mirjalili, “B-MFO: A binary moth-flame optimization for feature selection from medical datasets,” Computers, vol. 10, no. 11, pp. 136, Oct. 2021. doi: 10.3390/computers10110136. [Google Scholar] [CrossRef]
76. R. Abu Khurmaa, I. Aljarah, and A. Sharieh, “An intelligent feature selection approach based on moth flame optimization for medical diagnosis,” Neural Comput. Appl., vol. 33, pp. 7165–7204, Jun. 2021. [Google Scholar]
77. W. Ayadi, W. Elhamzi, I. Charfi, and M. Atri, “Deep CNN for brain tumor classification,” Neural Process. Lett., vol. 53, no. 1, pp. 671–700, 2021. doi: 10.1007/s11063-020-10398-2. [Google Scholar] [CrossRef]
78. J. D. Bodapati, N. S. Shaik, V. Naralasetti, and N. B. Mundukur, “Joint training of two-channel deep neural network for brain tumor classification,” Signal, Image Video Process., vol. 15, no. 4, pp. 753–760, Jun. 2021. [Google Scholar]
79. A. M. Alhassan and W. M. N. W. Zainon, “Brain tumor classification in magnetic resonance image using hard swish-based RELU activation function-convolutional neural network,” Neural Comput. Appl., vol. 1–13, no. 15, pp. 9075–9087, 2021. doi: 10.1007/s00521-020-05671-3. [Google Scholar] [CrossRef]
Appendix
This section includes sample images of selected MRI modalities, including Flair, T1, T1C, and T2, depicted in Figure a, sourced from the BRATS2015 dataset. These images affirm that the tumor is more clearly visible in Flair and T2 modalities compared to the relatively satisfactory visibility in T1C. The identification of the tumor region in T1 is not as easily discernible compared to the other modalities.

Figure S1: Sample test images of various MRI modalities collected from BRATS2015
Cite This Article
 Copyright © 2024 The Author(s). Published by Tech Science Press.
This work is licensed under a Creative Commons Attribution 4.0 International License , which permits unrestricted use, distribution, and reproduction in any medium, provided the original work is properly cited.
 Downloads
 Citation Tools