
 Submit a Paper
 Propose a Special lssue
 Open Access
ARTICLE

RoGRUT: A Hybrid Deep Learning Model for Detecting Power Trapping in Smart Grids
1 Center of Excellence in Information Assurance (CoEIA), King Saud University, Riyadh, 11543, Saudi Arabia
2 College of Computer & Information Sciences, King Saud University, Riyadh, 11543, Saudi Arabia
* Corresponding Author: Farah Mohammad. Email:
Computers, Materials & Continua 2024, 79(2), 3175-3192. https://doi.org/10.32604/cmc.2023.042873
Received 15 June 2023; Accepted 21 October 2023; Issue published 15 May 2024
 View Full Text
 Download PDF
Abstract
Electricity theft is a widespread non-technical issue that has a negative impact on both power grids and electricity users. It hinders the economic growth of utility companies, poses electrical risks, and impacts the high energy costs borne by consumers. The development of smart grids is crucial for the identification of power theft since these systems create enormous amounts of data, including information on client consumption, which may be used to identify electricity theft using machine learning and deep learning techniques. Moreover, there also exist different solutions such as hardware-based solutions to detect electricity theft that may require human resources and expensive hardware. Computer-based solutions are presented in the literature to identify electricity theft but due to the dimensionality curse, class imbalance issue and improper hyper-parameter tuning of such models lead to poor performance. In this research, a hybrid deep learning model abbreviated as RoGRUT is proposed to detect electricity theft as a malicious and non-malicious activity. The key steps of the RoGRUT are data preprocessing that covers the problem of class imbalance, feature extraction and final theft detection. Different advanced-level models like RoBERTa is used to address the curse of dimensionality issue, the near miss for class imbalance, and transfer learning for classification. The effectiveness of the RoGRUT is evaluated using the dataset from actual smart meters. A significant number of simulations demonstrate that, when compared to its competitors, the RoGRUT achieves the best classification results. The performance evaluation of the proposed model revealed exemplary results across various metrics. The accuracy achieved was 88%, with precision at an impressive 86% and recall reaching 84%. The F1-Score, a measure of overall performance, stood at 85%. Furthermore, the model exhibited a noteworthy Matthew correlation coefficient of 78% and excelled with an area under the curve of 91%.Keywords
Energy serves as a crucial input in various domains, including industrial processes, economic growth, and household activities [1]. It provides the necessary power to operate machinery, equipment, and tools utilized in manufacturing, construction, transportation, and other industrial sectors [2]. The absence of energy would severely restrict industrial production, resulting in a substantial decrease in economic output and productivity. However, the loss of energy concerning energy providers and the power distribution network. There are two main categories of energy distribution losses: Non-technical losses (NTLs) and Technical Losses (TLs). Non-technical losses mainly include electricity theft, corruption involving utility employees, and billing irregularities within the power system [3]. In contrast, Technical Losses (TLs) are associated with the inherent physical characteristics of electrical system components [4]. Figs. 1a and 1b show the energy consumption and the statistics of malicious and non-malicious user.
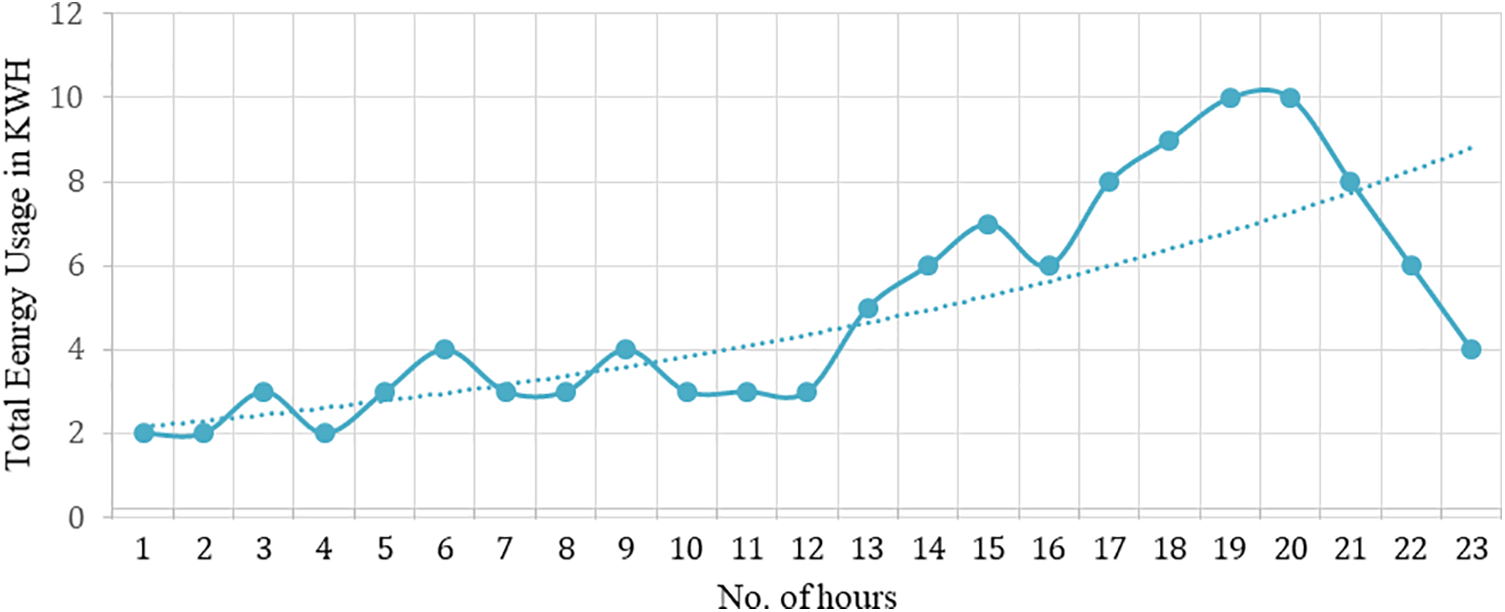
Figure 1(a): Single day energy consumption of any smart grid
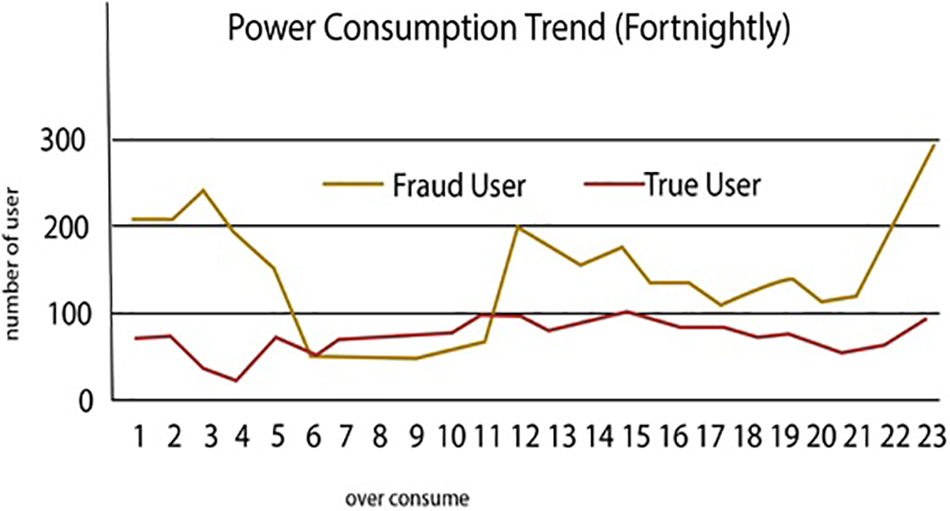
Figure 1(b): Fraud and true users statistics
The Smart Grid (SG) pertains to the continuous expansion of renewable and distributed power sources, with the primary objective of attaining flexibility, self-healing capabilities, efficiency, and sustainability [5]. This innovative concept is gaining increasing recognition due to its integration of advanced infrastructure in tandem with existing power grids [6]. The cyber infrastructure employed facilitates the collection and analysis of data from diverse distributed endpoints, encompassing phase or measurement units, smart meters, and circuit breakers. The architecture of the smart grid is depicted in Fig. 2. The introduction of advanced meter infrastructure (AMI) has brought forth a novel dimension to conventional power grids [7]. AMI incorporates smart meters, sensing devices, computational equipment, and contemporary communication technologies, enabling seamless bidirectional communication between consumers and utilities. Its primary purpose revolves around the acquisition of vital data related to energy consumption (EC), prevailing prices, and power grid status. Nevertheless, the integration of the Internet into AMI also gives rise to potential security vulnerabilities, as it opens doors for malicious actors to remotely exploit the intelligent meter infrastructure and engage in unauthorized electricity theft.
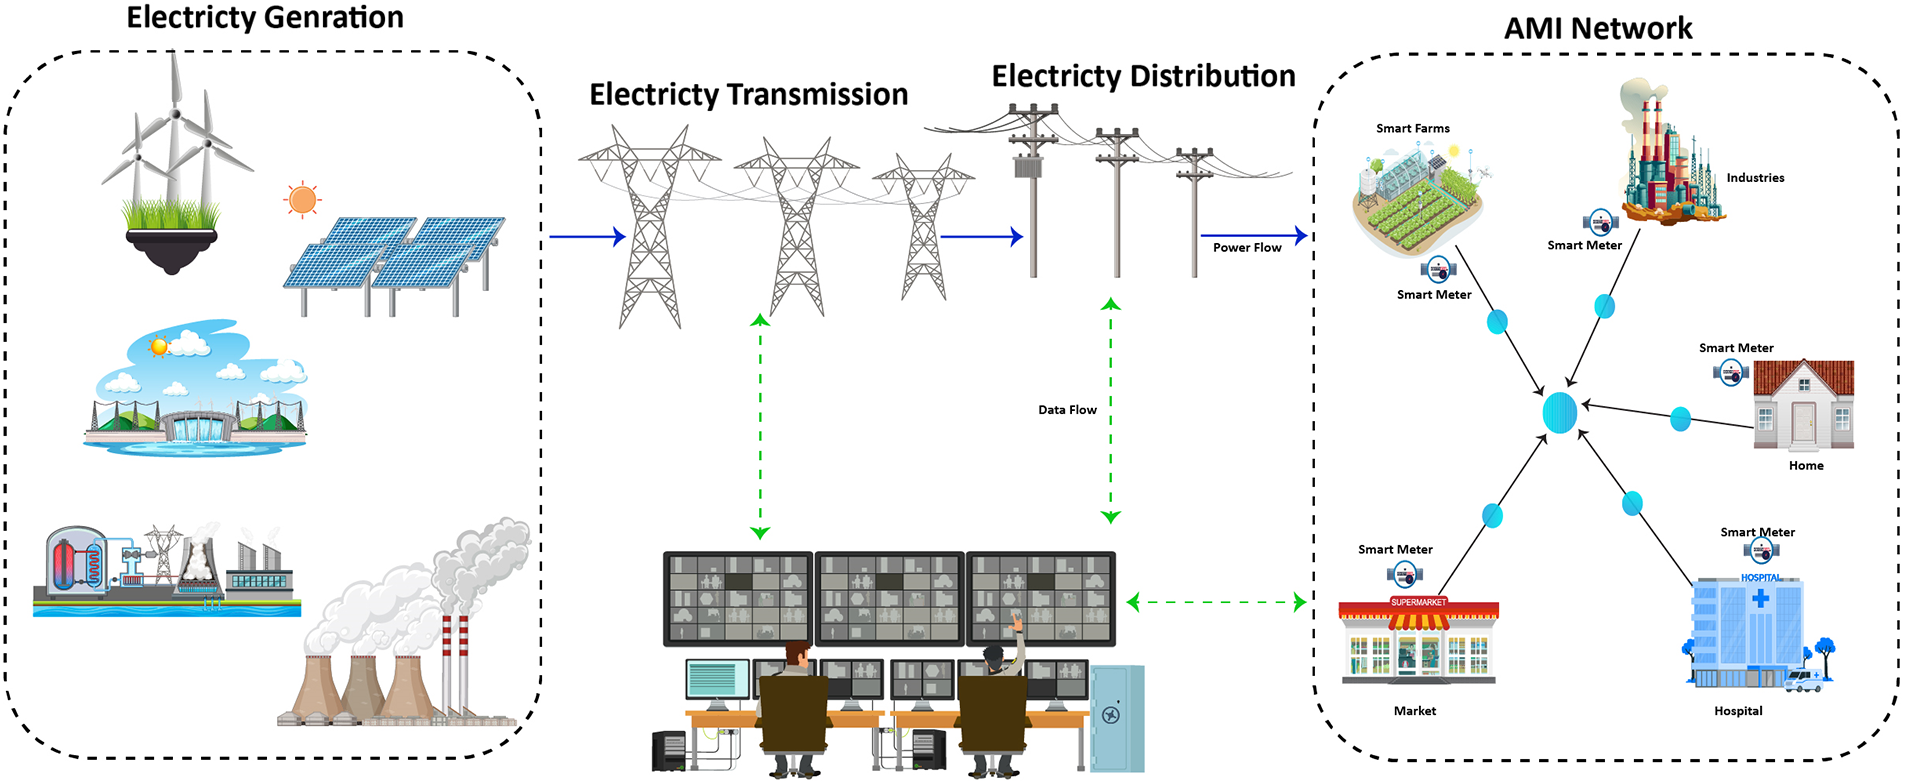
Figure 2: A typical architecture of smart grid
Power grids serve the essential function of transferring energy from its source to end-users, specifically consumers [8]. However, this energy transfer occurs without knowledge of the consumers’ current energy requirements, which can lead to issues such as misuse, theft, wastage, or energy shortages. Consequently, the detection of non-technical losses (NTLs) has become a critical necessity in the present era. To address this concern, researchers have introduced various techniques to combat NTLs. Among the key approaches for addressing this issue some of the options available are the network-focused methodology and data-centric model. These three separate kinds of power theft detection systems have each showed promise in accurately recognizing NTLs. Network- and hybrid-oriented solutions, along with the incorporation of new devices, may require regular adjustments to the network architecture. However, challenges arise due to security concerns surrounding access to the network architecture and the cost of installing additional devices, making widespread adoption of these principles difficult. By prioritizing data analysis, these methods enhance the efficiency of identifying and evaluating suspected power theft. Consequently, data-driven approaches for detecting power theft have gained significant traction in recent years.
In contrast, traditional methods for detecting electricity theft heavily rely on the schedules of technicians employed by power distribution companies. This process involves manual reading of electricity meters, followed by analysis, calculations, recording, counting, and subsequent analysis. Hardware-based measures can be implemented to prevent energy theft, such as installing specialized watt hour metering boxes, connecting conductors to outlets with reduced voltage, sealing them to the metering device, and incorporating anti-theft functionalities into watt hour meters. Furthermore, increasing the adoption rate of the electrical acquisition system can contribute to prevention efforts. However, most of these conventional techniques for anti-theft detection primarily focus on improving power devices.
Research has also been conducted on sophisticated computer-based methods to identify instances of electricity theft, utilizing different deep learning models. However, accurate comparisons with shallower systems are limited due to the reliance on simulated data for evaluating detector performance. Additionally, the authors of [8] have proposed a customer-specific deep neural network (DNN) detector that shows promise in effectively countering cyber-attacks. Convolutional Neural Network (CNN) has also gained popularity for various applications [9–11], as it excels in extracting meaningful and distinctive features from raw data. In the context of power theft detection, CNN has been employed to extract features from high-resolution smart meter data. Notably, researchers developed a large and deep convolutional neural network (DCNN) framework in [12] to conduct a comprehensive analysis of smart grid electricity theft.
The proposed work makes several key contributions, outlined as follows:
• Feature extraction is performed using the Robustly Optimized BERT (RoBERT) a with Gated Recurrent Unit (GRU) model, effectively identifying relevant patterns from the high-dimensional energy consumption data.
• The issue of class imbalance is addressed through the implementation of the near miss (NM) technique, which utilizes under-sampling.
• A transfer learning model is employed to classify malicious and non-malicious energy consumers.
• The proposed model’s performance is assessed using different metrics, such as accuracy, F1-Score, recall, precision and area under the curve receiver operating characteristics (AUC-ROC).
The structure of the remaining paper is as follows: In Section 2, an overview of the related work is provided, highlighting previous research in the field. Section 3 focuses on identifying and discussing the specific problems addressed in the study. The proposed system model is detailed in Section 4, outlining the key components and methodologies used. Section 5 presents the simulation results obtained from applying the proposed model. Finally, in Section 6, the paper concludes, summarizing the main findings and contributions.
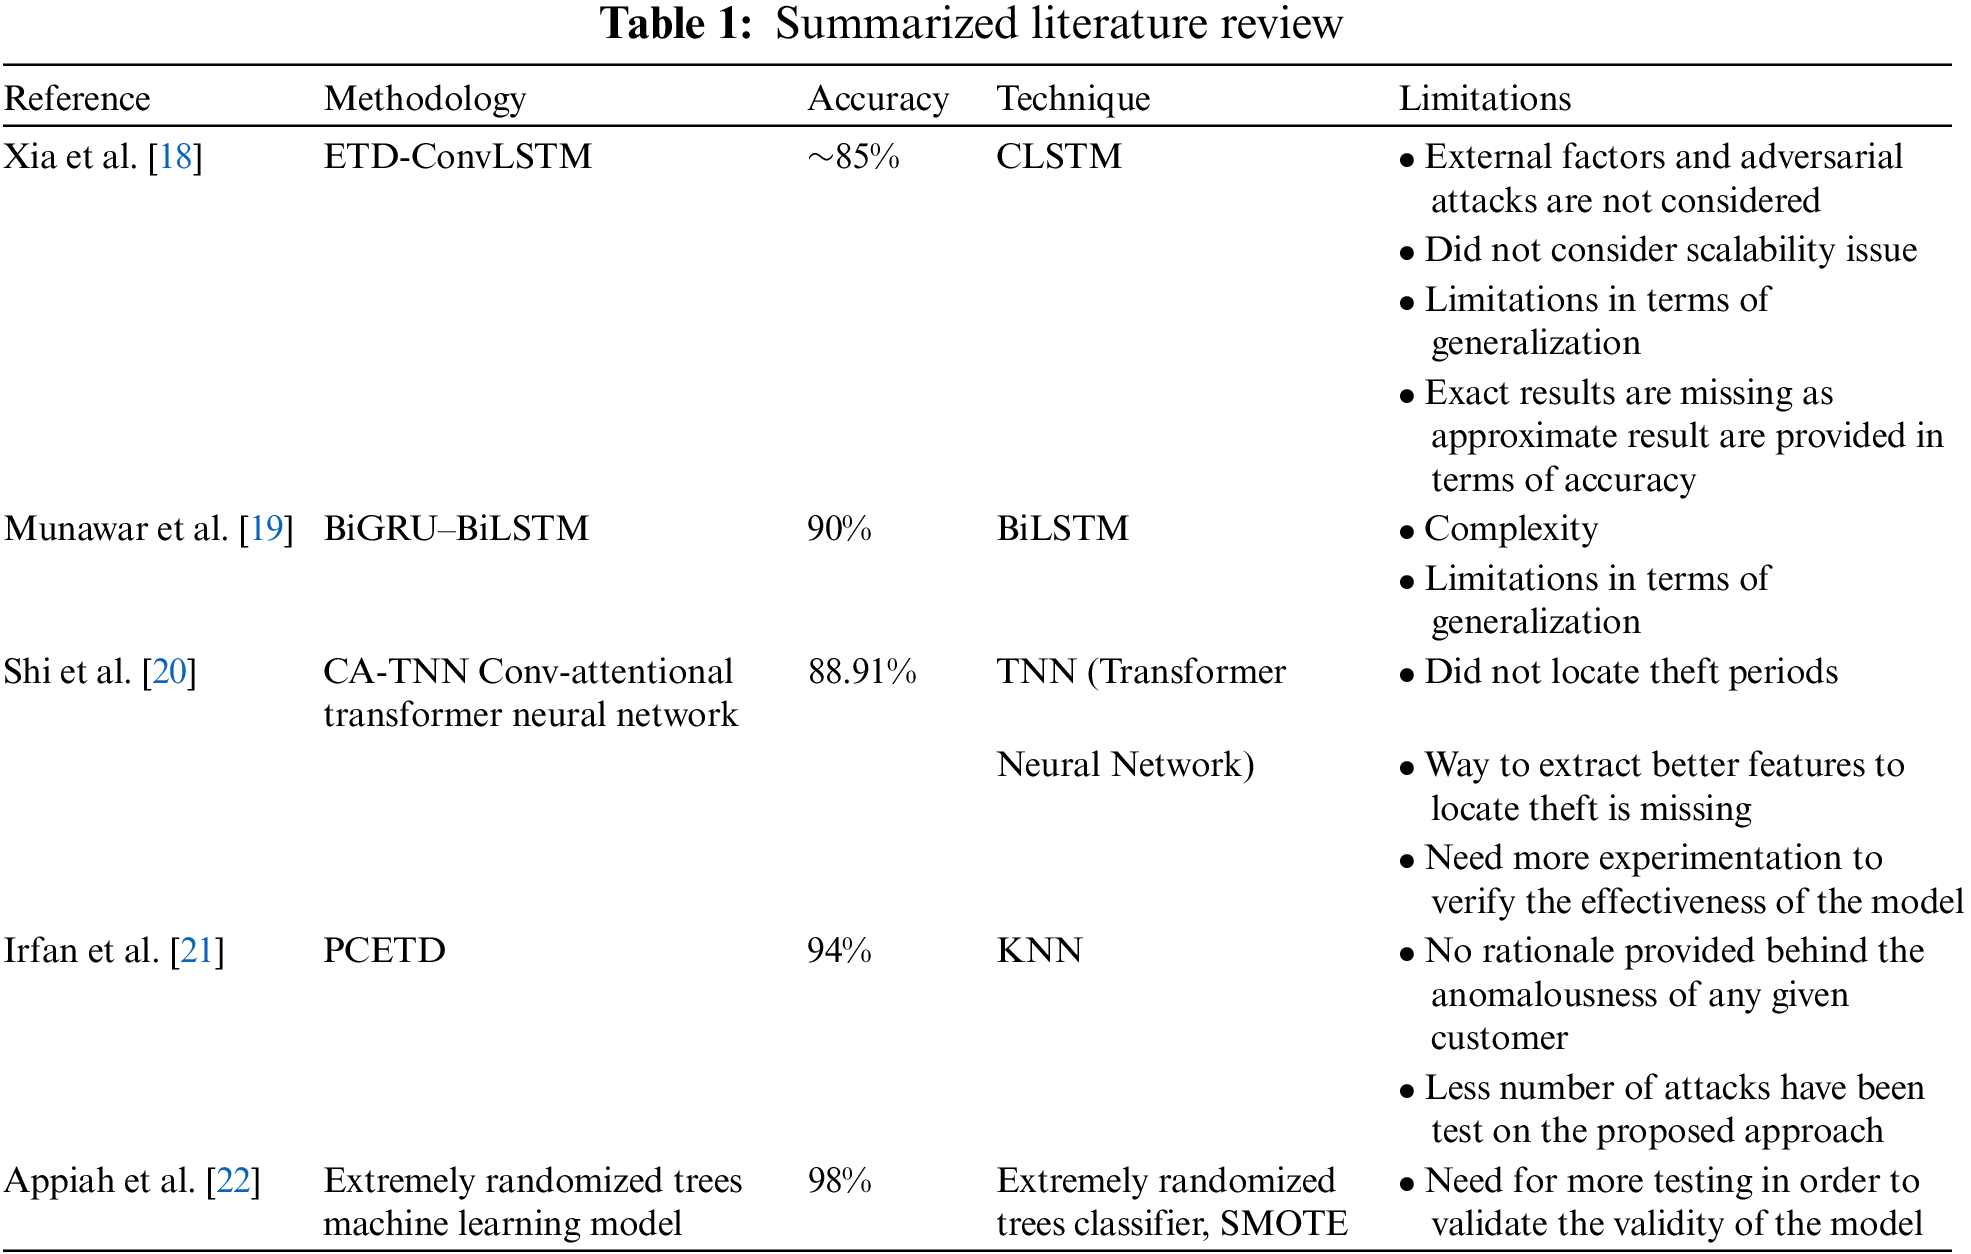
This section discusses the comprehensive analysis of the existing existing models for electricity theft detection process. Due to the limitation of spaces some of the literature is also summarized in Table 1. Ahir et al. [13] expressed that, by transmitting information in both directions, the smart grid offers a wide range of possible advantages for managing energy. However, the grid systems became more open to various communication threats as a result of the integration of smart infrastructure. It is possible to collect and investigate the data on power usage that is generated by smart meters in order to search for indications of fraudulent activity, data manipulation, and improper conduct. This approach was developed to identify electricity theft. Their technique determines the possibility of dishonest consumers by taking into account the relevant calendar context as well as the features of the average daily demand for power on a given day. In their method, they used something called dynamic temporal warping (DTW), as well as k-nearest neighbors (k-NN). The findings demonstrated that their suggested method was successful in detecting power theft, with an overall F1-Score of 94%, a True-Positive Rate (TPR) of 93%, and a False-Positive Rate (FPR) of 1.1%. The TPR was the more important metric. Additional authors said that their work performed far better than prior contributions, citing in the form of an elevated rate of detection and a small number of false-positive findings.
The work of Ullah et al. [14] discussed Electricity theft (ET) as a major issue for power companies as it endangers public safety, interferes with the regular operation of grid infrastructure, and decreases the revenue generation. After thorough investigation of the state of the art, author stated that many machine learning and statistically based algorithms were presented in the literature to detect ET. However, these models do not yield the best results due to the dimensionality curse and the class imbalance problem. The curse of dimensionality problem was addressed using AlexNet, and the final categorization of energy thieves and average consumers was carried out using adaptive boosting (AdaBoost). A near miss under sampling technique was also used by the authors to address the issue of class imbalance. Furthermore, the artificial bee colony optimization approach was used to adjust the hyper-parameters of AdaBoost and AlexNet. The hybrid model’s effectiveness was evaluated using the dataset from actual smart meters. Authors claimed that when compared to its competitors, the hybrid model produced the best classification results.
Nawaz et al. [15] articulated their perspective on Theft of electricity, which is one of the primary non-technical losses (NTLs) in distributed networks that seriously damages the power grids. Author further presented a thought-provoking exploration of the said topic that power grids are responsible for distributing centralized power to all associated users; as a result, any fraudulent use of power can hurt the power grids, which in turn can disrupt the entire electric power supply and affect the quality of it. Author further argued that when there is a lot of data, finding these bogus customers becomes challenging. Smart grids can be used to address this issue since they offer a two-way power flow that enables people to identify, recreate, and implement new improvements to the electric data flow. The author then emphasized that the one-dimensional (1-D) electric data used by the current methods for power theft detection results in low accuracy in theft detection. Authors claimed that their proposed model outperformed previous methods in detecting electricity theft with an accuracy of 92%.
The authors of this study, Hasan et al. [16] suggested the implementation of a system for the detection of electrical theft. Combining the architectures of a CNN and LSTM helped them come up with the notion that they presented. The authors investigated whether or not the automation of feature extraction and the classification approach was a frequent practice. They found that it was. They built a CNN-LSTM model for the classification of smart grid data since the data on power usage is a time-series of data. This practice was taken into consideration when they built the model.
According to the results of Lepolesa et al. [17], the theft of energy is a common problem that has a detrimental effect not only on individuals who consume electricity but also on the companies that provide this service. They come to conclusion that the development of smart grids was crucial for the identification of power theft since these systems can create enormous amounts of data, including information on client consumption, which may be used in machine learning and deep learning methods to identify electricity theft. This research introduced a method for detecting theft that employs deep neural networks to classify data using extensive features in the time and frequency domains. Authors used data interpolation and synthetic data creation techniques to overcome dataset flaws like missing data and class imbalance issues. Authors also used an adaptive moment estimation optimizer to run tests with various values of critical parameters to found the settings that produced the best accuracy. Finally, they demonstrated their method’s competitiveness against other approaches assessed on the same dataset.
From the above discussion it is observed that, there exist too many techniques for electricity theft detection that are identifying non-technical theft in the smart grids. The traditional methods rely on human resources, expensive hardware and smart meters based techniques to detect electricity theft which is hectic and time consuming. Alternative to this, there also exists computer based machine learning models that also detect electricity theft but their performance is poor due to traditional similarity measures and non-potential feature extraction analogies. There also exist deep learning models to do the said task but may fail due to static nature of the model and lack of extraction of meaningful and distinctive features from raw data. Therefore, there exist a need to define a better model for electricity theft detection by using better measurements. The proposed method balances the unbalanced raw data to get the best features that further leads to more accurate results in terms of theft detection.
This section discusses the proposed conceptual model that has been designed for electricity theft detection. Fig. 3 depicts the flow mechanism of the key steps of the proposed model. Whereas, the detail description of each step has been discussed in below sub sections.
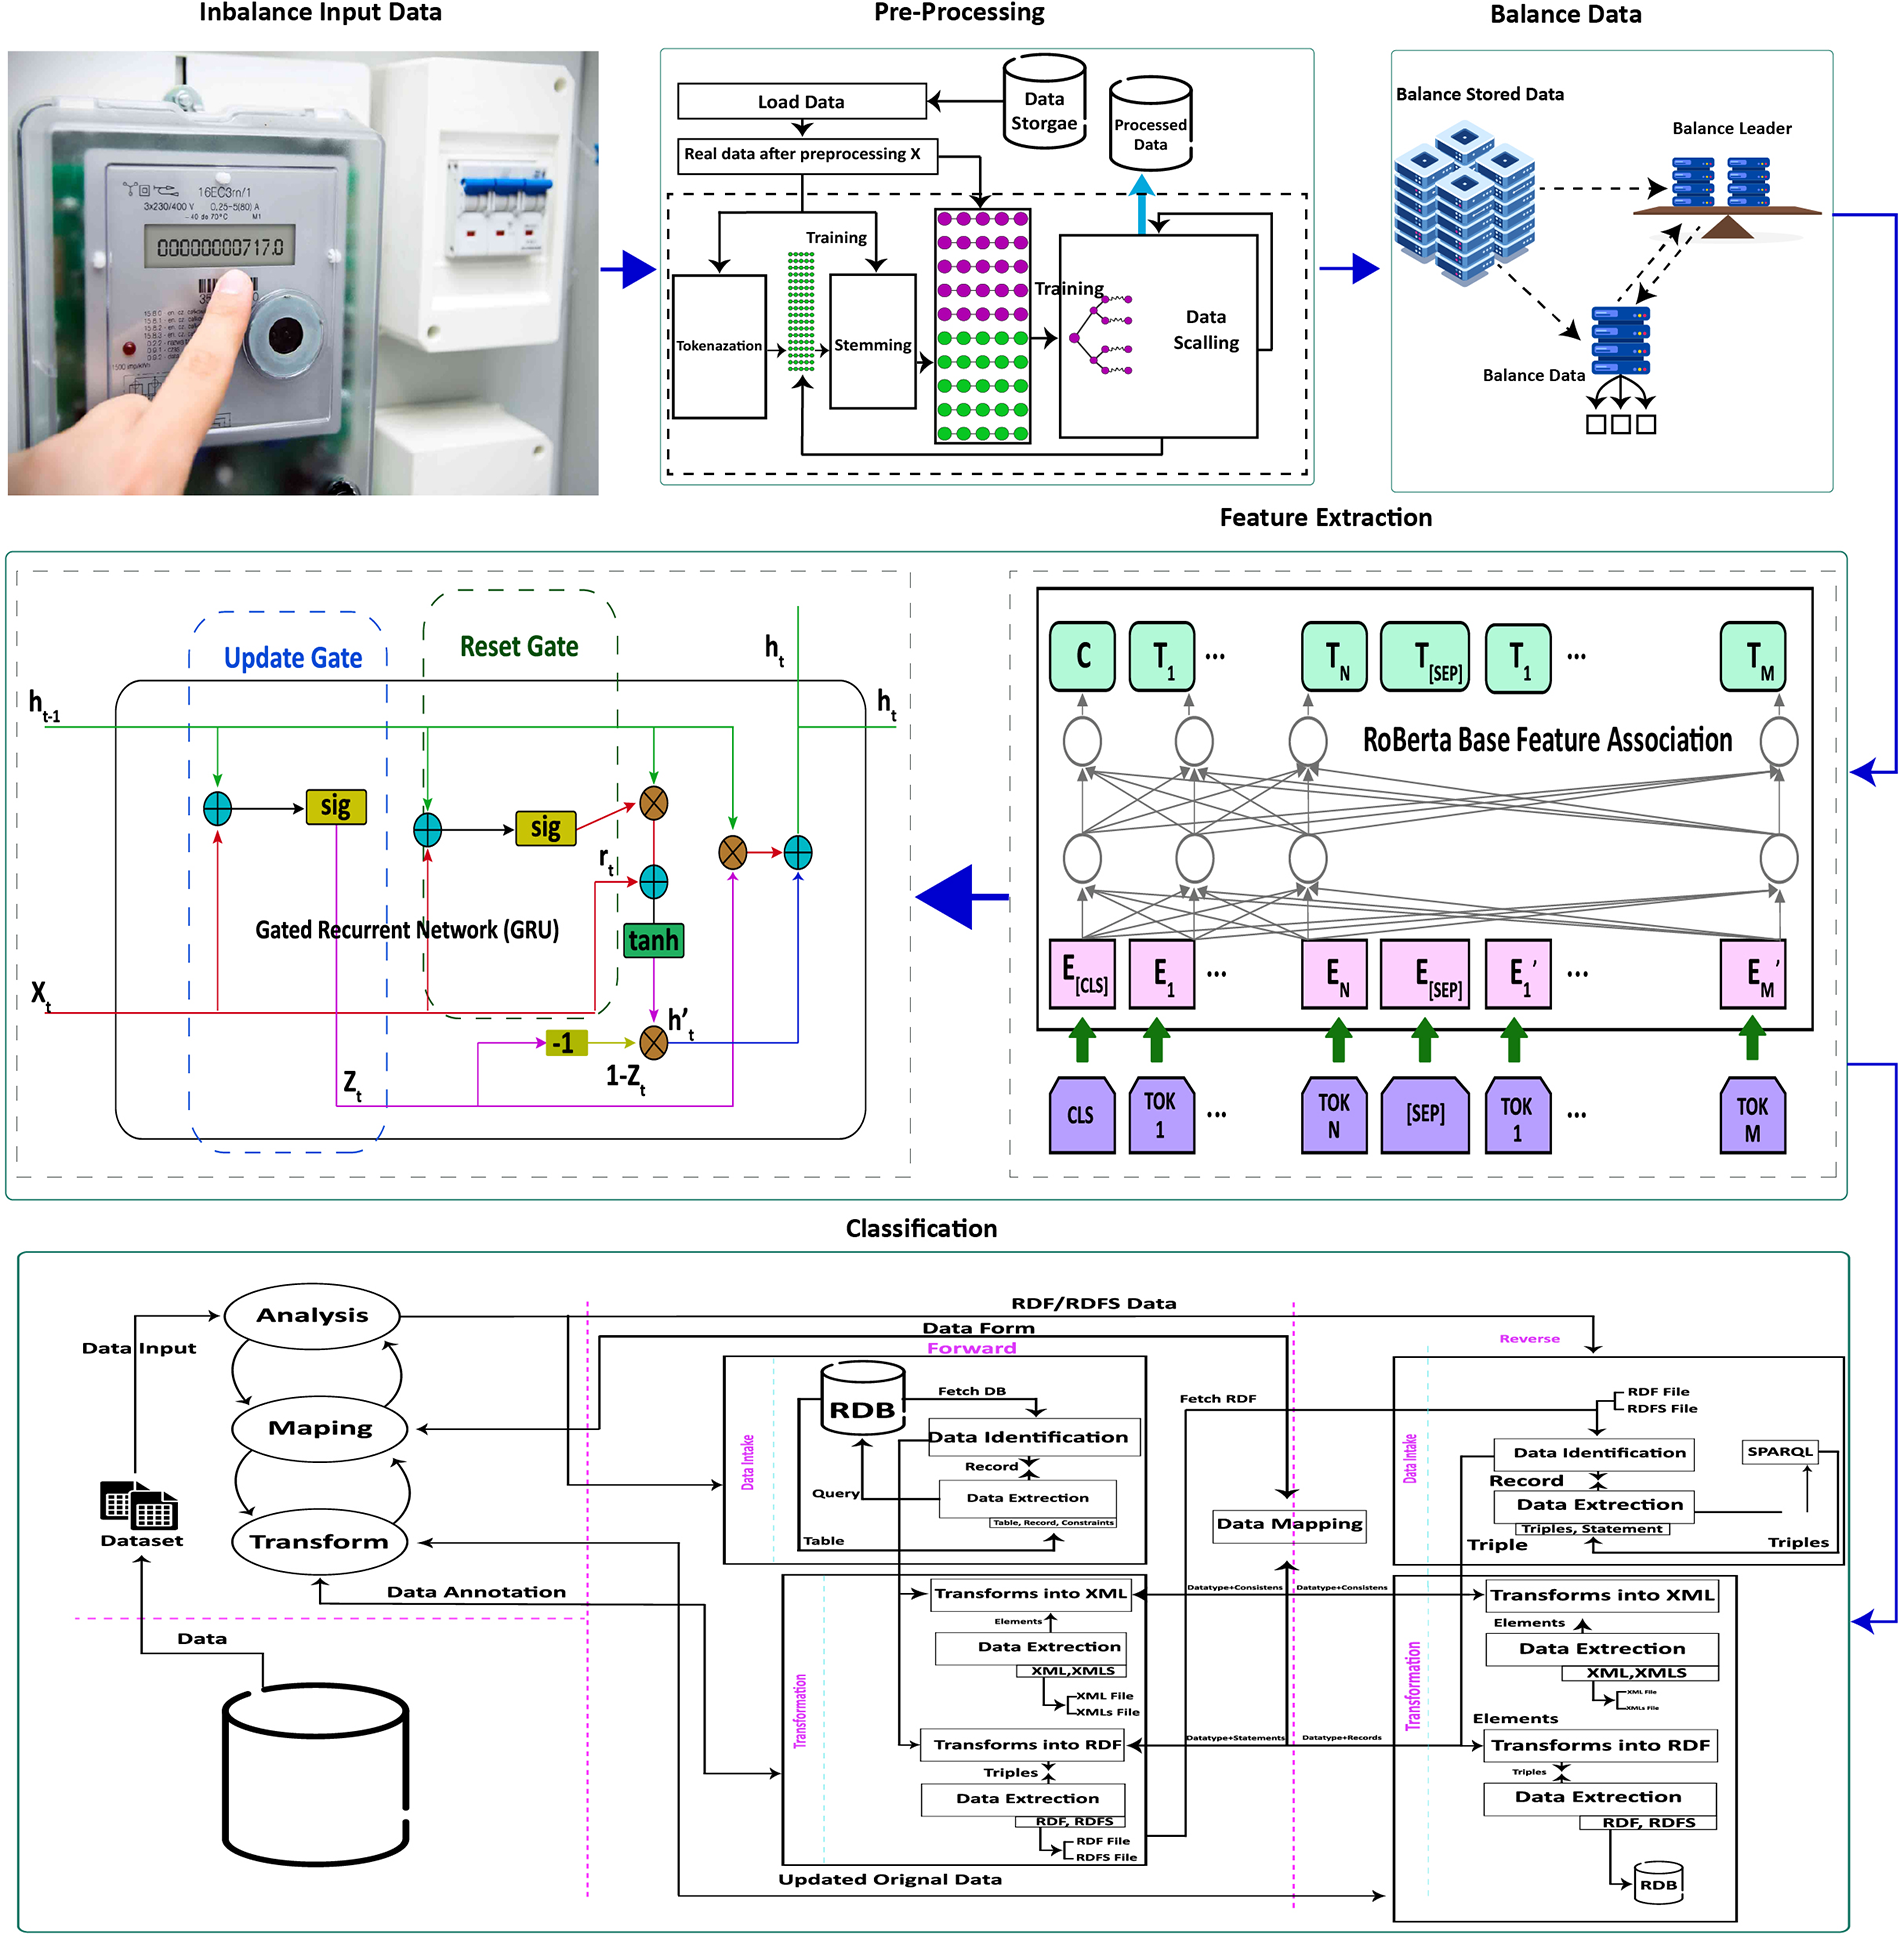
Figure 3: The proposed conceptual model for electricity theft detection
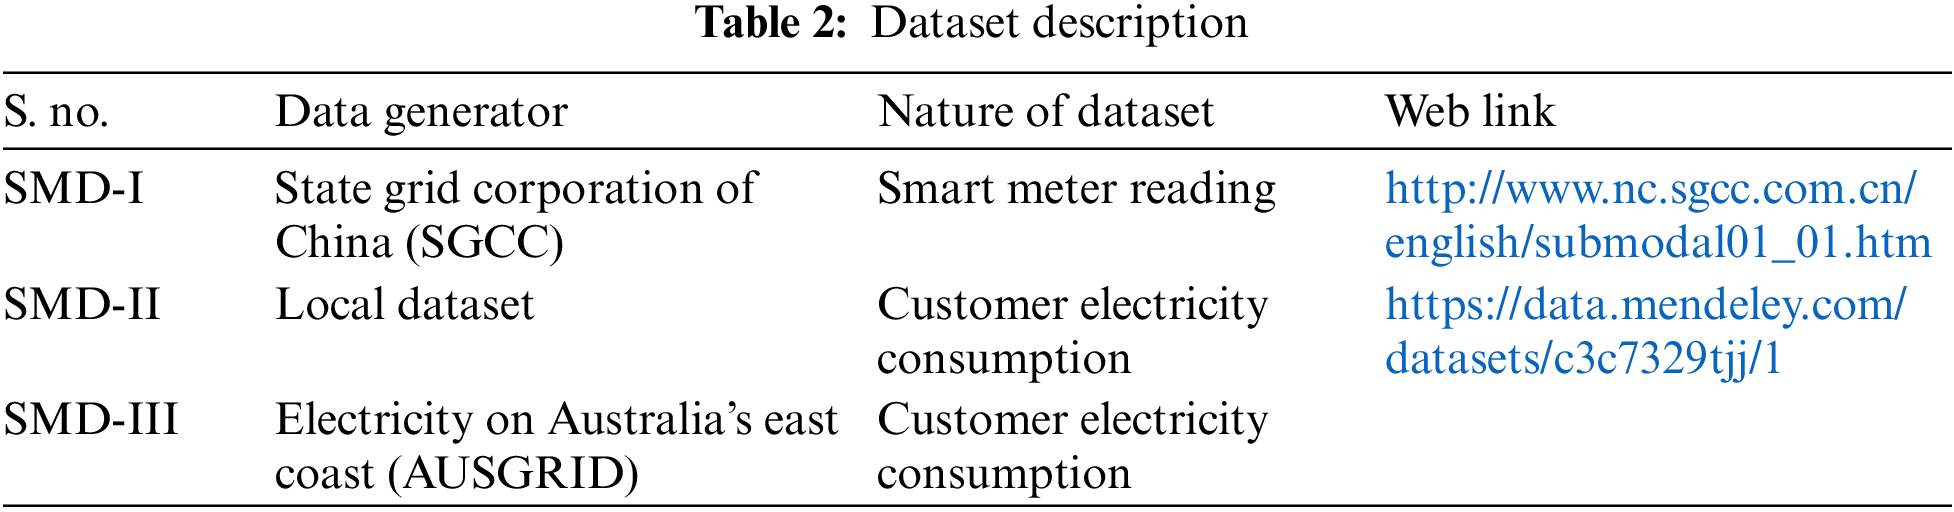
Three distinct varieties of datasets were utilized for this research study. The very first data sets have been collected from real power use by customers and were provided by State Grid Corporation of China (SGCC) [23]. The dataset is supplied in a numerical format, with the customer ID, the days of the week and the quantities of energy (electrical signals) consumed by each consumer over a two-year period. This dataset has labeled classes in which the users are split into normal users (8562) and theft users (1394), respectively. In addition, any missing or faulty information is also presented in a numerical format. The second dataset was collected from the work [24] through public request, which consisted of records of energy use from 560,640 industrial and residential customers. The dataset consists of one normal class while six different theft classes whose instances 331,824, 51,083, 22,958, 44,349, 41,460, 33,553, 35,413, respectively. They collected data on the amount of electricity utilized over a period of ten minutes using a smart meter from May 2019 to April 2020. The third dataset was collected from Shi et al. [20], who gathered it from the Ausgrid dataset and the SOLCAST website. This was the last but not the least of the three datasets. The Ausgrid dataset is a genuine dataset that was made available for public use by Ausgrid, the most significant electricity distributor operating along the eastern coast of Australia. This dataset includes real measurements of power usage and generation that were recorded every 30 min by a group of consumers situated in the cities of Sydney and New South Wales in Australia. These customers’ homes are outfitted with solar panels on the rooftops. The time period covered by these readings is from 01 July 2021 to 30 June 2022. The statistical information for each dataset is provided in Table 2.
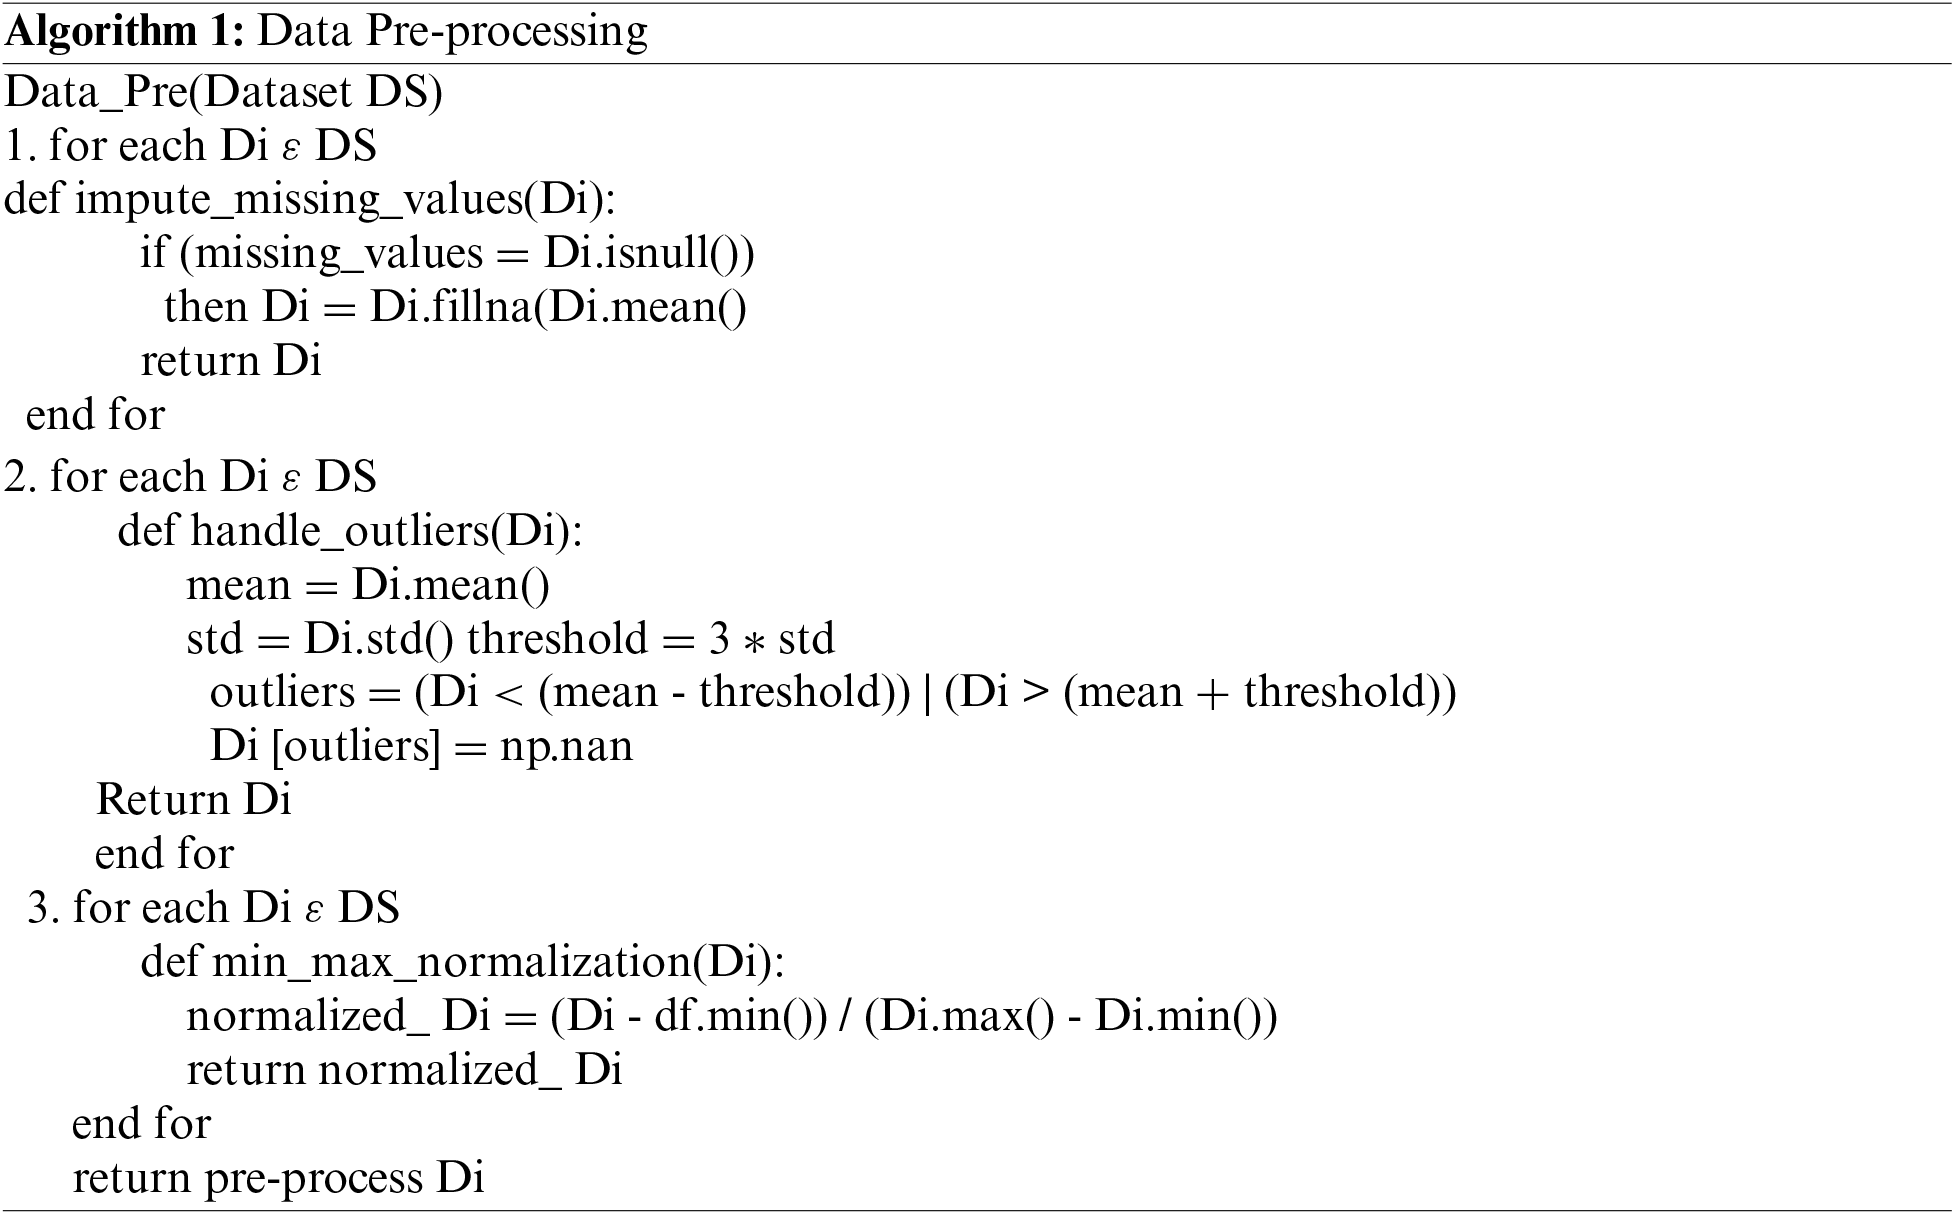
The fundamental goal of pre-processing is to provide the standardized structure to the electricity theft data before the model is trained and tested. The pre-processing includes data normalization, addressing outliers, and filling in missing values. Algorithm 1 shows the data pre-processing in which different measures has been utilized to pre-process the data. In the first phase, The Data Frame’s missing values are replaced with the mean of the non-missing values using the missing not at random (MNAR) algorithm [25]. After which, a three sigma function is applied to handle the outlier that behaves very differently from the other values and degrade the performance of classification model. Lastly, man-max normalization [26] is applied to scale each value into the range of 0 and 1 to avoid the diverse nature of the dataset.
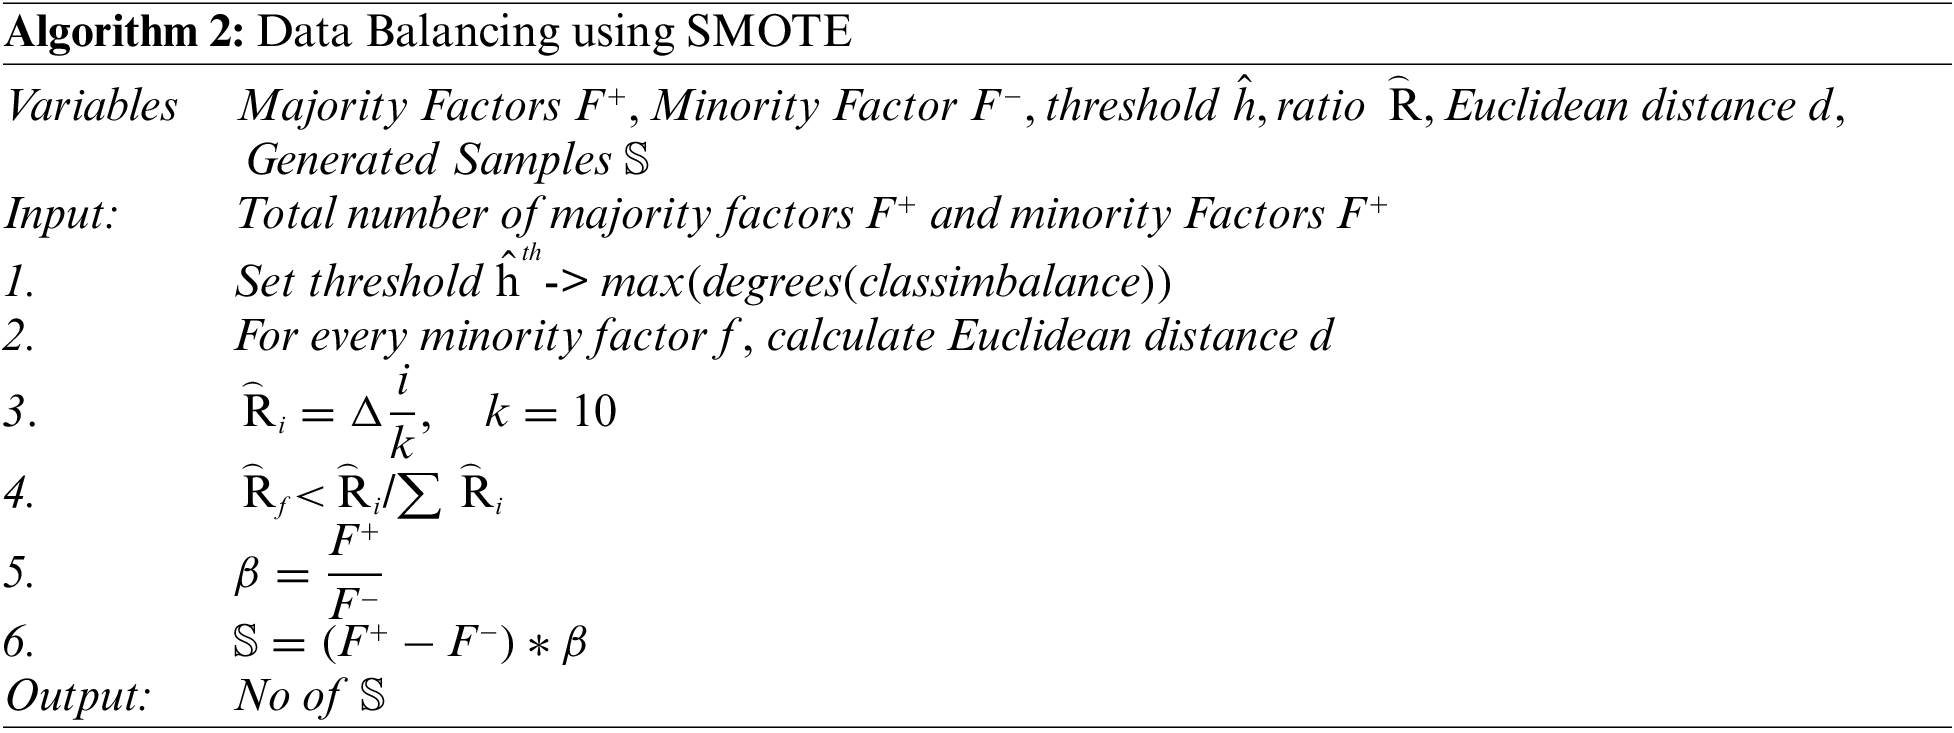
It is observed that normal electricity customers outnumber aberrant consumers in real-world circumstances. The scarcity of aberrant customers generates a problem of imbalanced data distribution, which degrade the efficiency of the deep learning models Moreover, it makes the classification models biased especially for the larger class. SMOTE [27] is a way to make new instances by changing current data and using a synthetic minority oversampling approach. The SMOTE method finds the close neighbor of the up-sampled data and then figures out the distance away they are from each other. After that, the distance is increased by a random number
The feature extraction process is crucial to the accurate classification. In this work the services of two well know algorithms Optimized BERT Pertaining Approach (RoBERTA) [28] and Gated Recurrent Units (GRU) [29]. The proposed hybrid model combines RoBERTa and GRU has the potential to capitalize on the strengths of both approaches. When working with sequential data, such as text, where both the contextual relationships between words (managed by RoBERTa) and the sequential dependencies inside the sequence (handled by GRU) are crucial, this combination can be extremely effective. RoBERTa captures the contextual relationships between words, while GRU manages the sequential dependencies. It is shown in Fig. 4.
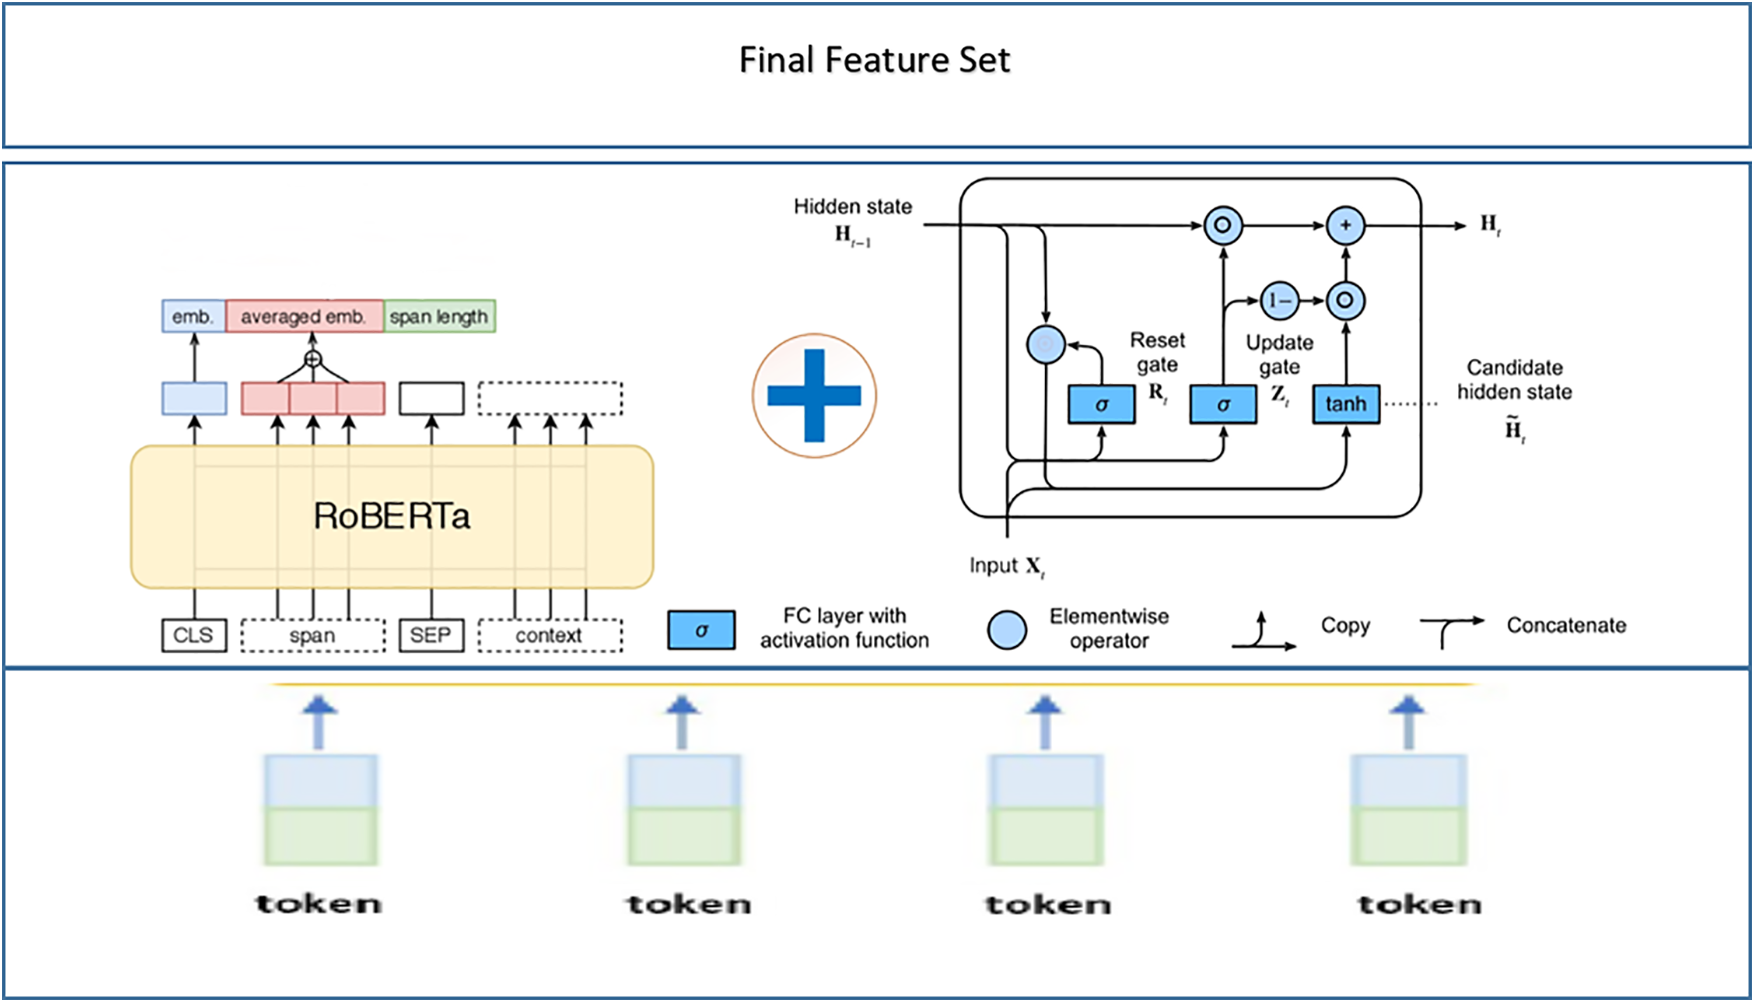
Figure 4: RoBERTAa-GRU based feature extraction process
At first, a RoBERTa-based feature extraction technique is conducted for which the pre-trained RoBERTa model is used to encode the input data sequences. With the attention mechanism the RoBERTa model output the contextualized word embedding that will capture the semantic information of the sequences that were supplied. On the other hand, the input sequences that have been preprocessed are also fed into the GRU model, which then extracts the hidden state of the GRU at the most recent time step. This hidden state reflects the learned feature representation of the sequence. Following the completion of the extraction process, each of the different features is then concatenated in order to simultaneously record the contextual data from RoBERTa and the sequential dependencies from GRU.
Transfer learning is a powerful machine learning technique that enables the application of knowledge gained from one task or domain to another related task or domain [30]. This involves using a pre-trained model on a large dataset that was originally trained for a different classification problem and adapting it to perform well on a new classification task. The advantage of transfer learning lies in the fact that deep learning models such as convolutional neural networks and recurrent neural networks learn hierarchical representations of data that can be generalized across different domains and tasks. This saves a lot of time and computational resources compared to training a model from scratch on a new dataset. To improve the training and testing accuracy of CNN and reduce losses, increasing the amount of data can be a helpful approach. All of these methods are effective and reliable [31].
The various layers of a Transfer learning model can be abstracted as:
• The Embedding (E) layer is the first layer in a Deep Neural Network (DNN), and its job is to turn the raw inputs into more manageable and compact units. This layer is responsible for serving as the foundation of the network. For the purpose of image classification, for instance, an image’s pixel values are used to represent the picture. In the same vein, a sentence in text classification is made up of individual words, each of which is represented as a d-dimensional vector (where ‘d’ is an integer). This layer is responsible for learning characteristics that are universal across all of the DNNs.
• A CNN is made up of many layers, the most important of which is the Convolutional (C) layer. It is made up of learnable filters or kernels, which are of a lower size in comparison to the data that are being input. It is possible to use many filters of varying diameters, each of which would concentrate on a relatively limited receptive field to get certain characteristics. For instance, one filter may learn to identify straight edges, whilst another filter may develop an expertise in recognizing curved edges inside an input picture. Both of these abilities would be useful in image processing. A filter with a size of two is able to learn characteristics associated to consecutive pairs of words when it is given text inputs. The convolutional layer’s transferrable features are formed by the weights of these filters.
• The Fully Connected Hidden (H) layer is a typical example of a hidden layer that may be located in a multi-layer perceptron and helps with higher-order decision-making. After receiving inputs from the layer below it, it then executes a dot product with a weight matrix, which is occasionally accompanied by a bias term, and then it executes a nonlinear activation function after that. The transferrable characteristics are in part due to the weights and biases that are included within this layer.
• The Output (O) layer is in charge of making the final determination, which may either be a continuous value (in the case of regression) or a class assignment (in the case of classification) to which the input belongs. This choice can be made in either scenario based on the kind of problem being solved. In a manner similar to that of the Hidden layer, the transferable characteristics of this layer are formed by the weights and biases.
If the target dataset contains labeled data, the settings may be fine-tuned after the various layers (E, C, H, and O) have been transferred. Alternately, if there is a shortage of labeled data, the parameters may be kept unchanged. This will prevent the layer from acquiring new knowledge and will bring the total size of the model down. Both the Fine-Tune (b) and Frozen () settings were used in the transfer tests that we carried out. With these parameters, we were able to explore the transferability of the many layers that are included inside a deep neural network. Fig. 5 is a graphical illustration of the hierarchical transfer process that occurs between a Source Model and a Transfer Model. During this process, layers are successively transferred and either Fine-Tuned (b) or Frozen (µ) depending on the model’s requirements.
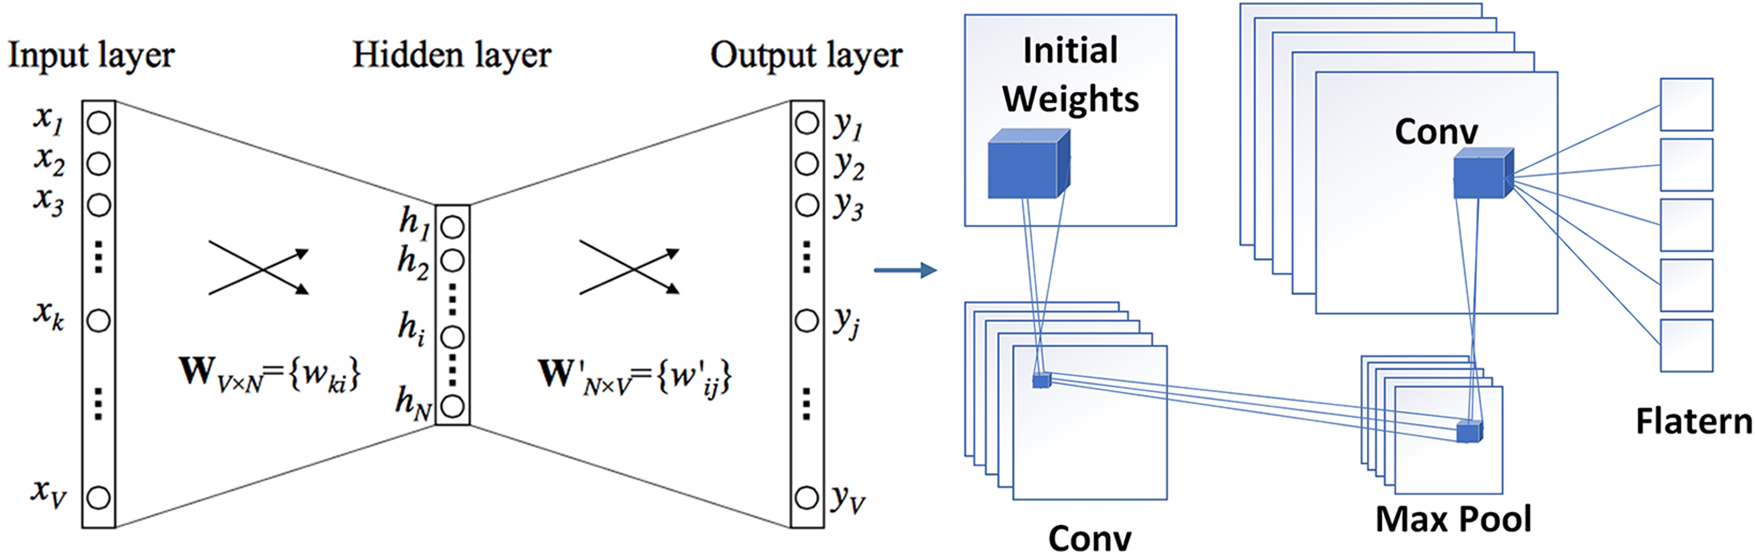
Figure 5: Transfer learning model
4 Experimental Results and Evaluation
This section gives an in-depth discussion of the results. In order to evaluate the precision and usefulness of the proposed system, a comprehensive set of tests was carried out. The functionality of the proposed system was evaluated with the use of five different benchmark datasets, all of which were derived from previously published works. The results of the experimental analysis showed that the performance of the suggested approach is superior to that of other cutting-edge techniques that are currently in use.
In order to assess how well the suggested model performs, we compare it to the baseline models that are described below by making use of the data sets that are shown in Table 2.
• Baseline 1: Nawaz et al. [15] proposed a technique that were based on ensemble model consisting of CNN and XGboost.
• Baseline 2: Xia et al. [18] proposed a technique that is based on the Convolutional Long Term Short Term Neural Networks.
• Baseline 3: Haq et al. [24] proposed a deep-CNN based approach for electricity theft detection using Smart Meters.
Three different types of performance metrics is used to evaluate the performance of proposed method.
Initially, Accuracy, F1-Score, precision, and recall were used as classification metrics to assess the suggested model. These measures’ respective formulations are provided in Eqs. (1)–(4).
4.2.2 Matthews Correlation Coefficient (MCC)
MCC is basically used to evaluate performance of a problem having binary classification. A confusion matrix’s parameters can be used to extract the MCC, which is a single integer. Eq. (5) illustrates MCC calculation.
The binary classification model’s accuracy in properly predicting positive and negative instances while accounting for the imbalance between the two classes is represented by the MCC range, which ranges from −1 to +1. A perfect MCC score of +1 indicating a perfect prediction. A score of 0 for the MCC indicates that the model is unable to adequately distinguish between positive and negative examples. While negative MCC score of −1 denotes that the model is acting in a completely ineffective manner.
In binary classification tasks, the loss function known as Binary Cross Entropy (BCE) is frequently utilized. It calculates the difference between the true binary labels indicated by Pi and the expected probability distribution by Qi. The formula for calculating the cross entropy is expressed in Eqs. (6) and (7).
The formula for calculating the cross entropy is expressed in Eq. (6).
As the forecast gets closer to being correct, the cross-entropy falls toward zero. When only two classes are classified using the classification model, only two probabilities are used in the loss computation. The definition of it in mathematics is
BCE determines the average dissimilarity or inaccuracy by comparing the model’s predicted probabilities with the actual binary labels.
The very first experiment shows the efficiency of a proposed method for electricity theft detection, by measuring its precision, accuracy, and recall. The experimental results depicts the performance of the proposed approach across different datasets. Fig. 6 is demonstrating that the proposed technique achieved high scores on all datasets, indicating impressive results in terms of precision, accuracy, and recall across each dataset.
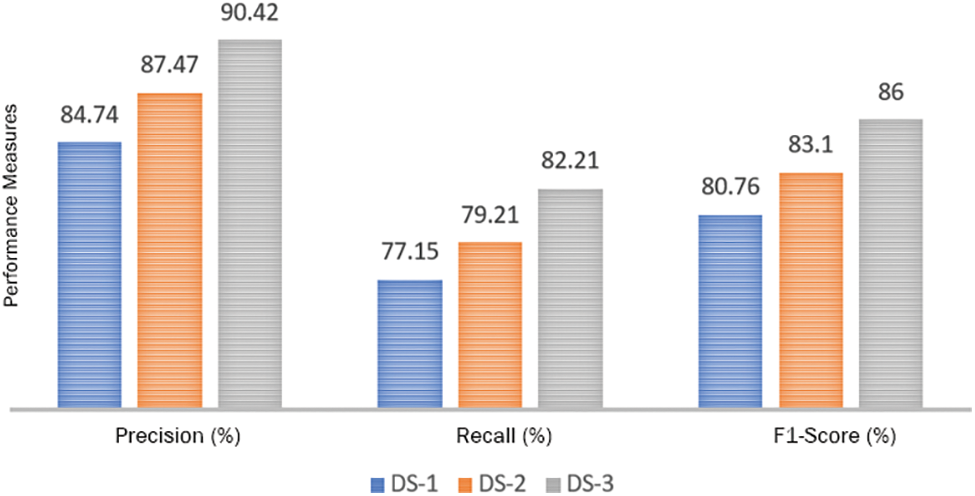
Figure 6: Performance measures of RoGRUT on different datasets
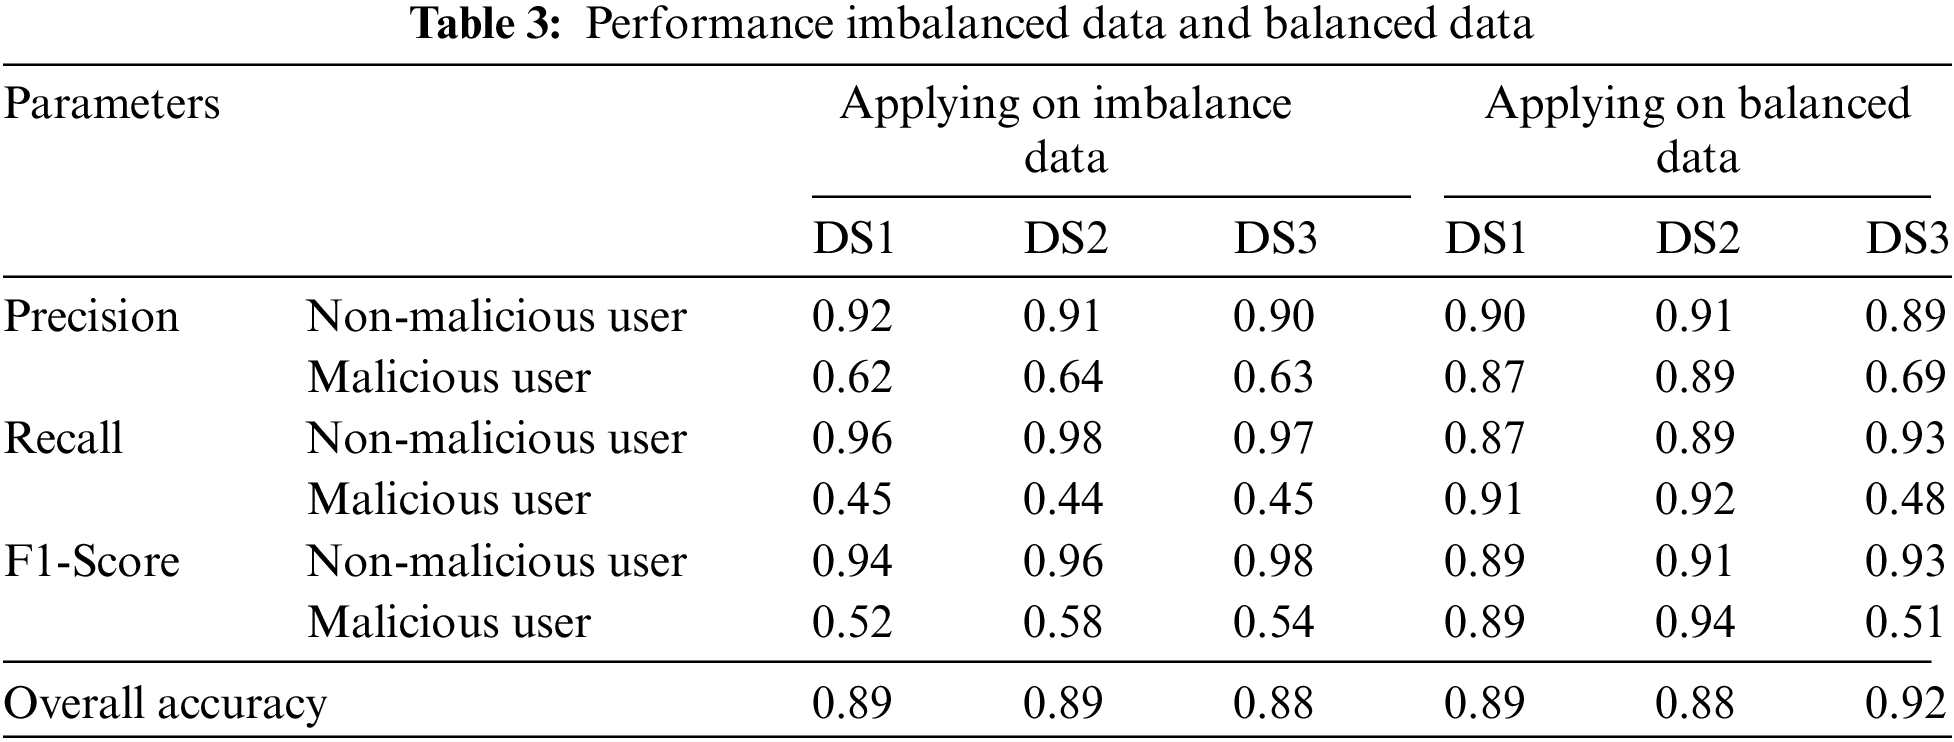
As far as imbalance data was presented to the model, it could not classify the fraud users efficiently as compared to testing the model on synthetic data. Table 3 gives the insight of performance parameters in both cases of imbalance data and synthetic data.
In this experiment we use Matthews correlation coefficient (MCC), which is another extensively used statistic for binary classification. Three more performance metrics are displayed vs. the number of epochs in Fig. 7. The train loss and accuracy increased as the number of epochs increased, however the validation loss increased and accuracy showed a decreasing trend. As the model was not generalized for the unknown data, it overfits in this instance.
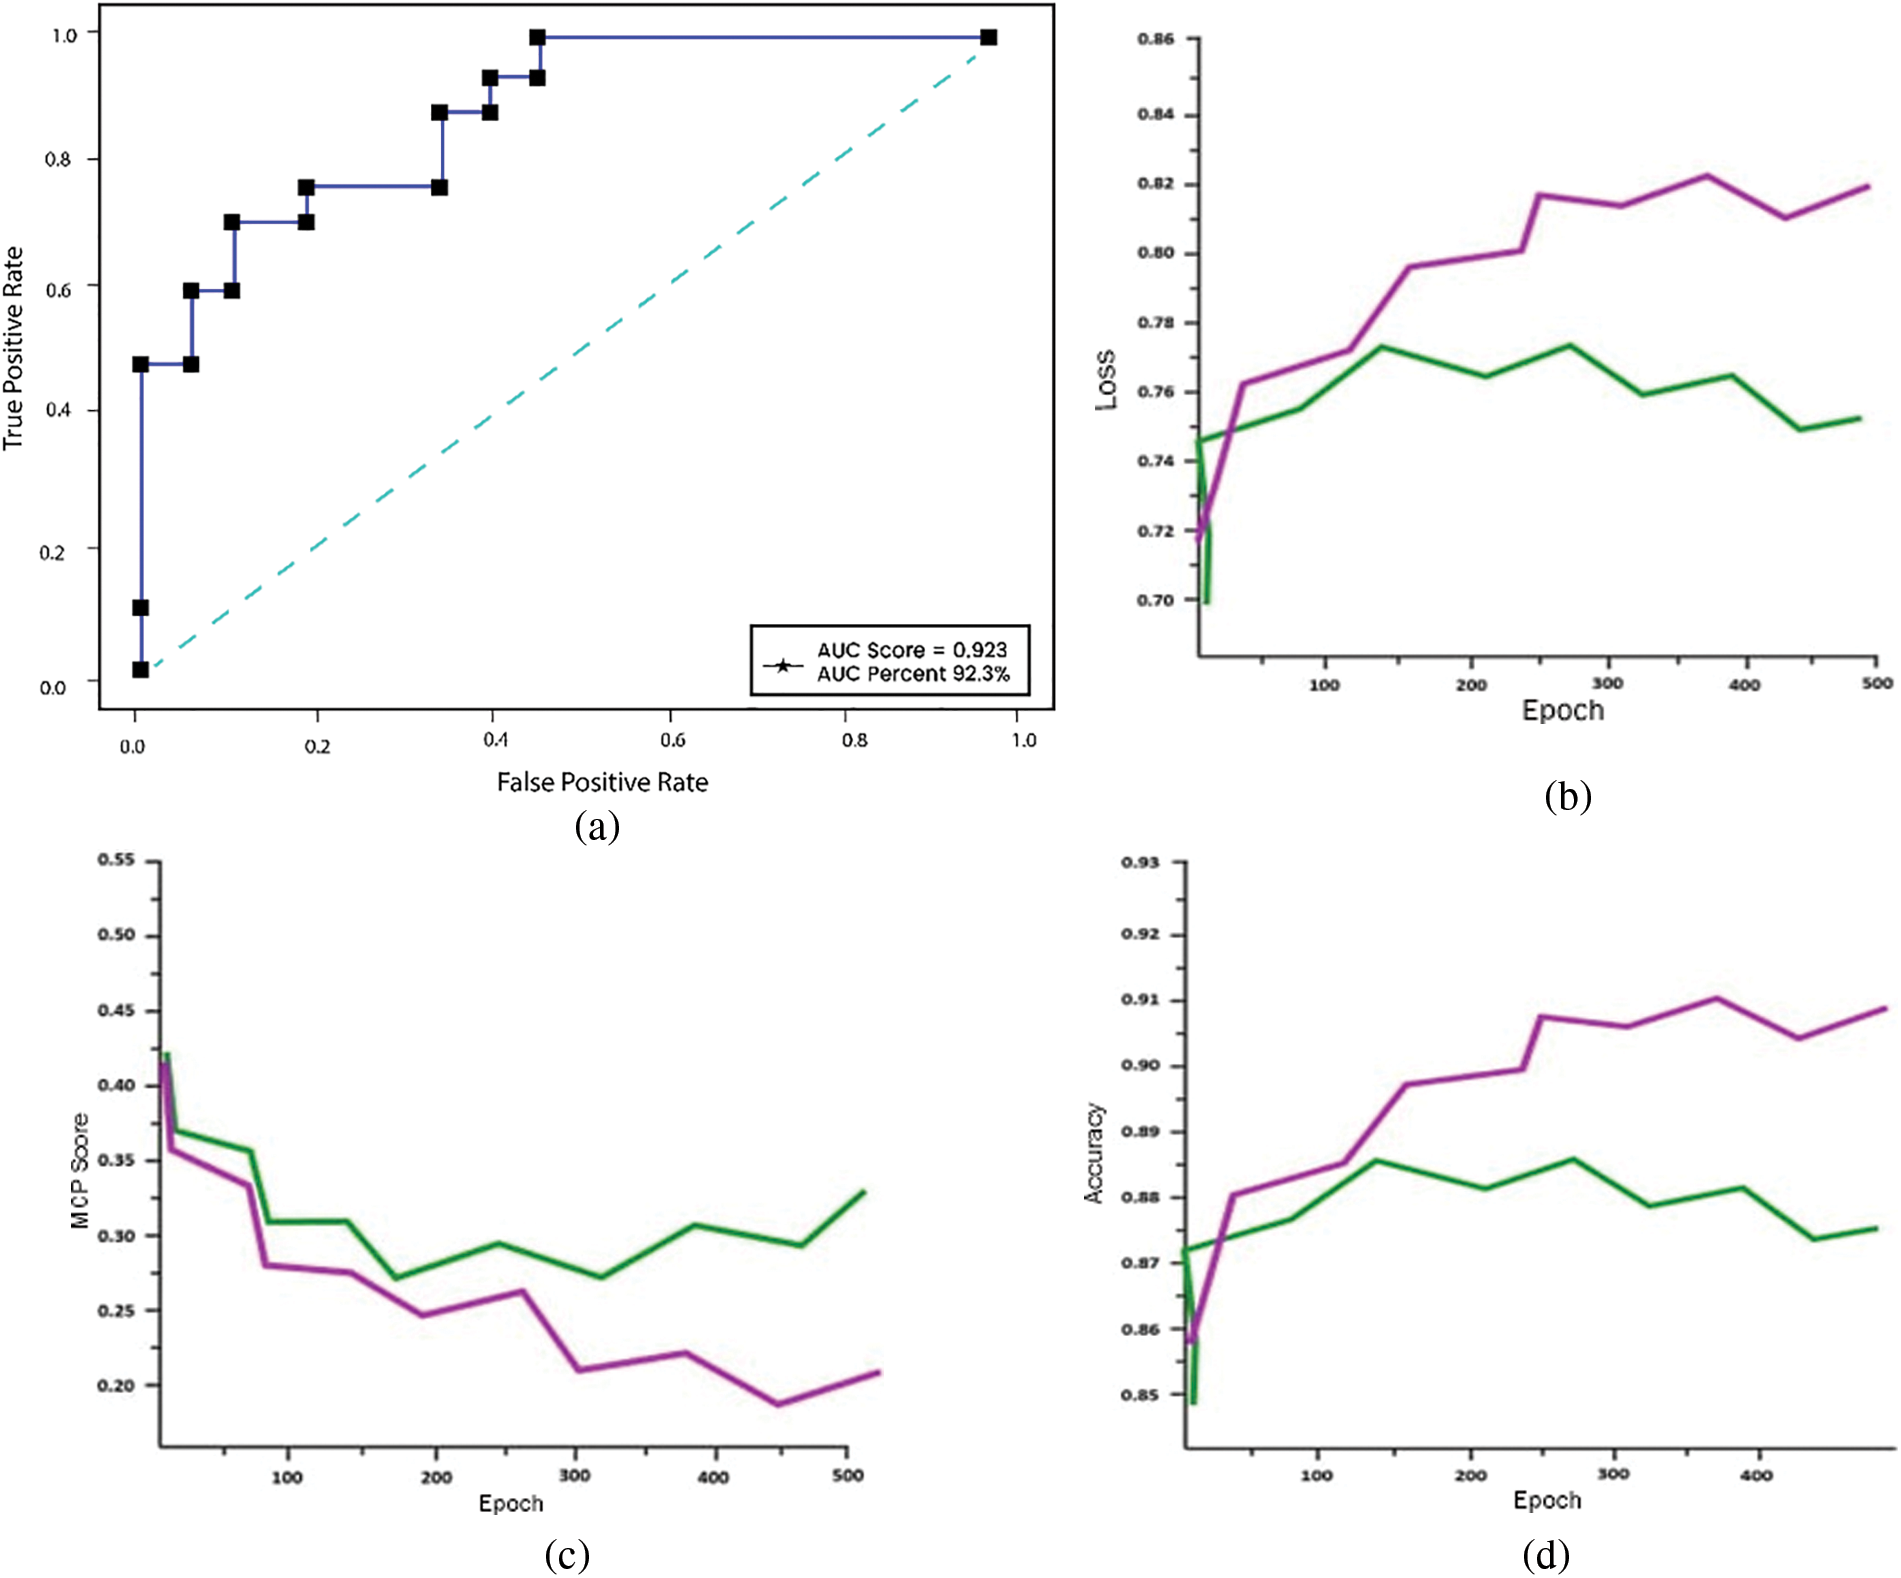
Figure 7: (a) ROC, (b) loss, (c) MCP and (d) accuracy on balanced dataset
The MCC is widely applied in situations in which the datasets in question are imbalanced. As can be observed in Table 2, the accuracy numbers for regular users and theft users who do not utilize SMOTE are inconsistent with one another. This is the case despite the fact that overall accuracy was roughly the same before and after SMOTE was implemented. This is because, despite the model having a high level of accuracy, the dataset being used in the test is not evenly distributed, which prevents the model from effectively classifying the data. After putting in place the SMOTE to generate synthetic data, the model is next trained with the newly produced dataset. The outcomes of the training are shown in Fig. 7, which uses the balanced dataset. In the case of patterns that are identical to one another, the train set and the test set do not include any divergent patterns. The pattern of the test’s accuracy did not change after the first 500 epochs, and after the first 600 epochs, it had an accuracy rate of 89%. In addition, the test loss seemed to stay the same after the same amount of epochs passed. The MCC for the test set also obtained a value of 0.82, which indicates that the model is able to make accurate predictions.
4.4 Comparison to Existing Models
The performance of proposed model was compared with baseline models as already mentioned in baseline methods sections.
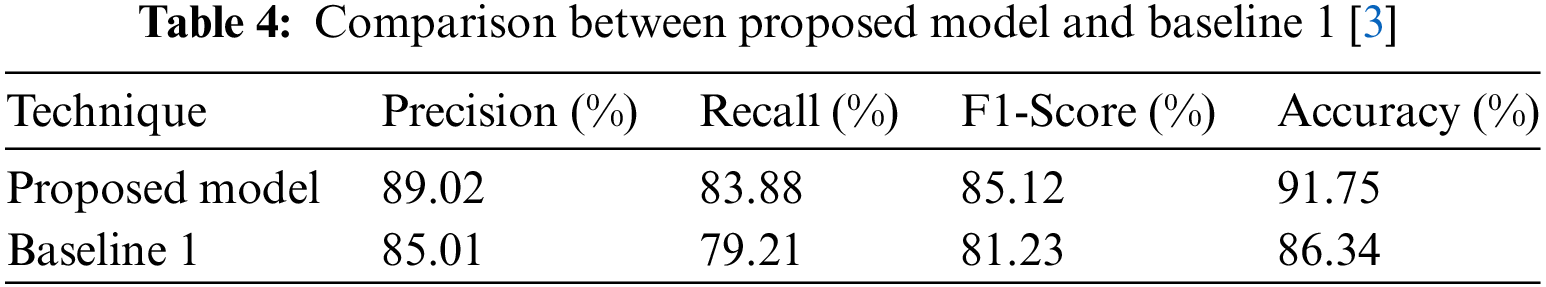
Table 4 gives insight of the performance comparison of a proposed technique with a baseline technique [3]. The proposed technique attained a precision of 89.02%, recall of 83.88%. The F1-Score was calculated to be 85.12%. The accuracy of our proposed model was 91.75%. The Baseline 1 model, on the other hand gained an accuracy of 86.34%, a precision of 85.01%, a recall of 79.21%, and an F1-Score of 81.23%. The improved results show the effectiveness of proposed model in terms of used measures.
The proposed model outperforms the baseline models [3,6,12] in terms of precision, recall, F1-Score, and accuracy as shown in the Fig. 8. These results indicate that the proposed method shows promise and may be a viable option for the current endeavor. To validate its superiority and determine its viability for real-world applications, however, additional analysis and evaluation are necessary.
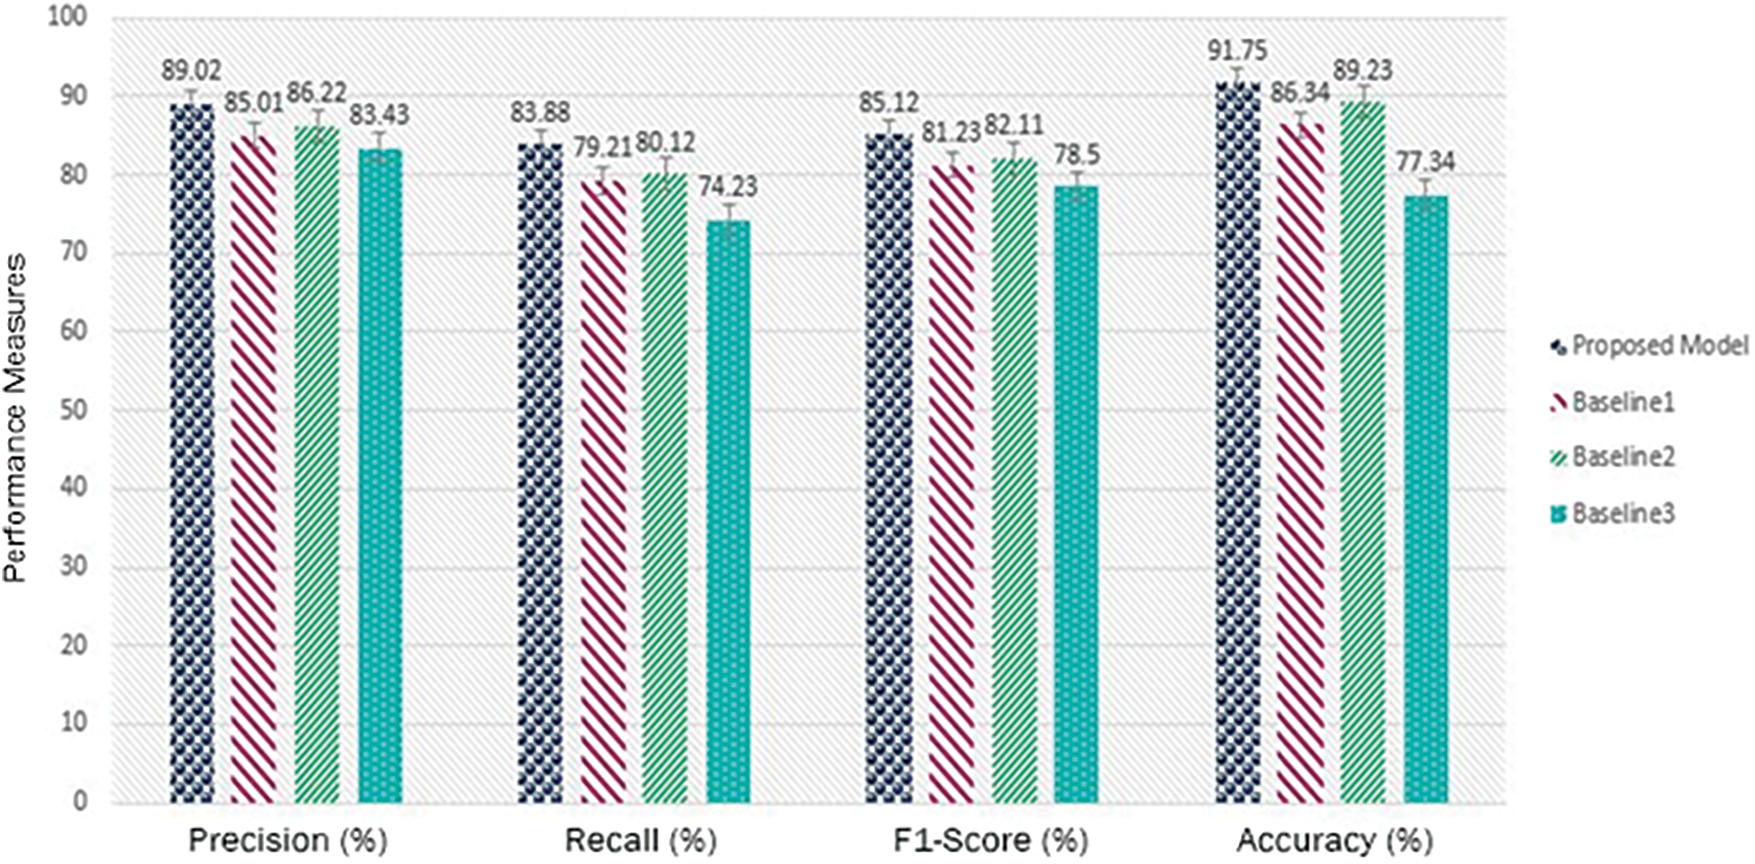
Figure 8: Comparisons of RoGRUT with baseline approaches
Electricity theft is a common non-technical problem that harms electricity users as well as power infrastructure. It affects consumers’ high energy costs, hinders the ability of utility firms to expand economically, and causes electrical concerns. The development of smart grids is essential for the detection of power theft since these systems generate massive amounts of data, such as details about client use that may be utilized to detect electricity theft using machine learning and deep learning methods. There are also other options, such as hardware-based ones that can detect electricity theft but may need expensive technology and human resources. The identification of electricity theft has also been attempted using computer-based methods such as machine learning, deep learning (DL), and statistical approaches; however, these methods perform poorly due to the dimensionality curse, class imbalance problem, and insufficient hyper-parameter tuning. In this study, a hybrid deep learning model called RoGRUT is provided to identify electricity theft. The RoGRUT's main processes include feature extraction, final theft detection, and data preprocessing that addresses the issue of class imbalance. The near miss for class imbalance, the curse of dimensionality issue, and transfer learning for classification are all dealt with using various advanced level models, such as RoBERTa. Using data from actual smart meters, the RoGRUT’s efficacy is assessed. The RoGRUT gets the best classification results when compared to its rivals, according to a sizable number of simulations. The proposed model demonstrated the following performance metrics: accuracy of 88%, precision of 86%, recall of 84%, F1-score of 85%, Matthew correlation coefficient of 78%, and area under the curve of 91%.
Acknowledgement: None.
Funding Statement: This research work is funded by a grant from the Center of Excellence in Information Assurance (CoEIA), KSU.
Author Contributions: Study conception and design, data collection, draft manuscript preparation: Farah Mohammad, analysis and interpretation of results, supervision: Saad Al-Ahmadi, validation, supervision: Jalal Al-Muhtadi. All authors reviewed the results and approved the final version of the manuscript.
Availability of Data and Materials: Not applicable.
Conflicts of Interest: The authors declare that they have no conflicts of interest to report regarding the present study.
References
1. S. Nirmal, P. Patil, and J. R. R. Kumar, “CNN-AdaBoost based hybrid model for electricity theft detection in smart grid,” e-Prime-Adv. Electr. Eng., Electron. Energy, vol. 7, no. 1, pp. 100452, 2024. [Google Scholar]
2. G. Prasad, Y. Huo, L. Lampe, and V. C. Leung, “Machine learning based physical-layer intrusion detection and location for the smart grid,” in 2019 IEEE Int. Conf. on Commun., Control, Comput. Technol. Smart Grids, Beijing, China, 2019, pp. 1–6. [Google Scholar]
3. Z. Shi et al., “Artificial intelligence techniques for stability analysis and control in smart grids: Methodologies, applications, challenges and future directions,” Appl. Energy, vol. 278, no. 1, pp. 115733, 2020. doi: 10.1016/j.apenergy.2020.115733. [Google Scholar] [CrossRef]
4. Z. Qadir et al., “Predicting the energy output of hybrid PV-wind renewable energy system using feature selection technique for smart grids,” Energy Rep., vol. 7, no. 1, pp. 8465–8475, 2021. doi: 10.1016/j.egyr.2021.01.018. [Google Scholar] [CrossRef]
5. M. Asif, M. U. Javed, and A. S. Yahaya, “AlexNet adaboost and artificial bee colony based hybrid model for electricity theft detection in smart grids,” IEEE Access, vol. 10, pp. 18681–18694, 2022. doi: 10.1109/ACCESS.2022.3150016. [Google Scholar] [CrossRef]
6. K. Naim, B. Khelifa, and B. Fateh, “A cryptographic-based approach for electricity theft detection in smart grid,” Comput. Mater. Contin., vol. 63, no. 1, pp. 97–117, 2020. doi: 10.32604/cmc.2020.09391. [Google Scholar] [CrossRef]
7. J. L. Gallardo, M. A. Ahmed, and N. Jara, “Clustering algorithm-based network planning for advanced metering infrastructure in smart grid,” IEEE Access, vol. 9, pp. 48992–49006, 2021. doi: 10.1109/ACCESS.2021.3068752. [Google Scholar] [CrossRef]
8. P. Jokar, N. Arianpoo, and V. C. Leung, “Electricity theft detection in AMI using customers’ consumption patterns,” IEEE Trans. Smart Grid, vol. 7, no. 1, pp. 216–226, 2015. doi: 10.1109/TSG.2015.2425222. [Google Scholar] [CrossRef]
9. X. Huang, Z. Qin, and H. Liu, “A survey on power grid cyber security: From component-wise vulnerability assessment to system-wide impact analysis,” IEEE Access, vol. 6, pp. 69023–69035, 2018. doi: 10.1109/ACCESS.2018.2879996. [Google Scholar] [CrossRef]
10. S. N. Lighari, B. B. Jensen, D. M. A. Hussain, and A. A. Shaikh, “Attacks and their defenses for advanced metering infrastructure,” in 2014 6th Int. Congr. Ultra Mod. Telecommun. Control Syst. Workshops (ICUMT), Petersburg, Russia, 2014, pp. 148–151. [Google Scholar]
11. N. S. V. Rao, S. W. Poole, C. Y. T. Ma, F. He, J. Zhuang, and D. K. Y. Yau, “Defense of cyber infrastructures against cyber-physical attacks using game-theoretic models,” Risk Anal., vol. 36, no. 4, pp. 694–710, 2016. doi: 10.1111/risa.12362. [Google Scholar] [PubMed] [CrossRef]
12. A. Gholami, T. Shekari, M. H. Amirioun, F. Aminifar, M. H. Amini, A. Sargolzaei, “Toward a consensus on the definition and taxonomy of power system resilience,” IEEE Access, vol. 6, pp. 32035–32053, 2018. doi: 10.1109/ACCESS.2018.2845378. [Google Scholar] [CrossRef]
13. R. K. Ahir and B. Chakraborty, “Pattern-based and context-aware electricity theft detection in smart grid,” Sustain. Energy, Grids Netw., vol. 32, no. 1, pp. 100833, 2022. [Google Scholar]
14. A. Ullah, N. Javaid, M. Asif, M. U. Javed, and A. S. Yahaya, “Alexnet, adaboost and artificial bee colony based hybrid model for electricity theft detection in smart grids,” IEEE Access, vol. 10, pp. 18681–18694, 2022. doi: 10.1109/ACCESS.2022.3150016. [Google Scholar] [CrossRef]
15. A. Nawaz, T. Ali, G. Mustafa, S. U. Rehman, and M. R. Rashid, “A novel technique for detecting electricity theft in secure smart grids using CNN and XG-boost,” Intell. Syst. Appl., vol. 17, no. 1, pp. 200168, 2023. doi: 10.1016/j.iswa.2022.200168. [Google Scholar] [CrossRef]
16. M. N. Hasan, R. N. Toma, A. A. Nahid, M. M. Islam, and J. M. Kim, “Electricity theft detection in smart grid systems: A CNN-LSTM based approach,” Energies, vol. 12, no. 17, pp. 3310, 2019. doi: 10.3390/en12173310. [Google Scholar] [CrossRef]
17. L. J. Lepolesa, S. Achari, and L. Cheng, “Electricity theft detection in smart grids based on deep neural network,” IEEE Access, vol. 10, pp. 39638–39655, 2020. doi: 10.1109/ACCESS.2022.3166146. [Google Scholar] [CrossRef]
18. X. Xia et al., “ETD-ConvLSTM: A deep learning approach for electricity theft detection in smart grids,” IEEE Trans. Inf. Forensics Secur., vol. 18, no. 1, pp. 56–92, 2023. [Google Scholar]
19. S. Munawar, N. Javaid, Z. A. Khan, N. I. Chaudhary, M. A. Raja et al., “Electricity theft detection in smart grids using a hybrid BiGRU-BiLSTM model with feature engineering-based preprocessing,” Sens., vol. 22, no. 20, pp. 7818, 2022. doi: 10.3390/s22207818. [Google Scholar] [PubMed] [CrossRef]
20. J. Shi, Y. Gao, D. Gu, and Y. Li, “A novel approach to detect electricity theft based on convattentional transformer neural network,” Int. J. Electr. Power & Energy Syst., vol. 145, no. 1, pp. 108642, 2023. doi: 10.1016/j.ijepes.2022.108642. [Google Scholar] [CrossRef]
21. M. Irfan et al., “Energy theft identification using adaboost ensembler in the smart grids,” Comput. Mater. Contin., vol. 72, no. 1, pp. 2141–2158, 2022. doi: 10.32604/cmc.2022.025466. [Google Scholar] [CrossRef]
22. S. Y. Appiah, E. K. Akowuah, V. C. Ikpo, and A. Dede, “Extremely randomised trees machine learning model for electricity theft detection,” Mach. Learn. Appl., vol. 12, no. 1, pp. 100458, 2023. doi: 10.1016/j.mlwa.2023.100458. [Google Scholar] [CrossRef]
23. S. Zidi, A. Mihoub, S. M. Qaisar, M. Krichen, and Q. A. Al-Haija, “Theft detection dataset for benchmarking and machine learning based classification in a smart grid environment,” J. King Saud Univ.—Comput. Inf. Sci., vol. 35, no. 1, pp. 13–25, 2023. doi: 10.1016/j.jksuci.2022.05.007. [Google Scholar] [CrossRef]
24. E. U. Haq, C. Pei, R. Zhang, H. Jianjun, and F. Ahmad, “Electricity-theft detection for smart grid security using smart meter data: A deep-CNN based approach,” Energy Rep., vol. 9, no. 1, pp. 634–643, 2023. doi: 10.1016/j.egyr.2022.11.072. [Google Scholar] [CrossRef]
25. A. Nawaz, A. A. Awan, T. Ali, and M. R. R. Rana, “Product’s behaviour recommendations using free text: An aspect based sentiment analysis approach,” Cluster Comput., vol. 23, no. 1, pp. 1267–1279, 2020. doi: 10.1007/s10586-019-02995-1. [Google Scholar] [CrossRef]
26. P. Mishra, A. Biancolillo, J. M. Roger, F. Marini, and D. N. Rutledge, “New data preprocessing trends based on ensemble of multiple preprocessing techniques,” Trends Analyt. Chem., vol. 132, no. 1, pp. 116045, 2020. doi: 10.1016/j.trac.2020.116045. [Google Scholar] [CrossRef]
27. L. Camacho, G. Douzas, and F. Bacao, “Geometric SMOTE for regression,” Expert. Syst. Appl., vol. 21, no. 1, pp. 116387, 2022. doi: 10.1016/j.eswa.2021.116387. [Google Scholar] [CrossRef]
28. C. H. E. N. Gang, “Government hotline work-order classification fusing RoBERTa and feature extraction,” Comput. Modernization, vol. 4, no. 1, pp. 21, 2022. [Google Scholar]
29. O. Youme, T. Bayet, J. M. Dembele, and C. Cambier, “Deep learning and remote sensing: Detection of dumping waste using UAV,” Procedia Comput. Sci., vol. 185, no. 1, pp. 361–369, 2021. doi: 10.1016/j.procs.2021.05.037. [Google Scholar] [CrossRef]
30. K. Weiss, T. M. Khoshgoftaar, and D. Wang, “A survey of transfer learning,” J. Big Data, vol. 3, no. 1, pp. 1–40, 2016. doi: 10.1186/s40537-016-0043-6. [Google Scholar] [CrossRef]
31. T. M. Ghazal and G. Issa, “Alzheimer disease detection empowered with transfer learning,” Comput. Mater. Contin., vol. 70, no. 3, pp. 5005–5019, 2022. doi: 10.32604/cmc.2022.020866. [Google Scholar] [CrossRef]
Cite This Article
 Copyright © 2024 The Author(s). Published by Tech Science Press.
This work is licensed under a Creative Commons Attribution 4.0 International License , which permits unrestricted use, distribution, and reproduction in any medium, provided the original work is properly cited.
 Downloads
 Citation Tools