 Open Access
ARTICLE
Nonparametric Statistical Feature Scaling Based Quadratic Regressive Convolution Deep Neural Network for Software Fault Prediction
School of Computer Science Engineering and Information Systems, Vellore Institute of Technology, Vellore, 632014, India
* Corresponding Author: Venkatesh Palanisamy. Email:
Computers, Materials & Continua 2024, 78(3), 3469-3487. https://doi.org/10.32604/cmc.2024.047407
Received 04 November 2023; Accepted 08 January 2024; Issue published 26 March 2024
Abstract
The development of defect prediction plays a significant role in improving software quality. Such predictions are used to identify defective modules before the testing and to minimize the time and cost. The software with defects negatively impacts operational costs and finally affects customer satisfaction. Numerous approaches exist to predict software defects. However, the timely and accurate software bugs are the major challenging issues. To improve the timely and accurate software defect prediction, a novel technique called Nonparametric Statistical feature scaled QuAdratic regressive convolution Deep nEural Network (SQADEN) is introduced. The proposed SQADEN technique mainly includes two major processes namely metric or feature selection and classification. First, the SQADEN uses the nonparametric statistical Torgerson–Gower scaling technique for identifying the relevant software metrics by measuring the similarity using the dice coefficient. The feature selection process is used to minimize the time complexity of software fault prediction. With the selected metrics, software fault perdition with the help of the Quadratic Censored regressive convolution deep neural network-based classification. The deep learning classifier analyzes the training and testing samples using the contingency correlation coefficient. The softstep activation function is used to provide the final fault prediction results. To minimize the error, the Nelder–Mead method is applied to solve non-linear least-squares problems. Finally, accurate classification results with a minimum error are obtained at the output layer. Experimental evaluation is carried out with different quantitative metrics such as accuracy, precision, recall, F-measure, and time complexity. The analyzed results demonstrate the superior performance of our proposed SQADEN technique with maximum accuracy, sensitivity and specificity by 3%, 3%, 2% and 3% and minimum time and space by 13% and 15% when compared with the two state-of-the-art methods.Keywords
Software fault prediction is the process of identifying defective software components, and it is considered a crucial process during software development. It symbolizes the activity of identifying defective software modules in original versions of a software system. Fault prediction is considered of great significance in software engineering since it contributes to constantly improving the software quality for increasing the cost-effectiveness of quality assurance and testing.
A Graph Convolutional Neural Network for Defect Prediction (DP-GCNN) model was developed in [1] to classify the software module as defective or not defective. However, the fault prediction in the software modules with different sizes was not analyzed. A three-Stage Weighting approach for Multi-Source Transfer Learning (3SW-MSTL) was introduced in [2] for software fault prediction. However it failed to enhance the performance of accurate defect prediction with minimum time. A defect prediction model based on Gated Hierarchical Long Short-Term Memory networks (GH-LSTMs) was introduced in [3] by extracting relevant features. However, the designed method was not efficient in performing cross-project defect prediction tasks. A cross-project defect prediction was performed in [4] using the transfer-leaning algorithm. However the combination of information from multiple source projects was not analyzed to achieve better performance.
Gated Hierarchical Long-Short-Term Memory networks (GH-LSTMs) were developed in [3] for defect prediction to extract relevant features of source code files. However the time consumption of the defect prediction was not minimized. An artificial neural network-based prediction model was introduced in [5,6] for identifying software defects by using conceptual features extracted from the source code. However, the higher accuracy of defect prediction was not achieved. A new Hellinger net model was designed in [7] to improve defect prediction for software modules. However, the time complexity of defect prediction was not minimized. A hybrid Deep Neural Network model was developed in [8] to improve the prediction of software bugs. However, the efficient feature selection process was not investigated to improve the quality of available public datasets. A Nested-Stacking and heterogeneous feature selection model was introduced in [9] for software defect prediction. However it failed to build a more intelligent and automated prediction system. An Extended Random Forest (extRF) technique was developed in [10] for defective system prediction. However, it failed to provide an analytical evaluation of the machine-learning techniques for prediction purposes.
1.1 Major Contributions of the Paper
To overcome the existing issues, a novel Nonparametric Statistical feature scaled QuAdratic regressive convolution Deep nEural Network (SQADEN) is developed with the following contributions:
• A novel SQADEN is introduced for improving the software fault prediction which includes two different processes namely feature selection and classification.
• To minimize the prediction time and space complexity of software fault prediction, the SQADEN first performs the feature selection using the nonparametric statistical Torgerson–Gower scaling technique. The relevant features are identified through the Mann-Whitney nonparametric statistical test analysis with the help dice similarity coefficient.
• The classification is carried out by using a Quadratic Censored regressive convolution deep neural network to classify defective or non-defective software projects.
• Censored regression is employed to examine the training and testing samples via deep deep-learning classifier analyzes the training and testing samples. The dimension of the input is minimized by applying censored regression.
• The softstep activation function is used to provide the final fault prediction results.
• Nelder–Mead method is applied to solve non-linear least-squares problems by reducing quadratic loss.
The rest of the work is organized into different sections as follows: Section 2 expresses the related works of recent year techniques for predicting software defects. The proposed methodology SQADEN of this research work is briefly explained in Section 3. The experimental settings of the proposed and existing methods are discussed in Section 4. Followed by, performance results and discussions are presented in Section 5. The conclusion of the work is given in Section 6.
Stacked Sparse Denoising Auto Encoders (SSDAE) and Extreme Learning Machines (ELM) were developed [11] to detect defective modules. However, it was not applied to evaluate our model in more open-source and commercial projects. The multi-perspective tree embedding (MPT) technique was developed in [12] for software project defect prediction. However, it failed to extend our model for other software source code-based research such as code clone detection and code completion.
An attention-based GRU-LSTM model was developed in [13] for statement-level defect prediction. But it failed to perform defect predictions with more features hence it increased the complexity. The Relief-Based Clustering (RFC) method was developed in [14] for selecting the significant features based on correlation. However, the method failed to focus on the redundant features of high-dimensional datasets.
An integration of Particle Swarm Optimization and Sparrow Search Algorithm was designed in [15] for software defections estimation and prediction. However, it was not able to make improvements to the strategy of software reliability models. A Kernel Spectral Embedding Transfer Ensemble (KSETE) approach was developed in [16] for defect prediction. However, it failed to improve the KSETE approach using deep learning because of its efficient feature learning ability. Two novel methods were developed in [17] to handle the problem of class imbalance datasets during software defect prediction. But it has more time consumption for defect prediction.
Semantic Feature Learning via Dual Sequences (SFLDS) was developed in [18] for feature generation to improve software defect prediction. However, deep feature learning was not performed. An automatic selection of source project training data was developed in [19] for defect prediction-based divergence. However, it failed to validate the proposed approach, and a modified objective cluster analysis was performed in [20] for software defect prediction using unlabeled datasets. However, the space complexity of defect prediction was not minimized.
Software defect was forecasted in [21] by using feature selection and classifications with maximum accuracy. But, the time was not reduced. Ensemble learning methods were employed in [22] by higher prediction performance. A novel software defect prediction framework was discussed in [23] to lessen time. The data imbalance issue was determined with the Synthetic minority oversampling method. Shapley additive explanation model was employed to highlight the utmost determinative features. RNN-Based DL as well as Ensemble ML methods was analyzed in [24] for performing software fault defection. An improved CNN model was investigated in [25] for enhancing defect prediction performances. However, deep learning was not performed to accurately detect the fault prediction.
Software Defect Prediction (SDP) plays a significant role in software engineering. It helps software practitioners assign their limited resources for testing and improve the quality by identifying a defect in the early phases of the development life cycle. When the software systems complexity increases, the number of software defects during the software development also considerably increases. This increasing complexity of software projects involves an increasing consideration of their analysis and testing. Therefore, a novel SQADEN technique is introduced for accurately and timely detecting software defects. The proposed SQADEN is an effective method to identify defects in system modules in advance. First, the software metrics related to software defects are selected followed by the classification performed for detecting the defects in the source code to enhance the software quality.
Fig. 1 depicts the architecture diagram of the proposed SQADEN technique consisting of two major processes namely feature selection and classification for improving the accuracy of SDP with big data. Initially, the big dataset is considered for software defect prediction. This dataset consists of many features or software metrics
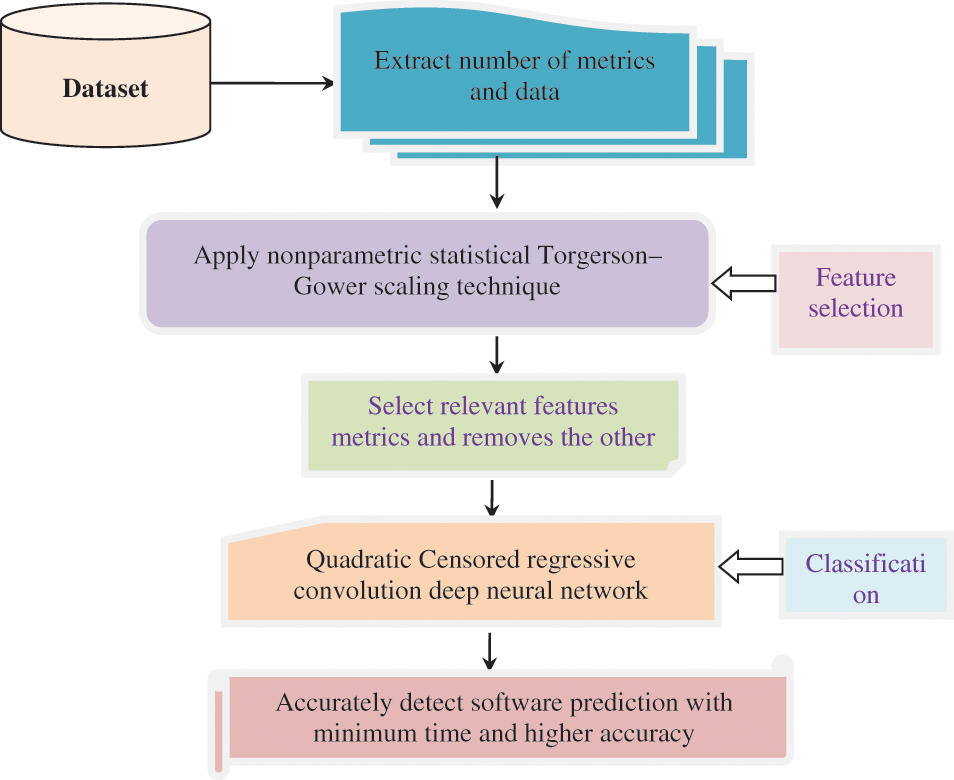
Figure 1: Architecture diagram of the proposed SQADEN technique
After collecting the metrics from the dataset, the feature selection process is carried out to reduce the input variable by selecting relevant software metrics for minimizing the time complexity of software defect prediction. The proposed SQADEN technique uses a nonparametric statistical Torgerson–Gower scaling for selecting the relevant metrics and removes the other metrics for enhancing the performance of SDP with minimum time. The final result of this procedure obtains the relevant features to enhance the classification process.
Finally, the classification process is performed to enhance SDP with minimum time by analyzing the testing and training data instances by using a Quadratic Censored regressive convolution deep neural network. The convolution neural network is a type of deep learning technique for analyzing the testing and training data by using a contingency correlation coefficient in the convolution layer. Then the dimension of the data is minimized in the max pooling layer by applying censored regression. Finally, the softstep activation function is used in the dense layer for identifying defective or non-defective software modules. After that, the Nelder–Mead method is applied to minimize incorrect software fault prediction. Based on the analysis, the software fault prediction is correctly identified with minimum time. These two different processes of the proposed SQADEN are described in the following subsections.
3.1 Nonparametric Statistical Torgerson–Gower Feature Scaling
SDP is used to perform the statistical analysis of sequential faults, in the source code program. However, there are redundant and irrelevant features or metrics in the software defect datasets that affect the performance of defect predictors. To identify and remove the redundant and irrelevant features in datasets, a novel nonparametric statistical Torgerson–Gower scaling technique is introduced.
Torgerson–Gower scaling is a machine learning technique used to minimize the dimensionality of the dataset by identifying the level of similarity of individual cases of a dataset. The similarity is measured by applying the Mann-Whitney statistical test. It is a nonparametric test for randomly selected values (i.e., features) from the dataset.
Fig. 2 given above depicts the block diagram of nonparametric statistical Torgerson–Gower feature scaling. First, the number of features or software metrics is collected from the dataset. Then, a new feature selection method is applied and proposed based on the dependence between the features. Moreover, the corresponding significance of the feature has been obtained using Mann-Whitney statistical test.
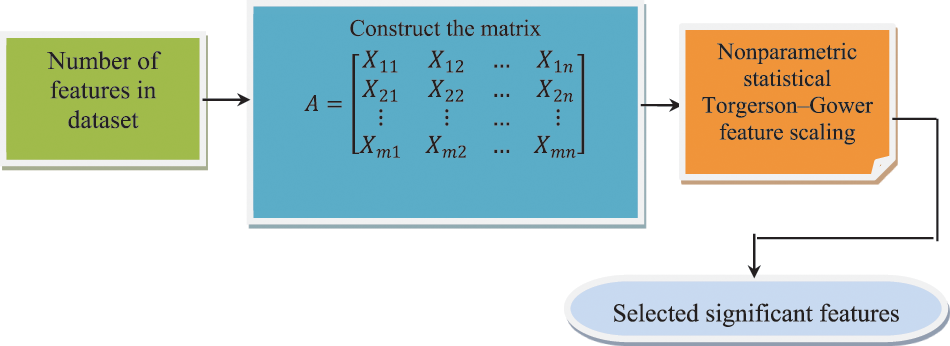
Figure 2: Nonparametric statistical Torgerson–Gower feature scaling
Let us consider the number of features
In Eq. (1),
In Eqs. (2) and (3),
In Eq. (4), the dependent features are selected for classification, and the remaining features are removed. This helps to minimize the time complexity of software fault prediction. The algorithmic process of the nonparametric statistical Torgerson–Gower feature scaling is given below:
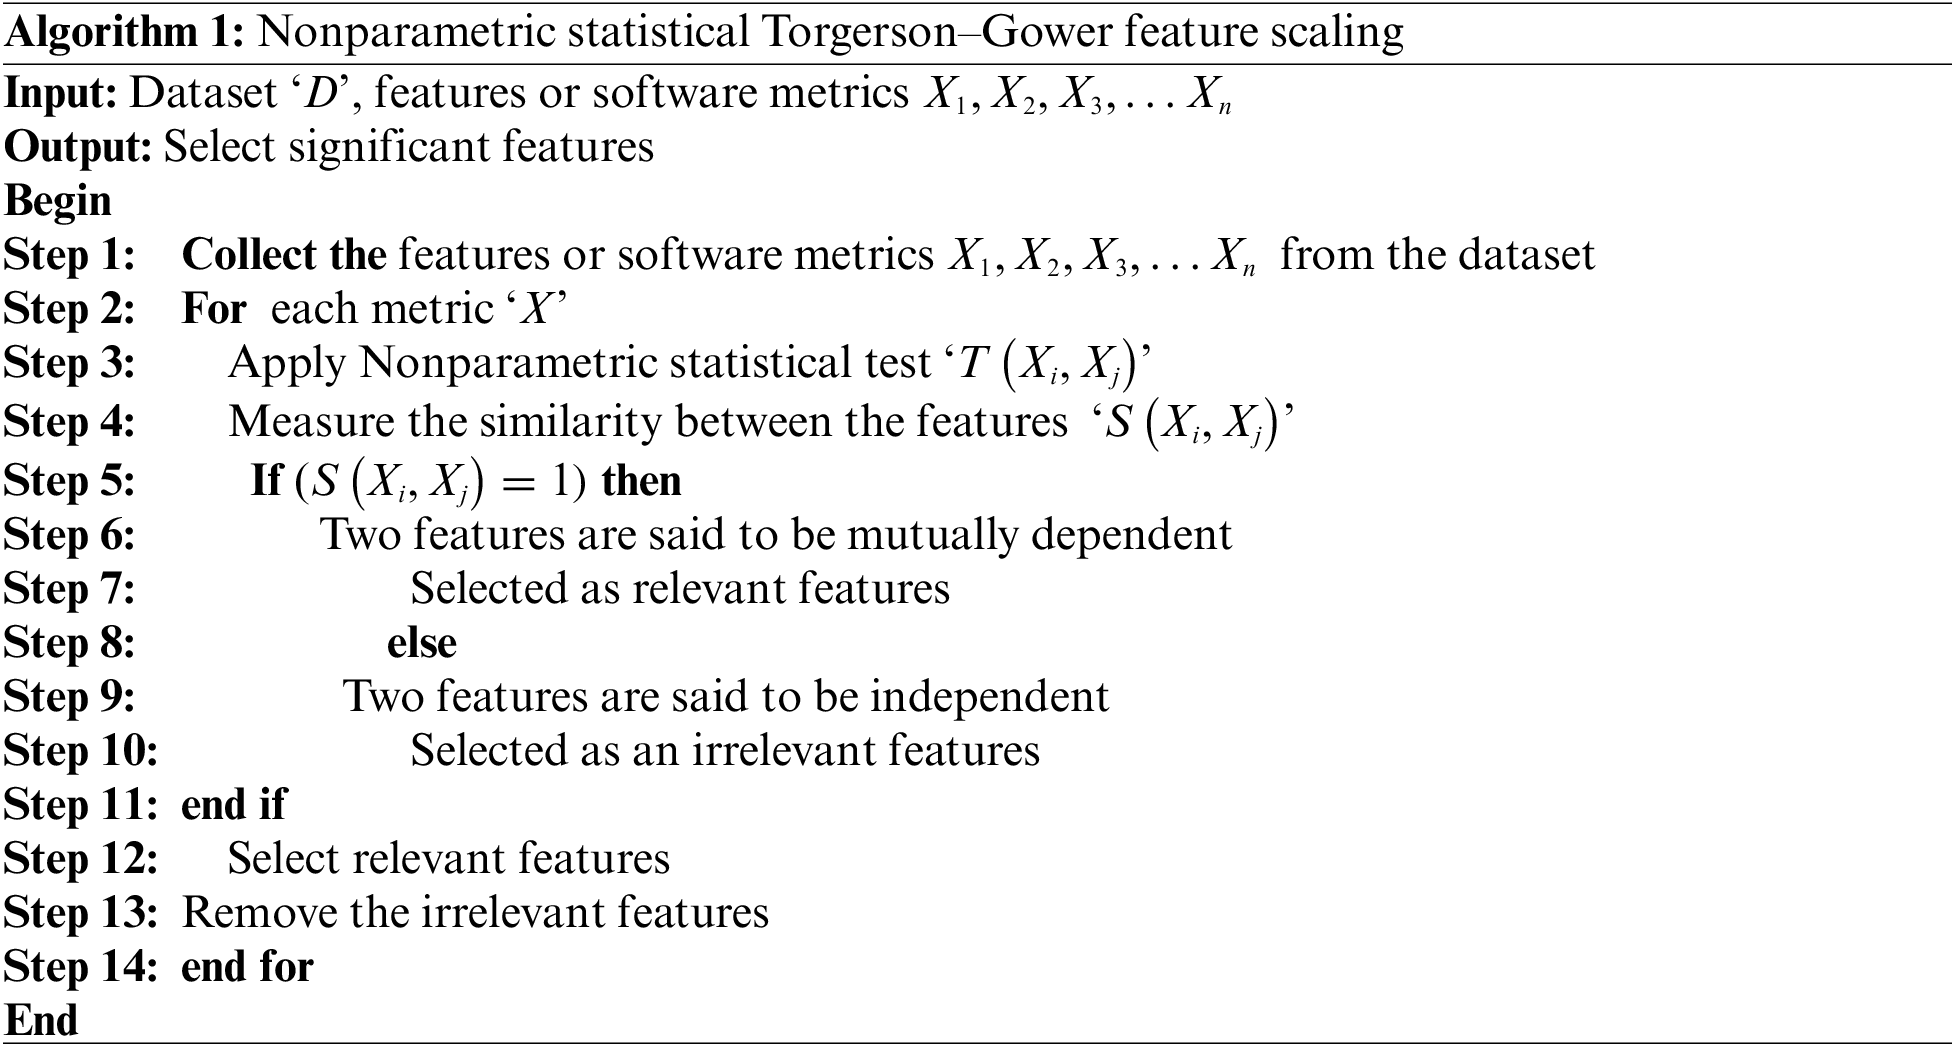
Algorithm 1 given above illustrates the different processing nonparametric statistical Torgerson–Gower scaling for selecting the significant software metrics from the dataset. The number of features and data are collected from the dataset. After that, the Torgerson–Gower scaling is applied to find the dependence between the features. The dependent features are selected for fault prediction and other software metrics are eliminated from the dataset to minimize the time consumption of software fault prediction.
3.2 Quadratic Censored Regressive Convolution Deep Neural Network Based Classification
Finally, in this section, with the selected relevant features, classification is performed data the respective relevant features are made. The classification here is made employing Quadratic Censored regressive convolution deep neural network-based classification to detect the software faults. The advantage of a convolution deep neural network is to reduce the high dimensionality of data without losing any data. Contrary to the conventional algorithm, the censored regression, Contingency Correlation coefficient, and Nelder–Mead method are applied to convolution-deep neural networks to increase the performance of classification and minimize the error rate.
Fig. 3 given above shows the schematic diagram of the Convolutive Deep Learning Classifier that includes three types of layers namely one input, one or more hidden (i.e., middle), and one output layer. The input and output layers are always single layers, whereas the middle layer consists of many sublayers for analyzing the given input data samples. Each layer normally contains a small individual unit called artificial neurons or nodes. The main process of the neuron is to process the given inputs and forward the output to other nodes with the help of an activation function. An input of an artificial neuron is training data from the input layer or outputs from a previous layer’s neurons. The connection between the neurons is called a synapse.

Figure 3: Schematic diagram of Quadratic Censored regressive convolution deep neural network
The input layer consists of training data, i.e.,
• Input layer
First, the input layer considers the number of training data i.e.,
• Convolutional layers
The convolution layer convolves the input training data, i.e.,
The activity of the neuron in the layer as given below:
In Eq. (5),
In this Convolutional layer, the feature map is also carried out by measuring the relationship between testing and training data using the contingency correlative statistical Cramér’s test.
The Contingency Correlation coefficient is a statistical technique used to measure the association between the testing and training data using Cramér’s phi test.
In Eq. (6)
In Eq. (7),
• Max-pooling layer
It is the second hidden layer of the deep learning classifier for minimizing the dimensions of the input. Max Pooling is the method, where the highly correlated feature map results are taken as input and it provides the dimensions reduced output. The Censored regression is a machine learning technique used to find the stochastically higher correlated results by defining the threshold value.
In Eq. (8),
• Dense layer
In this layer, the deep learning classifier performs the SDP with the help of the activation function. A dense Layer is used to classify data based on output from convolutional layers. The classification is performed using the softstep activation function.
In Eq. (9),
Based on activation function results, software defects are correctly identified. After that, the Quadratic loss function is calculated for each observed result.
In Eq. (11), the Huber loss ‘
Finally, the classification results are obtained at the output layer. Based on the classification results, accurate software fault prediction is obtained with minimum loss. The Quadratic Censored regressive convolution deep neural network-based classification algorithm is described as given below:
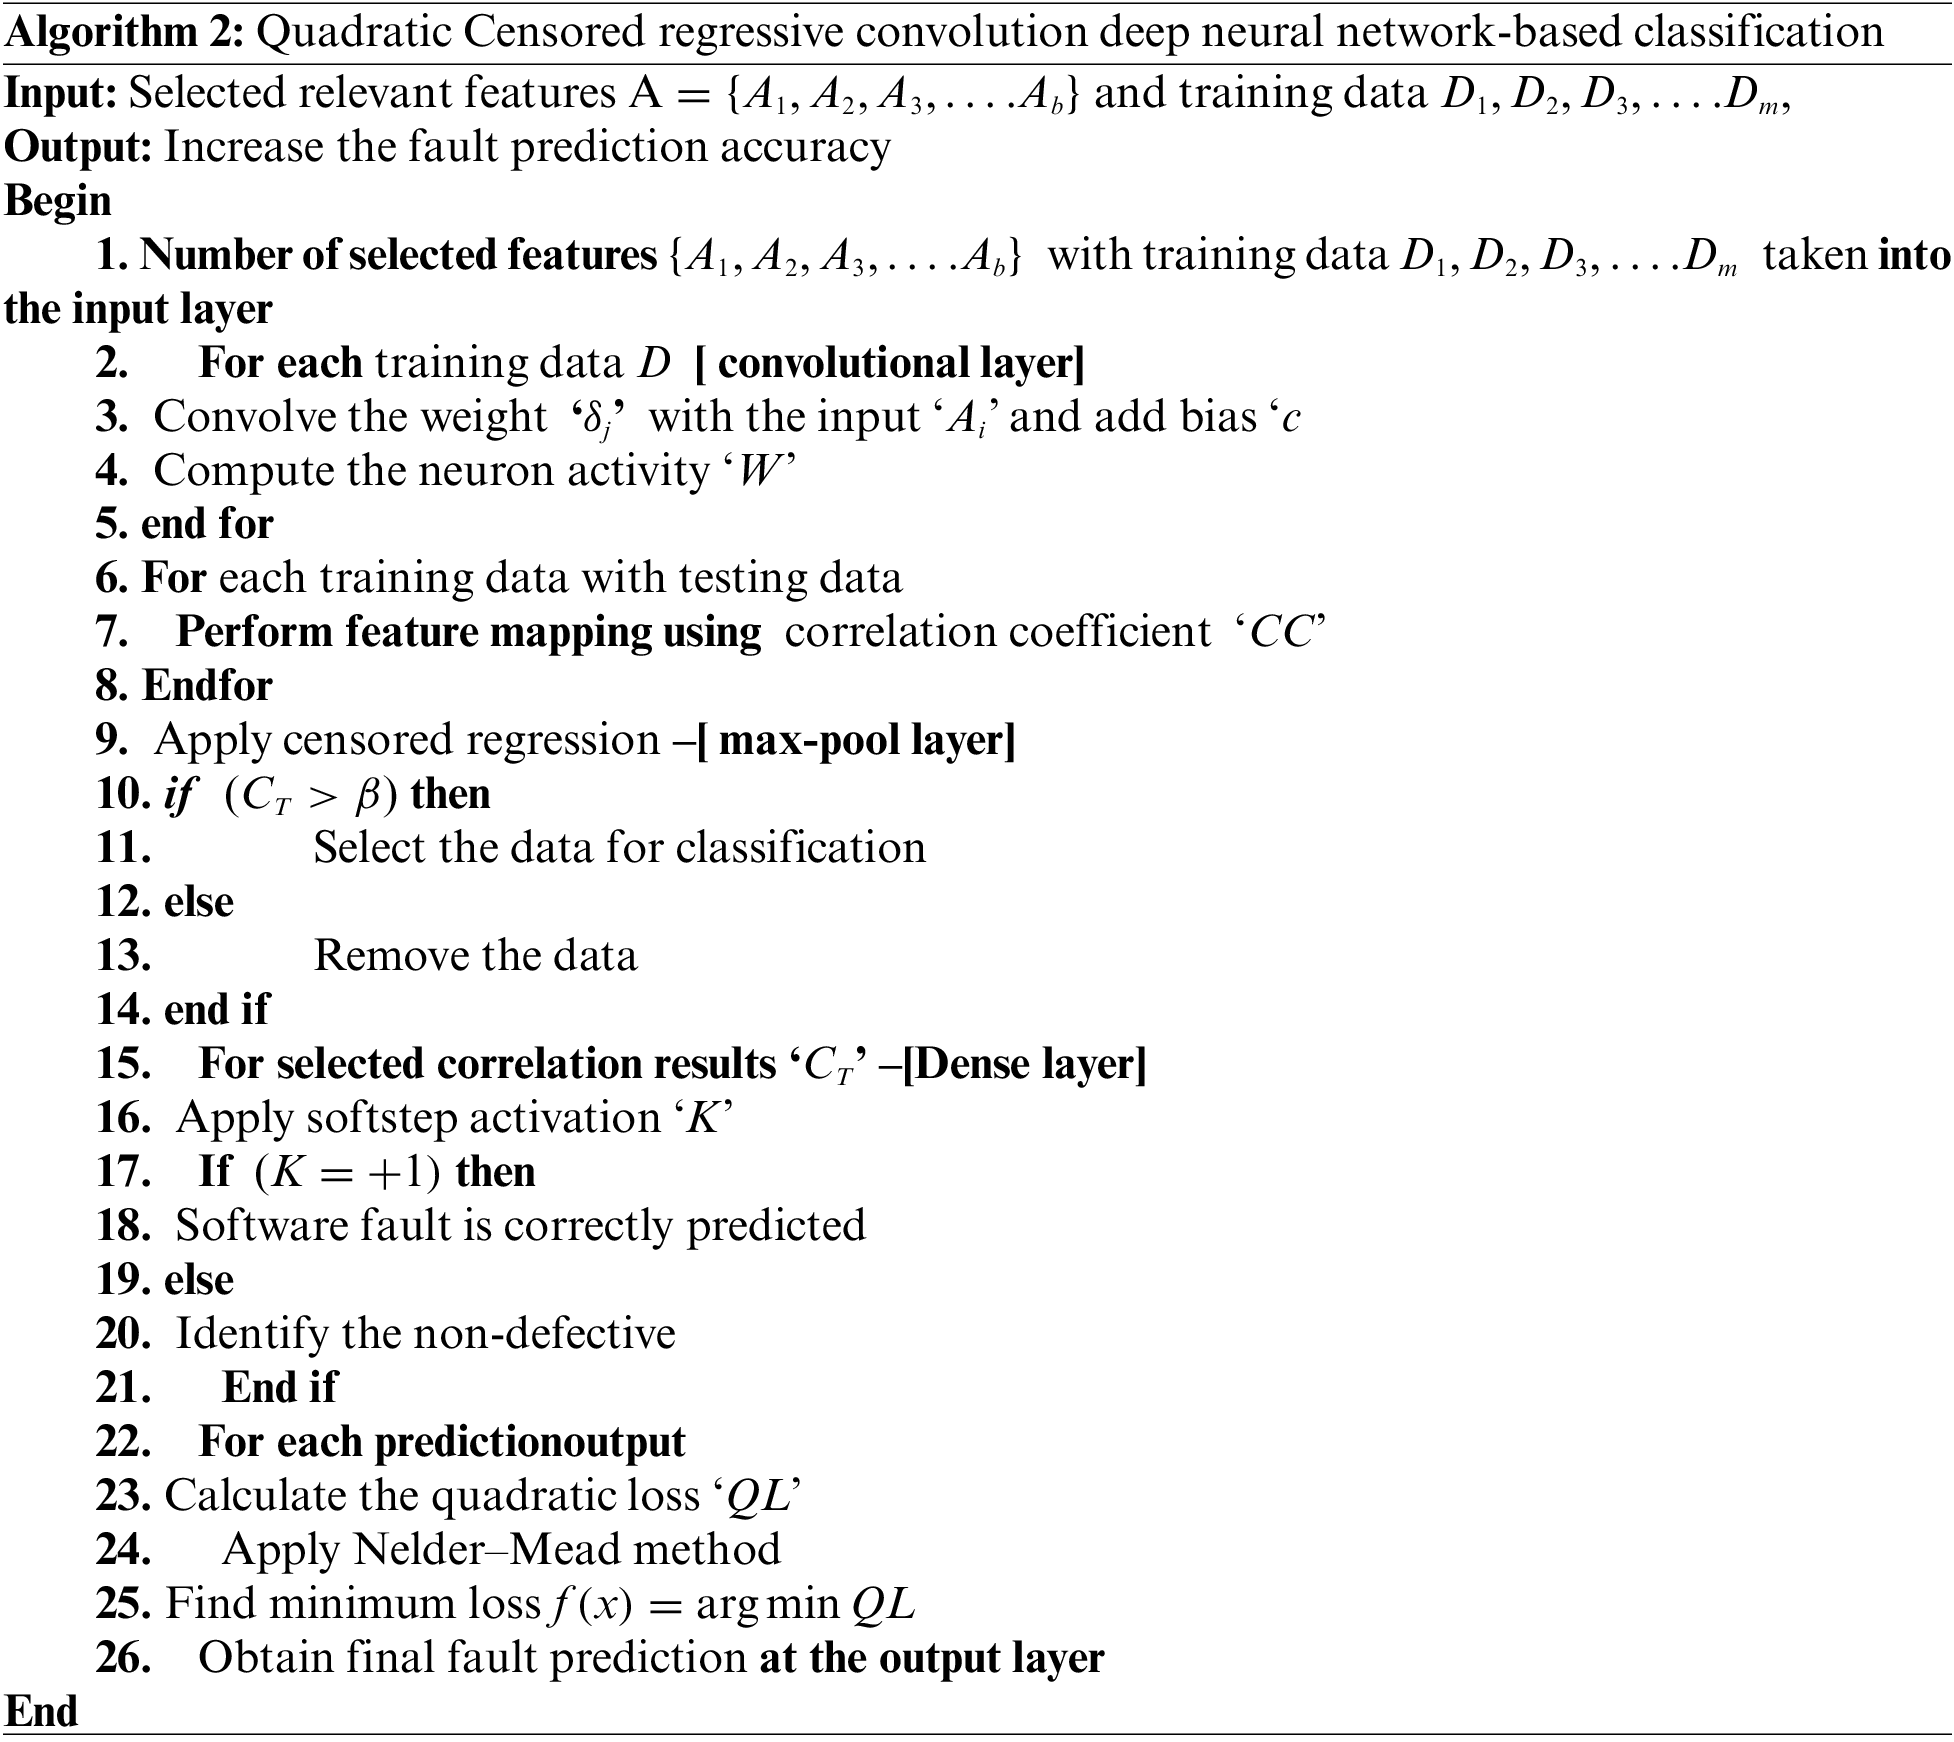
Algorithm 2 given above illustrates the different step-by-step procedures of software fault prediction using Quadratic Censored regressive convolution deep neural network with higher accuracy. The selected software metrics with the training data are given as input for the deep learning classifier. Then the input is transferred into a convolution layer. In this layer, the inputs are convolved with the set of weights and added to the bias. In the convolutional layer, the Contingency Correlation coefficient is applied to find the correlation between the training and testing data. Then the correlation outcomes are transferred into the next layer called the max pooling layer. In that layer, the higher correlated results are selected for the next classification process to minimize the time of fault prediction. Then the output of the max pooling layer is given to the dense layer where the softstep activation function for predicting the defective or non-effective software codes class. Subsequently, the quadratic loss is calculated for each predicted output. After that, the quadratic loss is minimized by applying the Nelder–Mead method. Finally, the accurate prediction results are displayed at the output layer of the deep learning classifier.
In this section, the proposed SQADEN technique and existing DP-GCNN [1], and 3SW-MSTL [2] are implemented in Java language. The experiment is conducted in an Intel Core i5- 6200U CPU @ 2.30 GHz 4 cores with 4 Gigabytes of DDR4 RAM. The objective of the proposed SQADEN technique is to accurately predict the software fault with higher accuracy and minimum time. Based on the objective, existing methods such as DP-GCNN [1], and 3SW-MSTL [2] are taken as base paper. These two base papers are explained to understand the proposed method. The drawbacks of these methods are effectively convinced by implementing the proposed technique. Software Defect Prediction Data Analysis is utilized to perform experiments. Lastly, we compare the proposed SQADEN technique with other existing methods to validate its effectiveness.
Software Defect Prediction Data Analysis taken from the https://www.kaggle.com/code/semustafacevik/software-defect-prediction-data-analysis/data. This is a PROMISE repository and is publicly available for software engineering. The dataset consists of 10885 instances and 22 attributes features or metrics. The attribute information is given in Table 1. First, the metrics are taken from the dataset. The metric selection process is carried out by using the Nonparametric statistical Torgerson–Gower scaling technique to select relevant features for defect prediction. With the selected relevant metrics, the Quadratic Censored regressive convolution deep neural network classifier is applied for predicting the software defects based on the attributes and it indicates true and false.

Results of and discussion of the proposed SQADEN technique and existing DP-GCNN [1], 3SW-MSTL [2] are discussed with the different parameters such as fault prediction accuracy, precision, recall, and F-measure and prediction time. Performance results are assessed with the help of tables and graphical illustrations.
Software fault prediction accuracy: It is measured as the number of instances that are correctly predicted as defects or not. The prediction accuracy is calculated.
where
Precision: It is calculated based on many true positives as well as false positives. Therefore, the precision is mathematically estimated as given below:
In Eq. (14),
Recall: It is calculated to find the number of true positives as well as false negatives during the fault prediction. It is also known as sensitivity and is calculated as follows:
In Eq. (15),
F-measure: It is estimated as the average of both precisions as well as recall. The F-measure is computed as given below:
In Eq. (16),
Prediction time It is measured as the amount of time consumed by the algorithm to accurately predict defective or non-defective software modules. Therefore, the overall time is calculated as given below:
In Eq. (17),
Space complexity: It refers to the amount of memory space taken by an algorithm to predict software faults. Therefore, it is computed by:
In Eq. (18),
To validate the effectiveness of the proposed SQADEN technique, this paper conducts a comparative analysis with state-of-the-art DP-GCNN [1], 3SW-MSTL [2], utilizing the Software Defect Prediction Data Analysis dataset as presented in Tables 2–5. Furthermore, we evaluated the performance of the proposed SQADEN technique using the Software Defect Prediction Data Analysis dataset, with the results reported in Figs. 4–6.


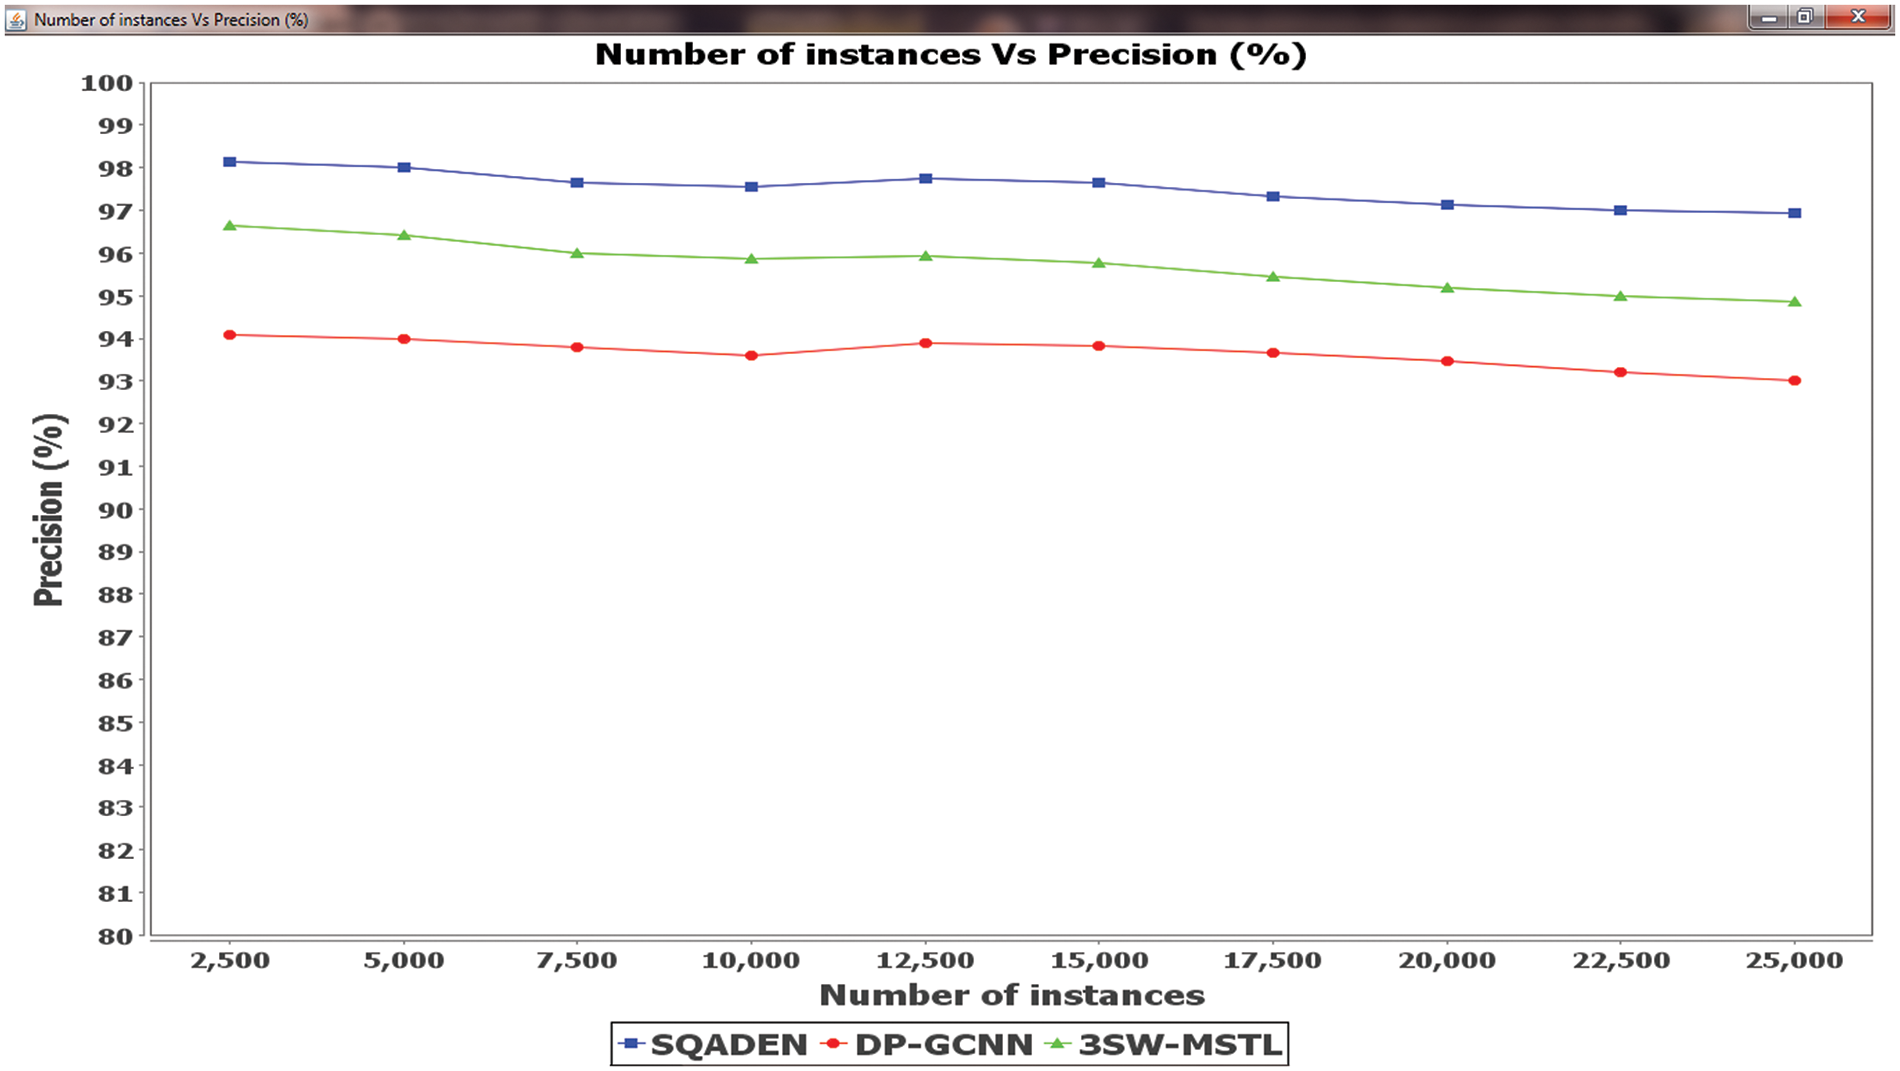
Figure 4: Comparison analysis of precision
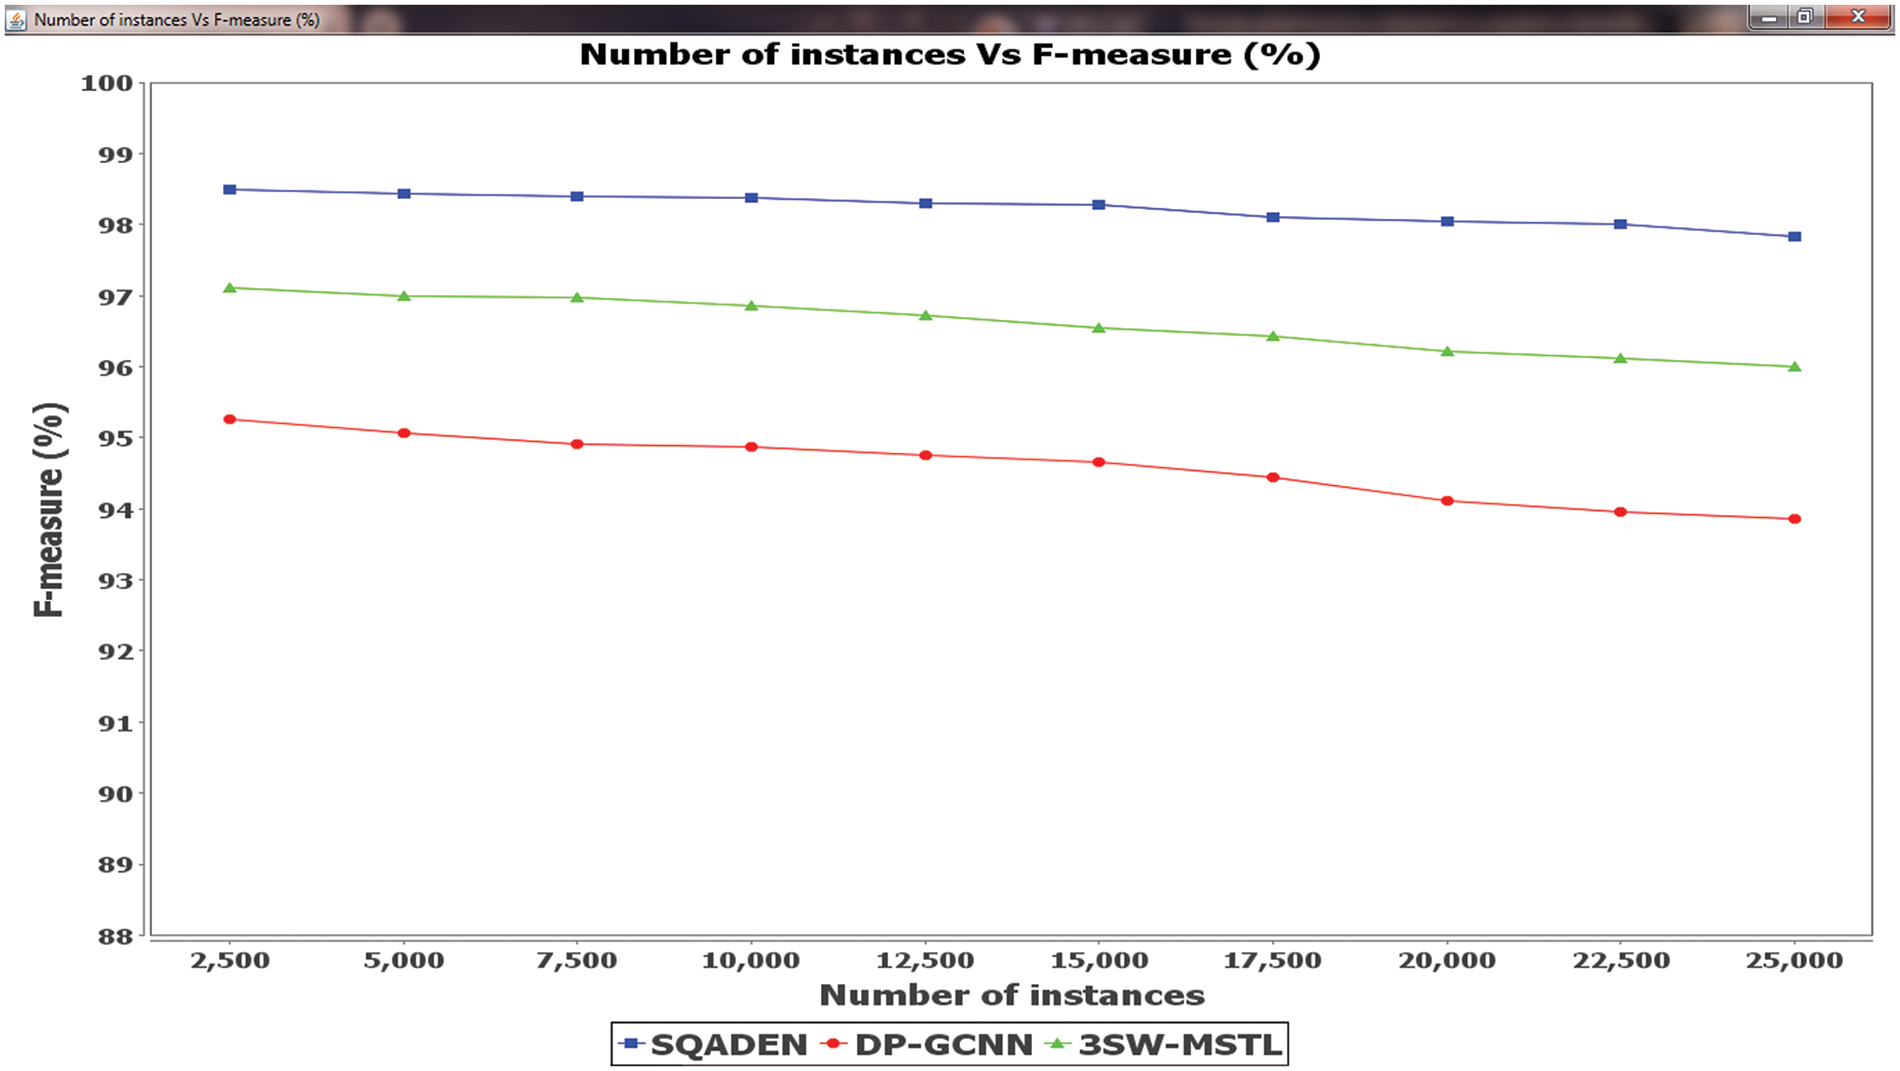
Figure 5: Comparison analysis of F-measure
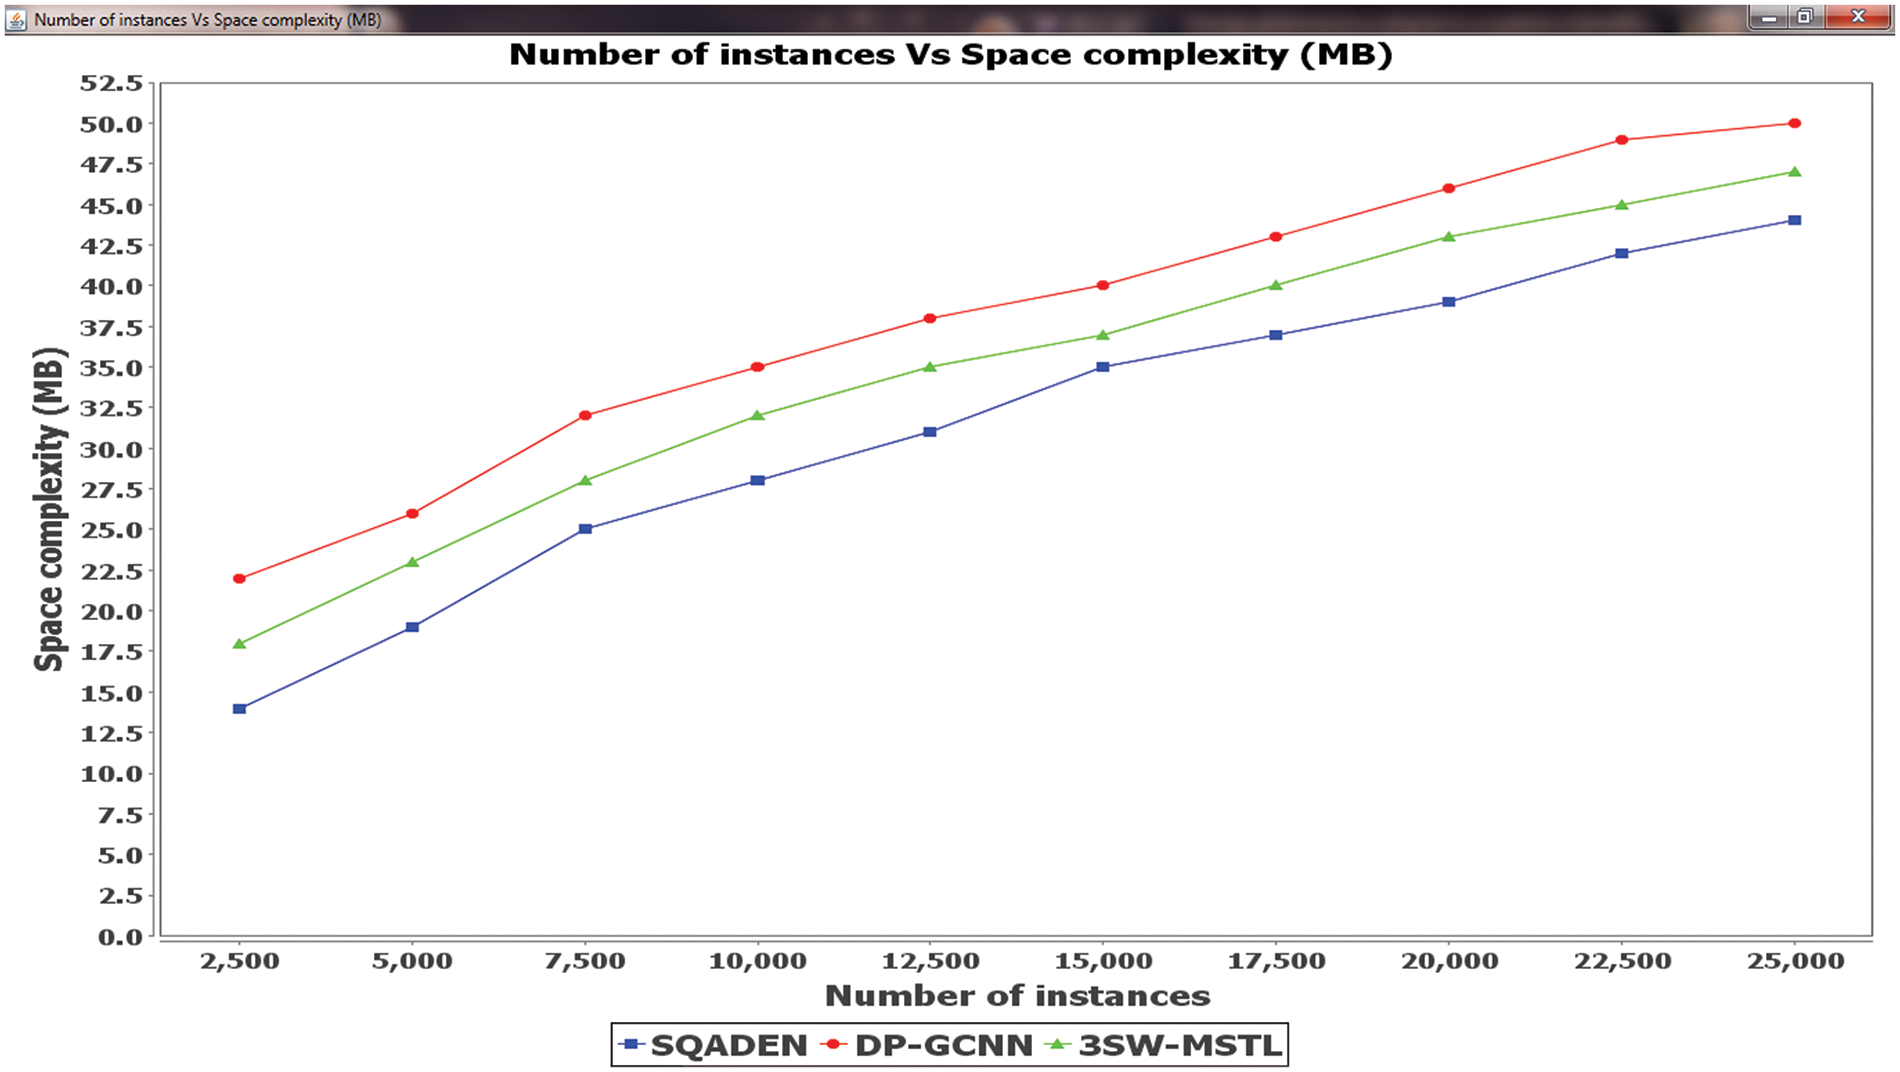
Figure 6: Comparison analysis of space complexity
Table 2 reveals the comparative performance analysis of the software fault prediction accuracy vs. the number of instances taken as input in the ranges from 2500 to 25000. From the observed results, different performance results are observed for all three methods namely SQADEN technique and existing DP-GCNN [1], 3SW-MSTL [2]. The observed results indicate that the SQADEN technique achieves higher accuracy of software fault prediction than the other two existing methods. Let us consider 2500 instances taken as input for calculating the accuracy. By applying the SQADEN technique,
Fig. 4 illustrates the comparison analysis of precision concerning three different methods namely the SQADEN technique, existing DP-GCNN [1] and 3SW-MSTL [2].The observed result indicates that the precision using the SQADEN is better when compared to other techniques. This is because of SQADEN technique uses the quadratic censored regressive convolution deep neural classifier. The SQADEN technique uses the contingency correlation coefficient for analyzing the training and testing data instances. The results provide accurate true positive results and minimize the false positive by applying Nelder–Mead method. The method minimizes the quadratic loss. Finally, the accurate prediction results are displayed at the output layer.
Let us consider the
The above Table 3 shows the performance results of recall vs. many instances in the ranges from 2500 to 25000. The performance of recall analysis is performed with the help of the true positives as well as false negatives. Let us consider the 2500 instances for calculating the recall. By applying the SQADEN, the observed performance recall was found to be
The performance results of the F-measure vs. many instances of three different methods SQADEN and existing DP-GCNN [1] and 3SW-MSTL [2] are plotted in Fig. 5. Among the three methods, the SQADEN achieves a higher F-measure when compared to existing methods. This is because SQADEN achieves higher precision as well as recall. In the first iteration, 2500 instances are taken as input and the F-measure of the SQADEN was found to be
Table 4 depicts the overall analysis of the prediction time using SQADEN and existing DP-GCNN [1] and 3SW-MSTL [2] vs. the number of instances taken in the ranges from 2500 to 25000. While increasing the input patient data, the time consumption of fault prediction of three methods gets increased for all the classification methods. However, the proposed SQADEN achieves lower time consumption than the others. However, with ‘
This is the reason that increasing the number of instances causes an increase in the number of instances involved and this in turn increases the prediction time. Fig. 6 shows the software fault prediction time of SQADEN is minimized. The reason behind this improvement was due to the application of nonparametric statistical Torgerson–Gower scaling for selecting the significant software metrics from the dataset. After that, the Torgerson–Gower scaling is applied to find the dependence between the metrics. These dependent metrics are selected for fault prediction and other software metrics are removed from the dataset. With the selected features, classification is performed. As a result, the software fault prediction time using the SQADEN method was said to be reduced.
The performance analysis of space complexity of three different methods namely SQADEN and existing DP-GCNN [1], 3SW-MSTL [2] are illustrated in the Fig. 6 with respect to the number of instances 2500, 5000, 7500,…, 25000. Let us consider the number of instances is 2500 in the experimentation. The memory consumption for predicting the software faults is
Table 5 shows the comparative analysis of three different methods namely SQADEN and existing DP-GCNN [1], 3SW-MSTL [2] using dissimilar metrics. The results of the proposed SQADEN are obtained with maximum accuracy and recall as compared to conventional methods. The observed results establish that the proposed SQADEN achieves less time and space than the existing methods.
This paper presents software fault prediction broadly popular research area in software reliability engineering. The major objective of fault prediction is to find numerous defective software modules without damaging the overall performance. In this paper, a novel SQADEN is introduced for solving the accurate fault prediction with minimum time. The proposed SQADEN technique is designed with nonparametric statistical Torgerson–Gower feature scaling and Quadratic Censored regressive convolution deep neural network-based classification.
The nonparametric statistical Torgerson–Gower scaling is employed to find the relevant features and remove the irrelevant features. In this way, the time as well as space is minimized. Finally, the classification is performed using a Quadratic Censored regressive convolution deep neural network for identifying the software faults by analyzing the training and testing data. Finally, the software faults are correctly determined with higher accuracy. The comprehensive experimental evaluation is carried out concerning many instances and compares the results of the proposed technique with two conventional algorithms using the software defect prediction data analysis dataset. The main advantage of the SQADEN technique is to achieve exactly identify the defective and non-defective projects with higher accuracy, precision, recall, F-measure, and little time as compared to conventional methods. The experimental results show that the SQADEN gets better results in terms of 3% accuracy, 3% precision, 2% recall, and 3% F-measure and minimizes the 13% time as well as 15% space complexity when compared to conventional deep learning methods. In future work, the proposed technique will be further extended for accurate and timely software fault production with minimized time by using a novel extreme learning classifier method.
Acknowledgement: None.
Funding Statement: The authors received no specific funding for this study.
Author Contributions: The authors confirm contribution to the paper as follows: study conception and design: Sureka Sivavelu, Venkatesh Palanisamy; data collection: Sureka Sivavelu; analysis and interpretation of results: Venkatesh Palanisamy; draft manuscript preparation: Sureka Sivavelu. All authors reviewed the results and approved the final version of the manuscript.
Availability of Data and Materials: This study used the publically available dataset: https://www.kaggle.com/code/semustafacevik/software-defect-prediction-data-analysis/data.
Conflicts of Interest: The authors declare that they have no conflicts of interest to report regarding the present study.
References
1. L. Šikić, A. S. Kurdija, K. Vladimir, and M. Šilić, “Graph neural network for source code defect prediction,” IEEE Access, vol. 10, pp. 10402–10415, 2022. doi: 10.1109/ACCESS.2022.3144598. [Google Scholar] [CrossRef]
2. J. Bai, J. Jia, and L. F. Capretz, “A three-stage transfer learning framework for multi-source cross-project software defect prediction,” Inf. Softw. Technol., vol. 150, pp. 1–16, 2022. doi: 10.1016/j.infsof.2022.106985. [Google Scholar] [CrossRef]
3. H. Wang, W. Zhuang, and X. Zhang, “Software defect prediction based on gated hierarchical LSTMs,” IEEE Trans. Reliab., vol. 70, no. 2, pp. 711–727, 2021. doi: 10.1109/TR.2020.3047396. [Google Scholar] [CrossRef]
4. S. Tang, S. Huang, C. Zheng, E. Liu, C. Zong and Y. Ding, “A novel cross-project software defect prediction algorithm based on transfer learning,” Tsinghua Sci. Technol., vol. 27, no. 1, pp. 41– 57, 2022. doi: 10.26599/TST.2020.9010040. [Google Scholar] [CrossRef]
5. T. Mahesh Kumar, F. H. Sjahin, and P. Rajesh, “Survey on software defect prediction techniques,” Int. J Appl. Sci. Eng., vol. 17, no. 4, pp. 331–344, 2020. [Google Scholar]
6. D. L. Miholca, V. I. Tomescu, and G. Czibula, “An in-depth analysis of the software features’ impact on the performance of deep learning-based software defect predictors,” IEEE Access, vol. 10, pp. 64801–64818, 2022. doi: 10.1109/ACCESS.2022.3181995. [Google Scholar] [CrossRef]
7. T. Chakraborty and A. Kumar Chakraborty, “Hellinger net: A hybrid imbalance learning model to improve software defect prediction,” IEEE Trans. Reliab., vol. 70, no. 2, pp. 481–494, 2021. doi: 10.1109/TR.2020.3020238. [Google Scholar] [CrossRef]
8. K. Tameswar, G. Suddul, and K. Dookhitram, “A hybrid deep learning approach with genetic and coral reefs metaheuristics for enhanced defect detection in software,” Int. J. Inf. Manag. Data Insights, vol. 2, no. 2, pp. 1–10, 2022. doi: 10.1016/j.jjimei.2022.100105. [Google Scholar] [CrossRef]
9. L. Chen, C. Wang, and S. Song, “Software defect prediction based on nested-stacking and heterogeneous feature selection,” Complex Intell. Syst., vol. 8, pp. 3333–3348, 2022. doi: 10.1007/s40747-022-00676-y. [Google Scholar] [CrossRef]
10. F. H. Alshammari, “Software defect prediction and analysis using enhanced random forest (extRF) technique: A business process management and improvement concept in IoT-based application processing environment,” Mob. Inf. Syst., vol. 2022, pp. 1–11, 2022. doi: 10.1155/2022/2522202. [Google Scholar] [CrossRef]
11. N. Zhang, S. Ying, K. Zhu, and D. Zhu, “Software defect prediction based on stacked sparse denoising autoencoders and enhanced extreme learning machine,” IET Softw., vol. 16, no. 1, pp. 29–47, 2022. doi: 10.1049/sfw2.12029. [Google Scholar] [CrossRef]
12. K. Shi, G. Liu, Y. Lu, Z. Wei, and J. Chang, “MPT-embedding: An unsupervised representation learning of code for software defect prediction,” J. Softw.: Evol. Process, vol. 33, no. 4, pp. 1–20, 2021. doi: 10.1002/smr.2330. [Google Scholar] [CrossRef]
13. H. S. Munir, S. Ren, M. Mustafa, C. N. Siddique, and S. Qayyum, “Attention based GRU-LSTM for software defect prediction,” PLoS One, vol. 16, no. 3, pp. 1–19, 2021. doi: 10.1371/journal.pone.0247444. [Google Scholar] [PubMed] [CrossRef]
14. X. L. Xu, W. Chen, and X. H. Wang, “RFC: A feature selection algorithm for software defect prediction,” J. Syst. Eng. Electron., vol. 32, no. 2, pp. 389–398, 2021. doi: 10.23919/JSEE.2021.000032. [Google Scholar] [CrossRef]
15. L. Yang, Z. Li, D. Wang, H. Miao, and Z. Wang, “Software defects prediction based on hybrid particle swarm optimization and sparrow search algorithm,” IEEE Access, vol. 9, pp. 60865–60879, 2021. doi: 10.1109/ACCESS.2021.3072993. [Google Scholar] [CrossRef]
16. H. Tong, B. Liu, and S. Wang, “Kernel spectral embedding transfer ensemble for heterogeneous defect prediction,” IEEE Trans. Softw. Eng., vol. 47, no. 9, pp. 1886–1906, 2021. doi: 10.1109/TSE.2019.2939303. [Google Scholar] [CrossRef]
17. J. Zheng, X. Wang, D. Wei, B. Chen, and Y. Shao, “A novel imbalanced ensemble learning in software defect predication,” IEEE Access, vol. 9, pp. 86855–86868, 2021. doi: 10.1109/ACCESS.2021.3072682. [Google Scholar] [CrossRef]
18. J. Lin and L. Lu, “Semantic feature learning via dual sequences for defect prediction,” IEEE Access, vol. 9, pp. 13112–13124, 2021. doi: 10.1109/ACCESS.2021.3051957. [Google Scholar] [CrossRef]
19. S. Zheng, J. Gai, H. Yu, H. Zou, and S. Gao, “Training data selection for imbalanced cross-project defect prediction,” Comput. Electr. Eng., vol. 94, pp. 1–11, 2021. doi: 10.1016/j.compeleceng.2021.107370. [Google Scholar] [CrossRef]
20. J. Ren and Q. Zhang, “A novel software defect prediction approach using modified objective cluster analysis,” Concurr. Comput. Pract. Exp., vol. 33, no. 9, pp. 1–13, 2021. doi: 10.1002/cpe.6112. [Google Scholar] [CrossRef]
21. M. S. Alkhasawneh, “Software defect prediction through neural network and feature selections,” Appl. Comput. Intell. Soft Comput., pp. 1–16, 2022. [Google Scholar]
22. X. Dong, Y. Liang, S. Miyamoto, and S. Yamaguchi, “Ensemble learning based software defect prediction,” J. Eng. Res., vol. 69, no. 104773, pp. 1–15, 2023. doi: 10.1016/j.jer.2023.10.038. [Google Scholar] [CrossRef]
23. Y. Al-Smadi, M. Eshtay, A. Al-Qerem, S. Nashwan, O. Ouda and A. A. Abd El-Aziz, “Reliable prediction of software defects using shapley interpretable machine learning models,” Egypt. Inform. J., vol. 24, no. 3, pp. 1–20, 2023. doi: 10.1016/j.eij.2023.05.011. [Google Scholar] [CrossRef]
24. E. Borandag, “Software fault prediction using an RNN-based deep learning approach and ensemble machine learning techniques,” Appl. Sci., vol. 13, no. 3, pp. 1–21, 2023. doi: 10.3390/app13031639. [Google Scholar] [CrossRef]
25. C. Pan, M. Lu, B. Xu, and H. Gao, “An improved CNN Model for within-project software defect prediction,” Appl. Sci., vol. 9, no. 10, pp. 1–28, 2019. doi: 10.3390/app9102138. [Google Scholar] [CrossRef]
Cite This Article
 Copyright © 2024 The Author(s). Published by Tech Science Press.
This work is licensed under a Creative Commons Attribution 4.0 International License , which permits unrestricted use, distribution, and reproduction in any medium, provided the original work is properly cited.


 Submit a Paper
 Propose a Special lssue
 View Full Text
 Download PDF
 Downloads
 Citation Tools