 Open Access
ARTICLE
A Novel Fall Detection Framework Using Skip-DSCGAN Based on Inertial Sensor Data
College of Information Engineering, China Jiliang University, Hangzhou, 310018, China
* Corresponding Author: Julong Pan. Email:
(This article belongs to the Special Issue: Development and Industrial Application of AI Technologies)
Computers, Materials & Continua 2024, 78(1), 493-514. https://doi.org/10.32604/cmc.2023.045008
Received 14 August 2023; Accepted 10 November 2023; Issue published 30 January 2024
Abstract
With the widespread use of Internet of Things (IoT) technology in daily life and the considerable safety risks of falls for elderly individuals, research on IoT-based fall detection systems has gained much attention. This paper proposes an IoT-based spatiotemporal data processing framework based on a depthwise separable convolution generative adversarial network using skip-connection (Skip-DSCGAN) for fall detection. The method uses spatiotemporal data from accelerometers and gyroscopes in inertial sensors as input data. A semisupervised learning approach is adopted to train the model using only activities of daily living (ADL) data, which can avoid data imbalance problems. Furthermore, a quantile-based approach is employed to determine the fall threshold, which makes the fall detection framework more robust. This proposed fall detection framework is evaluated against four other generative adversarial network (GAN) models with superior anomaly detection performance using two fall public datasets (SisFall & MobiAct). The test results show that the proposed method achieves better results, reaching 96.93% and 92.75% accuracy on the above two test datasets, respectively. At the same time, the proposed method also achieves satisfactory results in terms of model size and inference delay time, making it suitable for deployment on wearable devices with limited resources. In addition, this paper also compares GAN-based semisupervised learning methods with supervised learning methods commonly used in fall detection. It clarifies the advantages of GAN-based semisupervised learning methods in fall detection.Keywords
Fall events are nothing more than a common occurrence in everyday life, but for elderly individuals, there are significant safety risks following a fall, and it is one of the major risk factors for injury or death in elderly individuals. According to the World Health Organization, falls are the second leading cause of unintentional injury deaths worldwide, with an estimated 684,000 deaths worldwide each year due to falls. The largest proportion of fatal fall injuries occurs in people over the age of 60; even if not fatal, there are still approximately 37.3 million fall injuries serious enough to require medical treatment each year [1]. Additionally, the higher fall mortality rate does not come entirely from falls but more from the inability of loved ones and medical care centers to detect and rescue elderly adults in time after a fall, resulting in missing the best time to help. In addition, noninjurious falls can be fatal. Studies have found that elderly people lying on the floor for more than 12 h after a fall may suffer from pressure sores, dehydration, hypothermia, and pneumonia [2]. In this context, Internet of Things (IoT)-based fall detection technology plays an important role in the daily life of elderly individuals, which can ensure that the elderly individuals receive timely assistance after a fall and avoid serious consequences and secondary injuries caused by the fall.
At present, the basic methods of fall detection as part of medical monitoring systems can be divided into three categories based on different technical means: image-based (video) methods [3], environmental information-based methods [4], and wearable sensor-based methods [5]. The image-based method determines whether a fall has occurred by images taken by cameras, and the scene needs to be fixed, usually in a room for detection, which has certain limitations. Additionally, environmental and scene factors have a great impact on detection system accuracy. The environmental information-based method determines whether a fall is caused by monitoring changes in the surrounding environment. The accuracy of this method is influenced by uncontrollable factors such as weather and geographic location. The wearable device, which is less influenced by noise and convenient to carry, automatically detects whether the wearer has fallen by applying deep learning algorithms through spatiotemporal data such as accelerometer and gyroscope data collected by inertial sensors. As an important part of IoT technology applications with ubiquitous applicability and practicality, wearable devices are the most widely used technical means in fall detection today.
The incidence of fall events in daily life is relatively low, and it is very difficult to obtain fall data in elderly individuals. Thus, the sample data for falls are usually small, but the sample data for activities of daily living (ADL) are usually large, which leads to data imbalance problems. In this case, the implementation of fall detection by supervised learning classification methods is often disadvantageous. For these reasons, this paper proposes a semisupervised learning method that uses only ADL samples for training and defines fall events as abnormal events. This paper designs a lightweight fall detection model based on the ideas of Skip-GANomaly [6], GANomaly [7], and MobileNet [8], which uses spatiotemporal data from the accelerometer and gyroscope in the inertial sensor and meets the requirements for deployment on wearable devices. The main contributions of this paper are summarized as follows:
(1) An IoT-based spatiotemporal data processing framework based on a depthwise separable convolution generative adversarial network using skip-connection (Skip-DSCGAN) for fall detection is proposed, which still has good detection performance while maintaining low latency and a small size for wearable devices.
(2) In model training, only ADL data need to be used for training, which avoids the impact of the data imbalance problem on the model.
(3) The quantile method is used in the division of the fall threshold, which largely avoids the influence of noisy samples in the training data on the algorithm.
(4) The proposed method is tested using the SisFall [9] and MobiAct [10] public datasets, and the experimental results show that Skip-DSCGAN not only has good generalization ability but also has better detection performance than four other generative adversarial network (GAN) models that have superior performance in anomaly detection.
With the development of deep neural networks, researchers have proposed several fall detection algorithms based on deep learning. The main networks are convolutional neural networks (CNNs) [11–13], long short-term memory (LSTM) [3,14–16], and gated recurrent units (GRUs) [14,15,17]. Li et al. [17] proposed a combined model based on the temporal convolutional network and gated recurrent unit (TCN-GRU) architecture, which used neural networks to extract features automatically and perform classification, avoiding the tedious preprocessing procedure. A GRU network is introduced to solve the long-term dependence problem of complex time series. TCN solves the concurrency problem in the GRU network and improves the flexibility of the model architecture. The expansion and causal convolution in the network make the model structure suitable for complex computations with a large quantity of spatiotemporal data.
Jeong et al. [18] proposed a fall detection system combining a simple threshold method (STM) and an LSTM network, which can learn the potential relationship between time series. Additionally, the possible overfitting problem is solved. The appropriate number of hidden layer nodes and regularization rate are selected to improve the efficiency of fall detection. When modeling sequential data, many scholars have recently favored the use of CNNs. It has been shown that CNNs can achieve better performance than recurrent neural networks (RNNs) in many tasks while avoiding the common drawbacks of RNNs, such as gradient explosion and gradient disappearance problems [11]. The model may also face problems such as lacking memory retention in the case of wearable devices. In addition, using CNN instead of RNN can improve performance because it allows parallel computation of the output [12].
All of these approaches use supervised learning with both fall and ADL data for model training, which suffers from data imbalance and thus results in potentially inflated accuracy. In such a case, it is often unfavorable to achieve fall detection by supervised learning classification methods. The semisupervised learning-based approach in fall detection algorithms mainly uses an autoencoder (AE) and some variants [19,20]. Jin et al. [20] proposed a fall detection system (mmFall) that uses millimeter-wave radar sensors to collect point clouds and the center of mass of the human body and then calculates the anomaly degree of body movement through a hybrid variational recurrent neural network autoencoder (HVRAE). To avoid the difficulties of fall data collection, HVRAE is built on an autoencoder architecture with a semisupervised approach, which is trained only on normal ADL. A fall event is judged when a spike in the anomaly level and a drop in the height of the center of mass occur simultaneously.
The design idea for these algorithms is to treat a fall event as an abnormal event and perform anomaly detection, but among the algorithms for fall detection, GAN-based fall detection has been less studied [21,22]; however, the existing studies show that GAN-based models exhibit superior performance in anomaly detection [6,7,23,24]. Nho et al. [22] proposed a GAN-based fall detection method based on local user initial information features (UI-GAN), which uses a heart rate sensor and accelerometer. The method achieves better results when compared with other common anomaly detection GAN models; the study also fully estimated that the inference latency of UI-GAN on the smartwatch is satisfactory. However, it is not clear how the size of the model is considered to meet the deployment requirements of the wearable device.
Therefore, our manuscript proposes a GAN-based fall detection lightweight model (Skip-DSCGAN) that uses spatiotemporal data from the accelerometer and gyroscope in the inertial sensor, which are some of the most common sensors used in wearable devices. A semisupervised learning approach is adopted to train the model using only ADL data, which can avoid data imbalance problems. The use of depthwise separable convolution allows the model to have a smaller size and reduce the number of computations. Skip connections enable the feature information extracted by the model to be better reconstructed. Meanwhile, Skip-DSCGAN’s anomaly score calculation does not calculate the error between the input data and the reconstructed input data but rather the error between the coded features of the input data and the coded features of the reconstructed input data, which makes the model more robust to noisy data. In addition, the Skip-DSCGAN model is compared with four other GAN models that have superior performance in anomaly detection, and the experimental results show that Skip-DSCGAN still has better detection performance while maintaining its low latency and small size.
Accelerometers and gyroscopes are some of the most common sensors used in wearable devices; they are usually integrated into inertial sensors, and ADL and fall events cause certain changes in acceleration and angular velocity. It is possible to determine whether a fall has occurred by capturing the changes in these spatiotemporal data. Here, we propose a lightweight fall detection model using Skip-DSCGAN based on both accelerometer and gyroscope data collected by inertial sensors. The model is inspired by the ideas of Skip-GANomaly [6], GANomaly [7], and MobileNet [8]. To solve the problem of data imbalance, the method uses only ADL data for model training.
The Skip-DSCGAN fall detection framework is shown in Fig. 1. The framework contains four main parts: data acquisition and preliminary threshold judgment, data preprocessing, Skip-DSCGAN model inference, calculating anomaly scores, and classification.
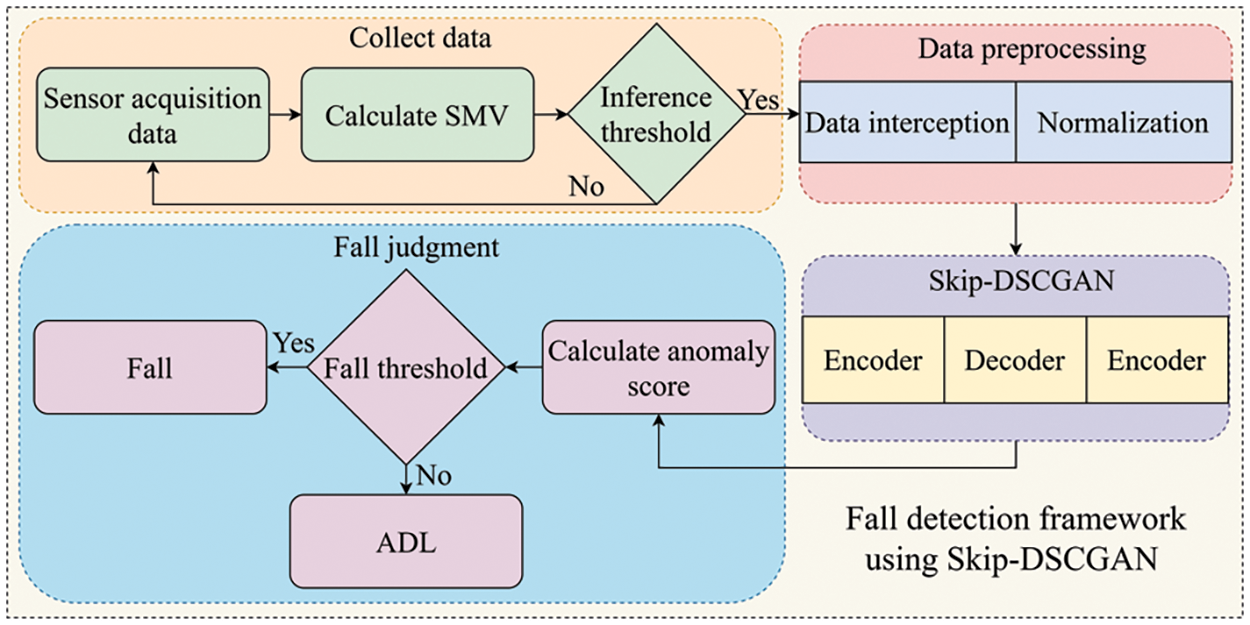
Figure 1: A fall detection framework using Skip-DSCGAN
3.1 Data Acquisition and Preliminary Threshold Judgment
Human motion data are collected using the accelerometer and gyroscope, which are placed at the same locations as the open dataset collection locations used for Skip-DSCGAN training. After the sensors acquire data, the sum magnitude vector (SMV) of the current time-stamped acceleration data is calculated and compared with the set model inference threshold. If the SMV reaches the model inference threshold, further data processing is performed; otherwise, the data acquisition continues. The calculation formula of the SMV and the comparison process of the model inference threshold are shown below:
In Eq. (1),
To determine the SMV threshold, this paper computes the publicly available dataset used for Skip-DSCGAN training, calculates the maximum SMV for each sample in the dataset, and then selects the smallest of these calculated SMV as the threshold.
To consider the computational cost of the edge device, the input of the model is in the form of a data window. The acquisition duration of the data is set to 3 s. Since the whole action of a fall is often less than 3 s, a data window of 3 s is sufficient for the fall judgment. The selection of the data window is achieved by calculating the SMV of the current timestamp. If the SMV meets the threshold in Section 3.1, the accelerometer and gyroscope data are intercepted for the first 1.5 s and the last 1.5 s of the current SMV timestamp.
The sampling frequency of the accelerometer and gyroscope used in this paper is 50 Hz, so there will be 900 data points in one data window. Then, we normalize the intercepted window data by mapping the values between [−1, 1]. The normalization formula is shown below:
In Eq. (3),
3.3 Network Structure and Theory of Skip-DSCGAN
GANomaly is an encoder-decoder-encoder-based model for anomaly detection. Research has demonstrated that this method has superior performance in anomaly detection [22], which determines whether abnormal events occur by calculating the error between the coded features of the input data and the coded features of the reconstructed data, while the model is robust to noisy data. Skip-GANomaly uses the encoder-decoder approach for anomaly detection with the idea of U-Net by adding a skip-connection to each layer of features corresponding to the encoder and decoder of the model, which gives the model a more powerful reconstruction ability to reconstruct features and input data. The anomaly score is obtained by calculating the error between the input data and the reconstructed input data and the error between the coded features of the generator network and the latent representations of the discriminator network. However, both the GANomaly and Skip-GANomaly models are large memory consumers, and they cannot be well deployed on wearable devices.
In these cases, we propose a GAN model (Skip-DSCGAN) for fall detection based on the ideas of Skip-GANomaly and GANomaly. To achieve a lightweight model and reduce the computational complexity, the encoder is implemented using the depthwise separable convolution in MobileNet while using a skip connection between the first encoder and the decoder. The network structure diagram of Skip-DSCGAN, which consists of two main parts: the generator network and the discriminator network, is shown in Fig. 2. x and
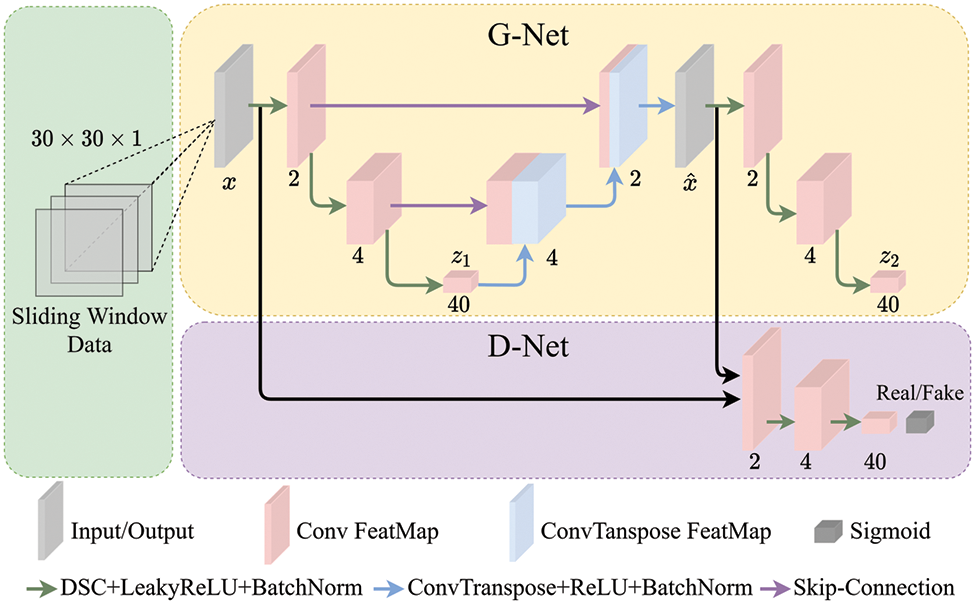
Figure 2: Skip-DSCGAN network architecture diagram
The generator network: The generator network of Skip-DSCGAN is similar to GANomaly, which adopts the encoder-decoder-encoder structure. The input data are passed through the first encoder to extract the deep encoding features, then the decoder is used to reconstruct the input data, and finally, the deep encoding features of the reconstructed data are extracted by the second encoder. Theoretically, the same encoding vector representation can reconstruct the original input, and similar data usually have similar encoding vector representations, which are just encoding features. When we adopt a semisupervised learning approach to train the model using only ADL data, the model will have the ability to reconstruct the ADL data, but the model will fail to reconstruct when it encounters fall data. In this way, it is possible to determine whether a fall event has occurred by calculating the error between the deep feature encoding features of the input data and the deep encoding features of the reconstructed data. Compared to this method of calculating the error between the input data and reconstructed input data, the former has better noise immunity. Depthwise separable convolution is used in the implementation of the encoder to minimize the parameters and computation of the model. In the implementation of the decoder, transposed convolution and upsampling are used to reconstruct the features and input data, and skip-connection in Skip-GANomaly is used between the first encoder and decoder of the generator network to fuse the feature information, which makes the model have stronger reconstruction capability, where the relevant modules and theories are as follows:
Depthwise separable convolution modules: The depthwise separable convolution modules are divided into two parts: depthwise convolution and pointwise convolution. Its schematic diagram is shown in Fig. 3.
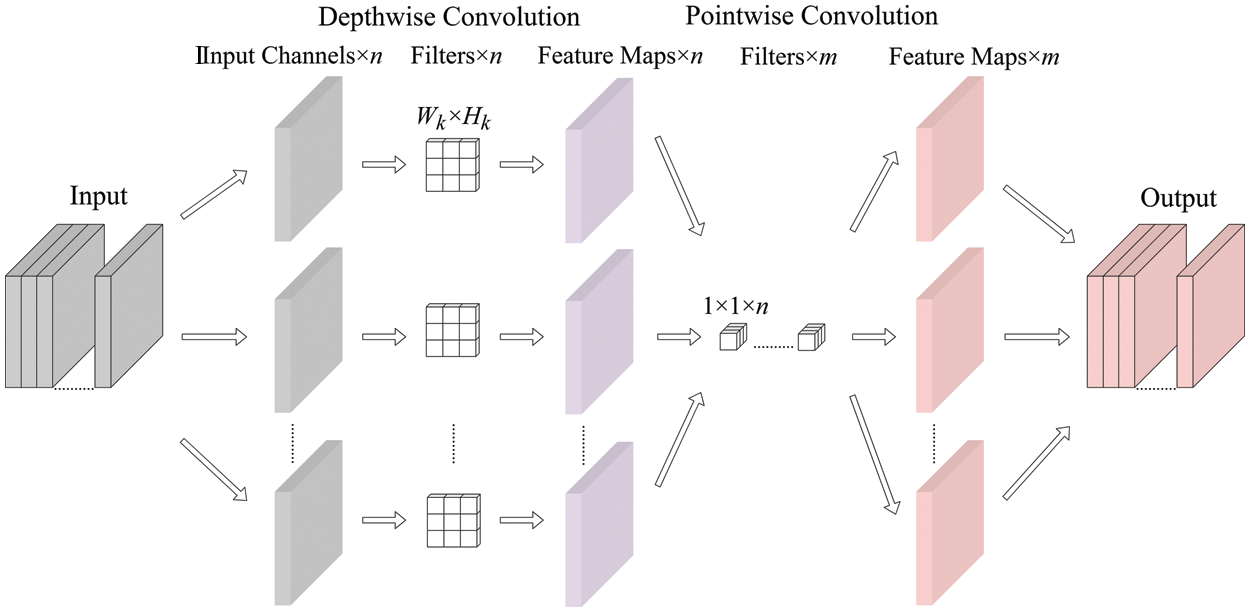
Figure 3: Depthwise separable convolution schematic
One convolution kernel of depthwise convolution is responsible for one channel, and one channel is convolved by only one convolution kernel. Using such a process produces the same number of feature map channels as the number of input channels, where a filter contains only one kernel of size
Since the number of feature maps after depthwise convolution is the same as the number of channels in the input layer, it is not possible to expand the feature maps. Meanwhile, this operation performs the convolution operation for each channel of the input layer independently and does not effectively use the feature information of different channels at the same spatial location. Therefore, pointwise convolution is needed to combine these feature maps to generate a new feature map.
The pointwise convolution operation is very similar to the regular convolution operation. The size of its convolution kernel is 1 × 1, and the number of kernels is the same as the number of feature maps output from the previous layer. The convolution operation here will combine the maps obtained by depthwise convolution in the depth direction to generate a new feature map. The number of filters is the same as the number of output feature maps. If the input shape is
Depthwise separable convolution with depthwise convolution and pointwise convolution reduces the number of parameters and the complexity of computation compared with conventional convolution, which is very suitable for the requirements of edge devices in the number of model parameters and the complexity of computation.
Transposed convolution modules: Transposed convolution is mainly used for upsampling, but it does not use a predetermined interpolation method; it has learnable parameters and can be used to obtain the optimal upsampling parameters by allowing the neural network to learn. The transposed convolution schematic is shown in Fig. 4.
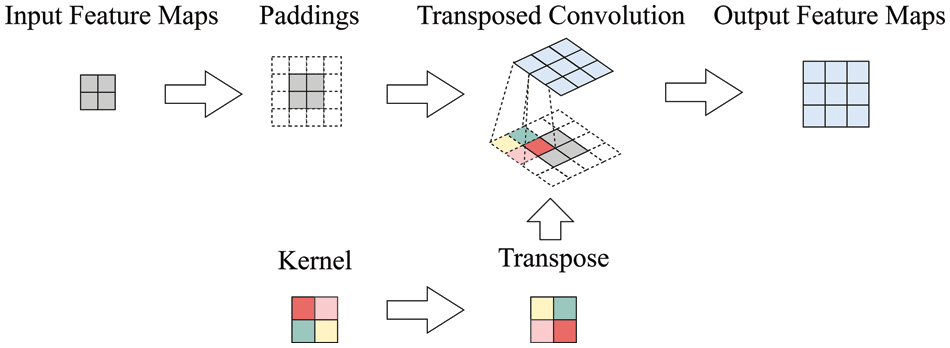
Figure 4: Transposed convolution schematic
Transposed convolution has some similarities to regular convolution in that the number of output channels is the same as the number of filters. The mathematical formula for the output size of the transposed convolution is expressed as:
In Eq. (6), i is the input size, k is the convolution kernel size, s is the convolution stride, and p is the padding size. The computation of transposed convolution is similar to that of pointwise convolution. If the input shape of the transposed convolution is
Skip-connection: There are two skip-connection operations in Skip-DSCGAN: copy and crop splicing. In crop splicing, the feature dimensionality needs to be consistent. Skip-connection improves the reconstruction capability of the model by fusing the deep and shallow feature information of the input data.
The discriminator network: The implementation of the discriminator network uses the same encoder as the generator network; the difference is that the discriminator network adds a classifier in the last layer. The inputs to the discriminator network are the original data and the reconstructed data from the generator network. Fall detection can be achieved without using the discriminator network for adversarial training. The purpose of introducing the discriminator network and adversarial training is to improve the model training efficiency, which can find the optimal parameters of the model faster and make the model perform better.
Training objective: The training objective of Skip-DSCGAN consists of generator loss and discriminator loss. There are three generator losses as follows:
(1) Contextual loss:
(2) Encoder loss:
(3) Adversarial loss:
Finally, the total training objective of the generator is the weighted sum of the above three losses. The objective function is as follows:
In this paper, the weight of each loss is set to 1,
The loss function of the discriminator is the same as the basic GAN, which is specifically defined mathematically as:
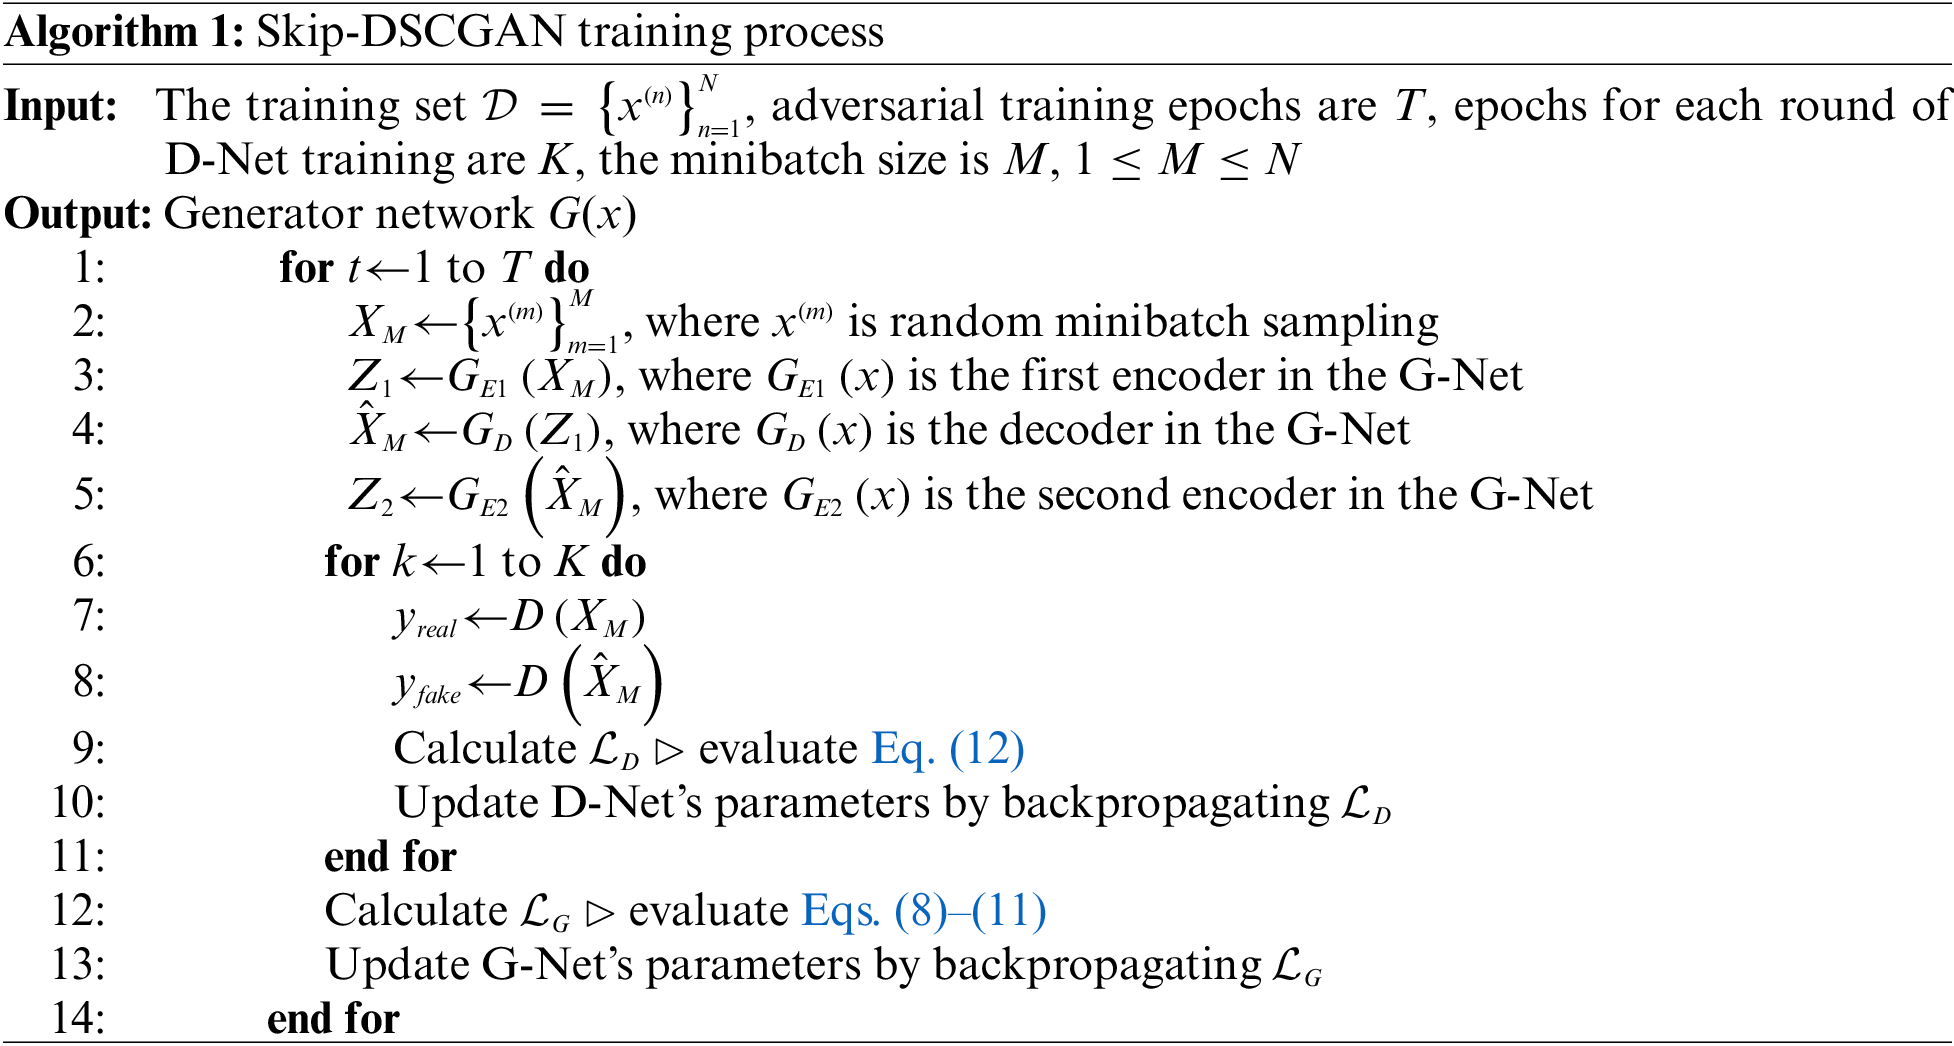
The pseudocode of the Skip-DSCGAN training process is shown in Algorithm 1. In the training process, the training set uses only ADL data, and the final fall detection is performed only to obtain the trained G-Net. First, the data in the training set are sampled to obtain a small batch of samples
3.4 Fall Threshold Delineation Based on Quantile
Skip-DSCGAN obtains the anomaly score of the input samples by calculating the error between the encoding features of the input data and the encoding features of the reconstructed data, which is similar to the encoder loss function introduced in Section 3.3, which determines whether a fall event occurred. Denote the anomaly score as
After obtaining the anomaly scores of the samples, we need to classify them. Since the model is trained using only normal (ADL) data, the anomaly scores obtained are usually small when normal data are input to the model. In contrast, when abnormal (fall) data are input into the model, it is difficult for the model to reconstruct their encoding features without training, so the anomaly scores are usually larger. In an ideal situation, it is easy to distinguish normal samples from abnormal samples by selecting the maximum anomaly score of the training samples as the threshold. However, in real situations, the model is affected by noisy samples, and there are outliers in the anomaly scores obtained from normal samples. For this situation, in some anomaly detection methods, clustering algorithms [26,27] or training classifiers by supervised learning [28,29] are usually used for automatic classification, which can effectively avoid the influence of outliers on classification; however, the computational complexity is very high, and the classifier also occupies a certain storage space of the device, which is inefficient for application on wearable devices. There are also some methods to categorise anomaly scores by setting thresholds in anomaly detection field [30–32], which have lower computational complexity than the above methods. But these existing methods can not fully consider the balance between noise values and normal samples when setting thresholds, which means that there is still some space for improvement in accuracy. Therefore, this paper adopts the quantile-based fall threshold delineation method to overcome the above drawbacks. This method is not only simple to calculate but also occupies little storage space and is suitable for application on wearable devices.
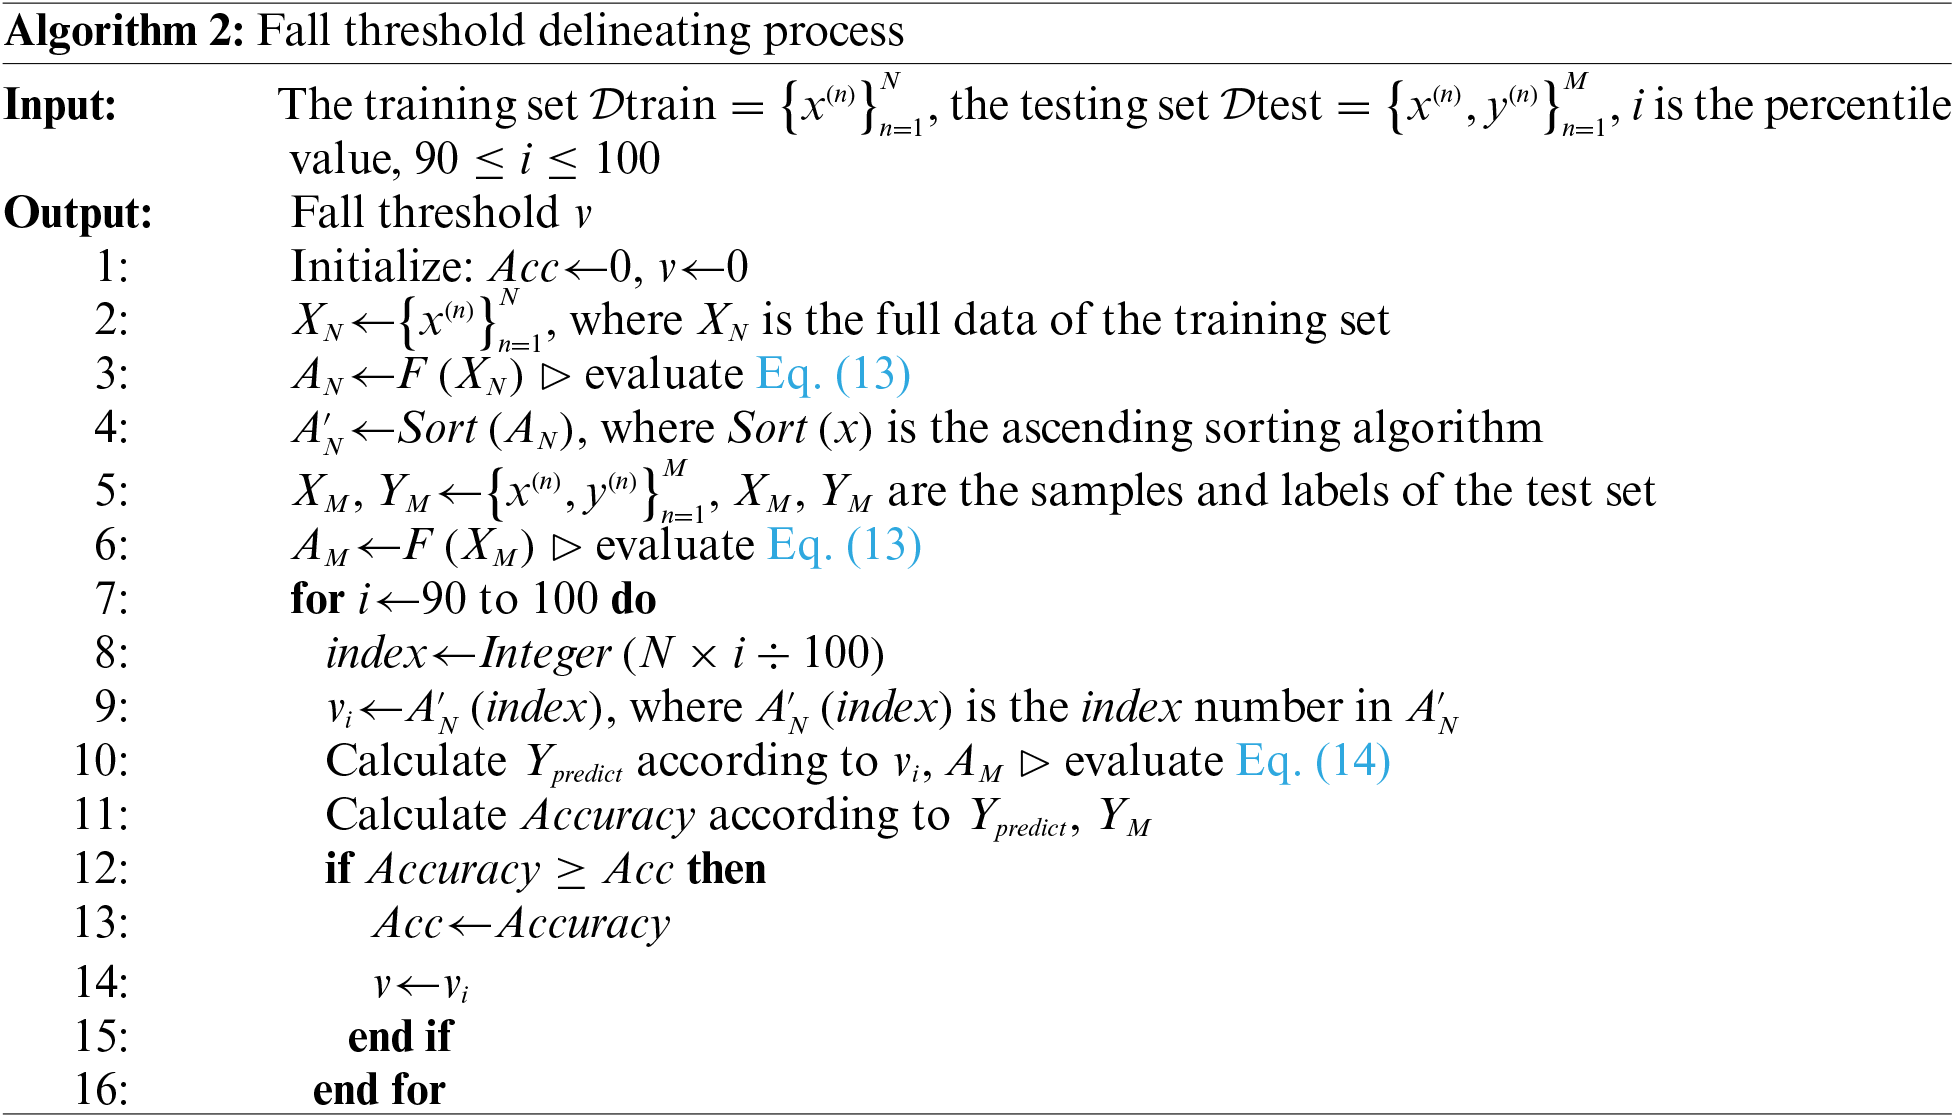
In this paper, the percentile method is used to determine the fall threshold, and its pseudocode is shown in Algorithm 2. The specific process is as follows: first, the anomaly scores of normal samples
Since the noise values in the normal samples usually obtain anomaly scores that are very similar to the abnormal samples. The approach of using the maximum anomaly score directly in the normal samples as a threshold would cause the algorithm to misclassify a large number of fall samples as ADL samples. Instead, we used the percentile approach to mathematically count the training data’s anomaly scores based on the algorithm’s results on the test set. It is possible to calculate the approximate position of the noise values in the percentile of the ADL samples, a relatively balanced threshold can be found between the normal and noise values in the ADL samples. Compared to using the maximum anomaly score of a typical sample as the threshold in an ideal environment, using the percentile to classify the anomaly threshold accounts for the noise values or outliers in the normal samples and minimizes the impact of noise samples on the algorithm.
Three main experiments are conducted to evaluate the performance of Skip-DSCGAN, which are described as follows: (1) Skip-DSCGAN is trained on public datasets SisFall and MobiAct, and the test sets are designed to evaluate the performance of Skip-DSCGAN. (2) Percentile-based fall threshold delineation method is compared with other anomaly scores classification methods to verify the classification effects. (3) Skip-DSCGAN is compared with four other GAN models that have superior performance in anomaly detection on the SisFall and MobiAct datasets. (4) The semisupervised learning methods, such as Skip-DSCGAN, and four other GAN models that have superior performance in anomaly detection are compared with the supervised learning methods commonly used in fall detection to evaluate the respective advantages and disadvantages of these two types of methods in fall detection.
To objectively evaluate the performance of Skip-DSCGAN, two public datasets for falls, SisFall and MobiAct, are used for testing in this paper; their details are as follows.
The SisFall [9] dataset has 4,505 samples, which are divided into two main categories: fall and ADL. There are 15 types of falls and 19 types of ADL. SisFall uses an accelerometer and gyroscope to collect human motion data, and the sensors are placed on the waist of the human body for data acquisition with a frequency of 200 Hz.
The MobiAct [10] dataset has 3,066 samples and is divided into two main categories, which are the same as the SisFall dataset; specifically, there are 4 types of falls and 9 types of ADLs. It uses inertial sensor modules (accelerometer, gyroscope, and orientation sensors) on the smartphone to collect human motion data, and the smartphone is placed in the pocket of the pants to collect the data with a sampling frequency of 200 Hz.
From the above, we know that the sampling frequencies of SisFall and MobiAct are different from the sampling frequency of the proposed method, which is 200 Hz for the former two and 50 Hz for Skip-DSCGAN. Therefore, it is necessary to downsample the data in SisFall and MobiAct to convert them into a uniform data format that is suitable for input into Skip-DSCGAN. We downsample the SisFall and MobiAct sample data by taking the mean value. In each sample, the sensor data were averaged every 4 time stamps. The downsampled data were then preprocessed in the same way as the method introduced in Section 3.2. Additionally, we note that there is an imbalance between fall data and ADL data in the open dataset, so the feasibility of the proposed method in this paper can be further evaluated.
In the experiments, every dataset is divided into a training set and a test set, the training set is used for training Skip-DSCGAN, and the testing set is used to evaluate the performance of Skip-DSCGAN after training. The datasets are divided as shown in Table 1, and the two types of samples are balanced in our test set, which can objectively reflect the model’s metrics.

4.2 Experimental Environment and Parameter Settings
The specific experimental environment is shown in Table 2, and the relevant parameters are configured as shown in Table 3.


To objectively evaluate the performance of the proposed algorithm, some evaluation metrics commonly used for model evaluation are used in this paper [17]. The specific evaluation metrics are as follows:
In this paper, the performance of Skip-DSCGAN is evaluated using two public datasets, SisFall and MobiAct. Skip-DSCGAN distinguishes ADL and fall events by calculating the error between the encoded features of the input data and the encoded features of the reconstructed data. The coding features and the reconstructed coding features of ADL and fall are shown in Fig. 5.
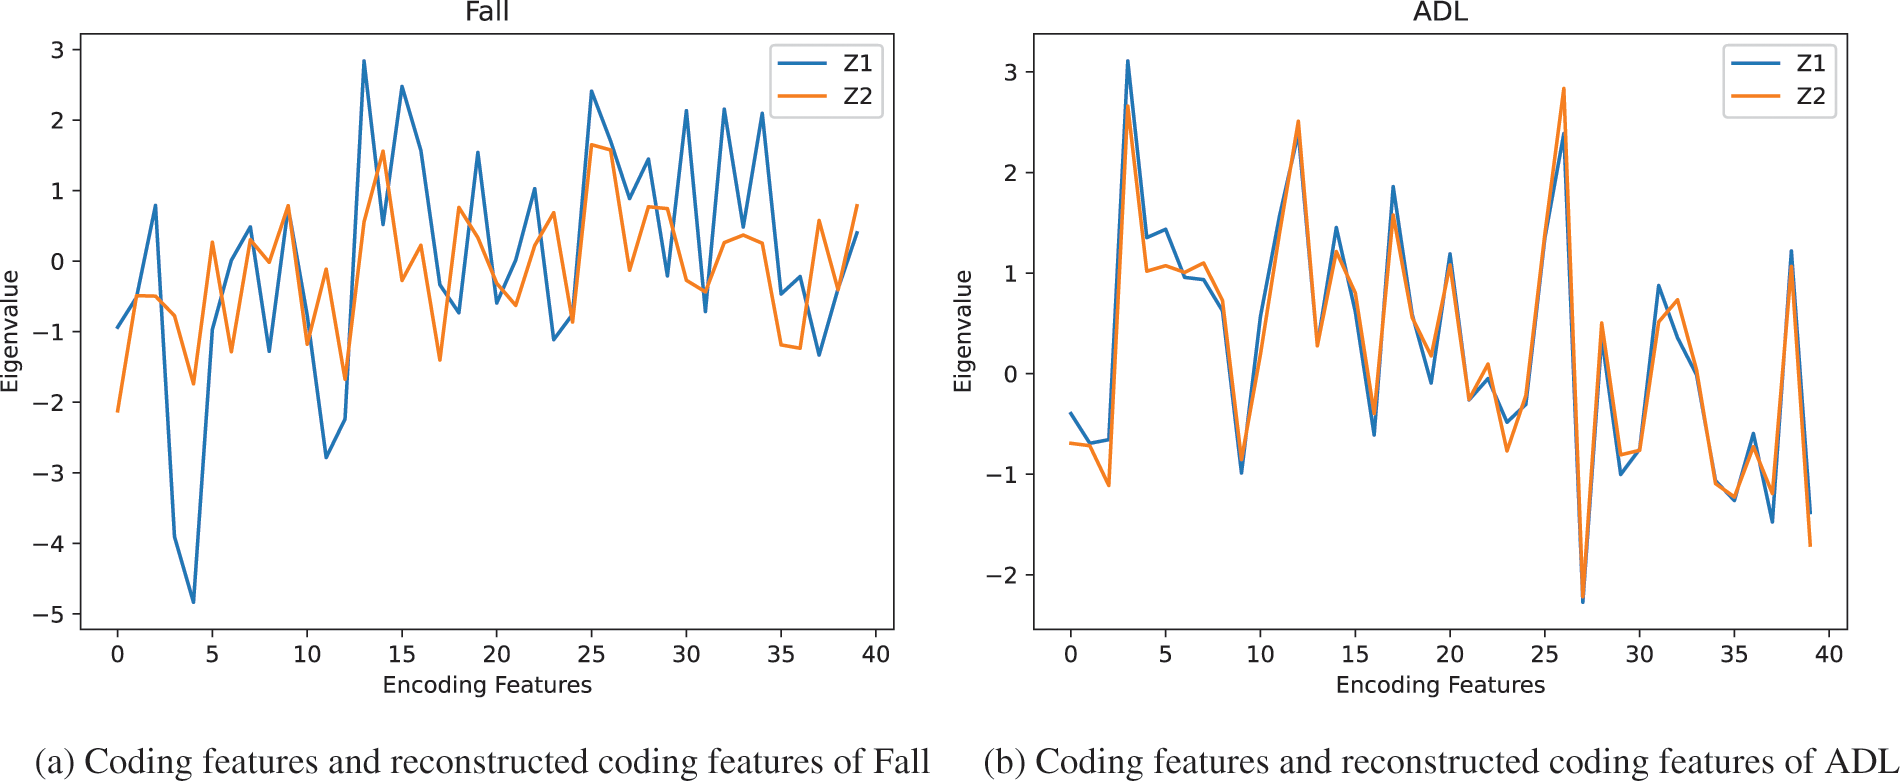
Figure 5: Coding features and reconstructed coding features of Fall and ADL
It can be seen that the error between the original coded features and the generated coded features in the ADL will be smaller compared to the fall. Because Skip-DSCGAN training only uses the ADL data, the ADL reconstruction error will be smaller, while when a fall event is encountered, Skip-DSCGAN has not trained the fall data, so it will fail to reconstruct and thus, obtain a larger reconstruction error.
The scatter plots of anomaly scores for ADL and fall events obtained by Skip-DSCGAN on the test set are shown in Fig. 6. Although the anomaly scores of the vast majority of ADL are smaller than that of the fall event, there are still some noisy samples with larger anomaly scores, so it is necessary to exclude the interference of these outliers in the division of the fall threshold. Determining the threshold by percentile can effectively reduce the impact of noisy samples on the algorithm’s performance, making the algorithm more robust and accurate.
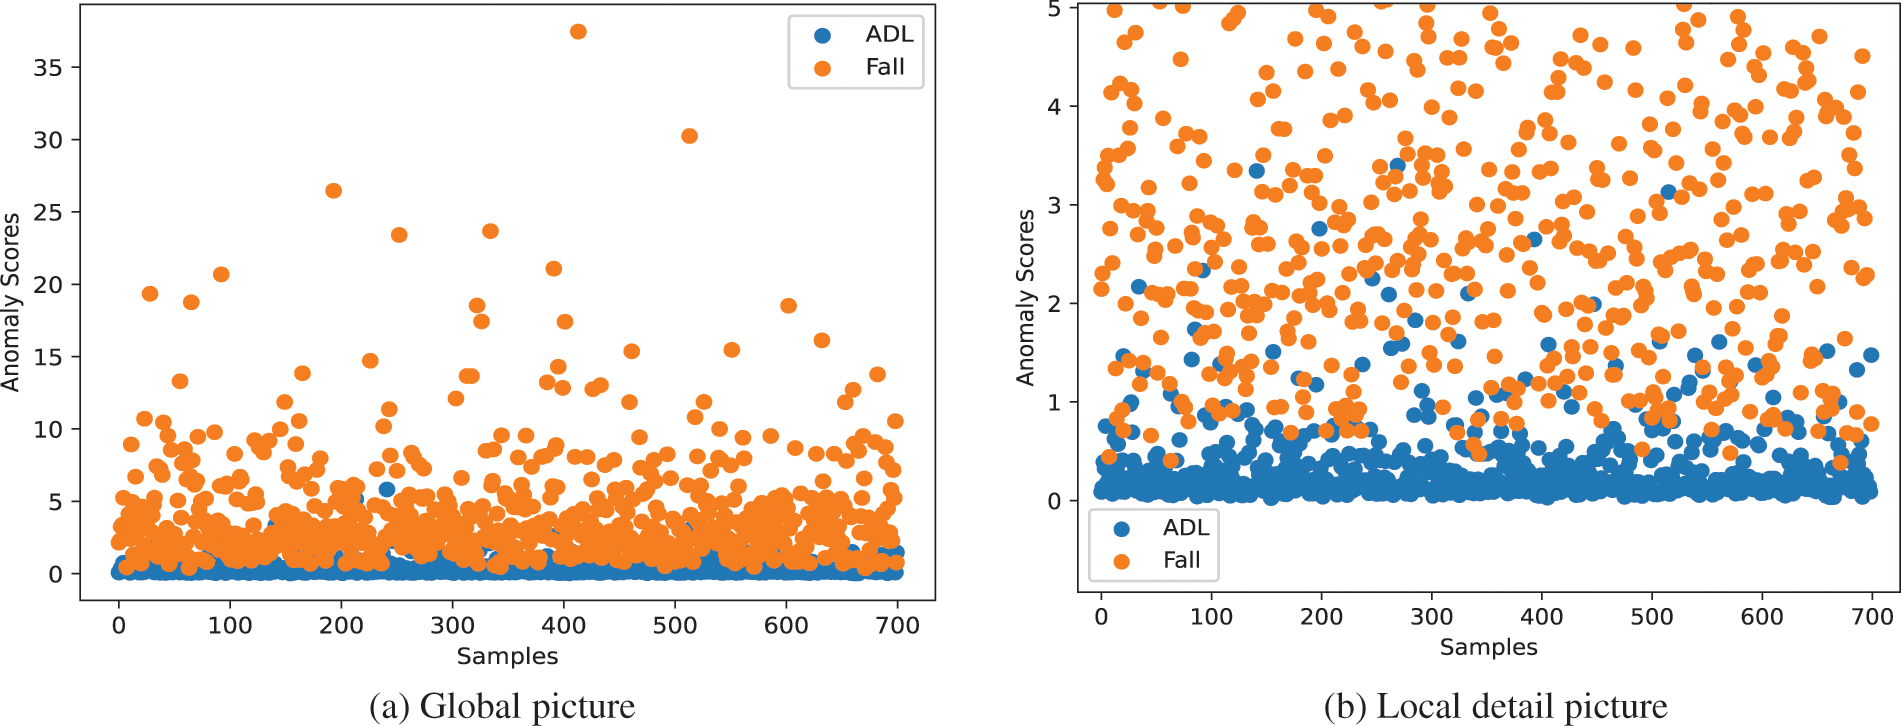
Figure 6: Scatterplot of anomaly scores for fall and ADL
5.1 Evaluation Results of Skip-DSCGAN on the SisFall and MobiAct Datasets
In this paper, the Skip-DSCGAN performance is evaluated using two public datasets, SisFall and MobiAct, and the evaluation results are shown in Fig. 7. In our experiment, the ADL samples and fall samples are balanced, so there is no need to consider the problem of falsely high accuracy. The confusion matrix of the test can be seen in Fig. 8. Among the 1,400 test samples in the SisFall dataset, Skip-DSCGAN predicted a total of 43 samples with errors, including 20 ADL samples and 23 fall samples, achieving 96.93% accuracy, 97.14% specificity, 96.71% sensitivity, 97.13% precision, and 96.92% F1 score. Among the 800 test data in the MobiAct dataset, a total of 58 samples were predicted incorrectly by Skip-DSCGAN, including 32 ADL samples and 26 fall samples, achieving 92.75% accuracy, 92% specificity, 93.5% sensitivity, 92.12% precision, and 92.8% F1 score.
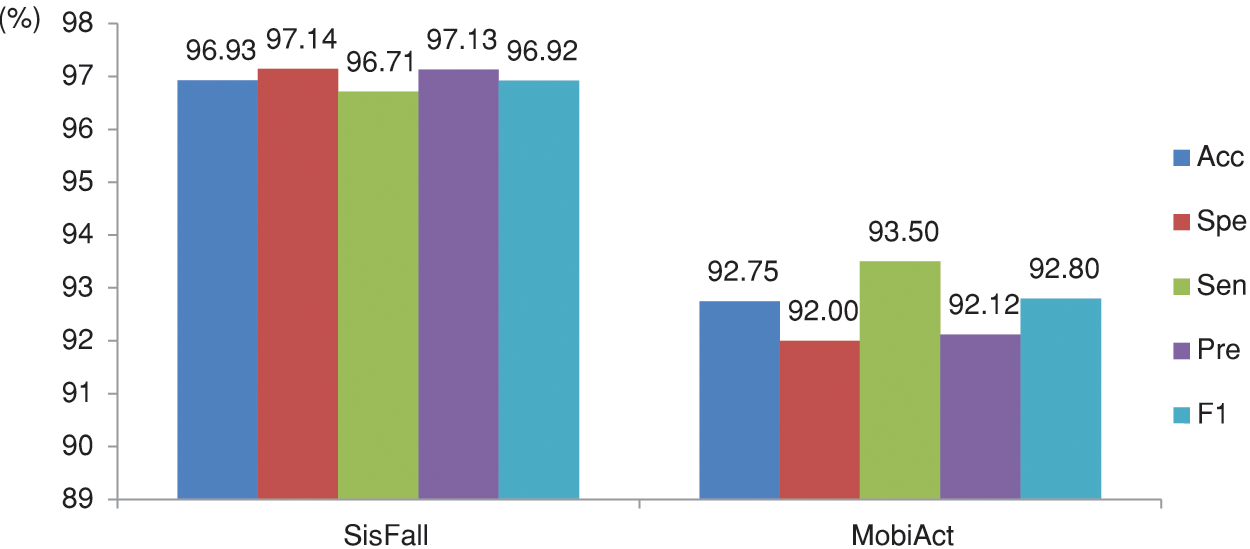
Figure 7: Performance of Skip-DSCGAN on SisFall and MobiAct
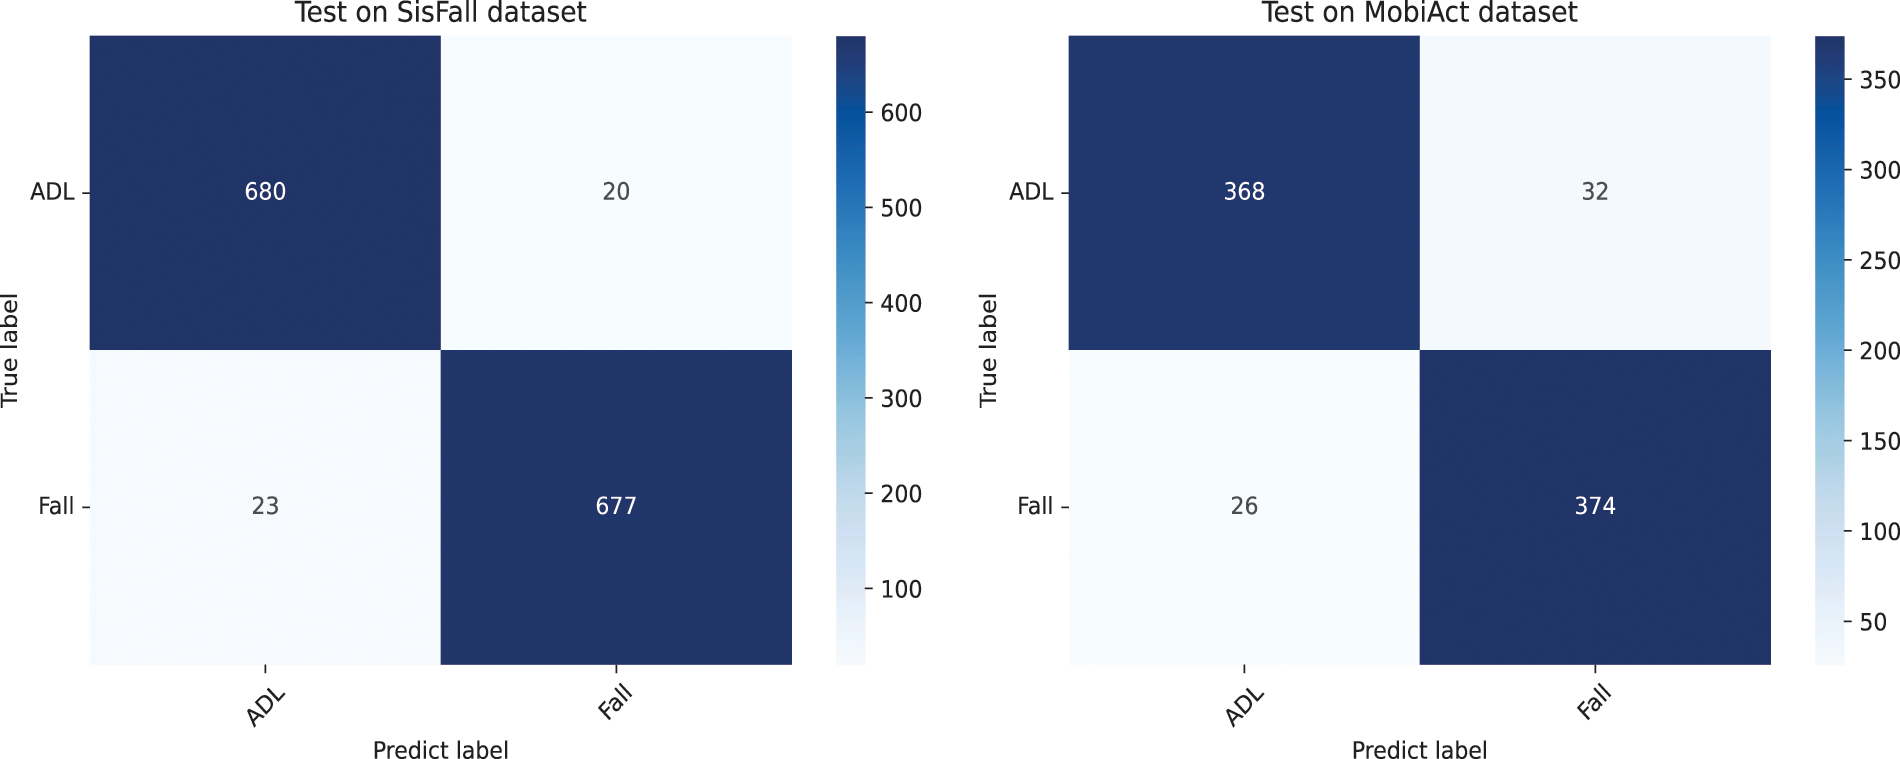
Figure 8: Skip-DSCGAN’s confusion matrix tested on SisFall and MobiAct
The experimental results show that fall detection using Skip-DSCGAN proposed in this paper can effectively distinguish fall events from ADL by calculating the error between the input data coding features and the reconstructed data coding features. Moreover, it can be seen from Fig. 7 that the method achieves good evaluation results on both SisFall and MobiAct, which indicates that the proposed method in this paper has a strong generalization capability for fall detection. Meanwhile, the performance of the proposed method on MobiAct is degraded compared to SisFall. This might be related to the different locations of the inertial sensor data acquisition, which have an impact on the performance of the model. To further investigate how well Skip-DSCGAN and other anomaly detection GAN models perform on fall detection, this paper designs experiments to compare Skip-DSCGAN with the other four GAN models that have superior performance in anomaly detection.
5.2 Comparison with Other Classification Methods for Anomaly Scores
In order to verify the classification effect of the percentile-based fall threshold delineation method on anomaly scores, this paper compares the commonly used methods for anomaly score classification in anomaly detection field, and the experimental results are shown in Table 4. In the table, maximum value [30], median absolute deviation (MAD) [31], box plot [32], and percentile method used in this paper, these methods complete the classification by setting the threshold. The last four methods achieve classification by training the classifiers.

Among four methods for setting thresholds [30–32], except for the maximum value method, the other three methods achieve satisfactory results. The percentile method proposed in this paper achieves the best results, reaching 96.93% accuracy, 97.14 specificity and 96.71 sensitivity. We analyze the results and know that there are some noise values in the normal sample, which have a greater impact on the maximum value method, while the other three threshold setting methods take into account the noise values in the actual situation, thus reducing the impact of noise values on the algorithm. Therefore, using the percentile method to set the fall threshold will be more comprehensive. Among the four methods using classifiers [26–29], the first two are clustering algorithms based on unsupervised learning and the last two are classification algorithms with supervised learning. From the comparison of these two types of algorithms, it can be seen that the classification algorithms with supervised learning achieve better results. We analyze that this is due to the different training methods, and the clustering algorithms based on unsupervised learning are more affected by the noise values. Compared to the other methods in Table 4, KNN achieved the best results in all metrics, reaching 97.14% accuracy, 97.29% specificity, 97% sensitivity and 93% accuracy, 92.5% specificity, 93.5% sensitivity on SisFall and MobiAct, respectively. Overall, the training classifier method achieves better results compared to the threshold delineation method, but the threshold method requires less data and makes calculation more efficient. Although the proposed method in this paper is about 0.2% and 0.25% lower than KNN in accuracy on SisFall and MobiAct, respectively. The training classifier method needs higher computational complexity, and the classifier also occupies a certain more storage space of the device, which is inefficient for application on wearable devices. Therefore, considering both the efficiency and lightweight characteristics of wearable devices, a slight performance sacrifice is worthwhile.
5.3 Comparison with Other GAN Models in Anomaly Detection
In this section, to investigate the performance difference between Skip-DSCGAN and the same type of model, this paper conducts comparison experiments between Skip-DSCGAN and the high-performing anomaly detection GAN on the public datasets SisFall and MobiAct. Furthermore, the results of the comparison experiments are expressed using ROC curves, and the performance between the models can be compared by the area under the curve (AUC) values. The experimental results are shown in Fig. 9 and Table 5.
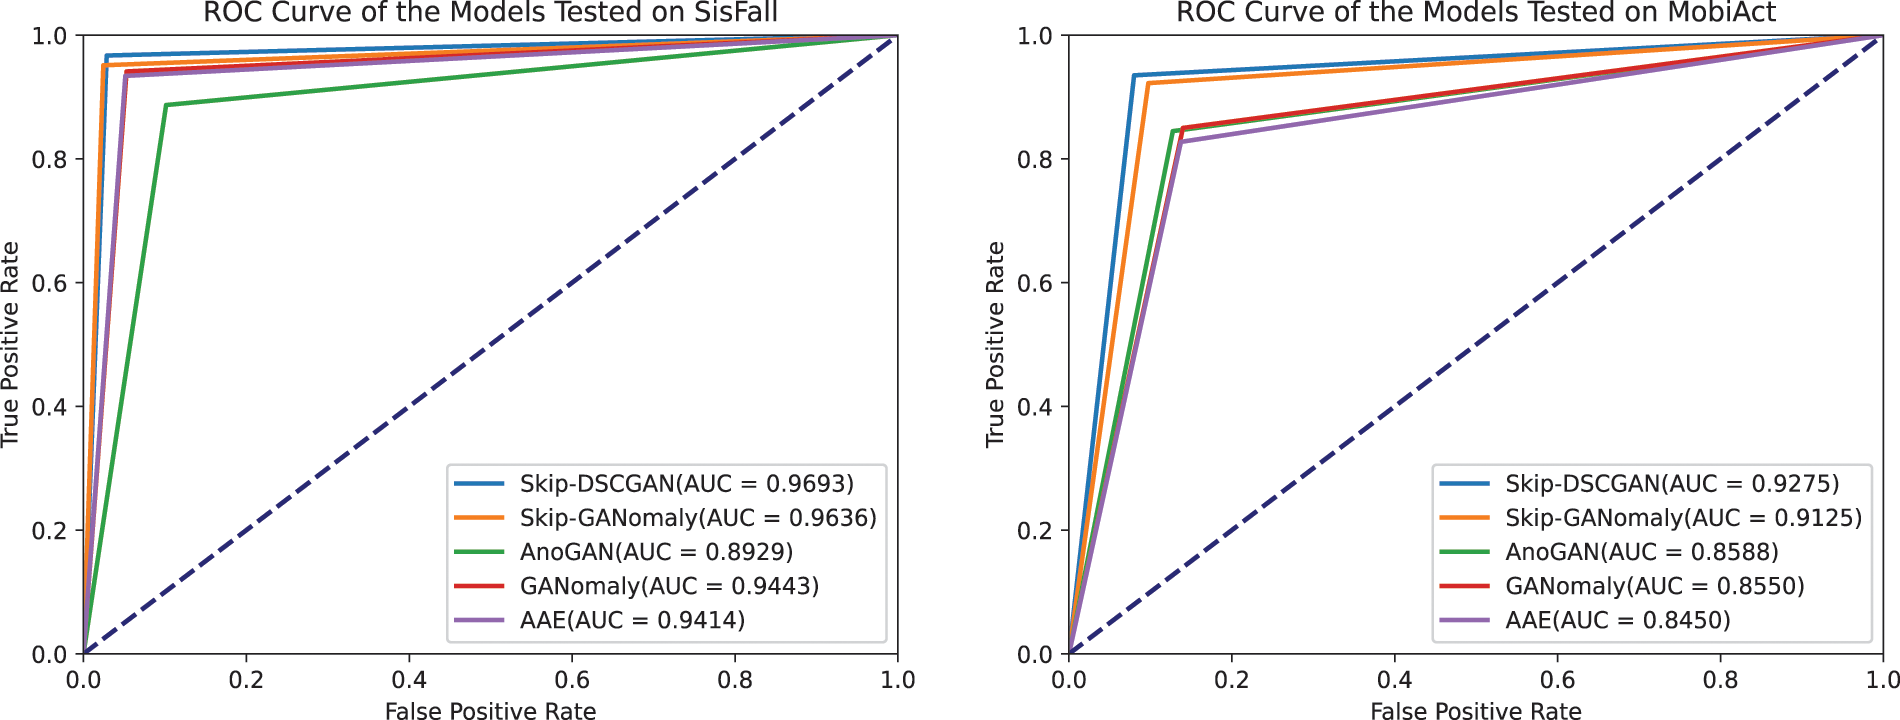
Figure 9: ROC curve of the models tested on SisFall and MobiAct

Fig. 9 and Table 5 show that the GAN models participating in the test on the SisFall dataset all achieved good results except AnoGAN. The proposed algorithm in this paper achieved the highest AUC value of 0.9693, but Skip-GANomaly achieved the highest 97.57% and 97.51% in specificity and precision, respectively, which indicates that Skip-DSCGAN is stronger in comprehensive performance, while Skip-GANomaly has stronger detection performance on ADL. To analyze the reasons, first, we think that Skip-GANomaly not only calculates the error between input data and reconstructed data but also calculates the error between the encoding features of the input data and the latent representations of the discriminator network in anomaly score calculation. Such an approach makes the network robust in the detection of ADL, while Skip-DSCGAN is targeted at wearable devices to reduce as much computational complexity as possible, but the subtle performance loss is worthwhile. Second, we also study the latent representations of the Skip-GANomaly discriminator network that are used for both classification and reconstruction and may not have consistent representations with the encoding features obtained by the generator network. Therefore, we simplify the anomaly score calculation by only calculating the error between the encoded features and the reconstructed encoded features, which are the same as GANomaly. On the MobiAct dataset, the performance of all the GAN models involved in the test degraded to some extent. Compared with other GAN models, Skip-DSCGAN achieved the highest results in all the evaluation metrics. For model size, Skip-DSCGAN has the smallest model size of 1.11 Meanwhile, Skip-DSCGAN has the lowest inferred latency of 29.85 ms. In contrast, AnoGAN has a good model size, but its inference latency and test results are poor. AAE has satisfactory inference latency, but the model size is too large for deployment on wearable devices. These experimental results show that Skip-DSCGAN maintains a smaller size than other GAN models while still having good detection performance, which meets the requirement of small size and low latency for deployment on wearable devices.
5.4 Comparison with Supervised Learning Models Commonly Used in Fall Detection
To further validate the performance of the proposed model and the feasibility of semisupervised learning methods in fall detection, we compare them with supervised learning models commonly used in fall detection. Table 6 contains the evaluation results of various models and frameworks in fall detection, which may have some small differences in the methods of data preprocessing among different frameworks, but still reflect the performance strengths and weaknesses of a model or a framework in general. They were both evaluated using the SisFall dataset. Moreover, the compared models are lightweight and meet the requirements for deployment on wearable devices.
It can be seen from the table that common supervised learning methods inevitably suffer from data imbalance, and the accuracy of these models is inflated, but the performance of these models can be objectively reflected by considering several other metrics (e.g., Spe, Sen). Among the common supervised learning methods, BiLSTM achieves better results on SisFall with 97.41% accuracy, 95.45% specificity, and 100% sensitivity, although there is some degree of test data imbalance. Next is CNN; its test data are balanced, and it has comprehensive detection capabilities, reaching 96.97% accuracy, 95.44% specificity, and 96.34% sensitivity. The test data of LSTM and GRU are unbalanced, there is an inflated accuracy, and by comparing Spe and Sen metrics, it can be seen that they are weaker in detecting fall events. Furthermore, the method using deep learning is slightly better than the method using machine learning because deep learning methods have a more powerful fitting ability when the data volume is larger. In machine learning methods, the KNN method can reach 97% specificity but only 87% sensitivity, which indicates that the performance is not sufficiently comprehensive. In comparison, XGBoost has a more comprehensive performance, reaching 93% specificity and 97% sensitivity. Moreover, the proposed semisupervised learning method is compared with the commonly used supervised learning methods. The comparison from the table shows that the semisupervised methods and supervised methods have their strengths in some evaluation metrics, and the overall difference is not significant. The above illustrates that the performance of these two types of methods is similar in fall detection. Supervised methods need to address the data imbalance problem, which may cause the algorithm to be overstated in some evaluation metrics. In contrast, semisupervised approaches avoid such a problem and tend to have much lower data requirements than supervised approaches. A semisupervised learning approach is more appropriate and effective for fall detection, which also provides a solution to the difficulty of obtaining data on elderly falls to provide data for model training.
We propose an IoT-based spatiotemporal data processing framework based on a generative adversarial network for fall detection, which adopts a semisupervised learning approach and uses only ADL samples for training, avoiding the data imbalance problem faced by supervised learning for fall detection. We choose GAN models with superior performance in the anomaly detection field, Skip-GANomaly, and GANomaly, as the main reference models and improve them for their shortcomings. Thus, this research proposes a fall detection method using Skip-DSCGAN, which combines the advantages and usage scenarios of the two methods for wearable devices. The method automatically extracts features with the model, reducing computation and latency. When detecting ADL data, the anomaly score obtained is typically small. However, in the case of fall data, Skip-DSCGAN fails to reconstruct, resulting in a higher anomaly score. As a result, setting a fall threshold enables ADL and fall events to be distinguished.
The research also proposed a percentile-based method for delineating fall thresholds in wearable devices to categorize anomaly scores and minimize the impact of noise values. Table 4 shows the comparison experiments of this method. The results indicate that the percentile-based method achieves high classification accuracy and efficient computational performance. Skip-DSCGAN has good fall detection performance and strong generalization ability, achieving 96.93% and 92.75% accuracy on the SisFall and MobiAct datasets, respectively. Table 5 shows the comparison experiments of Skip-DSCGAN. Skip-DSCGAN achieves better results than Skip-GANomaly, GANomaly, AnoGAN, and AAE. Compared with Skip-GANomaly and GANomaly on SisFall, the accuracy is improved by 0.5% and 2.5%, respectively. Moreover, satisfactory results are achieved in both model size and inference delay.
When comparing these GAN models with seven commonly used supervised learning algorithms for fall detection, the results indicate that the performance of semi-supervised learning methods using GAN models is comparable to that of supervised learning methods. However, the semi-supervised methods offer the advantage of mitigating data imbalance issues and generally require less data than supervised methods. Therefore, it is still worthwhile to investigate the application of semisupervised learning approaches in the fall detection field. In future research, we will study the relationship between the encoding features and the distribution of ADL samples to optimize the feature extraction method. Furthermore, we plan to explore the application of the proposed fall detection method on wearable devices and investigate the integration of multiple information sources, such as sound, to enhance the accuracy and robustness of the system.
Acknowledgement: The authors thank our professors, friends, and reviewers for their comments on this paper.
Funding Statement: This work is supported partly by the Natural Science Foundation of Zhejiang Province, China (LGF21F020017).
Author Contributions: The authors confirm contribution to the paper as follows: study conception and design: K. Fang, J. Pan; data collection: L. Li, R. Xiang; analysis and interpretation of results: K. Fang, J. Pan, L. Li, R. Xiang; draft manuscript preparation: K. Fang, J. Pan. All authors reviewed the results and approved the final version of the manuscript.
Availability of Data and Materials: The data used to support the findings of this study are available in [9,10].
Conflicts of Interest: The authors declare that they have no conflicts of interest to report regarding the present study.
References
1. World Health Organization (WHO“Falls,” [Online]. Available: https://www.who.int/news-room/fact-sheets/detail/falls (accessed on 01/08/2023) [Google Scholar]
2. H. Sadreazami, M. Bolic and S. Rajan, “Contactless fall detection using time-frequency analysis and convolutional neural networks,” IEEE Transactions on Industrial Informatics, vol. 17, no. 10, pp. 6842–6851, 2021. [Google Scholar]
3. Q. Feng, C. Gao, L. Wang, Y. Zhao, T. Song et al., “Spatio-temporal fall event detection in complex scenes using attention guided LSTM,” Pattern Recognition Letters, vol. 130, pp. 242–249, 2020. [Google Scholar]
4. Y. Yang, H. Yang, Z. Liu, Y. Yuan and X. Guan, “Fall detection system based on infrared array sensor and multi-dimensional feature fusion,” Measurement, vol. 192, pp. 110870, 2022. [Google Scholar]
5. F. J. Gonzalez-Canete and E. Casilari, “A feasibility study of the use of smartwatches in wearable fall detection systems,” Sensors, vol. 21, no. 6, pp. 2254, 2021. [Google Scholar] [PubMed]
6. S. Akcay, A. Atapour-Abarghouei and T. P. Breckon, “Skip-GANomaly: Skip connected and adversarially trained encoder-decoder anomaly detection,” in 2019 Int. Joint Conf. on Neural Networks (IJCNN), Budapest, Hungary, pp. 1–8, 2019. [Google Scholar]
7. S. Akcay, A. Atapour-Abarghouei and T. P. Breckon, “GANomaly: Semi-supervised anomaly detection via adversarial training,” in Computer Vision–ACCV 2018: 14th Asian Conf. on Computer Vision, Perth, Australia, pp. 622–637, 2019. [Google Scholar]
8. A. G. Howard, M. Zhu, B. Chen, D. Kalenichenko, W. Wang et al., “MobileNets: Efficient convolutional neural networks for mobile vision applications,” arXiv preprint arXiv:1704.04861, 2017. [Google Scholar]
9. A. Sucerquia, J. D. López and J. F. Vargas-Bonilla, “SisFall: A fall and movement dataset,” Sensors, vol. 17, no. 1, pp. 198, 2017. [Google Scholar] [PubMed]
10. G. Vavoulas, C. Chatzaki, T. Malliotakis, M. Pediaditis and M. Tsiknakis, “The mobiact dataset: Recognition of activities of daily living using smartphones,” in Int. Conf. on Information and Communication Technologies for Ageing Well and e-Health, Prague, Czech Republic, vol. 2, pp. 143–151, 2016. [Google Scholar]
11. E. Casilari, R. Lora-Rivera and F. Garcia-Lagos, “A study on the application of convolutional neural networks to fall detection evaluated with multiple public datasets,” Sensors, vol. 20, no. 5, pp. 1466, 2020. [Google Scholar] [PubMed]
12. A. S. Syed, D. Sierra-Sosa, A. Kumar and A. Elmaghraby, “A deep convolutional neural network-XGB for direction and severity aware fall detection and activity recognition,” Sensors, vol. 22, no. 7, pp. 2547, 2022. [Google Scholar] [PubMed]
13. A. Ramanathan and J. McDermott, “Fall detection with accelerometer data using Residual Networks adapted to multi-variate time series classification,” in 2021 Int. Joint Conf. on Neural Networks (IJCNN), Shenzhen, China, pp. 1–8, 2021. [Google Scholar]
14. F. Luna-Perejon, M. J. Dominguez-Morales and A. Civit-Balcells, “Wearable fall detector using recurrent neural networks,” Sensors, vol. 19, no. 22, pp. 4885, 2019. [Google Scholar] [PubMed]
15. M. Waheed, H. Afzal and K. Mehmood, “NT-FDS-A noise tolerant fall detection system using deep learning on wearable devices,” Sensors, vol. 21, no. 6, pp. 2006, 2021. [Google Scholar] [PubMed]
16. R. Delgado-Escano, F. M. Castro, J. R. Cozar, M. J. Marin-Jimenez, N. Guil et al., “A cross-dataset deep learning-based classifier for people fall detection and identification,” Computer Methods and Programs in Biomedicine, vol. 184, pp. 105265, 2020. [Google Scholar] [PubMed]
17. Y. Li, Z. Zuo and J. Pan, “Sensor-based fall detection using a combination model of a temporal convolutional network and a gated recurrent unit,” Future Generation Computer Systems, vol. 139, pp. 53–63, 2023. [Google Scholar]
18. S. S. Jeong, N. H. Kim and Y. S. Yu, “Fall detection system based on simple threshold method and long short-term memory: Comparison with hidden Markov model and extraction of optimal parameters,” Applied Sciences, vol. 12, no. 21, pp. 11031, 2022. [Google Scholar]
19. L. Gong, L. Zhang, M. Zhu, R. Clifford, C. Duff et al., “A novel computer vision-based data driven modelling approach for person specific fall detection,” Journal of Ambient Intelligence and Smart Environments, vol. 13, no. 5, pp. 373–387, 2021. [Google Scholar]
20. F. Jin, A. Sengupta and S. Cao, “mmFall: Fall detection using 4-D mmwave radar and a hybrid variational RNN autoencoder,” IEEE Transactions on Automation Science and Engineering, vol. 19, no. 2, pp. 1245–1257, 2022. [Google Scholar]
21. W. W. Hsu, J. M. Guo, C. Y. Chen and Y. C. Chang, “Fall detection with the spatial-temporal correlation encoded by a sequence-to-sequence denoised GAN,” Sensors, vol. 22, no. 11, pp. 4194, 2022. [Google Scholar] [PubMed]
22. Y. H. Nho, S. Ryu and D. S. Kwon, “UI-GAN: Generative adversarial network-based anomaly detection using user initial information for wearable devices,” IEEE Sensors Journal, vol. 21, no. 8, pp. 9949–9958, 2021. [Google Scholar]
23. A. Makhzani, J. Shlens, N. Jaitly, I. Goodfellow and B. Frey, “Adversarial autoencoders,” arXiv preprint arXiv:1511.05644, 2015. [Google Scholar]
24. T. Schlegl, P. Seeböck, S. M. Waldstein, U. Schmidt-Erfurth and G. Langs, “Unsupervised anomaly detection with generative adversarial networks to guide marker discovery,” in Int. Conf. on Information Processing in Medical Imaging, Boone, NC, USA, pp. 146–157, 2017. [Google Scholar]
25. Z. Huang, Q. Niu, I. You and G. Pau, “Acceleration feature extraction of human body based on wearable devices,” Energies, vol. 14, no. 4, pp. 924, 2021. [Google Scholar]
26. A. G. Roselin, P. Nanda, S. Nepal and X. He, “Intelligent anomaly detection for large network traffic with Optimized Deep Clustering (ODC) algorithm,” IEEE Access, vol. 9, pp. 47243–47251, 2021. [Google Scholar]
27. H. Saeedi Emadi and S. M. Mazinani, “A novel anomaly detection algorithm using DBSCAN and SVM in wireless sensor networks,” Wireless Personal Communications, vol. 98, pp. 2025–2035, 2018. [Google Scholar]
28. Y. Chen and L. Lu, “The anomaly detector, semi-supervised classifier, and supervised classifier based on K-Nearest neighbors in geochemical anomaly detection: A comparative study,” Mathematical Geosciences, vol. 55, pp. 1011–1033, 2023. [Google Scholar]
29. A. Copiaco, Y. Himeur, A. Amira, W. Mansoor, F. Fadli et al., “An innovative deep anomaly detection of building energy consumption using energy time-series images,” Engineering Applications of Artificial Intelligence, vol. 119, pp. 105775, 2023. [Google Scholar]
30. Y. Han and H. Chang, “XA-GANomaly: An explainable adaptive semi-supervised learning method for intrusion detection using GANomaly,” Computers, Materials & Continua, vol. 76, no. 1, pp. 221–237, 2023. [Google Scholar]
31. X. Wang, Z. Yao and M. Papaefthymiou, “A real-time electrical load forecasting and unsupervised anomaly detection framework,” Applied Energy, vol. 330, pp. 120279, 2023. [Google Scholar]
32. H. S. Dhiman, D. Deb, S. Muyeen and I. Kamwa, “Wind turbine gearbox anomaly detection based on adaptive threshold and twin support vector machines,” IEEE Transactions on Energy Conversion, vol. 36, no. 4, pp. 3462–3469, 2021. [Google Scholar]
33. J. Alizadeh, M. Bogdan, J. Classen and C. Fricke, “Support vector machine classifiers show high generalizability in automatic fall detection in older adults,” Sensors, vol. 21, no. 21, pp. 7166, 2021. [Google Scholar] [PubMed]
34. D. Cahoolessur and B. Rajkumarsingh, “Fall detection system using XGBoost and IoT,” R&D Journal, vol. 36, pp. 8–18, 2020. [Google Scholar]
Cite This Article
 Copyright © 2024 The Author(s). Published by Tech Science Press.
This work is licensed under a Creative Commons Attribution 4.0 International License , which permits unrestricted use, distribution, and reproduction in any medium, provided the original work is properly cited.


 Submit a Paper
 Propose a Special lssue
 View Full Text
 Download PDF
 Downloads
 Citation Tools