
 Submit a Paper
 Propose a Special lssue
 Open Access
ARTICLE

Phase-Field Simulation of δ Hydride Precipitation with Interfacial Anisotropy
1 School of Materials Science and Engineering, Collaborative Innovation Center of Ministry of Education and Shanxi Province for High-Performance Al/Mg Alloy Materials, North University of China, Taiyuan, 030051, China
2 Beijing Advanced Innovation Center for Materials Genome Engineering, University of Science and Technology Beijing, Beijing, 100083, China
3 Institute of Materials Intelligent Technology, Liaoning Academy of Materials, Shenyang, 110004, China
* Corresponding Author: Yuhong Zhao. Email:
Computers, Materials & Continua 2023, 77(2), 1425-1443. https://doi.org/10.32604/cmc.2023.044510
Received 01 August 2023; Accepted 31 October 2023; Issue published 29 November 2023
 View Full Text
 Download PDF
Abstract
Previous studies of hydride in zirconium alloys have mainly assumed an isotropic interface. In practice, the difference in crystal structure at the interface between the matrix phase and the precipitate phase results in an anisotropic interface. With the purpose of probing the real evolution of hydrides, this paper couples an anisotropy function in the interfacial energy and interfacial mobility. The influence of anisotropic interfacial energy and interfacial mobility on the morphology of hydride precipitation was investigated using the phase-field method. The results show that the isotropy hydride precipitates a slate-like morphology, and the anisotropic hydride precipitates at the semi-coherent and non-coherent interfaces exhibited parallelogram-like and needle-like, which is consistent with the actual experimental morphology. Compared with the coherent interface, the semi-coherent or non-coherent interface adjusts the lattice mismatch, resulting in lower gradient energy that is more consistent with the true interfacial state. Simultaneously, an important chain of relationships is proposed, in the range of ( or ), with the increase of the anisotropic mobility in the y-axis, the gradient energy increases (decreases), the tendency of the non-coherent (semi-coherent) relationship at the interface, and the precipitation rate of hydride decreases (increases). Furthermore, the inhomogeneous stress distribution around the hydride leads to a localized enrichment of the hydrogen concentration, producing a hydride tip. The study of interfacial anisotropy is informative for future studies of hydride precipitation orientation and properties.Keywords
Zirconium alloy is widely used in nuclear fuel rod cladding for nuclear reactors, motivated by excellent mechanical properties, corrosion resistance, and low neutron adsorption cross-section [1]. In nuclear reactors, at constant temperatures, the concentration of hydrogen in a solid solution is lower than the final solid solubility of the hydride precipitate [2]. When the hydrogen concentration reaches its solid solution limit, the zirconium alloy absorbs hydrogen to produce brittle
The nature of the interface between the
The phase-field method is a good remedy for the inability of experiments to observe the phase transformation process dynamically and continuously [12–14]. This method has been used to simulate and predict the microstructure and tissue morphology evolution during the phase transformation of materials by solving the controlling equations [15–17]. It helps to understand the precipitation mechanism of solid phase change processes [18–24]. The phase-field method has been widely used to simulate the microstructure of hydride in zirconium alloy [25–29]. Usually, the majority of research on stress-induced (internal stress and external load) nucleation, growth, stacking, and reorientation behavior of
In fact, due to the difference in crystal structure between the hexagonal close-packed (HCP) matrix phase and the face-centered cubic (FCC)
The phase-field simulation for
Cahn-Hilliard phase-field equation:
Allen-Cahn phase-field equation:
where
Total free energy of the system [44]:
where
The chemical free energy density
where
The strain energy can be calculated according to the Khanchaturyan theory of micro-elastic strain energy [46–48]:
where
The lattice difference between the FCC
where
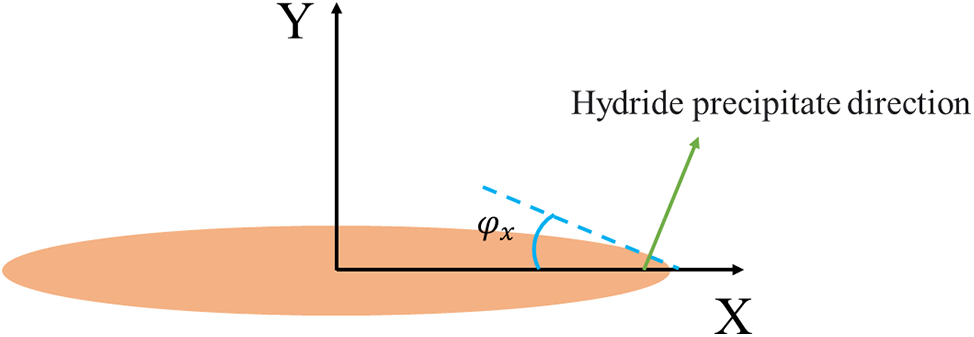
Figure 1: Schematic representation of the angle
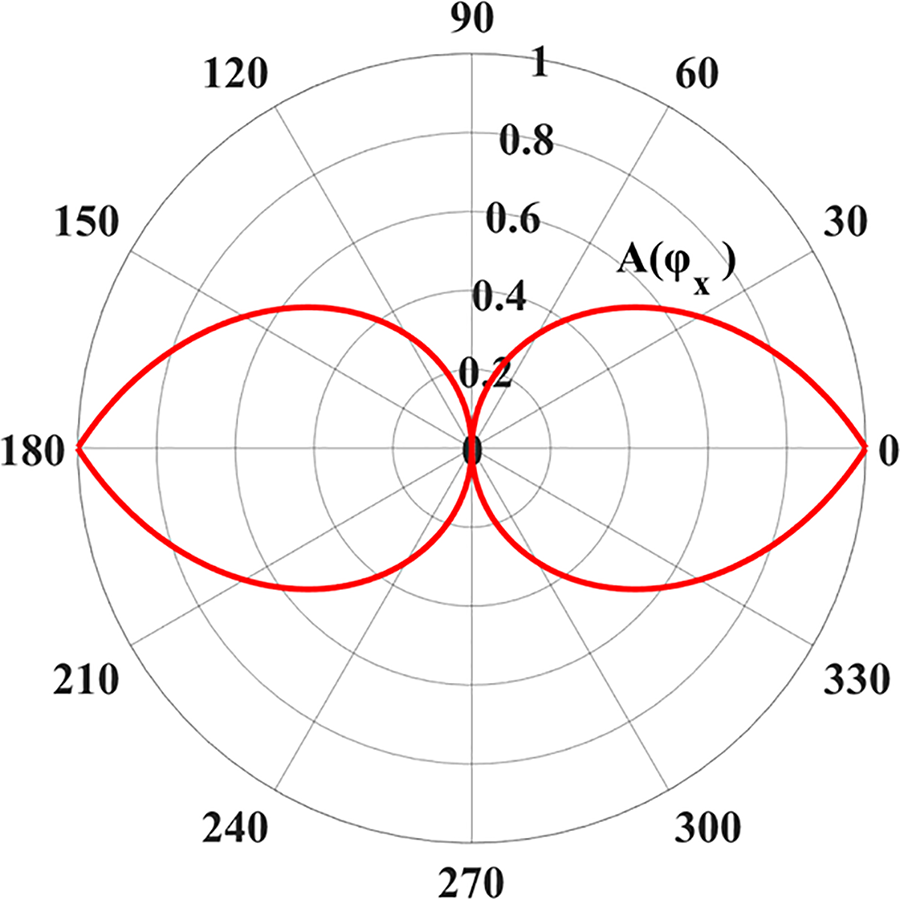
Figure 2: Anisotropic functions
In the KKS (Kim, Kim, and Suzuki) phase field model, interfacial mobility is related to interfacial energy [52]. The interfacial mobility
where
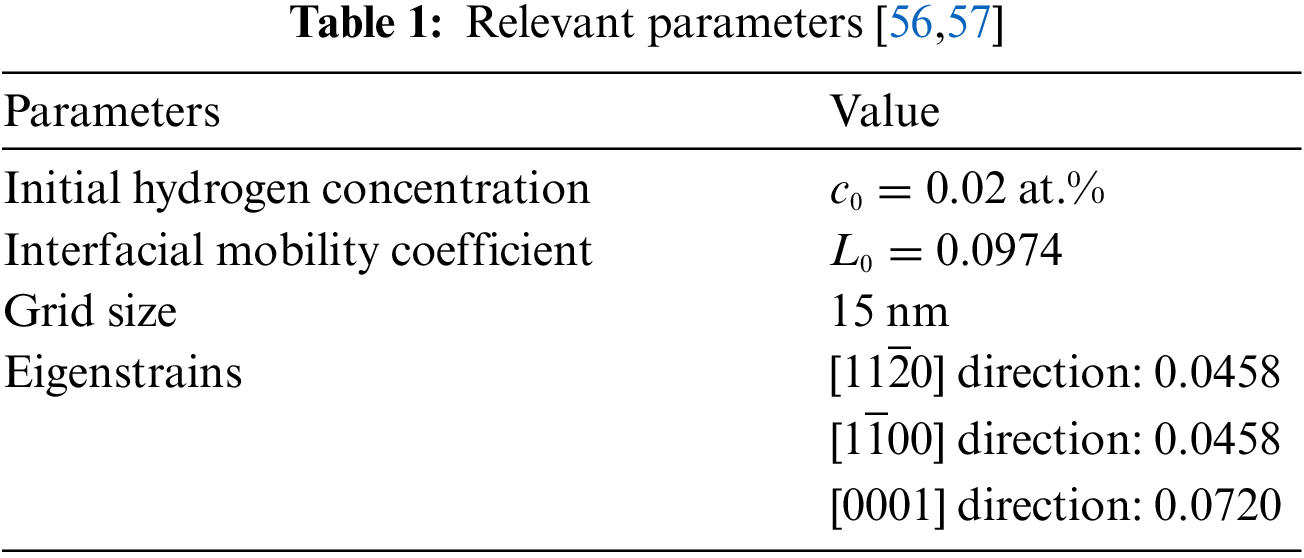
The relevant parameters are shown in the following Table 1:
3 Simulation Results and Analysis
The crystal structure and lattice constant of the hydride precipitate phase and matrix phase are different, resulting in a semi-coherent or non-coherent interface. Differences in interfacial states will produce differences in interfacial energy, resulting in interfacial anisotropy of the hydride, which affects the precipitate morphology and orientation of the hydride. Fig. 3 is a schematic diagram of the hydride variants with different precipitation orientations. The formation of
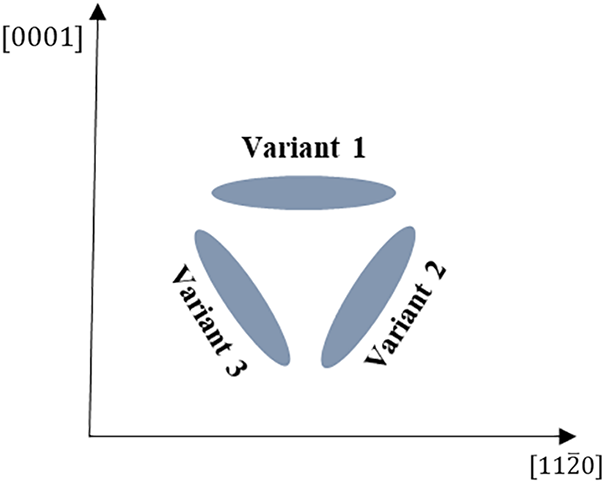
Figure 3: Schematic diagram of different precipitation orientation variants of hydrides
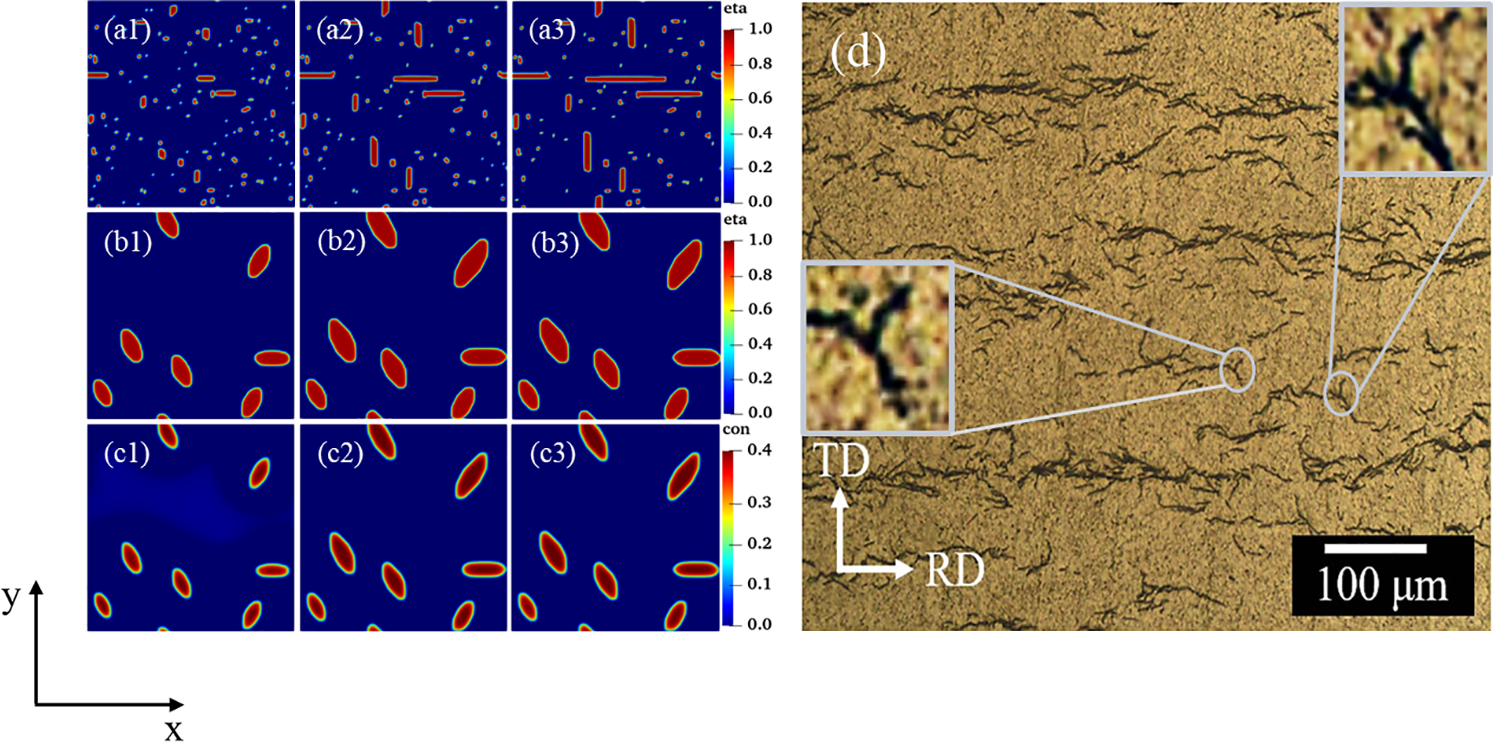
Figure 4:
To obtain accurate hydride morphology characteristics, the different variants were simulated and tested individually. Fig. 5 shows the precipitated morphology, equivalent forces diagram, and the circumferential length and radial height curves with time for different time steps of the individual
where
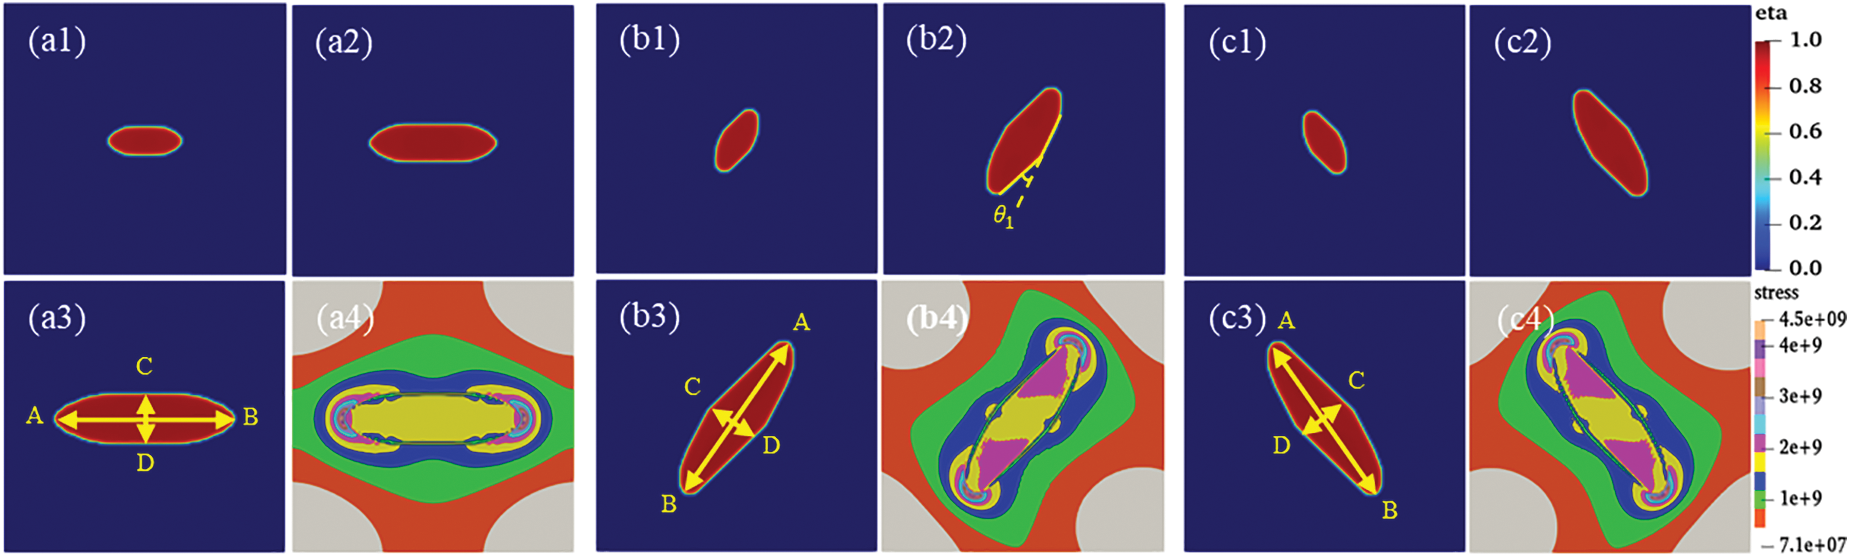
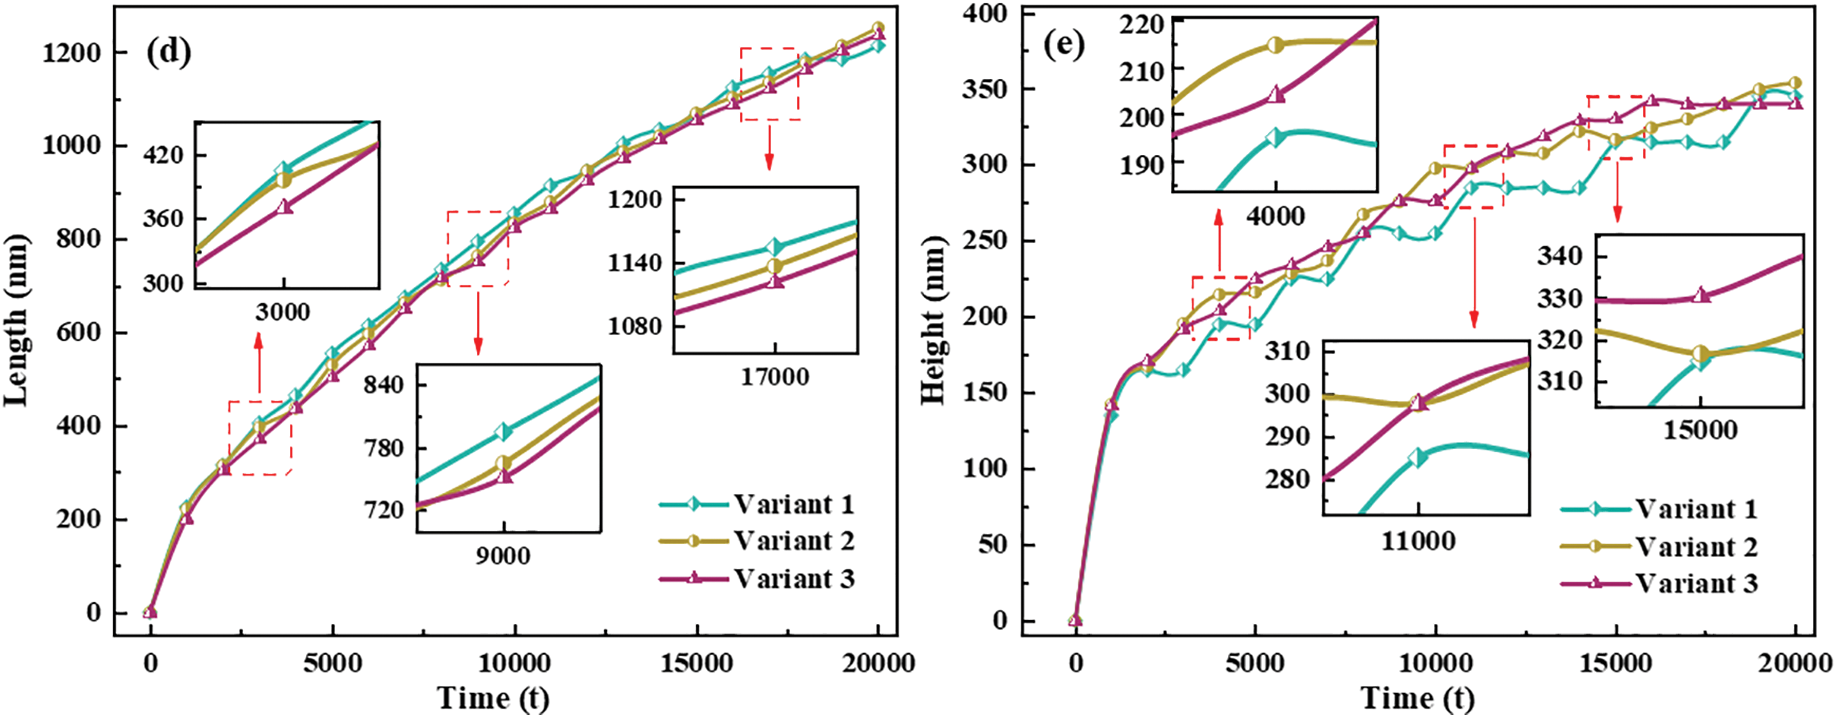
Figure 5: Individual hydride morphology, equivalent force diagram, and circumferential length and height variation curves for different time steps t. (a, b, c) Morphology of variant 1, variant 2 and variant 3, (a1, b1, c1) t = 4000, (a2, b2, c2) t = 10000, (a3, b3, c3) t = 20,000, (a4, b4, c4) Equivalent force diagram at t = 20,000. (d) Variant 1, variant 2, and variant 3 circumferential length (AB length) curve with t. (e) Variant 1, variant 2, and variant 3 radial height (CD height) curve with t
In general, the interfacial mobility coefficient is closely related to the interfacial energy. Therefore, anisotropic interfacial energy leads to the anisotropy of interfacial mobility. The change of hydride precipitated morphology is observed by changing the ratio of x and y-axis coefficients in interfacial mobility. Fig. 6 shows the hydride morphology and equivalent force diagrams for different anisotropic mobility ratios. The variation curves of circumferential length and radial height and aspect ratio of hydride with anisotropic mobility ratio are shown in Fig. 7. As the y-axis mobility ratio increases, the circumferential length peaks significantly at
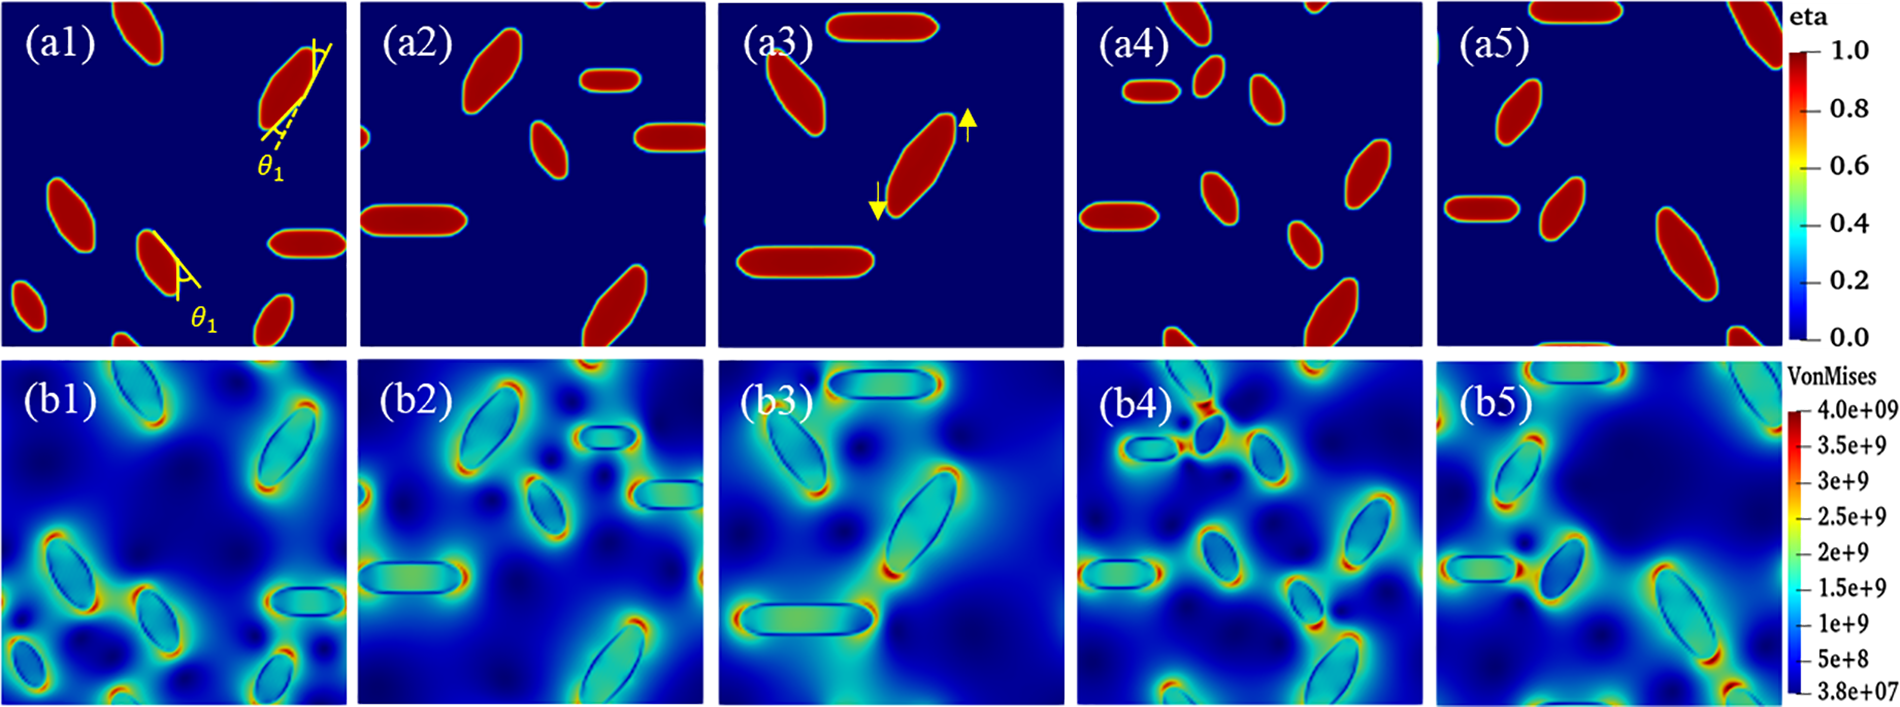
Figure 6: Hydride morphology and equivalent stress diagrams for different anisotropic interfacial mobility ratios at time step t = 20000. (a1)
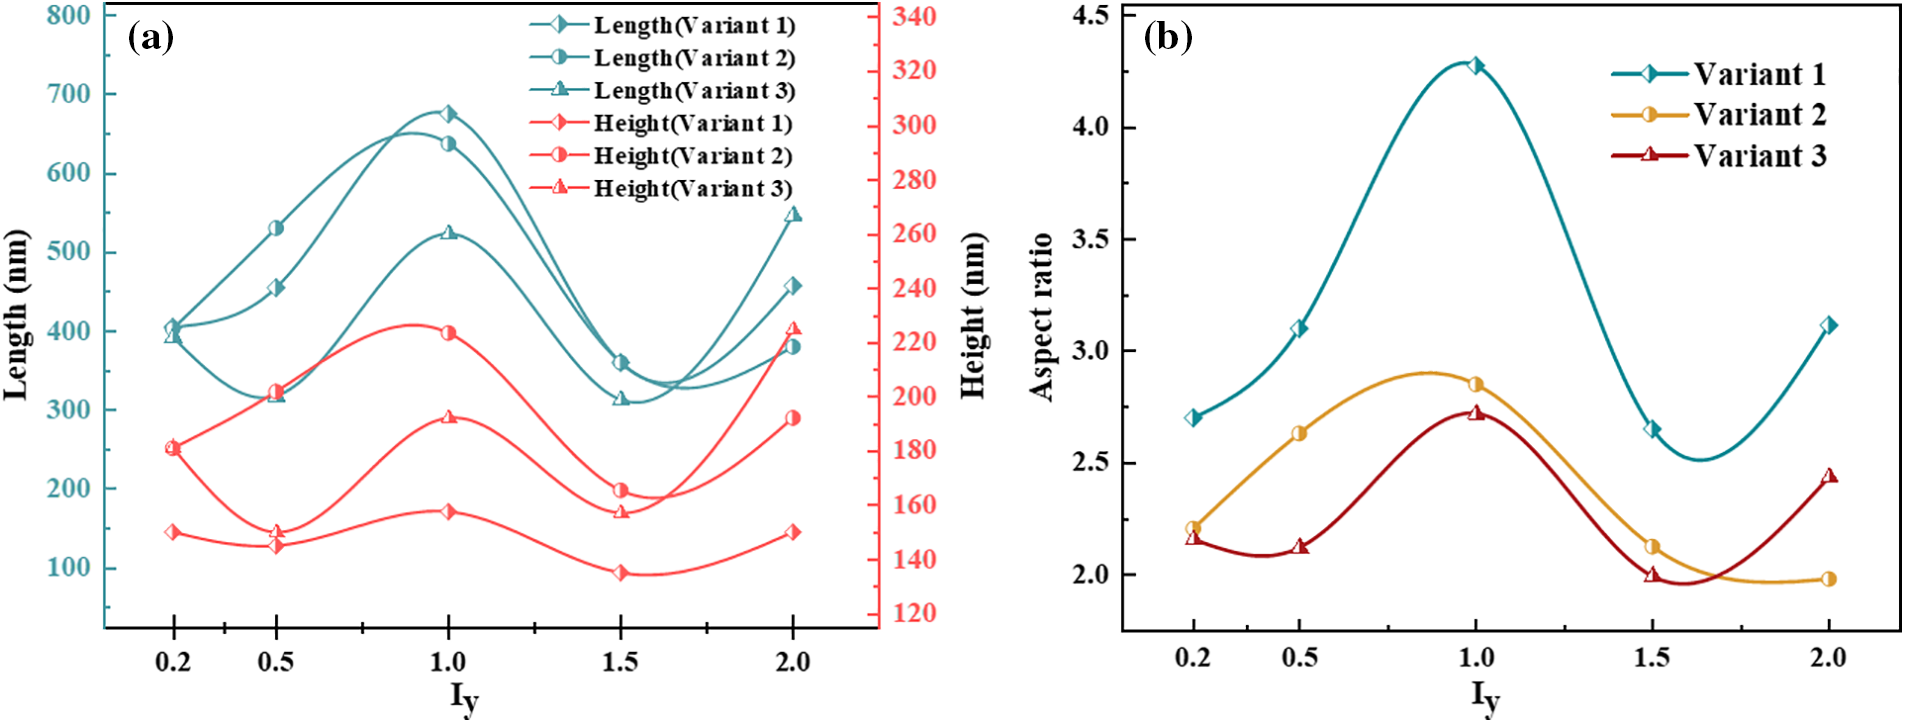
Figure 7: Variation of circumferential length and radial height and aspect ratio of hydride with anisotropic mobility ratios at time step t = 20000
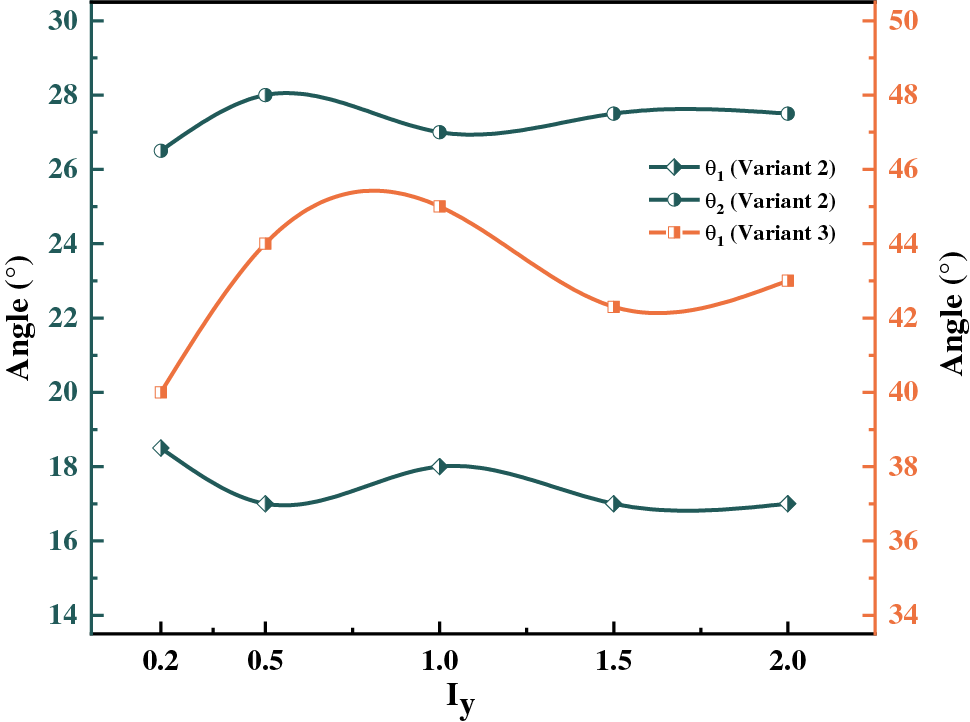
Figure 8: Variation curve of hydride precipitated deflection angle with anisotropic mobility ratios at time step t = 20000
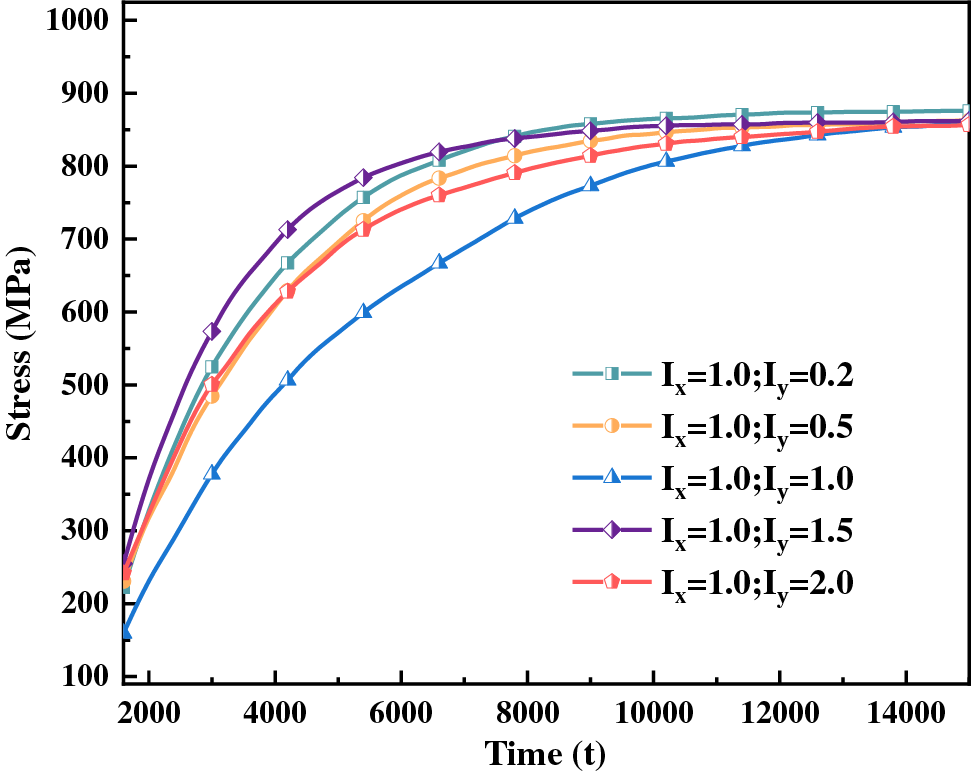
Figure 9: Hydride equivalent stress curve with time for different anisotropic interfacial mobility ratios
The magnitude of energy will affect the nucleation and growth of hydride. The gradient energy coefficient is related to interfacial energy, and the magnitude of anisotropic interfacial energy will affect the variation of gradient energy. Under the action of anisotropic interfacial energy, hydride forms parallelogram-like and needle-like morphology. Figs. 10 and 11 are isotropic and anisotropic hydride gradient energy diagrams and curves. Interfacial anisotropy results in a decrease in gradient energy. Due to the influence of interfacial anisotropy between the hydride and matrix phase, the structure change at the interface is larger than the concentration change. Therefore, the gradient energy related to the structure tends to decrease significantly compared with the gradient energy related to the concentration.
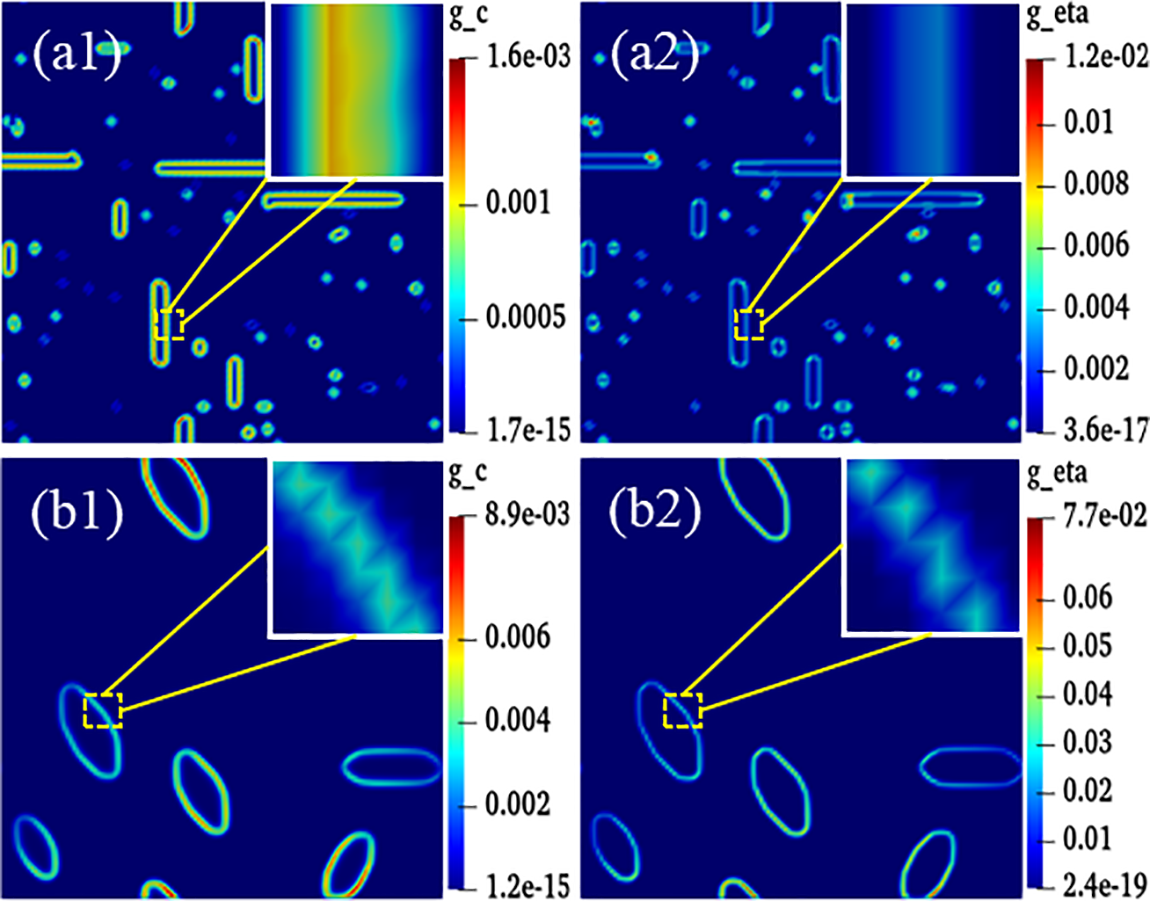
Figure 10: Gradient energy diagrams of isotropy and anisotropy hydrides at time step t = 20000. (a1–a2) Isotropy hydride, (a1) Concentration gradient energy, (a2) Structural gradient energy. (b1–b2) Anisotropy hydride, (b1) Concentration gradient energy, (b2) Structural gradient energy
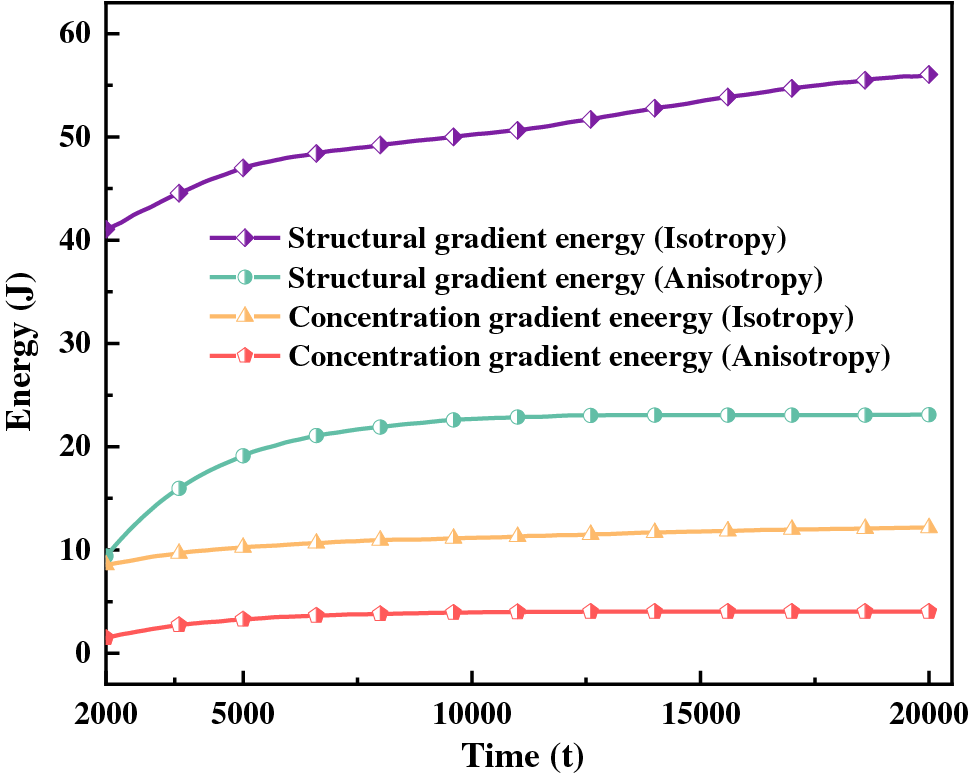
Figure 11: Gradient energy curves of isotropy and anisotropy hydrides
Interfacial anisotropy leads to different hydride morphology, and there are differences in the stress states around different hydride morphology. Fig. 12 shows the stress distribution of anisotropic hydride. The evolution of the equivalent stress with time step is shown in Fig. 12a. The stress distribution shows that the equivalent stresses are concentrated at the hydride tips, and the stresses are less at the sides and inside the hydride. Figs. 12b–12d show the positive stress in the x direction, the positive stress in the y direction, and the shear stress in the xy direction of the hydride, respectively. The stress value around the hydride is negative, which is manifested as compressive stress, and the positive stress value shows tensile stress. From Figs. 12b and 12c, it can be seen that
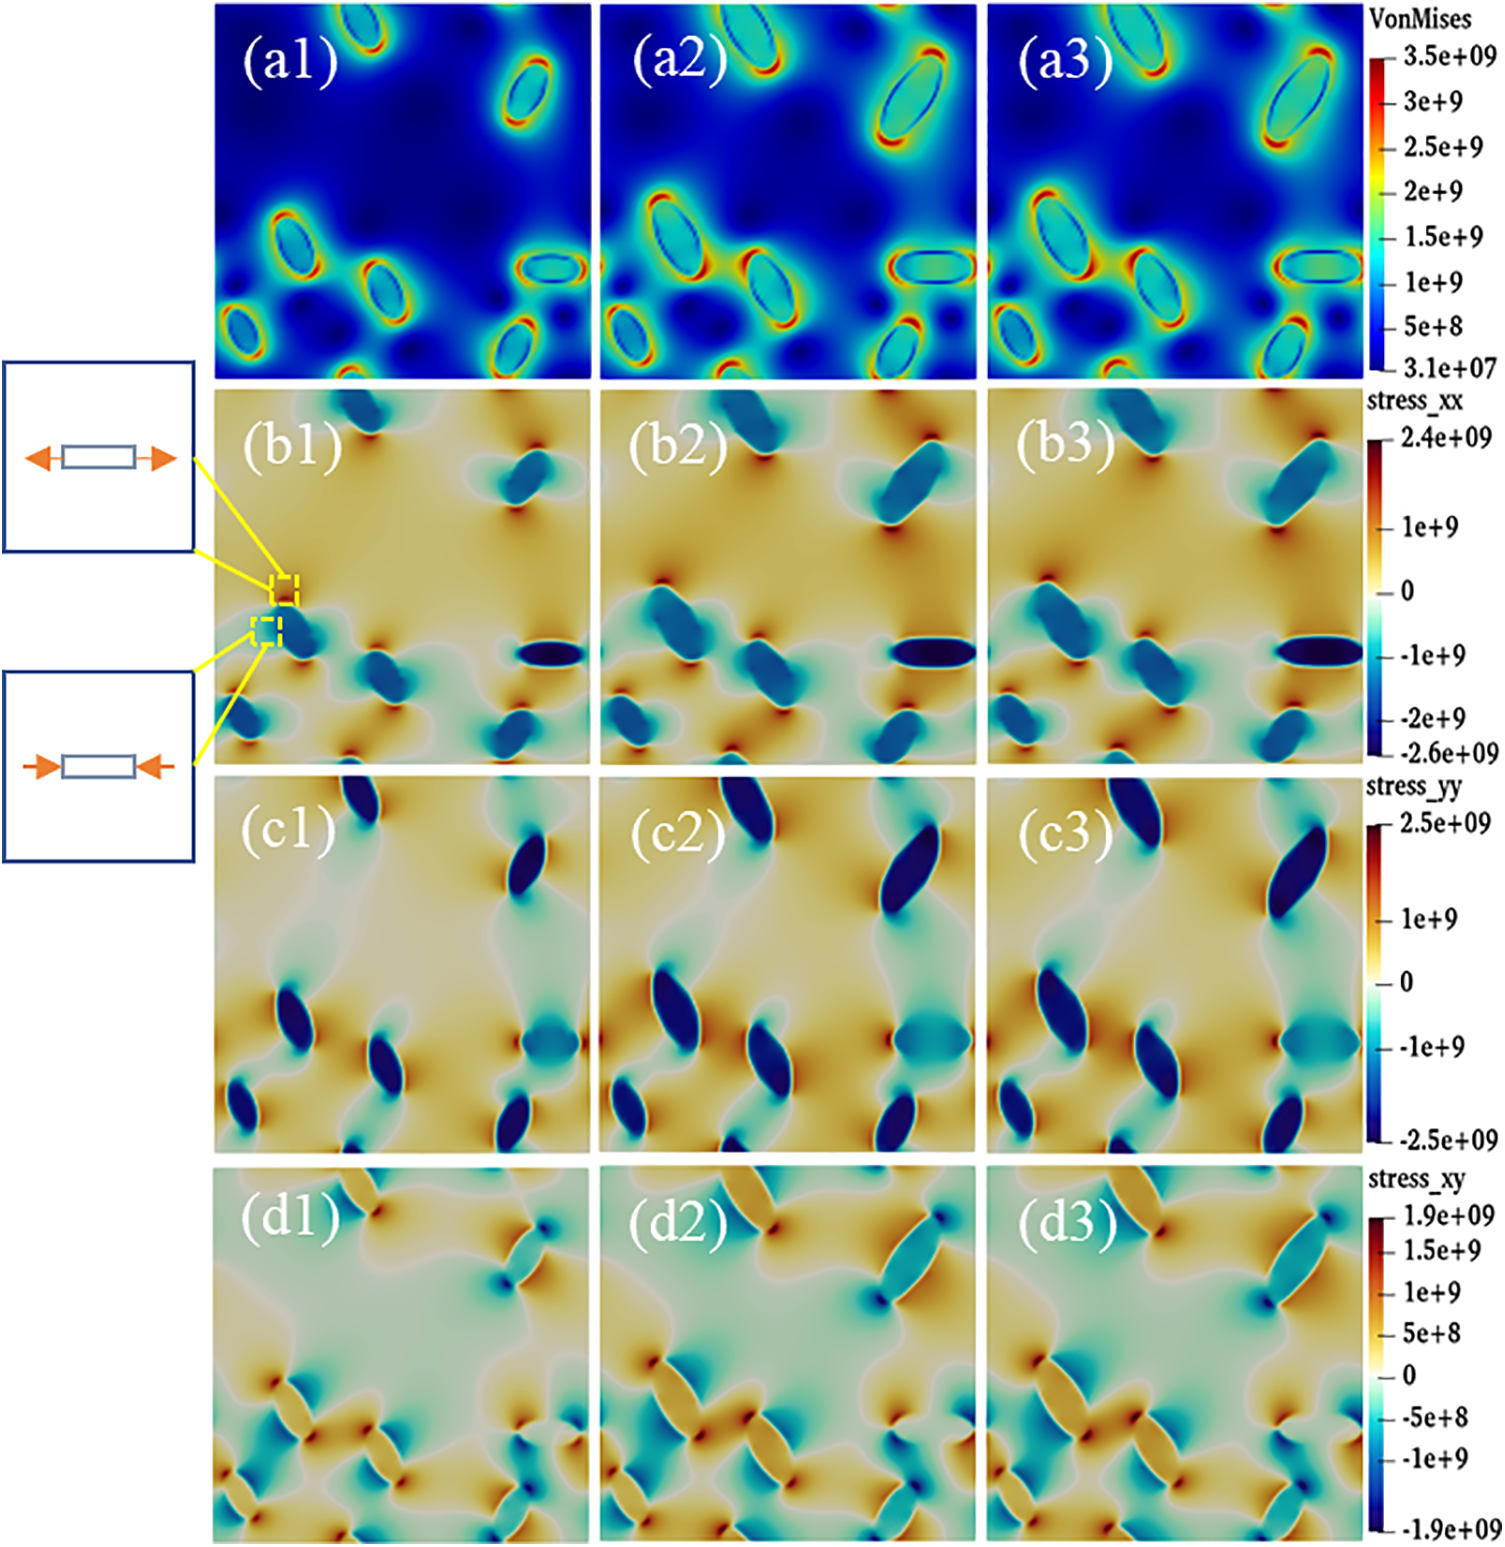
Figure 12: Anisotropic hydride stress distribution at time steps t = 4000, 10000, and 20000. (a1–a3) Equivalent stress, (b1–b3)
Under the effect of anisotropic interfacial energy and interfacial mobility, hydrides precipitate needle-like and parallelogram-like morphologies (Fig. 4b). Yuan et al. [6] obtained
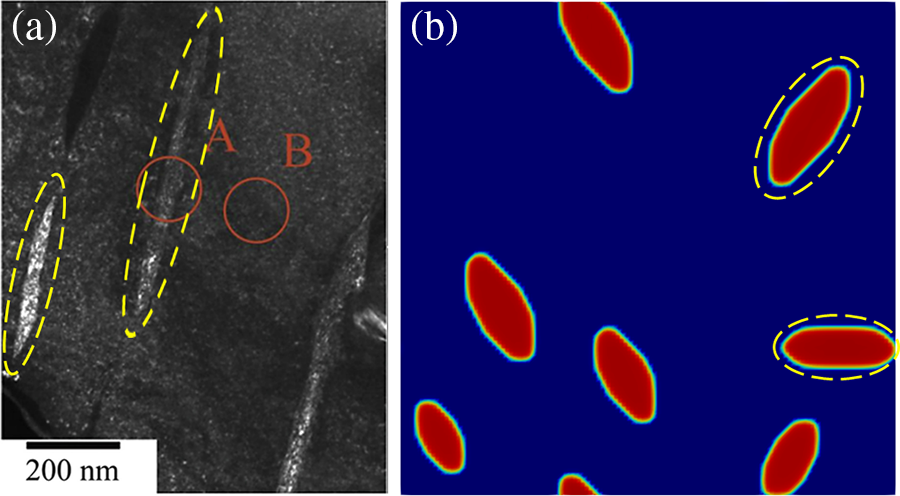
Figure 13: Experimental morphology [6] and simulated morphology of hydride at time step t = 20000. (The yellow dotted line in the figure is labeled)
Interfacial isotropy assumes that the interface is coherent. However, in practice, the semi-coherent or non-coherent interfacial state between HCP and FCC crystal structures will generate anisotropy. The effect on hydride morphology was investigated by varying the y-axis anisotropic interfacial mobility, as shown in Fig. 6. It was found that the y-axis mobility coefficient
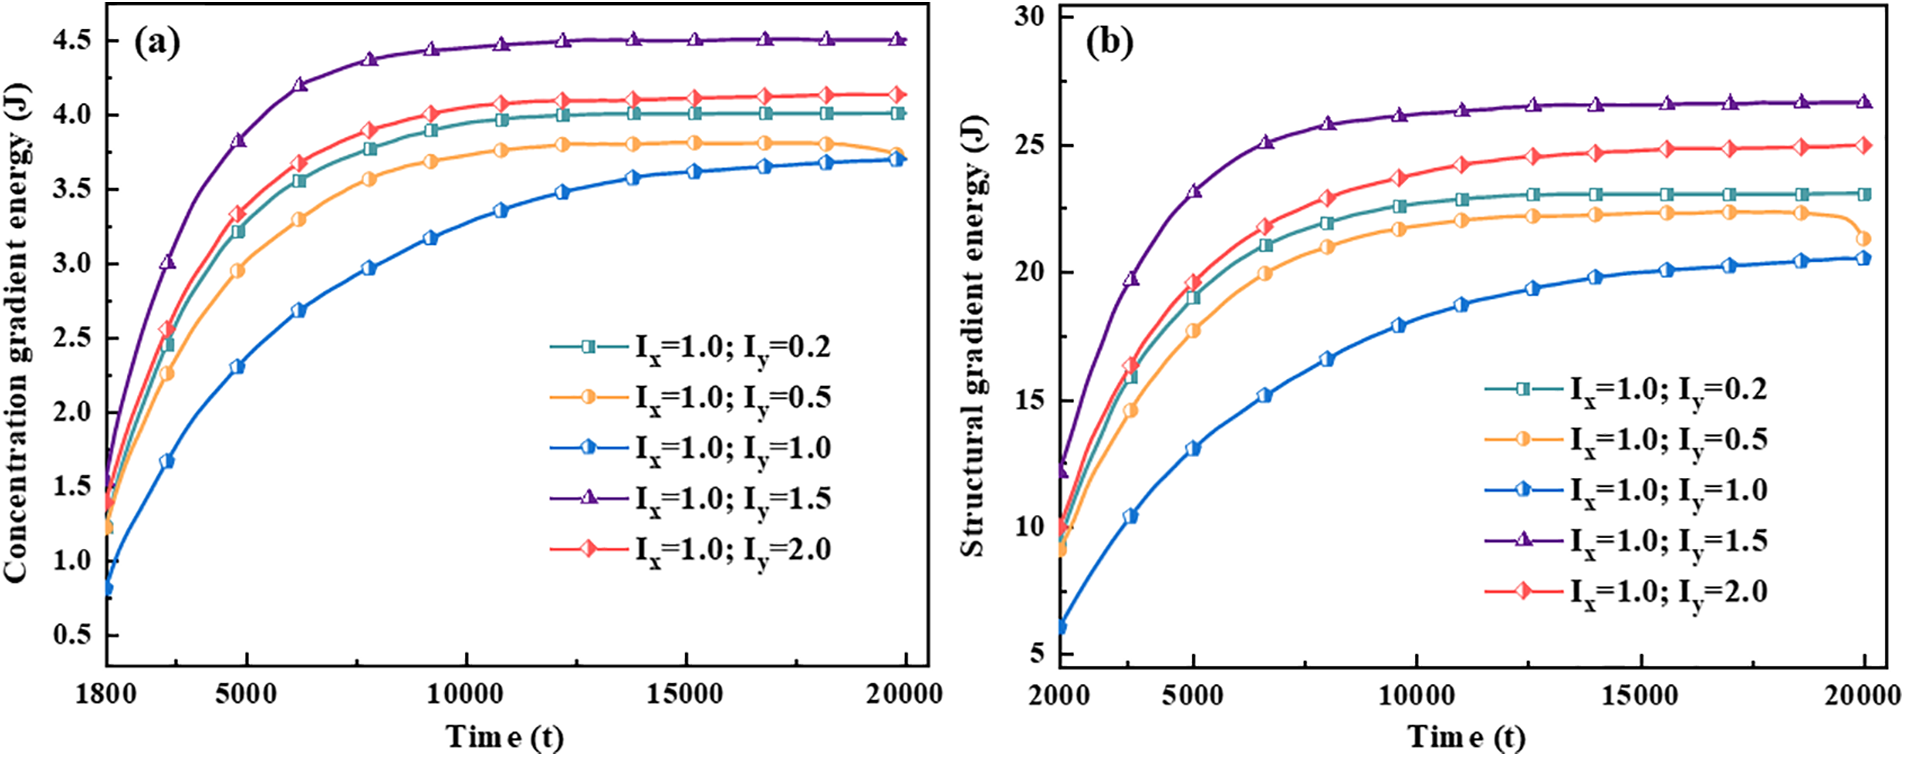
Figure 14: Gradient energy curves with time for different anisotropic mobility ratios. (a) Concentration gradient energy, (b) Structural gradient energy
Hydride precipitated morphology and orientation depend on the interfacial energy and interfacial mobility. The gradient energy coefficient is related to the interfacial energy [59,62]. Under the action of anisotropic interfacial energy and interfacial mobility, variant 1 hydride precipitates needle-like morphology, and variant 2 and variant 3 hydride precipitates parallelogram-like morphology. Figs. 10 and 11 show the gradient energy diagram and energy curve of the interfacial isotropy and anisotropy hydride in Fig. 3. The interfacial anisotropy gradient can be reduced compared to the interfacial isotropy. As the interfacial anisotropy adjusts the lattice mismatch, it reduces the energy difference due to the lattice mismatch, resulting in a lower gradient energy. The structural difference changes significantly compared to the concentration difference. Therefore, the structure gradient energy decreases significantly more than the concentration gradient energy. It shows that the non-coherent or semi-coherent interface conforms to the interfacial state between the precipitate hydride phase and the matrix phase. It is more advantageous to replace the coherent interface with a semi-coherent or non-coherent interface close to the real situation.
Differences in the precipitated morphology and growth characteristics of anisotropic hydride affect the change in the stress state around the hydride. Fig. 12 represents the stress state of the anisotropy hydride, where the equivalent force is concentrated at the tip. Due to the mismatch between the two phases lattice, the matrix is strained to accommodate the growing hydride. The matrix part around the hydride is compressed, the rest is stretched, and the hydrogen atoms tend to diffuse toward the tension zone [25]. The internal stress of the hydride precipitation in the x-axis direction is small, and the tensile stress and compressive stress at the tip are symmetrical. Since the regions above and below the hydride are in a compressed state, the hydrogen depletion region is formed, while the region near the hydride edge is in a stretched state, thus attracting hydrogen atoms. The tension region also tends to promote hydride precipitation, while compression impedes it, thus causing the hydride shape to be elongated.
In this study, phase-field simulation was performed on
1. The interfacial isotropic hydride precipitated morphology is slat-like. The addition of interfacial anisotropy, under the combined effect of interfacial energy and anisotropic interfacial mobility, transforms the hydride morphology from slat-like to parallelogram-like and needle-like morphology. This study optimizes the model to be closer to the real state, which is consistent with the experimental results.
2. As the y-axis mobility coefficient
3. The gradient energy coefficient is related to the interfacial energy. The anisotropy of the non-coherent or semi-coherent interface reduces the lattice mismatch between the precipitate phase and the matrix phase interface. Reduce the energy difference caused by lattice distortion, resulting in a decrease in gradient energy related to interfacial anisotropy. The semi-coherent or non-coherent interface instead of the coherent interface conforms to the real interfacial state between the precipitate phase and the matrix phase.
4. The hydride morphology affects the stress state around the hydride. Due to the lattice mismatch between the two phases, the hydride in the matrix is under compression on both sides, hindering the absorption of hydrogen atoms. The tip and inside are stretched, promoting the absorption of hydrogen atoms, resulting in stress concentration at the tip and elongation of the hydride. At the same time, the uneven stress distribution around the hydride causes local enrichment of hydrogen concentration and produces tip morphology.
Acknowledgement: The authors especially acknowledge Prof. Sanqiang Shi of Hong Kong Polytechnic University and Dr. Zhihua Xiao of Peking University.
Funding Statement: The authors gratefully acknowledge financial support from the National Natural Science Foundation of China (Nos. 52375394, 52074246, 52275390, 52205429, 52201146), National Defense Basic Scientific Research Program of China (JCKY2020408B002, WDZC2022-12), Key Research and Development Program of Shanxi Province (202102050201011, 202202050201014), Science and Technology Major Project of Shanxi Province (20191102008, 20191102007) and Guiding Local Science and Technology Development Projects by the Central Government (YDZJSX2022A025, YDZJSX2021A027).
Author Contributions: Investigation: H.L. Nie, X.C. Shi, W.K. Yang, K.L. Wang, Y.H. Zhao; data collection: H.L. Nie, X.C. Shi, W.K. Yang; analysis and interpretation of results: H.L. Nie, X.C. Shi, W.K. Yang, K.L. Wang, Y.H. Zhao; draft manuscript preparation: H.L. Nie, X.C. Shi, W.K. Yang, K.L. Wang, Y.H. Zhao; software and funding: Y.H. Zhao. All authors reviewed the results and approved the final version of the manuscript.
Availability of Data and Materials: All data generated or analysed during this study are included in this article and are available from the corresponding author upon reasonable request.
Conflicts of Interest: The authors declare that they have no conflicts of interest to report regarding the present study.
References
1. R. A. Holt, “In-reactor deformation of cold-worked Zr–2.5Nb pressure tubes,” Journal of Nuclear Materials, vol. 372, no. 2–3, pp. 182–214, 2008. [Google Scholar]
2. E. Lacroix, A. T. Motta and J. D. Almer, “Experimental determination of zirconium hydride precipitation and dissolution in zirconium alloy,” Journal of Nuclear Materials, vol. 509, pp. 162–167, 2018. [Google Scholar]
3. E. Zuzek, J. P. Abriata, A. San-Martin and F. D. Manchester, “The H-Zr (Hydrogen-Zirconium) system,” Bulletin of Alloy Phase Diagrams, vol. 11, no. 4, pp. 385–395, 1990. [Google Scholar]
4. A. Ishii, “Activation energy of homogeneous nucleation of Zr hydride: Density functional theory calculation,” Computational Materials Science, vol. 215, pp. 111769, 2022. [Google Scholar]
5. J. Bair, M. A. Zaeem and M. Tonks, “A review on hydride precipitation in zirconium alloys,” Journal of Nuclear Materials, vol. 466, pp. 12–20, 2015. [Google Scholar]
6. G. H. Yuan, G. Q. Cao, Q. Yue, L. Yang, J. H. Hu et al., “Formation of nanocrystalline δ-ZrHx in Zircoloy-4: Orientation relationship and twinning,” Journal of Alloys and Compounds, vol. 658, pp. 494–499, 2016. [Google Scholar]
7. M. A. Tunes, C. M. Silva and P. D. Edmondson, “Site specific dependencies of hydrogen concentrations in zirconium hydrides,” Scripta Materialia, vol. 158, pp. 136–140, 2019. [Google Scholar]
8. K. Une, K. Nogita, S. Ishimoto and K. Ogata, “Crystallography of zirconium hydrides in recrystallized zircaloy-2 fuel cladding by electron backscatter diffraction,” Journal of Nuclear Science and Technology, vol. 41, no. 7, pp. 731–740, 2004. [Google Scholar]
9. S. J. Wang, S. L. Li, R. G. Li, X. X. Zhang, Y. K. Wang et al., “Stress-induced reorientation of hydrides in Zr-1Nb-0.01Cu cladding tube studied by synchrotron X-ray diffraction and EBSD,” Journal of Nuclear Materials, vol. 558, pp. 153374, 2022. [Google Scholar]
10. Y. J. Jia and W. Z. Han, “Effect of external stress on hydride reorientation in zirconium,” Acta Materialia, vol. 235, pp. 118100, 2022. [Google Scholar]
11. W. Qin, J. L. Liang, Z. Q. Cheng, M. H. Shi, D. Gu et al., “Threshold stress of hydride reorientation in zirconium alloy nuclear fuel cladding tubes: A theoretical determination,” Journal of Nuclear Materials, vol. 563, pp. 153659, 2022. [Google Scholar]
12. X. L. Tian, Y. H. Zhao, T. Gu, Y. L. Guo, F. Q. Xu et al., “Cooperative effect of strength and ductility processed by thermomechanical treatment for Cu-Al-Ni alloy,” Materials Science and Engineering: A, vol. 849, pp. 143485, 2022. [Google Scholar]
13. Y. H. Zhao, B. Zhang, H. Hou, W. P. Chen and M. Wang, “Phase-field simulation for the evolution of solid/liquid interface front in directional solidification process,” Journal of Materials Science & Technology, vol. 35, no. 6, pp. 1044–1052, 2019. [Google Scholar]
14. Y. H. Zhao, “Editorial: Phase field method and integrated computing materials engineering,” Frontiers in Materials, vol. 10, pp. 1145833, 2023. [Google Scholar]
15. Y. H. Zhao, K. X. Liu, H. B. Zhang, X. L. Tian, Q. L. Jiang et al., “Dislocation motion in plastic deformation of nano polycrystalline metal materials: A phase field crystal method study,” Advanced Composites and Hybrid Materials, vol. 5, no. 3, pp. 2546–2556, 2022. [Google Scholar]
16. W. P. Chen, H. Hou, Y. Zhang, Y. T. Zhao, W. Liu et al., “Thermal and solute diffusion in α-Mg dendrite growth of Mg-5wt.%Zn alloy: A phase-field study,” Journal of Materials Research and Technology, vol. 24, pp. 8401–8413, 2023. [Google Scholar]
17. X. L. Tian, Y. H. Zhao, D. W. Peng, Q. W. Guo, Z. Guo et al., “Phase-field crystal simulation of evolution of liquid pools in grain boundary pre-melting regions,” Transactions of Nonferrous Metals Society of China, vol. 31, no. 4, pp. 1175–1188, 2021. [Google Scholar]
18. X. Q. Ma, S. Q. Shi, C. H. Woo and L. Q. Chen, “Simulation of γ-hydride precipitation in bi-crystalline zirconium under uniformly applied load,” Materials Science and Engineering: A, vol. 334, no. 1, pp. 6–10, 2002. [Google Scholar]
19. X. Q. Ma, S. Q. Shi, C. H. Woo and L. Q. Chen, “Phase-field simulation of hydride precipitation in bi-crystalline zirconium,” Scripta Materialia, vol. 47, no. 4, pp. 237–241, 2002. [Google Scholar]
20. X. Q. Ma, S. Q. Shi, C. H. Woo and L. Q. Chen, “Effect of applied load on nucleation and growth of γ-hydrides in zirconium,” Computational Materials Science, vol. 23, no. 1–4, pp. 283–290, 2002. [Google Scholar]
21. X. H. Guo, S. Q. Shi and X. Q. Ma, “Elastoplastic phase field model for microstructure evolution,” Applied Physics Letters, vol. 87, pp. 221910, 2005. [Google Scholar]
22. L. Thuinet, A. Legris, L. Zhang and A. Ambard, “Mesoscale modeling of coherent zirconium hydride, precipitation under an applied stress,” Journal of Nuclear Materials, vol. 438, no. 1–3, pp. 32–40, 2013. [Google Scholar]
23. J. Bair and M. A. Zaeem, “Effects of applied strain on formation, shape evolution, and reorientation of multiphase zirconium hydrides: A multiphase field modeling study,” arXiv:1706.01097v1, 2017. [Google Scholar]
24. M. J. Welland and S. M. Hanlon, “Prediction of the zirconium hydride precipitation barrier with an anisotropic 3D phase-field model incorporating bulk thermodynamics and elasticity,” Computational Materials Science, vol. 171, pp. 109266, 2020. [Google Scholar]
25. S. Wu, J. Sheng, C. Yang, X. M. Shi, H. B. Huang et al., “Phase-field model of hydride blister growth kinetics on zirconium surface,” Frontiers in Materials, vol. 9, pp. 916593, 2022. [Google Scholar]
26. B. Yoon and K. Chang, “Effect of number of variants of zirconium hydride on grain growth of zirconium,” Metals, vol. 10, no. 9, pp. 1155, 2020. [Google Scholar]
27. X. H. Guo, S. Q. Shi, Q. M. Zhang and X. Q. Ma, “An elastoplastic phase-field model for the evolution of hydride precipitation in zirconium. Part II: Specimen with flaws,” Journal of Nuclear Materials, vol. 378, no. 1, pp. 120–125, 2008. [Google Scholar]
28. T. W. Heo, K. B. Colas, A. T. Motta and L. Q. Chen, “A phase-field model for hydride formation in polycrystalline metals: Application to δ-hydride in zirconium alloys,” Acta Materialia, vol. 181, pp. 262–277, 2019. [Google Scholar]
29. X. H. Guo, S. Q. Shi, Q. M. Zhang and X. Q. Ma, “An elastoplastic phase-field model for the evolution of hydride precipitation in zirconium. Part I: Smooth specimen,” Journal of Nuclear Materialia, vol. 378, no. 1, pp. 110–119, 2008. [Google Scholar]
30. G. M. Han, Y. F. Zhao, C. B. Zhou, D. Y. Lin, X. Y. Zhu et al., “Phase-field modeling of stacking structure formation and transition of δ-hydride precipitates in zirconium,” Acta Materials, vol. 165, pp. 528–546, 2019. [Google Scholar]
31. W. Shin and K. Chang, “Phase-field modeling of hydride reorientation in zirconium cladding materials under applied stress,” Computational Materials Science, vol. 182, pp. 109775, 2020. [Google Scholar]
32. P. C. A. Simon, L. K. Aagesen, A. M. Jokisaari, L. Q. Chen, M. R. Daymond et al., “Investigation of δ zirconium hydride morphology in a single crystal using quantitative phase field simulations supported by experiments,” Journal of Nuclear Materials, vol. 557, pp. 153303, 2021. [Google Scholar]
33. A. Toghraee, J. Bair and M. A. Zaeem, “Effects of applied load on formation and reorientation of zirconium hydrides: A multiphase field modeling study,” Computational Materials Science, vol. 192, pp. 110367, 2021. [Google Scholar]
34. S. Ghosh and M. Plapp, “Influence of interphase boundary anisotropy on bulk eutectic solidification microstructures,” Acta Materialia, vol. 140, pp. 140–148, 2017. [Google Scholar]
35. Y. H. Cai, F. Wang, M. Selzer and B. Nestler, “Phase-field investigation on the growth orientation angle of aluminum carbide with a needle-like structure at the surface of graphite particles,” Modelling and Simulation in Materials Science and Engineering, vol. 27, no. 6, pp. 065010, 2019. [Google Scholar]
36. H. Mao, Y. Kong, D. Cai, M. J. Yang, Y. B. Peng et al., “β″ needle-shape precipitate formation in Al-Mg-Si alloy: Phase field simulation and experimental verification,” Computational Materials Science, vol. 184, pp. 109878, 2020. [Google Scholar]
37. Y. H. Zhao, H. Xing, L. J. Zhang, H. B. Huang, D. K. Sun et al., “Development of phase‐field modeling in materials science in China: A review,” Acta Metallurgica Sinica (English Letters), vol. 36, pp. 1749–1775, 2023. [Google Scholar]
38. Y. H. Zhao, “Understanding and design of metallic alloys guided by phase-field simulations,” npj Computational Materials, vol. 9, no. 1, pp. 94, 2023. [Google Scholar]
39. T. Xin, S. Tang, F. Ji, L. Q. Cui, B. B. He et al., “Phase transformations in an ultralight BCC Mg alloy during anisothermal ageing,” Acta Materialia, vol. 239, pp. 118248, 2022. [Google Scholar]
40. J. W. Cahn and J. E. Hilliard, “Free energy of a nonuniform system. I. Interfacial free energy,” The Journal of Chemical Physics, vol. 28, no. 2, pp. 258–267, 1958. [Google Scholar]
41. J. W. Cahn and S. M. Allen, “A microscopic theory for domain wall motion and its experimental verification in Fe-Al alloy domain growth kinetics,” Le Journal de Physique Colloques, vol. 38, no. C7, pp. C7-51–C7-54, 1977. [Google Scholar]
42. K. L. Wang, W. K. Yang, X. C. Shi, H. Hou and Y. H. Zhao, “Phase-field-method-studied mechanism of Cu-rich phase precipitation in AlxCuMnNiFe high-entropy alloy,” Acta Physica Sinica, vol. 72, no. 7, pp. 076102, 2023. [Google Scholar]
43. W. K. Yang, K. L. Wang, J. Q. Pei, X. C. Shi, H. Hou et al., “Dislocation loop assisted precipitation of Cu-rich particles: A phase-field study,” Computational Materials Science, vol. 228, pp. 112338, 2023. [Google Scholar]
44. L. Q. Chen and Y. H. Zhao, “From classical thermodynamics to phase-field method,” Progress in Materials Science, vol. 124, pp. 100868, 2022. [Google Scholar]
45. S. Q. Shi and Z. H. Xiao, “A quantitative phase field model for hydride precipitation in zirconium alloys: Part I. Development of quantitative free energy functional,” Journal of Nuclear Materials, vol. 459, pp. 323–329, 2015. [Google Scholar]
46. T. Z. Xin, Y. H. Zhao, R. Mahjoub, J. X. Jiang, A. Yadav et al., “Ultrahigh specific strength in a magnesium alloy strengthened by spinodal decomposition,” Science Advances, vol. 7, no. 23, pp. eabf3039, 2021. [Google Scholar] [PubMed]
47. W. K. Yang, X. A. Jiang, X. L. Tian, H. Hou and Y. H. Zhao, “Phase-field simulation of nano-α′ precipitates under irradiation and dislocations,” Journal of Materials Research and Technology, vol. 22, pp. 1307–1321, 2023. [Google Scholar]
48. A. G. Khachaturian, “Elastic strain caused by crystal lattice rearrangement,” in Theory of Structural Transformations in Solids, pp. 5821133, New York, USA: Wiley, 1983. [Google Scholar]
49. G. M. Han, Z. Q. Han, A. A. Luo and B. C. Liu, “Three-dimensional phase-field simulation and experimental validation of β-Mg17Al12 phase precipitation in Mg-Al-based alloys,” Metallurgical and Materials Transactions A, vol. 46, no. 2, pp. 948–962, 2014. [Google Scholar]
50. G. M. Han, Z. Q. Han, A. A. Luo, A. Sachdev and B. C. Liu, “Phase field simulation on morphology of continuous precipitate Mg17Al12 in Mg-Al alloy,” Acta Metallurgica Sinica, vol. 49, no. 3, pp. 277–283, 2013. [Google Scholar]
51. Y. H. Zhao, K. X. Liu, H. Hou and L. Q. Chen, “Role of interfacial energy anisotropy in dendrite orientation in Al-Zn alloys: A phase field study,” Materials & Design, vol. 216, pp. 110555, 2022. [Google Scholar]
52. S. G. Kim, W. T. Kim and T. Suzuki, “Phase-field model for binary alloys,” Physical Review E, vol. 60, no. 6, pp. 7186–7197, 1999. [Google Scholar]
53. J. B. Zhang, H. F. Wang, W. W. Kuang, Y. C. Zhang, S. Li et al., “Rapid solidification of non-stoichiometric intermetallic compounds: Modeling and experimental verification,” Acta Materialia, vol. 148, pp. 86–99, 2018. [Google Scholar]
54. W. W. Kuang, H. F. Wang, X. Li, J. B. Zhang, Q. Zhou et al., “Application of the thermodynamic extremal principle to diffusion-controlled phase transformations in Fe-C-X alloys: Modeling and applications,” Acta Materialia, vol. 159, pp. 16–30, 2018. [Google Scholar]
55. S. Y. Hu, J. Murray, H. Weiland, Z. K. Liu and L. Q. Chen, “Thermodynamic description and growth kinetics of stoichiometric precipitates in the phase-field approach,” Calphad, vol. 31, no. 2, pp. 303–312, 2007. [Google Scholar]
56. Z. H. Xiao, X. H. Guo, G. Y. Tang, S. Q. Shi and M. J. Hao, “A quantitative phase field model for hydride precipitation in zirconium alloys: Part II. Modeling of temperature dependent hydride precipitation,” Journal of Nuclear Materials, vol. 459, pp. 330–338, 2015. [Google Scholar]
57. W. H. Zhu, R. S. Wang, G. G. Shu, P. Wu and H. M. Xiao, “First-principles study of different polymorphs of crystalline zirconium hydride,” Journal of Physical Chemistry C, vol. 114, no. 50, pp. 22361–22368, 2010. [Google Scholar]
58. Y. F. Zhang, X. M. Bai, J. G. Yu, M. R. Tonks, M. J. Noordhoek et al., “Homogeneous hydride formation path in α-Zr: Molecular dynamics simulations with the charge-optimized many-body potential,” Acta Materialia, vol. 111, pp. 357–365, 2016. [Google Scholar]
59. Q. Yu, M. Reyes, N. Shah and J. Marian, “Kinetic model of incipient hydride formation in Zr clad under dynamic oxide growth conditions,” Material, vol. 13, no. 5, pp. 1088, 2020. [Google Scholar]
60. V. Perovic, G. C. Weatherly and C. J. Simpson, “Hydride precipitation in α/β zirconium alloys,” Acta Metallurgica, vol. 31, no. 9, pp. 1381–1391, 1983. [Google Scholar]
61. S. Q. Shi, X. N. Jing, X. H. Guo, X. Q. Ma and L. Q. Chen, Phase Field Simulation of Hydrogen Diffusion and Hydride Formation Pattern in Zirconium, Beijing, China: Atomic Energy Press, pp. 186–197, 2005. [Google Scholar]
62. B. Li, J. Lowengngrub, A. Ratz and A. Voigt, “Geometric evolution laws for thin crystalline films: Modeling and numerics,” Communications in Computational Physics, vol. 6, no. 3, pp. 433–482, 2009. [Google Scholar]
Cite This Article
 Copyright © 2023 The Author(s). Published by Tech Science Press.
This work is licensed under a Creative Commons Attribution 4.0 International License , which permits unrestricted use, distribution, and reproduction in any medium, provided the original work is properly cited.
 Downloads
 Citation Tools