
 Submit a Paper
 Propose a Special lssue
 Open Access
ARTICLE

C2Net-YOLOv5: A Bidirectional Res2Net-Based Traffic Sign Detection Algorithm
1 Faculty of Information Technology, Beijing University of Technology, Beijing, 100124, China
2 School of Cyberspace Security, Beijing University of Posts and Telecommunications, Beijing, 100048, China
3 Fan Gongxiu Honors College, Beijing University of Technology, Beijing, 100124, China
* Corresponding Author: Yiqi Tian. Email:
(This article belongs to the Special Issue: Machine Vision Detection and Intelligent Recognition)
Computers, Materials & Continua 2023, 77(2), 1949-1965. https://doi.org/10.32604/cmc.2023.042224
Received 23 May 2023; Accepted 28 September 2023; Issue published 29 November 2023
 View Full Text
 Download PDF
Abstract
Rapid advancement of intelligent transportation systems (ITS) and autonomous driving (AD) have shown the importance of accurate and efficient detection of traffic signs. However, certain drawbacks, such as balancing accuracy and real-time performance, hinder the deployment of traffic sign detection algorithms in ITS and AD domains. In this study, a novel traffic sign detection algorithm was proposed based on the bidirectional Res2Net architecture to achieve an improved balance between accuracy and speed. An enhanced backbone network module, called C2Net, which uses an upgraded bidirectional Res2Net, was introduced to mitigate information loss in the feature extraction process and to achieve information complementarity. Furthermore, a squeeze-and-excitation attention mechanism was incorporated within the channel attention of the architecture to perform channel-level feature correction on the input feature map, which effectively retains valuable features while removing non-essential features. A series of ablation experiments were conducted to validate the efficacy of the proposed methodology. The performance was evaluated using two distinct datasets: the Tsinghua-Tencent 100K and the CSUST Chinese traffic sign detection benchmark 2021. On the TT100K dataset, the method achieves precision, recall, and Map0.5 scores of 83.3%, 79.3%, and 84.2%, respectively. Similarly, on the CCTSDB 2021 dataset, the method achieves precision, recall, and Map0.5 scores of 91.49%, 73.79%, and 81.03%, respectively. Experimental results revealed that the proposed method had superior performance compared to conventional models, which includes the faster region-based convolutional neural network, single shot multibox detector, and you only look once version 5.Keywords
Traffic signs serve as important instructions and warnings on roads, guiding drivers to adhere to traffic rules and prevent accidents. The precise detection and identification of these signs are essential in assisted and autonomous driving systems. However, traffic sign detection faces two main challenges: first, the existing traffic sign detection algorithms usually require a substantial number of parameters and operations to achieve satisfactory results, making real-time performance unattainable; second, traffic sign detection algorithms encounter difficulties extracting sufficient features from the model. To address these challenges, this study proposes the C2Net-YOLOv5 model.
The you only look once version 5 (YOLOv5) model stands out as a lightweight, high-performance object detection framework. It combines the advantages of single-stage detection with improved network architecture and can detect objects in images in real-time scenes quickly and accurately. To maintain a comparable detection speed as the one-stage detector, the model uses the one-stage detector YOLOv5 as the basic model architecture. Furthermore, a bidirectional Res2Net [1] module is incorporated into the model’s backbone for feature extraction, intended to solve the problem of inadequate extraction of features.
In this study, the designs are inspired by the human brain. While the convolutional neural networks (CNNs) are inspired by the human brain vision system, they do not precisely simulate the operational mode of the human brain. The human visual system entails complex multi-level processing within the cerebral cortex, hierarchical extraction of different features, and fine-grained information processing. Although CNNs draw on some characteristics of the human visual system, it is still a highly simplified and abstract model.
Similarly, the designs draw insights from features of the human brain system. The human brain exhibits a degree of symmetry, with two cerebral hemispheres on the left and right sides. These hemispheres serve different roles in processing visual information: the left brain is more inclined towards logical, analytical, and sequential processing, while the right brain specializes in spatial perception and positioning. Although the brain’s hemispheres are functionally interconnected, they communicate and integrate information through the corpus callosum to ensure the implementation of comprehensive cognition and behavior. Therefore, the design adopts a symmetrical Res2Net structure to jointly integrate different information from both sides, complemented by attention mechanisms to filter features.
Unlike the existing YOLOv5 model, this model has been improved on the current version to mitigate the impact of scale invariance. Features of traffic signs within images are enhanced and extraneous background information is suppressed, rendering the model more resilient to the environment.
The method is tested using the Tsinghua-Tencent 100K (TT100K) and the CSUST Chinese traffic sign detection benchmark (CCTSDB) 2021 datasets, and the results demonstrated the method’s validity. On the TT100K dataset, the method achieves precision, recall, and Map0.5 scores of 83.3%, 79.3%, and 84.2%, respectively. Similarly, on the CCTSDB 2021 dataset, the method achieves precision, recall, and Map0.5 scores of 91.49%, 73.79%, and 81.03%, respectively.
This section presents a summary of existing research on traffic sign detection.
2.1 Traditional Traffic Sign Detection
Traditional traffic sign detection involves three key steps: region selection, feature extraction, and classification regression [2]. Li et al. [3] introduced a method for road recognition by combining color-invariant-based image segmentation. Maldonado-Bascón et al. [4] presented an automatic road-sign detection and recognition system based on support vector machines (SVMs) which is able to detect and recognize circular, rectangular, triangular, and octagonal signs and, hence, covers all existing Spanish traffic-sign shapes. However, traditional target detection algorithms face two main challenges. First, the sliding window-based region selection method lacks precision, consumes excessive time, and the window is redundant. Second, manually extracted features are unstable in a dynamically changing environment.
2.2 Traffic Sign Detection Based on Deep Learning
Recently, the application of deep learning in traffic sign detection has gained significant traction. Notably, there are two distinctive methods: the two-stage and one-level traffic sign detection methods.
The two-stage traffic sign detection method is recognized for its high accuracy but relatively slower processing speed. In 2014, Girshick et al. introduced the region-based CNN (R-CNN) [5], a pioneering success in applying the deep learning method to object recognition. Building on this foundation, Fast R-CNN [6] was proposed in the subsequent year, aimed at enhancing the speed of R-CNN by unifying category judgment and frame regression through CNN implementation without requiring additional storage features. In 2017, Ren et al. proposed the Faster R-CNN [7], greatly improving the comprehensive performance. Additionally, Lin et al. proposed the feature pyramid network (FPN) [8], which uses feature maps of different resolutions to comprehend targets of different sizes. This method combined output features with shallow visual and deep-level semantic features through continuous upsampling and cross-layer fusion information. In 2018, Liu et al. proposed the path aggregation network (PAN) [9]; the original FPN is a one-way fusion from deep to shallow, but PAN is a bidirectional fusion from deep to shallow and vice versa. Additionally, Cai et al. introduced the cascade R-CNN method [10]. In 2019, Han et al. [11] proposed a real-time small traffic sign detection approach based on a revised Faster R-CNN, which uses a small region proposal generator to extract the characteristics of small traffic signs and combine the revised architecture of Faster R-CNN with online hard examples mining (OHEM) to make the system more robust to locate the region of small traffic signs.
However, the one-level traffic sign detection method is faster and can achieve satisfactory accuracy. Notable algorithms in this category include the YOLO series proposed by Redmon et al. [12] and the single shot multiBox detector (SSD) proposed by Liu et al. [13]. In 2018, Redmon et al. [14] proposed the YOLOv3, which integrates the ideas of current excellent detection frameworks, such as residual networks and feature fusion. You et al. [15] proposed an end-to-end deep learning model for identifying traffic signs in high-definition pictures, which contains fundamental feature extraction and multitask learning. Kong et al. [16] collected traffic signs in South Korea. They proposed a lightweight traffic sign detection method using cascaded CNN [17], which is hardware-friendly and reduces the computational complexity compared with Agone’s proposed YOLOv2-tiny [18]. Yen et al. [19] proposed a CNN configured with area masks to resolve the occlusion problem in traffic sign detection. The method was highly effective in alleviating the occlusion problem. Siniosoglou et al. [20] proposed an auto-encoder model, which showed high precision in recognizing fuzzy traffic signs. Franzen et al. [21] used a neural network trained in the frequency domain to detect traffic signs, greatly reducing the number of neurons compared to the traditional neural network. In 2020, Jocher et al. [22] proposed the YOLOv5, a progressive addition to the YOLO family of algorithms. Until now, YOLOv5 continues to undergo upgrades and iterations.
In 2021, Nagrath et al. [23] designed the SSDMNV2 approach; it uses SSD as a detector and MobileNetV2 architecture as a framework for the classifier. This lightweight setup is suitable for real-time mask detection, even on embedded devices. Additionally, Pooja et al. [24] proposed a detection method that uses TensorFlow and OpenCV. At the same year, Du et al. [25] established a target object grab setting model with the multi-target object and the anchor frame generation measurement strategy overcoming external environmental interference factors such as mutual interference between objects and changes in illumination. In 2022, Liu et al. [26] proposed a symmetrical traffic sign detection algorithm M-YOLO, for complex scenes. The algorithm optimizes the delay by reducing network computational overhead and speeding up feature extraction. Similarly, Loey et al. [27] proposed a detection model consisting of two components. The first component is designed for feature extraction using ResNet50, while the second component is designed for the classification process of face masks using decision trees, SVMs, and ensemble algorithm. Yun et al. [28] proposed a method of cluttering pose detection based on convolutional neural network with multiple self-powered sensors information. In 2023, Shi et al. [29] proposed the cross-stage attention network module to enhance the feature extraction capability of the network. They used a dense neck structure for the comprehensive fusion of detail and semantic information. Liu et al. [30] proposed a new key point assumption strategy based on the basis of the PvNet model. Meanwhile, a fusion method of pixel-by-pixel key point voting and depth image is applied to improve the performance of the model.
However, this study proposes the C2Net-YOLOv5 model for traffic sign detection based on the YOLOv5 framework, offering enhanced speed and suitability in real-time applications. The YOLO framework is developing rapidly; many have already found practical applications across various domains.
The YOLOv5 method is the best one-stage target detection method, distinguished by its computational efficiency and fast processing speed. In this study, the C2Net-YOLOv5 model was constructed based on the YOLOv5 framework, as shown in Fig. 1.
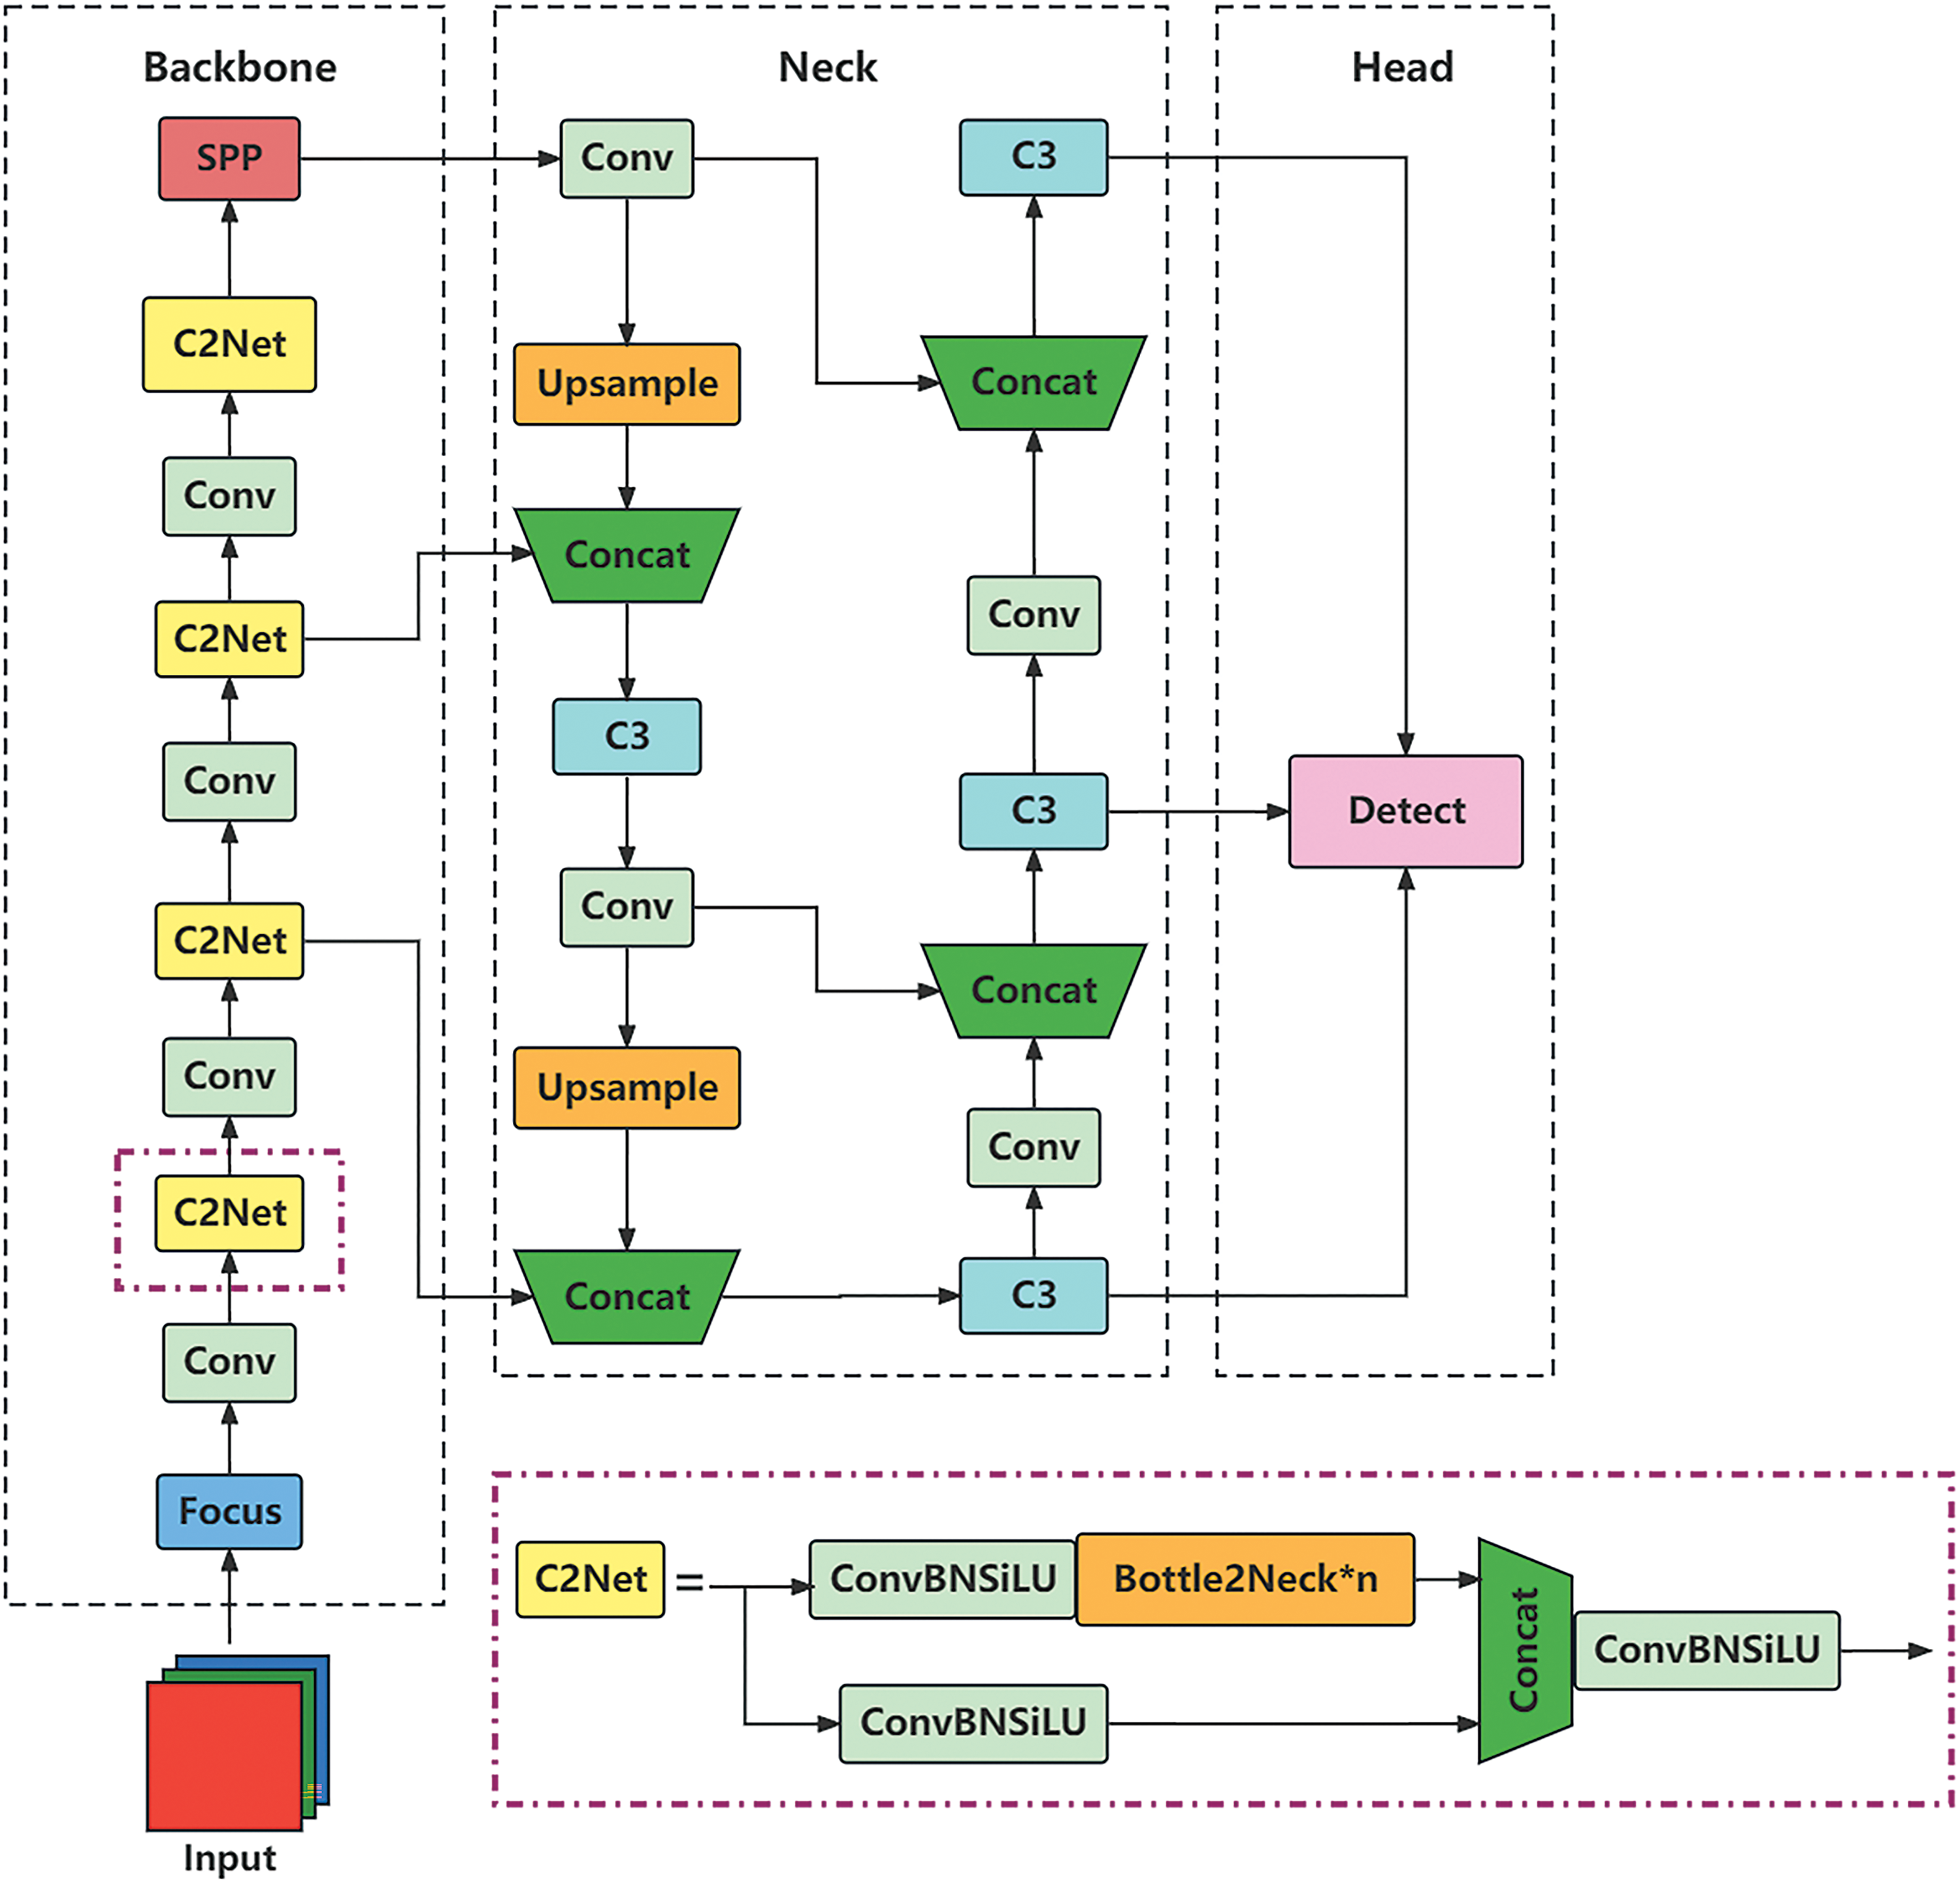
Figure 1: C2Net-YOLOv5 model
In the Backbone segment of the C2Net-YOLOv5, the main features are extracted through focus, convolution (Conv), C2Net, and spatial pyramid pooling. Focus is a special convolutional structure designed by YOLOv5’s authors for multi-scale feature extraction in small target detection. C2Net enhances the network’s ability to handle targets of varying scales, thereby improving detection performance. Conv refers to the convolution layer responsible for constructing the backbone network, feature extraction module, and classifier. It extracts features from the input feature graph and facilitates information processing and transformation.
The Neck segment adopts the combination of FPN and PAN concepts. The FPN fuses features from different scales and then performs prediction on the fused feature map. FPN is a feature pyramid network structure for target detection and semantic segmentation tasks. It enables the construction of a feature pyramid through a top-down feature propagation process and lateral connection. This mitigates target scale changes and facilitates small target detection. However, the PAN combines feature pyramids and path aggregation for comprehensive multi-scale information fusion. It leverages the backbone network to construct a multi-layer feature pyramid on the feature graph extracted at different stages of the backbone network. PAN efficiently captures both semantic and detailed characteristics of targets through effective multi-scale information. The combination of FPN and PAN uses the advantages of the two network structures to achieve more effective and robust feature representation and information fusion.
The Head module serves as the output layer, further extracting network features and transforming them into target detection boxes and category predictions for input images.
3.1 Construction of the C2Net Module
The C2Net module consists of three ConvBNSiLU modules, multiple Bottle2neck modules, and a Concat module, as shown in Fig. 1. The ConvBNSiLU module refers to the structural combination of Conv, batch normalization (BN), and sigmoid-weighted linear unit (SiLU). The Bottle2neck module will be introduced in Section 3.2. The Concat module is a commonly used module in deep learning to connect multiple input features along specific dimensions.
In the earlier version of YOLOv5, the backbone network used the BottleneckCSP module for feature extraction. C2Net differs from the BottleneckCSP module; it removes the Conv module after the remaining output and replaces the activation function in the standard convolutional module with SiLU. The C2Net module is structured into two branches: one uses the specified multi-Bottle2neck stacks and ConvBNSiLU modules, while the other traverses a single ConvBNSiLU module. Subsequently, the branches were subjected to the Concat and ConvBNSiLU operations.
The advantages of the C2Net module are as follows: firstly, concatenating multiple convolutional layers boosts the model depth and width. This enhances the model’s expressive ability to learn complex feature representations; secondly, the module uses convolution operations at varying scales to fuse multiple feature maps. This fusion of multi-scale features improves the model’s perception of different target sizes and details. Additionally, the C2Net module leverages parallel computing through concatenating and convolving feature maps of different sizes, which optimizes computational efficiency. In summary, the C2Net module excels in multi-scale feature fusion and computational efficiency.
To address the challenges of insufficient feature extraction in the model, a bidirectional Res2Net module is introduced into the Bottle2neck module, as shown in Fig. 2c. This module facilitates multi-scale feature extraction in two opposite directions, which enhances feature representation. This approach also rectifies the singularity orientation inherent in the Res2Net model. In this study, the addition of squeeze-and-excitation (SE) channel attention resolves the issues arising from varying channel importance during convolution pooling.
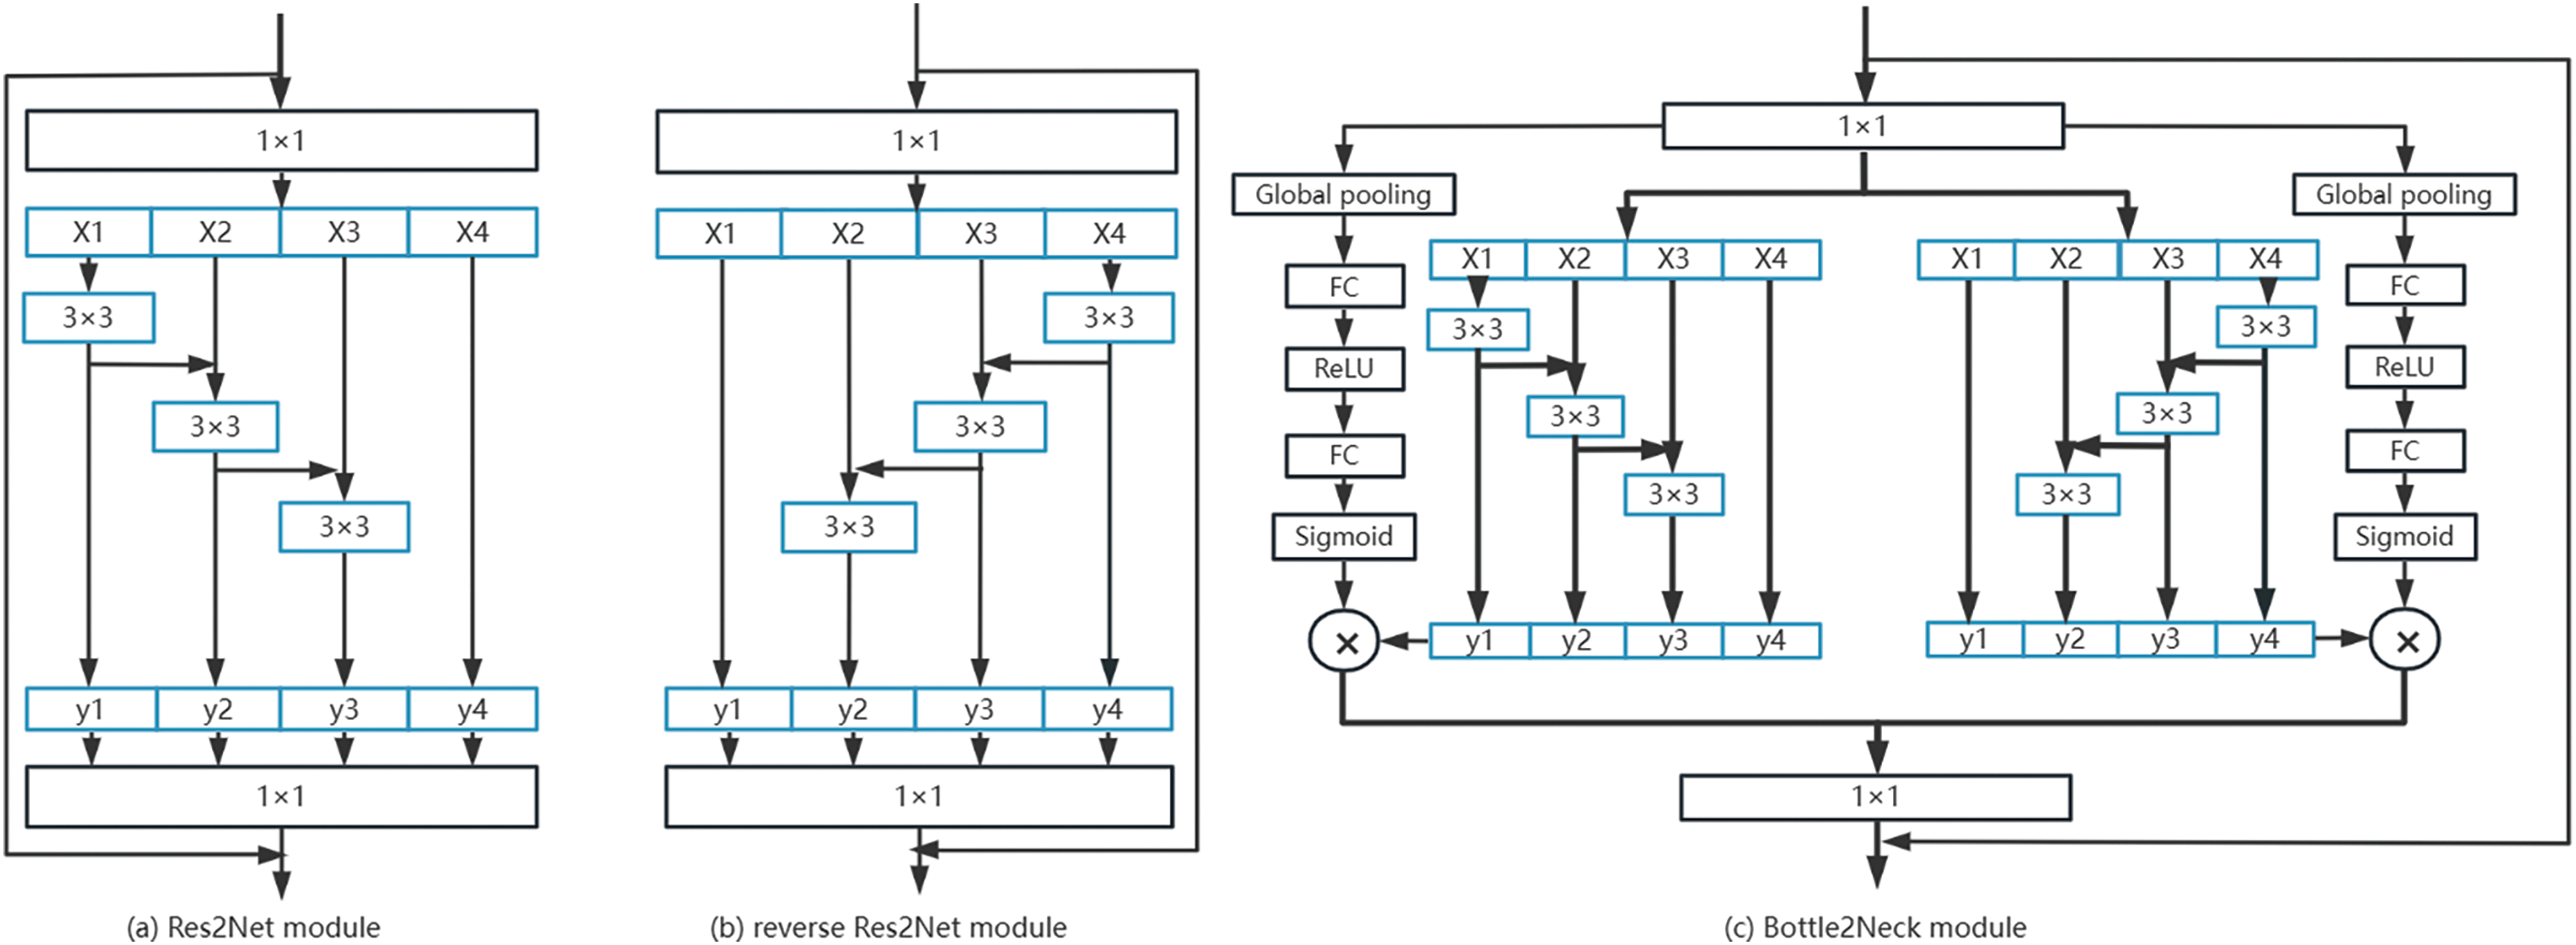
Figure 2: Res2Net, reverse Res2Net and Bottle2neck modules
The Bottle2neck module takes full advantage of Res2Net for multi-scale feature extraction. The standard 1-3-1 CNN layout is replaced with multi-scale residual layering architecture. This alteration shifts the main convolution in the middle from a single branch to a multi-branch configuration. By increasing the receptive fields within the block, different scale levels are captured layer by layer at a finer granularity, enhancing the CNN’s ability to detect objects within images. In this study, the bidirectional Res2Net module was further used to conduct multi-scale feature extraction in two opposite directions to rectify the singularity in the direction of the Res2Net model.
3.2.1 Res2Net Module and Reverse Res2Net Module
Fig. 2a shows the Res2Net module used in this study. It constructs residual blocks of multiple branches within a single residual block. This module refines multi-scale features at a more granular level and expands the network’s perceptual field. The steps are outlined as follows:
1) First, the module introduced a novel parameter, referred to as scale (denoted as s), which signifies the number of groups into which the feature map is divided.
2) Next, the output features of the first 1 × 1 convolutional layer were divided by Res2Net into s equal groups based on channels, with each group having w channels, i.e., n = s × w.
3) Next, the second layer convolution kernel in the original Bottleneck block was divided by Res2Net into s groups, with each group having output channels w (similar to step 2). The convolution operation for each group is denoted
4) For each group of features, after grouping
Finally, the outputs corresponding to each group were channel concatenated and fed into a final layer of 1 × 1 convolutional layers to fuse the multi-scale features and obtain the block’s output. This module’s distinctive structure, characterized by a residual-like concatenation mechanism, is referred to as Res2Net.
Fig. 2b shows the reverse Res2Net module, which is symmetrically aligned with the Res2Net module. This module aims to enhance feature representation and achieve complementary information.
3.2.2 SE Channel Attention Module
The squeeze-and-excitation network (SENet) focuses on inter-channel relationships, enabling the model to automatically learn the importance of different channel features. SENet proposed the SE module as shown in Fig. 3. The operational process is as follows:
1) Squeeze: Using global average pooling, the two-dimensional features (H * W) of each channel were compressed into a real number. The resulting feature map transformed from [h, w, c]==> [1, 1, c], yielding channel-level global features.
2) Excitation: Weight values were generated for each feature channel, establishing correlations between channels through two fully connected layers. The number of output weight values corresponds to the number of channels in the output feature map. The operation transformed from [1, 1, c] ==> [1, 1, c], learned the relationships between different channels, and obtained the weights of different channels.
3) Scale: The normalized weights obtained earlier were applied to each channel’s features. This was achieved through channel-wise multiplication of weight coefficients, i.e., [h, w, c] * [1, 1, c] ==> [h, w, c].
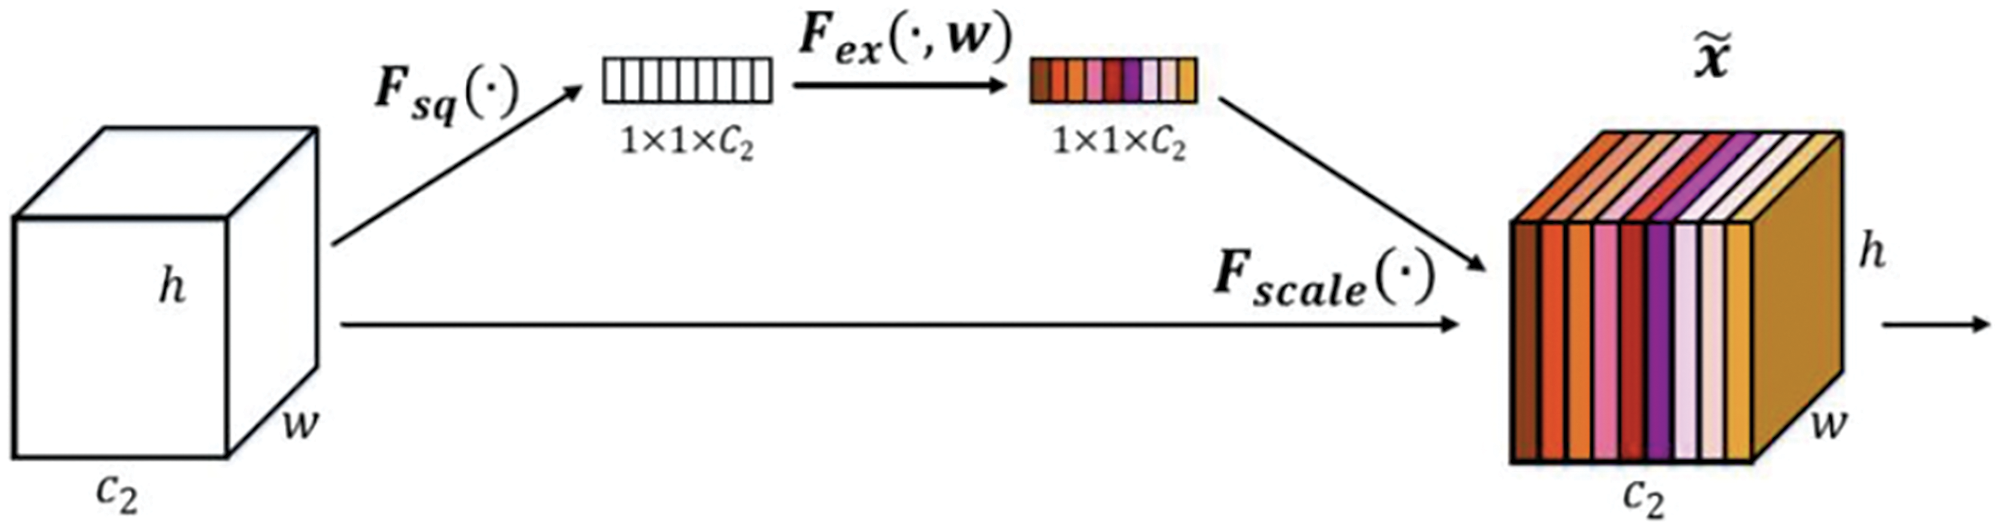
Figure 3: SE channel attention
Essentially, the SE module performs attention or gating operations within the channel dimension, which allows the model to focus more on channel features with higher information content while suppressing less important ones.
In Fig. 2c, the Bottle2neck module uses the channel attention module. Given that channel weights for different channels often differ within an image, capturing this information enhances the model’s overall information capacity and accuracy.
4 Experiments and Analysis of Results
This section presents the experimental evaluation of the proposed method. The proposed traffic sign detection method is implemented using the PyTorch deep learning framework. The method’s efficacy was verified through testing on the TT100K and CCTSDB 2021 datasets.
This study used the TT100K and CCTSDB 2021 [31] datasets. The TT100K is a traffic sign dataset produced by Tencent and Tsinghua, with a total of 100,000 images, of which 10,000 contains traffic signs. The training set consists of 6,150 images, while the test set consists of 3,071 images. Notably, the dataset exhibited category imbalance, as certain signs (e.g., landslides and villages ahead) were not visible in the city center. Additionally, there were 70 missing categories, i.e., 70 categories lacked instances, emphasizing the importance of meticulous data processing. Only categories containing more than 100 images were retained.
The CCTSDB 2021 dataset is a novel Chinese traffic sign detection benchmark proposed by the authors, which adds over 4,000 real traffic sign images and homologous detailed labels to CCTSDB 2017. Furthermore, it replaces many original easy-to-detect images with difficult samples to fit the complex and variable detection environment.
In evaluating the experimental results, box_loss, cls_loss, obj_loss, precision, recall, Map0.5, and F1-score were used as indicators for evaluating the proposed methods.
The cls_loss was used as the classification loss function. The model generated three prediction boxes for each N * N grid cell containing nc classification probabilities. The formula for calculating cls_loss, as presented in Eq. (2), involves several components, such as label (representing values in the unique heat code label), α (the smoothing coefficient with a value ranging from 0 to 1), and nc (representing the total number of categories). The label probability matrix is denoted as matrix
The box_loss was used as the localization loss to indicate the deviation between the prediction and calibration boxes. The formula for calculating box_loss, as presented in Eq. (3), consists of a constant
The obj_loss was used as the confidence loss function to indicate the confidence level of the computed network. The formula for calculating obj_loss is presented in Eq. (4). The
The precision indicates the proportion of the predicted positive samples that are positive. The formula for calculating precision is presented in Eq. (5). The true positive (TP) + false positive (FP) represents the number of results that have been determined to be positive samples, and TP represents the number of positive samples that have been determined to be positive.
The recall is also referred to as the check rate. It indicates the proportion of the correctly identified samples in the total positive samples. The formula for calculating recall is presented in Eq. (6). The TP + false negative (FN) represents the actual number of positive samples, and TP represents the number of positive samples that have been determined to be positive.
The Map0.5 is the average precision of all categories at an intersection over union (IOU) threshold of 0.5. The formula for calculating Map0.5 is presented in Eq. (7). The variable k represents the total number of categories and
The F1-score is a measure of the classification problem. The formula for calculating F1-score is presented in Eq. (8). The precision represents the accuracy, and recall represents the recall rate.
4.3 Performance of the TT100K Dataset
To test the efficacy of the proposed method, the TT100K dataset was first used to train and analyze the experimental results. Fig. 4 shows the experimental effect of the proposed method on the TT100K dataset. Given the relatively small proportion of traffic signs in the entire map, for a clearer display effect, the six localized detection detail maps were stitched together to form Fig. 4. It can be observed that the model detects targets with high accuracy and accurately classify them into the correct category.
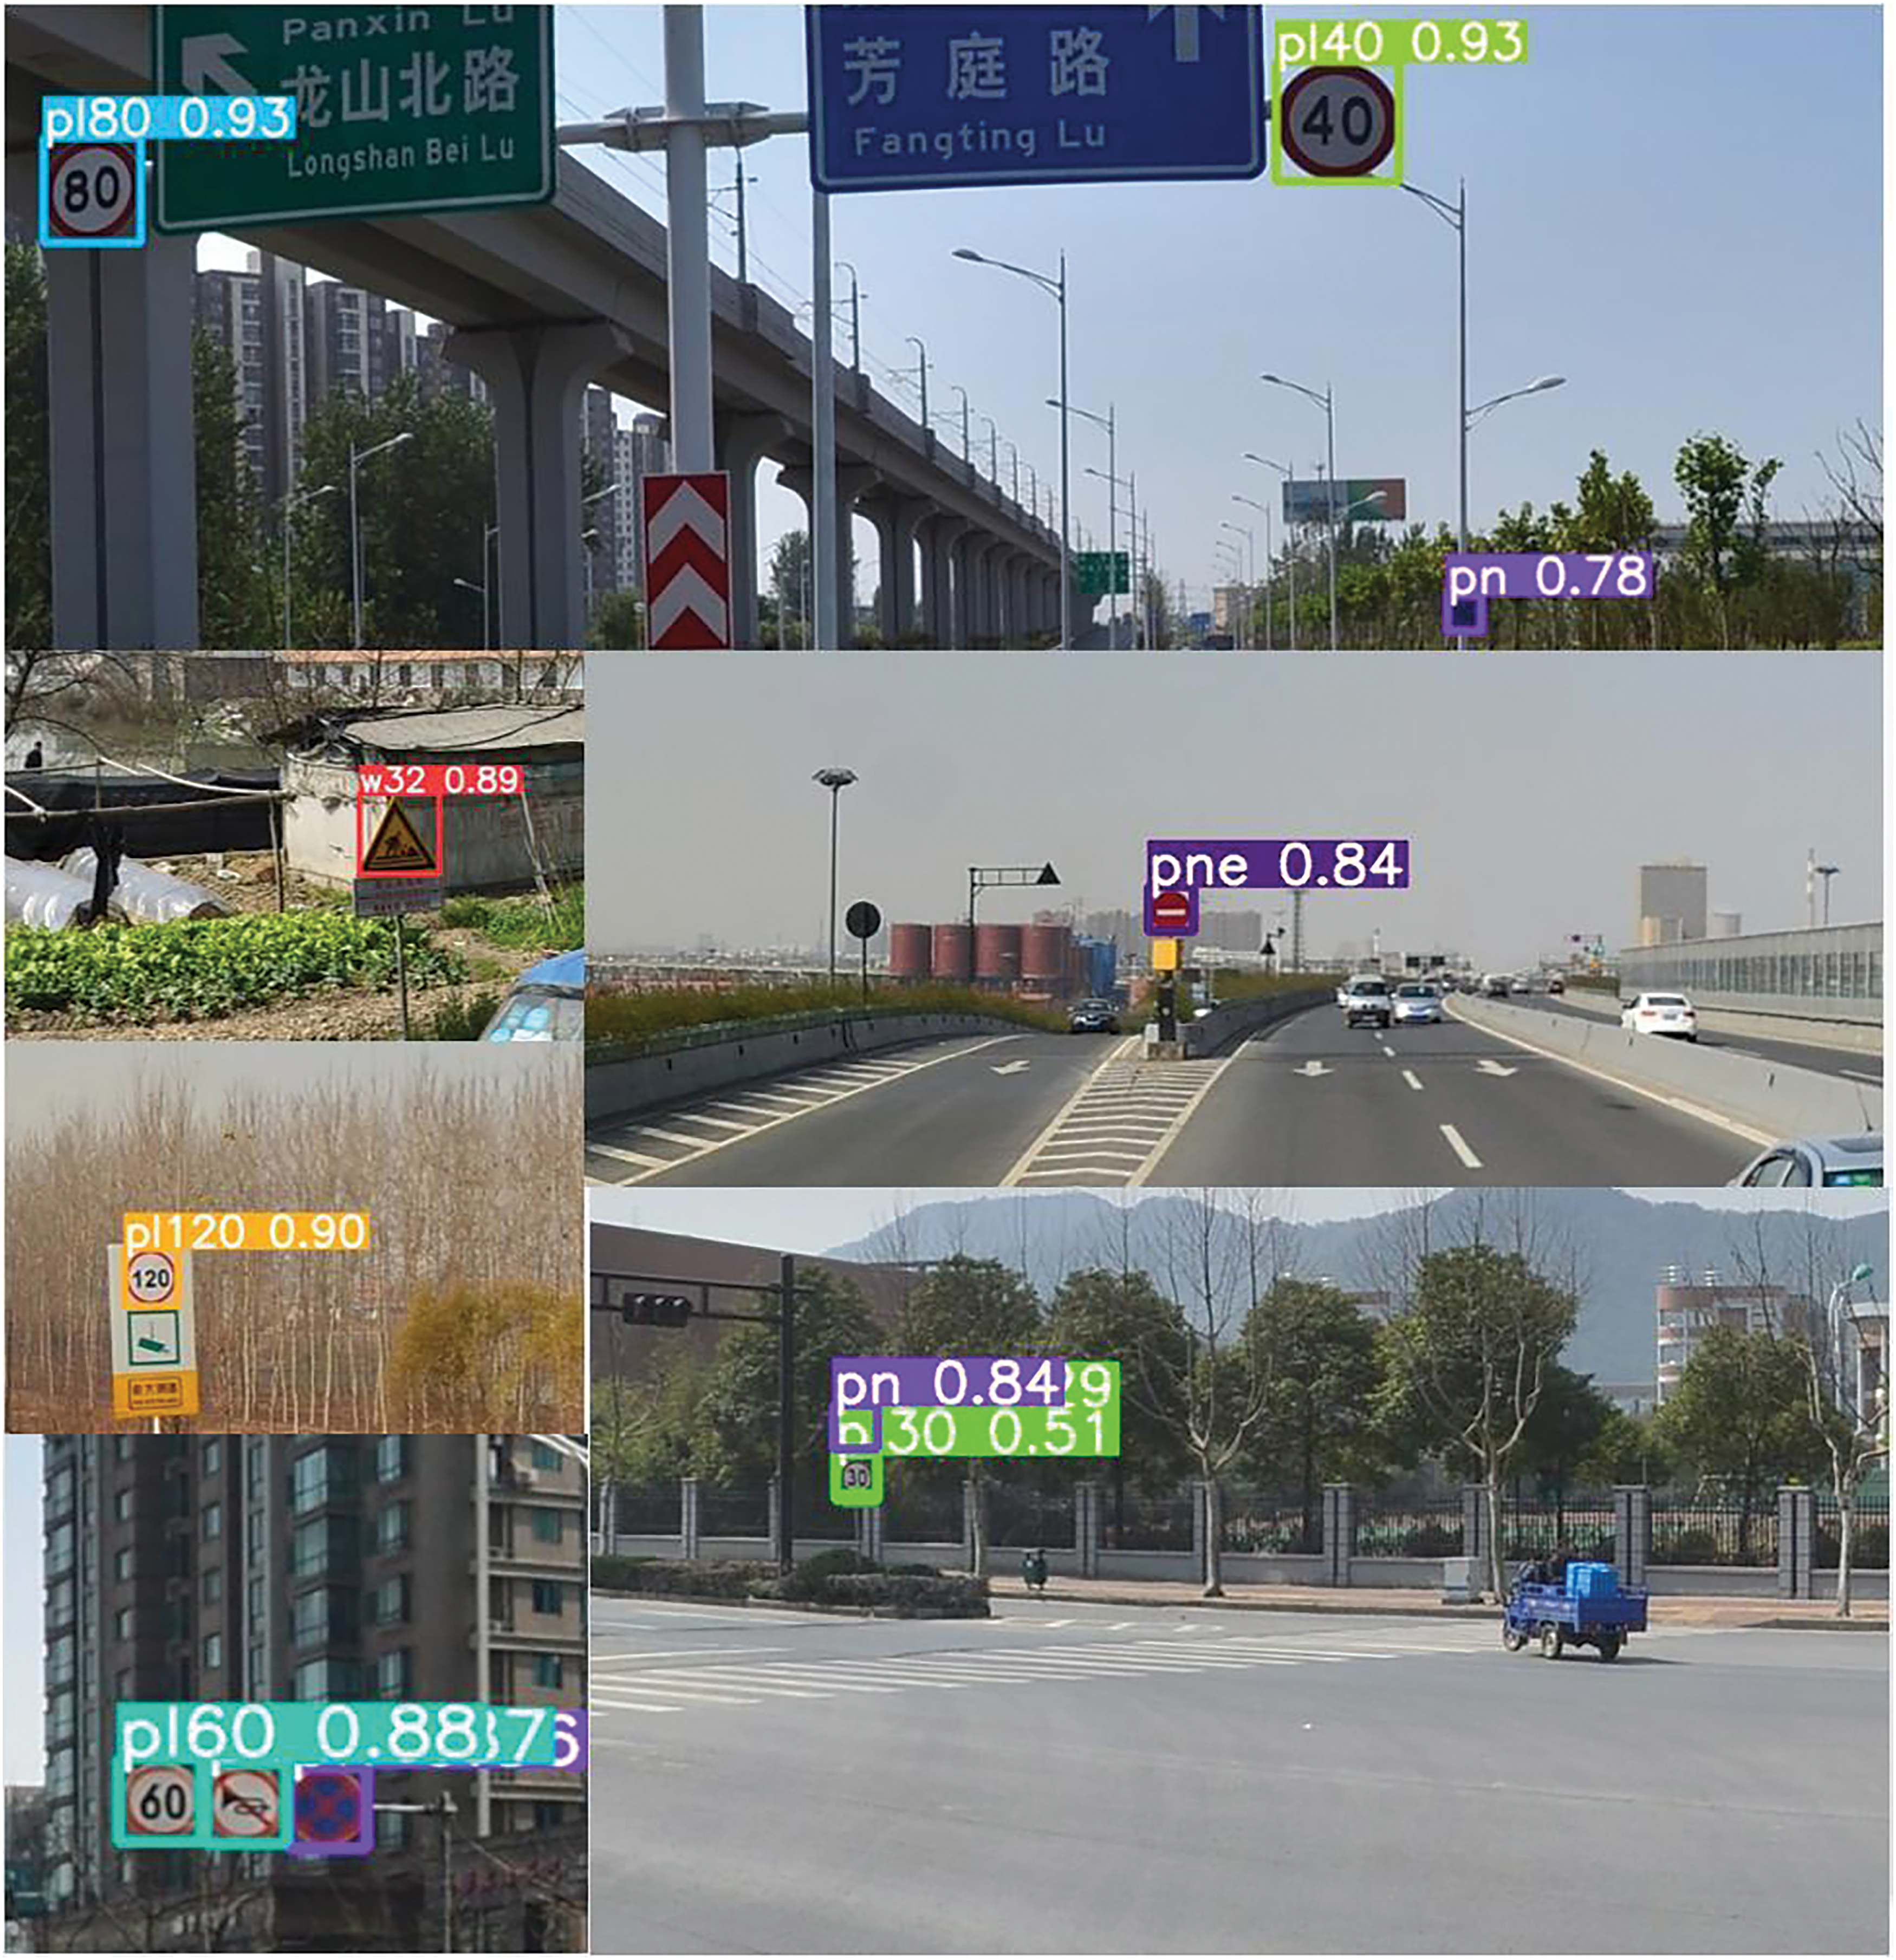
Figure 4: Sample detection results based on the C2Net-YOLOv5 method
Fig. 5 shows the results of YOLOv5 and the C2Net-YOLOv5 model trained on the TT100K dataset. The evaluation criteria consisted of cls_loss, box_loss, obj_loss, precision, recall, and Map0.5. Larger values of precision, recall, and Map0.5 indicate superior predictions, while smaller values of cls_loss, box_loss, and obj_loss denote improved predictive performance. From the comparison of the line diagram, it can be observed that in the initial stage of the detection model training, the learning efficiency of the model is higher, and the convergence rate of the training curve is faster. As the training period increases, the slope of the training curve gradually decreases and eventually stabilizes. Fig. 5 shows that each loss function gradually converges. The precision, recall, and Map0.5 metrics continuously improve and converge as the number of training periods increases. In terms of precision metrics, the C2Net-YOLOv5 model consistently maintained a slightly higher performance than the YOLOv5 model during training. At an IOU threshold of 0.5, the proposed model achieves an improved level of detection accuracy compared to the original YOLOv5 model and converges more rapidly. Therefore, the C2Net-YOLOv5 model not only enhances precision, recall, and Map0.5, but also exhibits faster convergence than the YOLOv5 model. The C2Net-YOLOv5 model’s performance on TT100K gradually stabilized after 600 rounds of training, indicating the feasibility of optimizing the model for significant improvements compared to the original model.
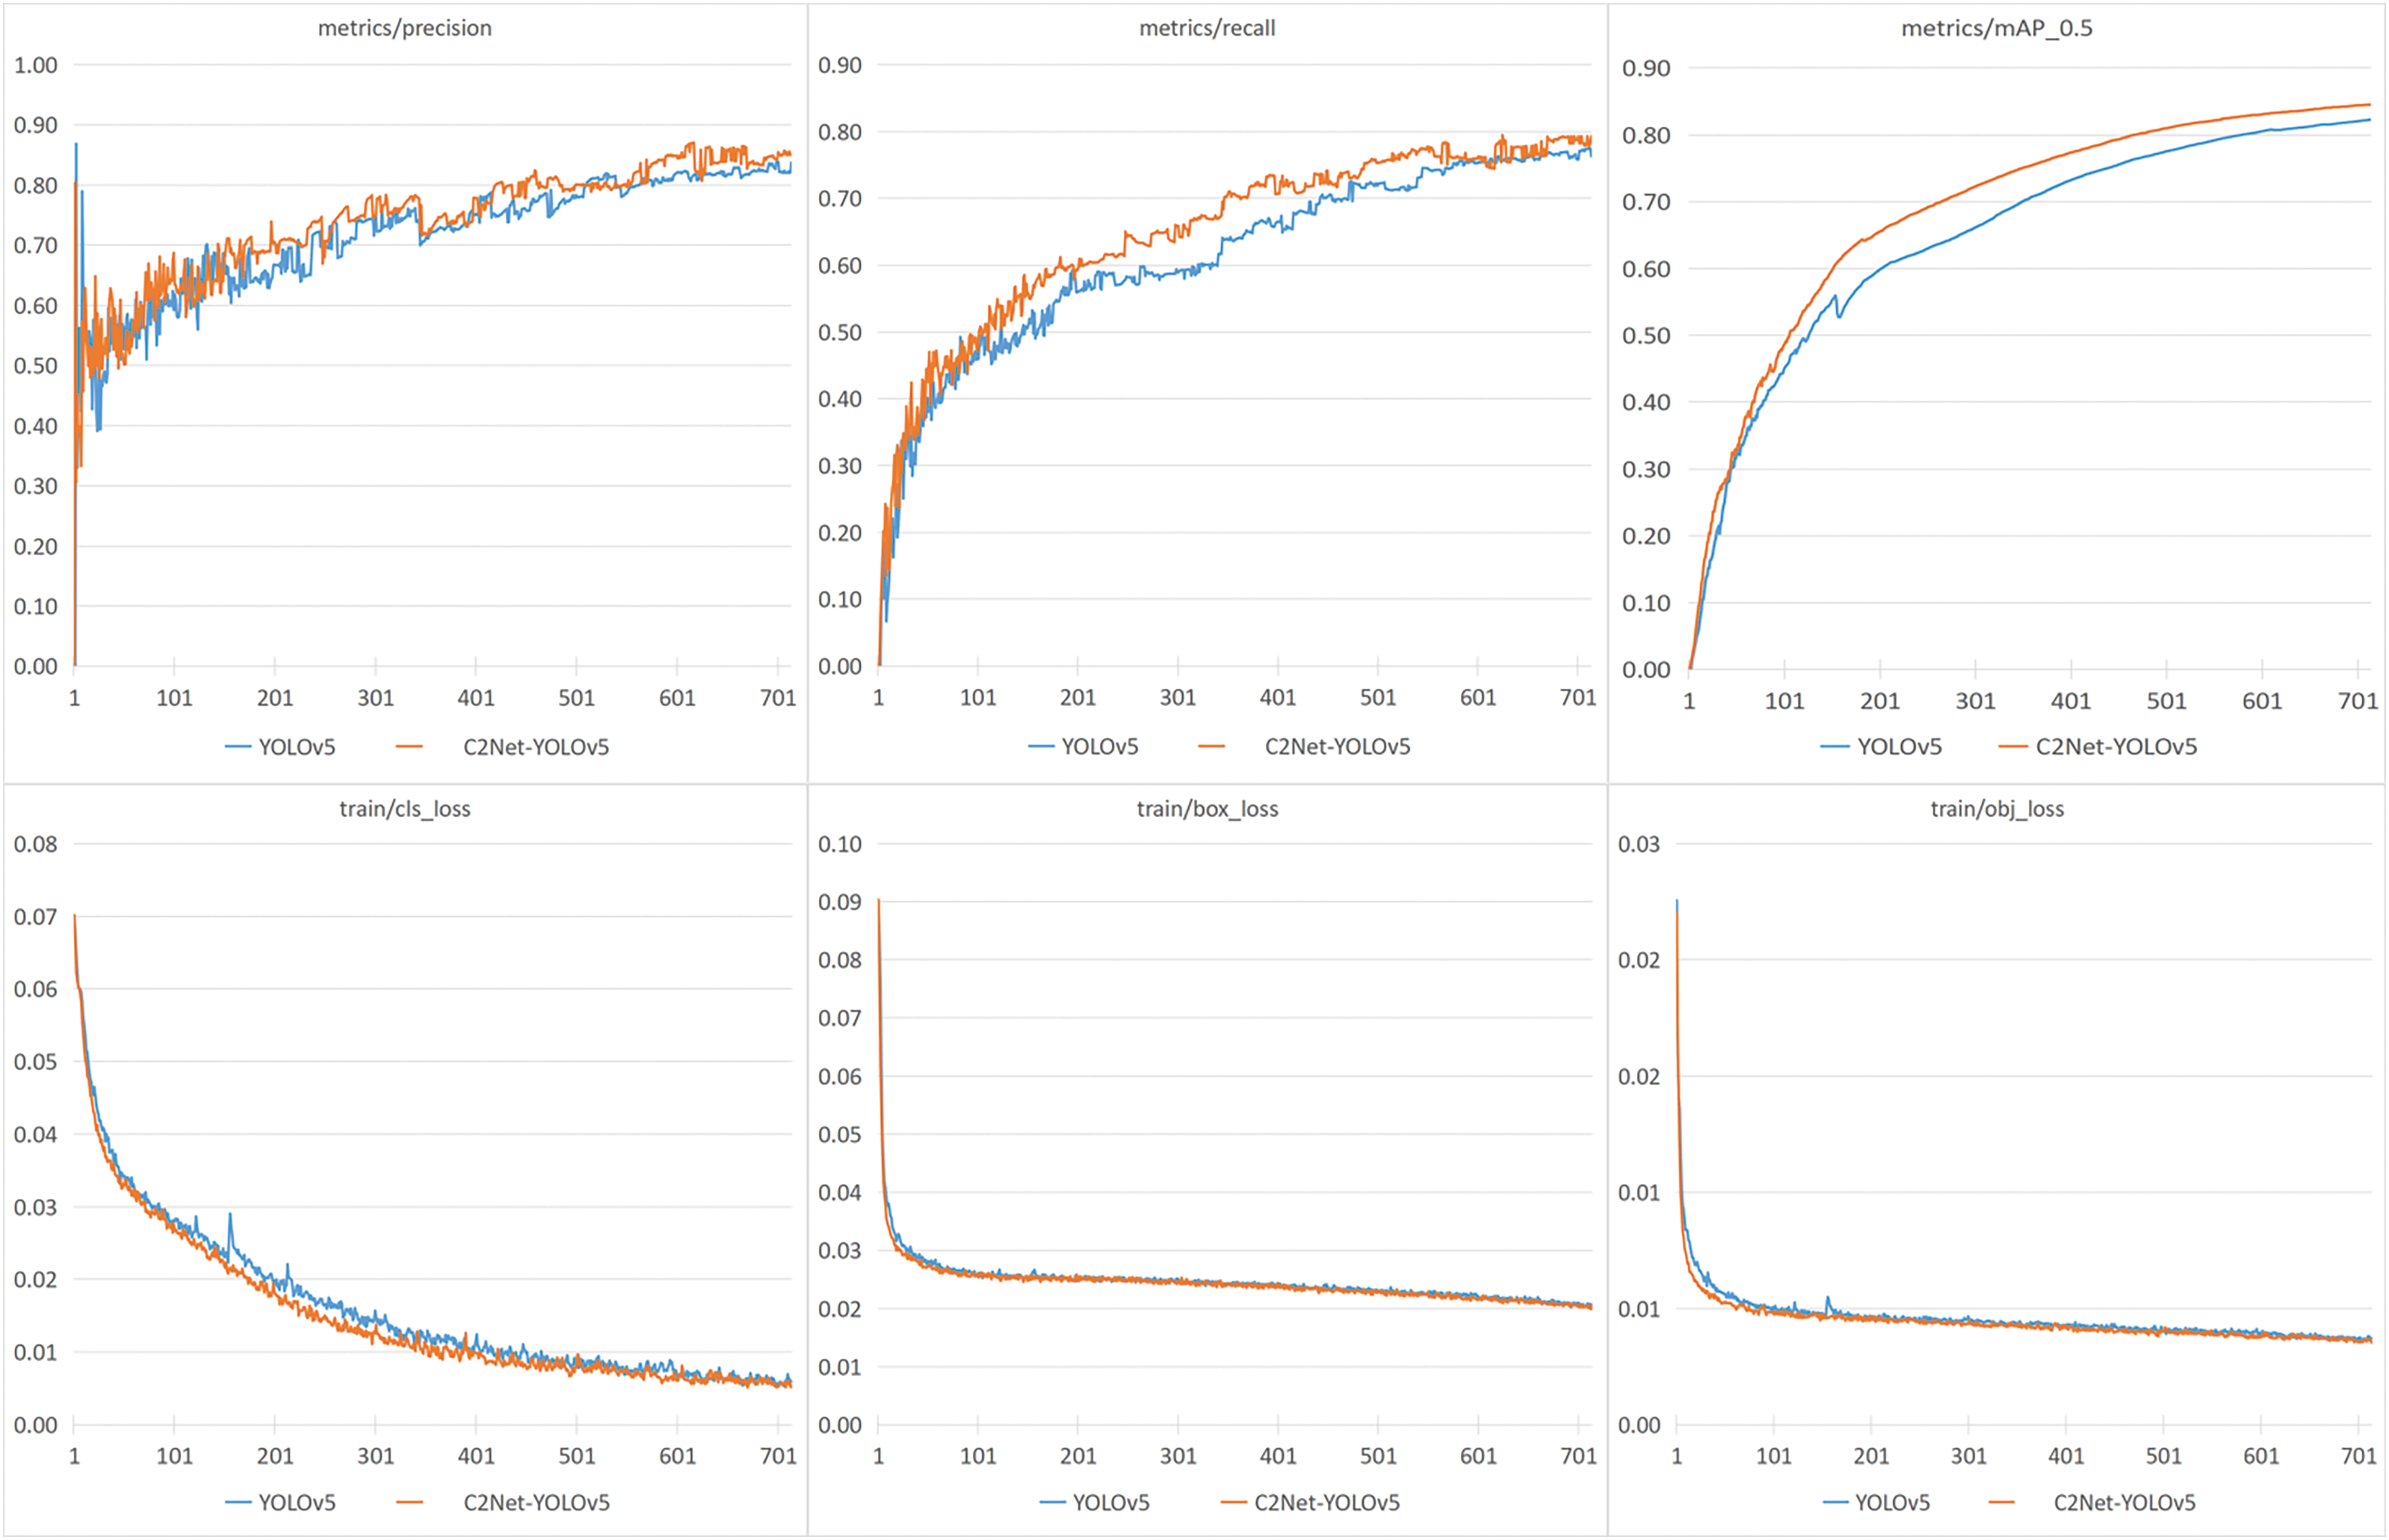
Figure 5: Detection results of YOLOv5 and C2Net-YOLOv5 on the TT100K dataset
In addition to the above experimental comparisons, a comparative experiment between C2Net-YOLOv5 and some other mainstream detection models was conducted. This experiment tested Faster R-CNN, SSD, YOLOv5, and C2Net-YOLOv5 on the TT100K dataset. Precision, recall, Map0.5, and F1-score were used as benchmarks for evaluation, and the detection effect of different methods are presented in Table 1. The superiority of the proposed method compared to YOLOv5 is because of the improved ability of the backbone network to extract traffic sign features by introducing a bidirectional Res2Net module and SE attention module in YOLOv5.
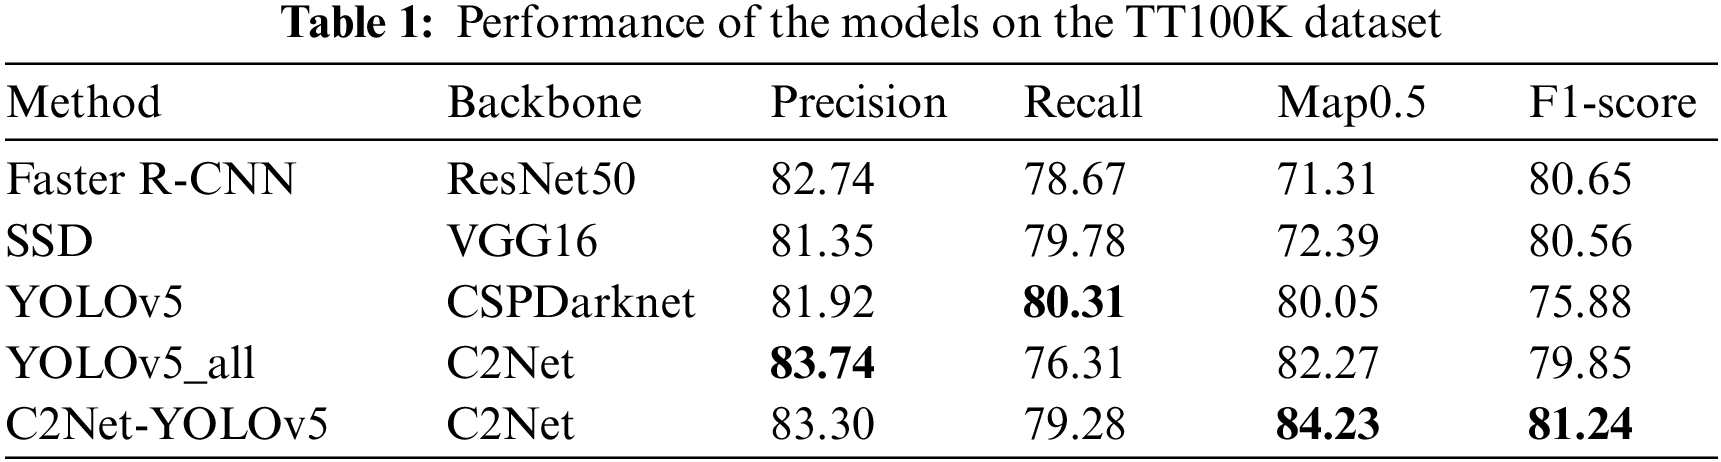
The reason behind the proposed method’s superior performance over Faster R-CNN and SSD is that the feature map of Faster R-CNN is monolayered with a very small resolution. This limits its effectiveness in detecting small and multi-scale objects. In the case of SSD, its feature pyramid structure fails to harness the powerful semantic information in deep feature graphs, which is essential for effectively detecting smaller objects. Therefore, the proposed method’s performance surpasses that of both Faster R-CNN and SSD.
4.4 Performance of the CCTSDB 2021 Dataset
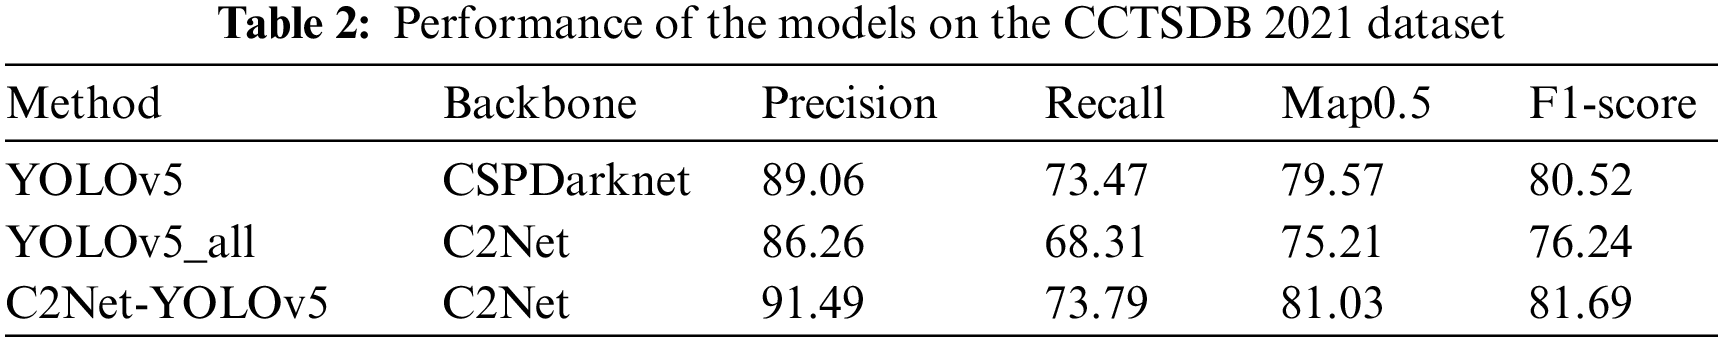
To demonstrate the generalization of the method, the performance of YOLOv5 and the proposed method were tested on the CCTSDB 2021 dataset. The detection results of each model on the CCTSDB 2021 dataset are presented in Table 2. The precision, recall, Map0.5, and F1-score metrics were used as benchmarks for evaluation. The CCTSDB 2021 dataset is characterized by a small number of categories (i.e., mandatory, warning, and prohibited), and the overall performance metrics were all higher than those in the TT100K dataset. Notably, the C2Net-YOLOv5 method increased precision to 91.49, with a slight enhancement in recall, an increase in Map0.5 to 81.03, and an F1-score of 81.69. Overall, these indicators surpassed the detection effectiveness of the original YOLOv5 method.
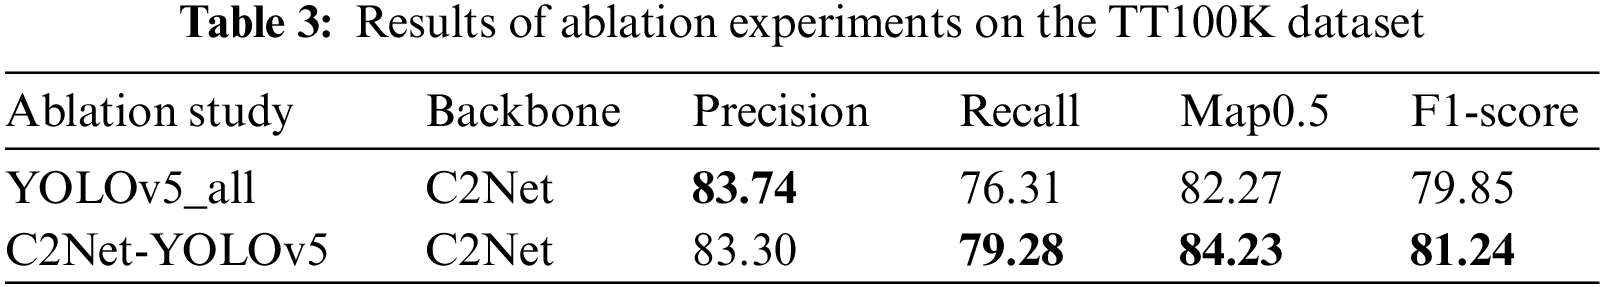
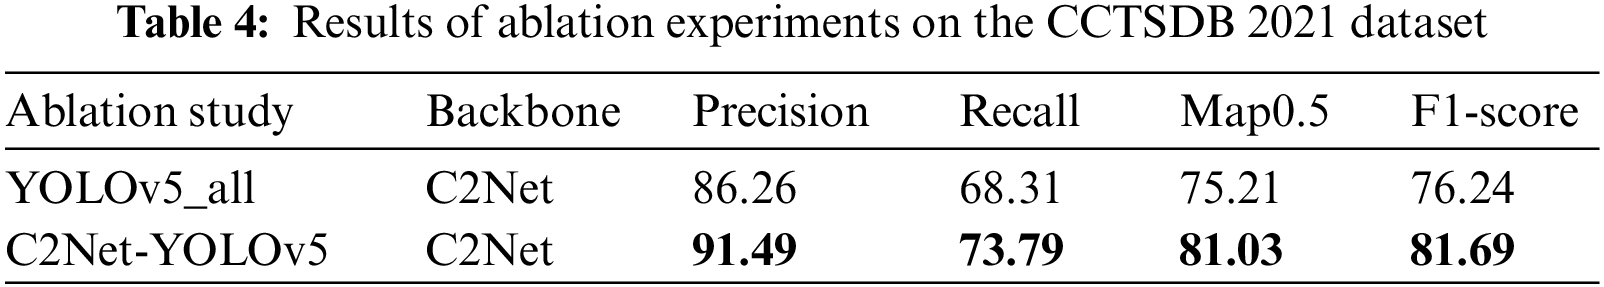
To gain a deeper understanding of the effect of different insertion positions of C2Net modules on the experimental results, ablation experiments were conducted. YOLOv5_all indicates that C2Net was applied to both the model’s Backbone and Neck, while C2Net-YOLOv5 indicates that C2Net was applied solely to the Backbone segment. The key variable under consideration was whether the C2Net module for feature extraction and fusion was included. The experiments were conducted on both the TT100K and CCTSDB 2021 datasets. The impacts of the different designs on the experiments are presented in Tables 3 and 4. Upon analyzing the model’s performance on the TT100K and CCTSDB 2021 datasets, the C2Net-YOLOv5 model exhibited the best experimental results. Notably, the recall, Map0.5, and F1-score metrics were greatly higher than the YOLOv5_all method in the TT100K dataset, despite exhibiting slightly lower accuracy. Furthermore, in the CCTSDB 2021 dataset, all metrics of C2Net-YOLOv5 surpassed the YOLOv5_all method.
4.6 Performance Comparison of Res2Net and Bidirectional-Res2Net on TT100K
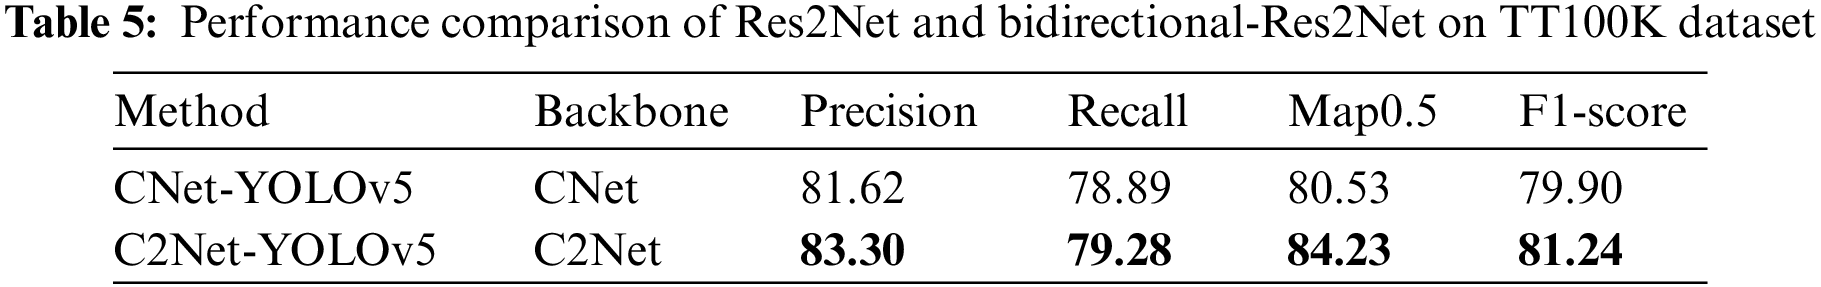
To ascertain the true impact of the bidirectional Res2Net composition on feature extraction capability, a comparative experiment was conducted against the detection network composed of unidirectional Res2Net. The experimental comparison was conducted on the TT100K dataset, with other variables remaining constant. The C2Net-YOLOv5 model indicates that its backbone extraction module is C2Net, which uses a Bottle2neck as a bidirectional Res2Net structure. On the other hand, the C2Net-YOLOv5 model indicates that the backbone extraction module is CNet, with the only distinction being that the Bottle2neck structure changes from bidirectional to unidirectional. The impacts of the different designs on the experiments are presented in Table 5. Upon analyzing the model’s performance on the TT100K dataset, the C2Net-YOLOv5 model exhibited the best experimental results. All metrics of the C2Net-YOLOv5 model greatly surpassed those of the CNet-YOLOv5 method. These findings confirmed that the bidirectional Res2Net composition really enhances the feature extraction ability.
4.7 Overall Performance Comparison
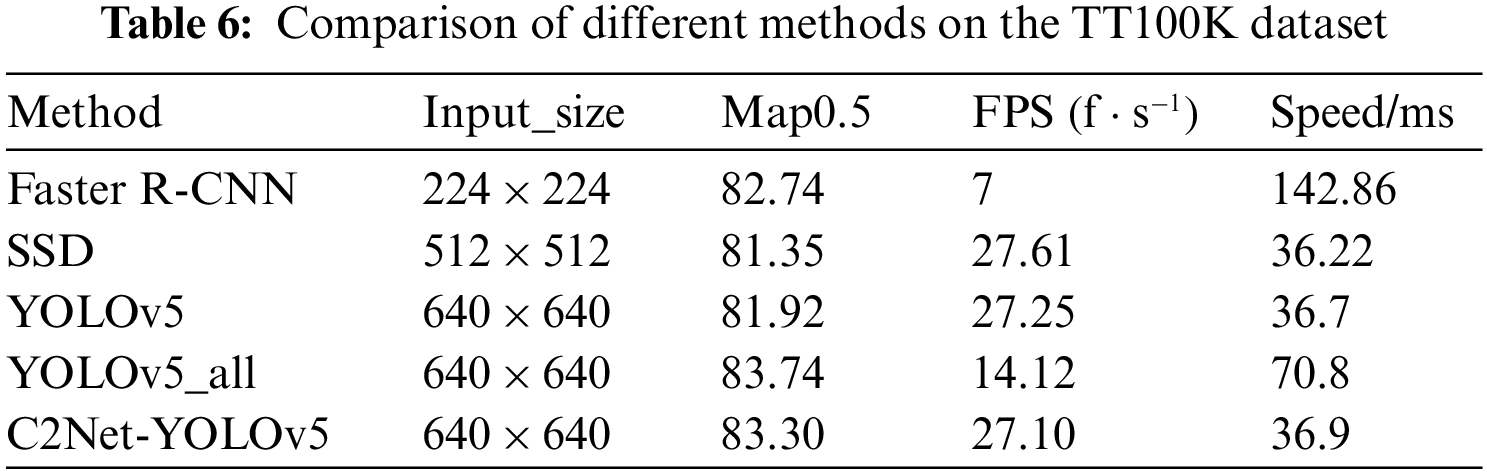
This section compares the C2Net-YOLOv5 and YOLOv5_all with other methods. The results of the comparison, including input_size, Map0.5, frames per second (FPS), and speed/ms, are presented in Table 6. It can be observed that the C2Net-YOLOv5 method exhibited even better results. Notably, Faster R-CNN achieves a Map0.5 of 82.74 for an image size of 224 × 224, but operated at a slower speed of 7 FPS. The SSD achieves a Map0.5 of 81.35 for an image size of 512 × 512, which is faster but with slightly lower detection accuracy than the proposed method. In contrast, the proposed method improves Map0.5 to 83.30 with an input image size of 640 × 640 and achieves a speed of 27.10 FPS. Furthermore, the detection speed is 36.9 ms per image, notably shorter than that of the two-stage detector and an improved accuracy compared to the one-stage detector SSD. This achievement highlights the proposed method’s ability to improve the balance between accuracy and speed.
To evaluate the performance and reliability of the system or model in the face of various abnormal scenarios, robustness testing was conducted on the model. In practical applications, systems or models encounter various uncertainties and changes, such as changes in occlusion, target scale, and lighting. Robustness testing serves as a means to evaluate the performance of a system or model in the real world, ensuring that it adapts to various changes and diversity.
The robustness of the model was tested under occlusion, multi-scale changes, and noise conditions, as shown in Fig. 6. The upper left image shows that the C2Net-YOLOv5 model can detect traffic signs accurately with high confidence even when more than half of the sign is obscured. This performance stems from the model training on a more diverse dataset, which includes traffic sign samples under various occlusion scenarios. This comprehensive training process enables the model to learn more robust feature representations, thereby enhancing its detection accuracy. The two comparison images in the upper right (from left to right) represent the detection performance of the original YOLOv5 and C2Net-YOLOv5 models. In the TT100K dataset, the traffic signs are often small and account for less than one percent of the entire image; the training dataset only includes small object detection. The original YOLOv5 encountered difficulties detecting large traffic signs, as it exhibited multiple detection boxes around the target and traffic signs absent in the false detection dataset. In contrast, the proposed model accurately detects large-scale traffic signs without erroneously detecting signs that are absent. Notably, the C2Net-YOLOv5 model adopts multi-scale feature extraction technology, which makes the model more effective in detecting multi-scale traffic signs. The subsequent two comparative images in Fig. 6 show the model’s accuracy in light and shadow noise scenarios. This accuracy results from the integration of HSV (hue, saturation, value) data enhancement and SE attention mechanism.
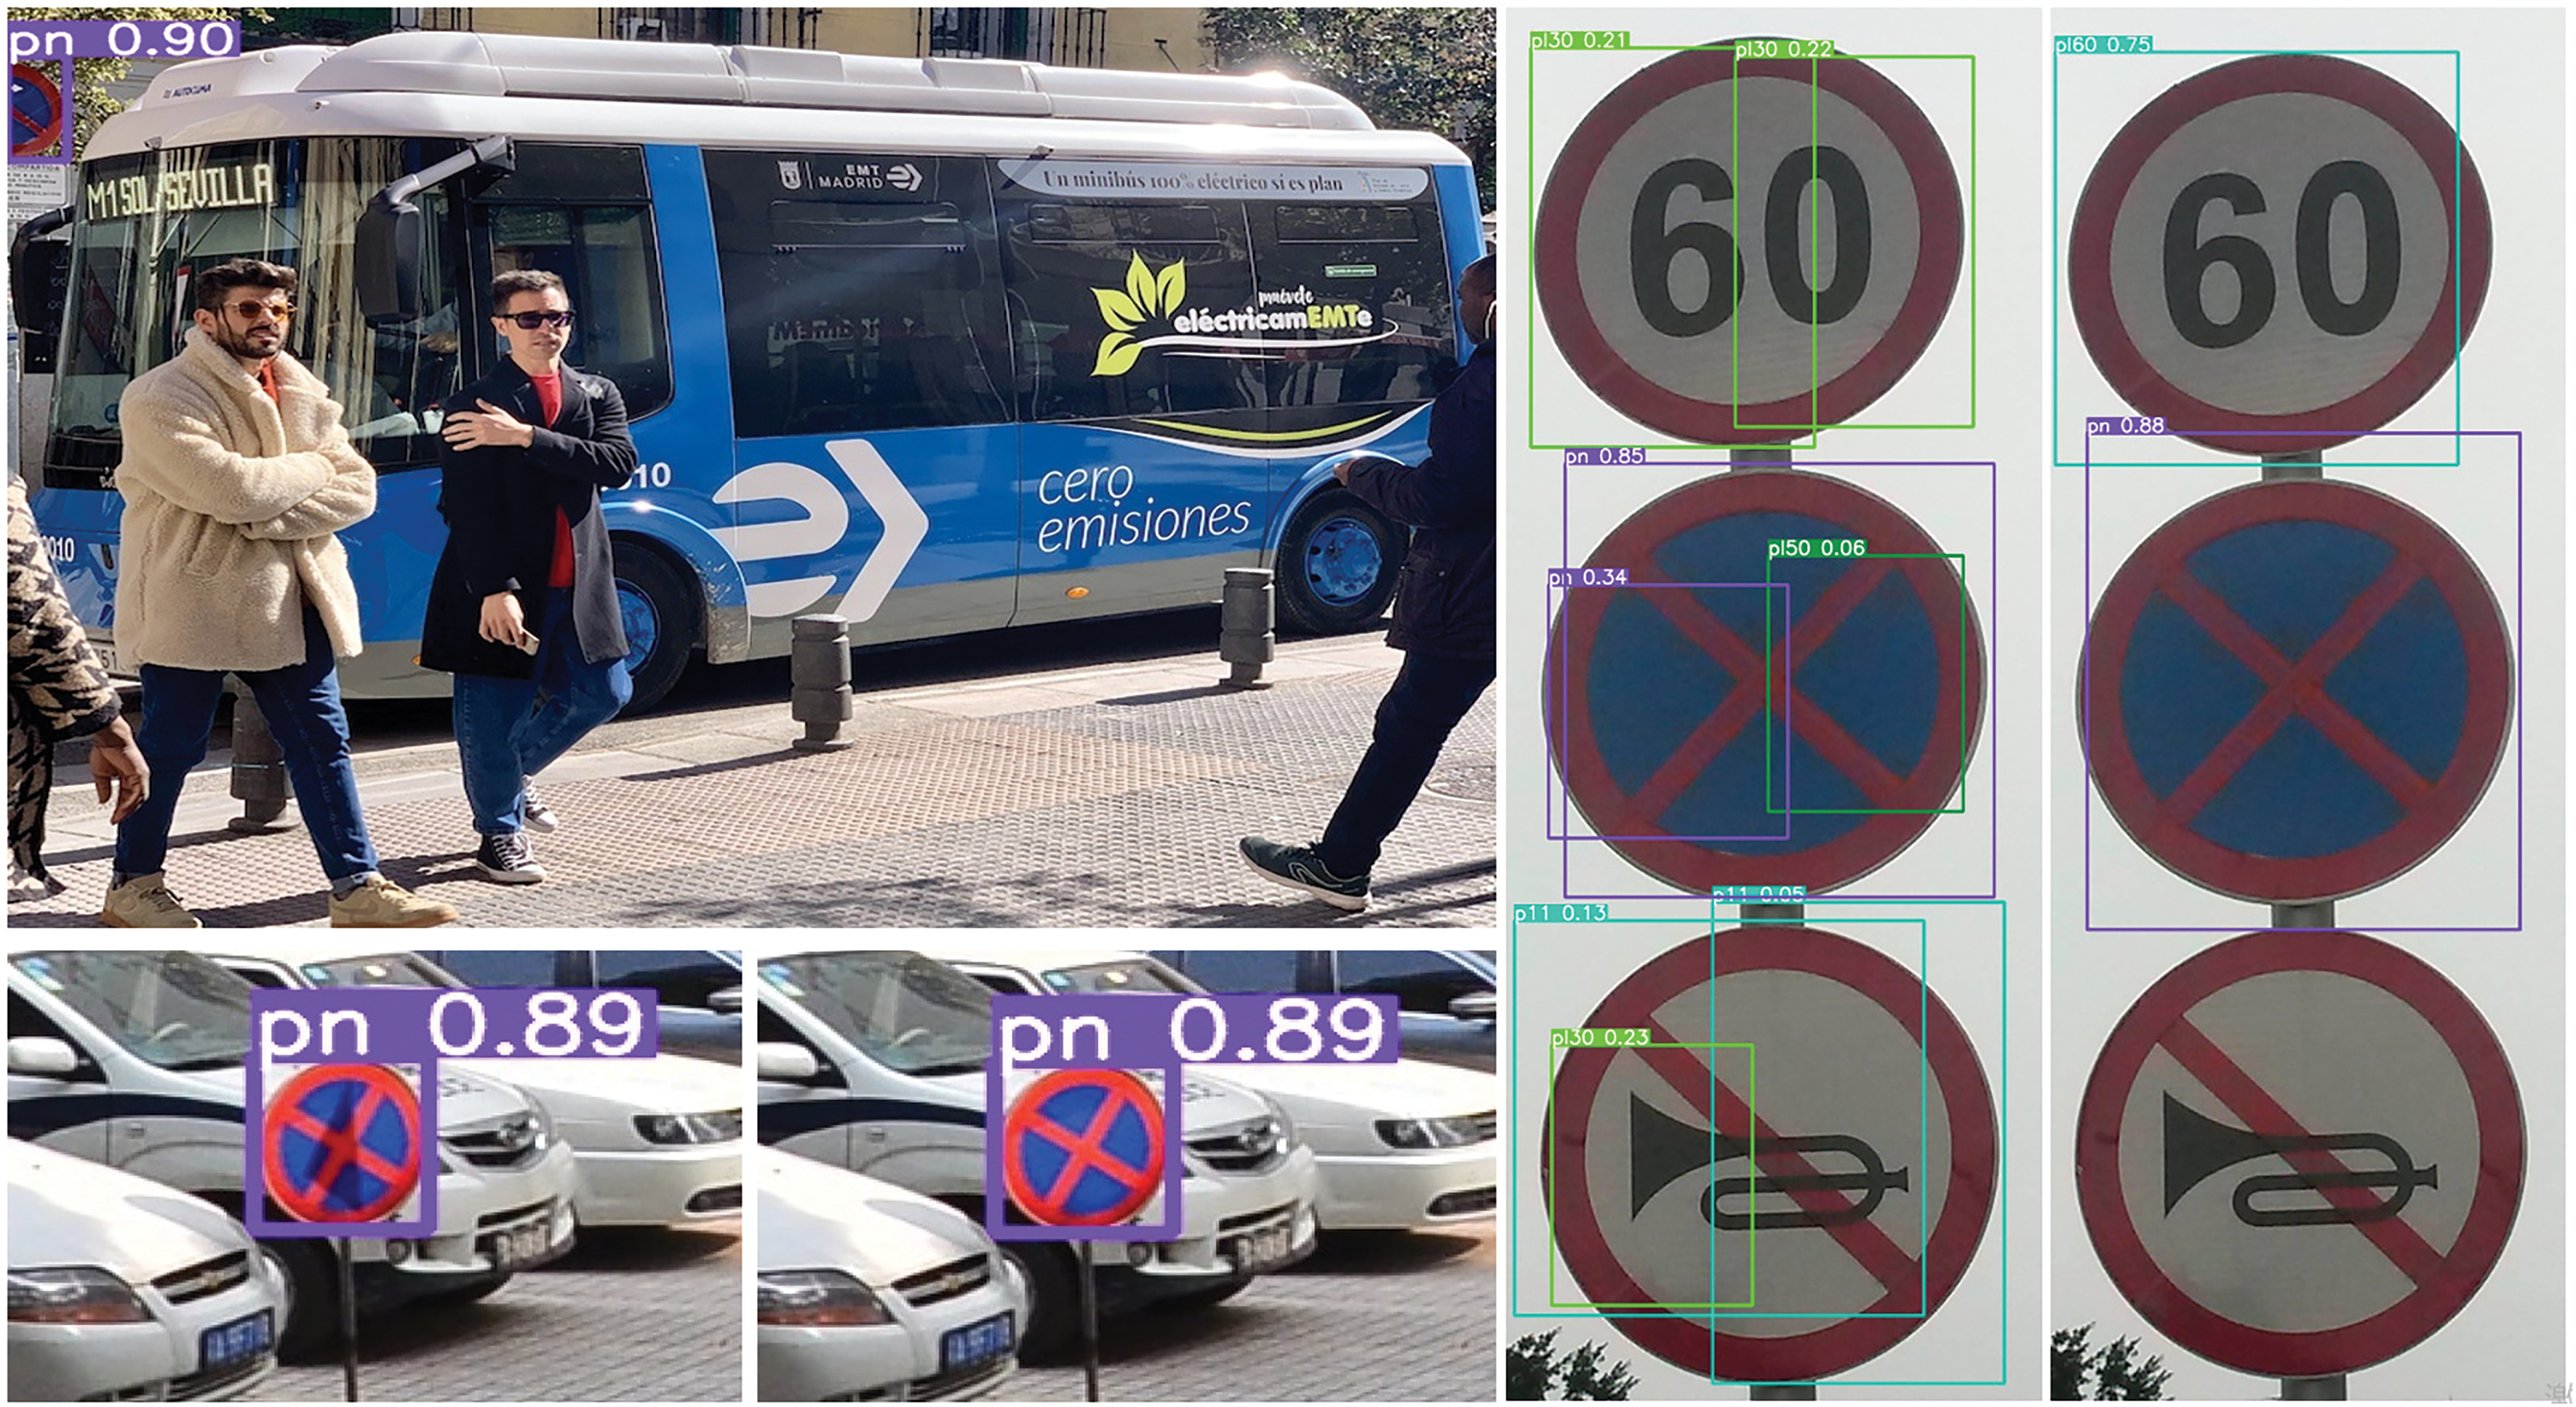
Figure 6: Robustness testing of the C2Net-YOLOv5 on the TT100K dataset
This study proposed a novel traffic sign detection method termed C2Net-YOLOv5. To address the existing limitations of YOLOv5, a bidirectional Res2Net module was used within the Bottle2neck architecture to enhance feature representation and improve the fusion of features across different scales. Additionally, the inclusion of channel attention through the SE attention mechanism within the C2Net module enabled the refining and retaining of valuable features while discarding extraneous features. The experimental results revealed that the proposed method had superior performance compared to other mainstream detection models. The proposed method effectively used feature information from different levels to improve the accuracy and robustness of object detection. Furthermore, it efficiently addressed challenges such as occlusion, changes in target scale, and lighting variations. This study has a promising impact on practical applications such as autonomous driving, video surveillance, and intelligent assistance. However, the proposed method is faced with challenges due to the common problem of deep learning: the vulnerability to malicious attacks. Future optimization works will focus on enhancing the robustness of the detection network and strengthening its ability to resist malicious adversarial attacks, thereby improving application security. Some possible optimization directions include adversarial attack training, robustness enhancement technology, detection of abnormal input, data enhancement, and preprocessing.
Acknowledgement: We would like to express our sincere appreciation to the National Key R&D Program of China and the Beijing Natural Science Foundation for providing the necessary financial support to conduct this research project.
Funding Statement: This research was funded by the National Key R&D Program of China, Grant Number 2017YFB0802803, Beijing Natural Science Foundation, Grant Number 4202002.
Author Contributions: Study conception and design: Xiujuan Wang, Yiqi Tian; data collection: Kangfeng Zheng, Chutong Liu; analysis and interpretation of results: Xiujuan Wang, Yiqi Tian; draft manuscript preparation: Yiqi Tian. All authors reviewed the results and approved the final version of the manuscript.
Availability of Data and Materials: The data that support the findings of this study are openly available.
Conflicts of Interest: The authors declare that they have no conflicts of interest to report regarding the present study.
References
1. S. H. Gao, M. M. Cheng, K. Zhao, X. Y. Zhang, M. H. Yang et al., “Res2Net: A new multi-scale backbone architecture,” IEEE Transactions on Pattern Analysis and Machine Intelligence, vol. 43, no. 2, pp. 652–662, 2021. [Google Scholar] [PubMed]
2. M. Gao, C. Chen, J. Shi, C. S. Lai, Y. Yang et al., “A multiscale recognition method for the optimization of traffic signs using GMM and category quality focal loss,” Sensors, vol. 20, no. 17, pp. 4850–4850, 2020. [Google Scholar] [PubMed]
3. H. Li, F. Sun, L. Liu and L. Wang, “A novel traffic sign detection method via color segmentation and robust shape matching,” Neurocomputing, vol. 169, no. 2, pp. 77–88, 2015. [Google Scholar]
4. S. Maldonado-Bascón, S. Lafuente-Arroyo, P. Gil-Jiménez, H. Gómez-Moreno and F. López-Ferreras, “Road-sign detection and recognition based on support vector machines,” IEEE Transactions on Intelligent Transportation Systems, vol. 8, no. 2, pp. 264–278, 2007. [Google Scholar]
5. R. Girshick, J. Donahue, T. Darrell and J. Malik, “Rich feature hierarchies for accurate object detection and semantic segmentation,” in Proc. of IEEE Conf. on Computer Vision and Pattern Recognition (CVPR), Columbus, OH, USA, pp. 580–587, 2014. [Google Scholar]
6. R. Girshick, “Fast R-CNN,” in Proc. of IEEE Int. Conf. on Computer Vision (ICCV), Santiago, Chile, pp. 1440–1448, 2015. [Google Scholar]
7. S. Ren, K. He, R. Girshick and J. Sun, “Faster R-CNN: Towards real-time object detection with region proposal networks,” IEEE Transactions on Pattern Analysis and Machine Intelligence, vol. 39, no. 6, pp. 1137–1149, 2017. [Google Scholar] [PubMed]
8. T. Y. Lin, P. Dollár, R. Girshick, K. M. He, B. Hariharan et al., “Feature pyramid networks for object detection,” in Proc. of IEEE Conf. on Computer Vision and Pattern Recognitio (CVPR), Honolulu, HI, USA, pp. 936–944, 2017. [Google Scholar]
9. S. Liu, L. Qi, H. F. Qin, J. P. Shi and J. Y. Jia, “Path aggregation network for instance segmentation,” in Proc. of IEEE Conf. on Computer Vision and Pattern Recognitio (CVPR), Salt Lake City, USA, pp. 8759–8768, 2018. [Google Scholar]
10. Z. W. Cai and N. Vasconcelos, “Cascade R-CNN: Delving into high quality object detection,” in Proc. of IEEE Conf. on Computer Vision and Pattern Recognitio (CVPR), Salt Lake City, USA, pp. 6154–6162, 2018. [Google Scholar]
11. C. Han, G. Y. Gao and Y. Zhang, “Real-time small traffic sign detection with revised Faster-RCNN,” Multimedia Tools and Applications, vol. 78, no. 10, pp. 13263–13278, 2018. [Google Scholar]
12. J. Redmon, S. Divvala, R. Girshick and A. Farhadi, “You only look once: Unified, real-time object detection,” in Proc. of IEEE Conf. on Computer Vision and Pattern Recognitio (CVPR), Las Vegas, NV, USA, pp. 779–788, 2016. [Google Scholar]
13. W. Liu, D. Anguelov, D. Erhan, C. Szegedy, S. Reed et al., “SSD: Single shot multiBox detector,” in Proc. of Computer Vision-ECCV 2016, Amsterdam, Netherlands, pp. 21–37, 2016. [Google Scholar]
14. J. Redmon and A. Farhadi, “YOLOv3: An incremental improvement,” in Proc. of IEEE Conf. on Computer Vision and Pattern Recognitio (CVPR), Salt Lake City, USA, 2018. [Google Scholar]
15. L. You, Y. Ke, H. P. Wang, W. H. You, B. Wu et al., “Small traffic sign detection and recognition in high-resolution images,” in Proc. of Int. Conf. on Cognitive Computing, Sichuan, China, pp. 37–53, 2019. [Google Scholar]
16. S. Kong, J. Park, S. Lee and S. Jang, “Lightweight traffic sign recognition algorithm based on cascaded CNN,” in Proc. of Int. Conf. on Control, Automation and Systems (ICCAS), Jeju, Korea (Southpp. 506–509, 2019. [Google Scholar]
17. H. X. Li, Z. Lin, X. H. Shen, J. Brandt and G. Hua, “A convolutional neural network cascade for face detection,” in Proc. of IEEE Conf. on Computer Vision and Pattern Recognitio (CVPR), Boston, MA, USA, pp. 1063–6919, 2015. [Google Scholar]
18. J. Redmon and A. Farhadi, “YOLO9000: Better, faster, stronger,” in Proc. of IEEE Conf. on Computer Vision and Pattern Recognitio (CVPR), Honolulu, HI, USA, pp. 6517–6525, 2017. [Google Scholar]
19. S. H. Yen, C. Y. Shu and H. H. Hsu, “Occluded traffic signs recognition,” in Proc. of Future of Information and Communication Conf., San Francisco, California, USA, pp. 794–804, 2020. [Google Scholar]
20. I. Siniosoglou, P. Sarigiannidis, Y. Spyridis, A. Khadka, G. Efstathopoulos et al., “Synthetic traffic signs dataset for trafficsign detection & recognition in distributedsmart systems,” in Proc. of Int. Conf. on Distributed Computing in Sensor Systems (DCOSS), Pafos, Cyprus, pp. 102692, 2021. [Google Scholar]
21. F. Franzen, C. Yuan and Z. Li, “Impact of frequency-domain data representation on recognition performance of neural networks,” Developments of Artificial Intelligence Technologies in Computation and Robotics, vol. 12, no. 12015, pp. 1188–1195, 2020. [Google Scholar]
22. G. Jocher, A. Stoken, J. Borovec, A. Chaurasia, C. Liu et al., Ultralytics/yolov5: v5.0-YOLOv5-P6 1280 models, AWS, Supervise.ly and YouTube integrations, Zenodo, 2021. [Online]. Available: https://api.semanticscholar.org/CorpusID:244964519 [Google Scholar]
23. P. Nagrath, R. Jain, A. Madan, R. Arora, P. Kataria et al., “SSDMNV2: A real time DNN-based face mask detection system using single shot multibox detector and MobileNetV2,” Sustainable Cities and Society, vol. 66, no. 5, pp. 102692, 2021. [Google Scholar] [PubMed]
24. S. Pooja and S. Preeti, “Face mask detection using AI,” in Predictive and Preventive Measures for COVID-19 Pandemic, vol. 1, Singapore: Springer, pp. 293–305, 2021. [Google Scholar]
25. D. Jiang, G. Li, Y. Sun, J. Hu, J. Yun et al., “Manipulator grabbing position detection with information fusion of color image and depth image using deep learning,” Journal of Ambient Intelligence and Humanized Computing, vol. 12, no. 12, pp. 10809–10822, 2021. [Google Scholar]
26. Y. Liu, G. Shi, Y. Li and Z. Zhao, “M-YOLO: Traffic sign detection algorithm applicable to complex scenarios,” Symmetry, vol. 14, no. 5, pp. 952, 2022. [Google Scholar]
27. M. Loey, G. Manogaran, M. H. N. Taha and N. E. M. Khalifa, “A hybrid deep transfer learning model with machine learning methods for face mask detection in the era of the COVID-19 pandemic,” Measurement, vol. 167, no. 1, pp. 108288, 2021. [Google Scholar] [PubMed]
28. J. Yun, D. Jiang, Y. Sun, L. Huang, B. Tao et al., “Grasping pose detection for loose stacked object based on convolutional neural network with multiple self-powered sensors information,” IEEE Sensors Journal, vol. 23, no. 18, pp. 20619–20632, 2022. [Google Scholar]
29. Y. L. Shi, X. D. Li and M. M. Chen, “SC-YOLO: A object detection model for small traffic signs,” IEEE Access, vol. 11, no. 1, pp. 11500–11510, 2023. [Google Scholar]
30. Y. Liu, D. Jiang, C. Xu, Y. Sun, G. Jiang et al., “Deep learning based 3D target detection for indoor scenes,” Applied Intelligence, vol. 53, no. 9, pp. 10218–10231, 2022. [Google Scholar]
31. J. M. Zhang, X. Zou, L. D. Kuang, J. Wang, R. S. Sherratt et al., “CCTSDB 2021: A more comprehensive traffic sign detection benchmark,” Human-Centric Computing and Information Sciences, vol. 12, no. 23, pp. 13263–13278, 2021. [Google Scholar]
Cite This Article
 Copyright © 2023 The Author(s). Published by Tech Science Press.
This work is licensed under a Creative Commons Attribution 4.0 International License , which permits unrestricted use, distribution, and reproduction in any medium, provided the original work is properly cited.
 Downloads
 Citation Tools