
 Submit a Paper
 Propose a Special lssue
 Open Access
ARTICLE

Fine-Grained Classification of Remote Sensing Ship Images Based on Improved VAN
College of Electronic Engineering, Naval University of Engineering, Wuhan, 430033, China
* Corresponding Author: Qiao Sun. Email:
(This article belongs to the Special Issue: Optimization for Artificial Intelligence Application)
Computers, Materials & Continua 2023, 77(2), 1985-2007. https://doi.org/10.32604/cmc.2023.040902
Received 03 April 2023; Accepted 15 September 2023; Issue published 29 November 2023
 View Full Text
 Download PDF
Abstract
The remote sensing ships’ fine-grained classification technology makes it possible to identify certain ship types in remote sensing images, and it has broad application prospects in civil and military fields. However, the current model does not examine the properties of ship targets in remote sensing images with mixed multi-granularity features and a complicated backdrop. There is still an opportunity for future enhancement of the classification impact. To solve the challenges brought by the above characteristics, this paper proposes a Metaformer and Residual fusion network based on Visual Attention Network (VAN-MR) for fine-grained classification tasks. For the complex background of remote sensing images, the VAN-MR model adopts the parallel structure of large kernel attention and spatial attention to enhance the model’s feature extraction ability of interest targets and improve the classification performance of remote sensing ship targets. For the problem of multi-grained feature mixing in remote sensing images, the VAN-MR model uses a Metaformer structure and a parallel network of residual modules to extract ship features. The parallel network has different depths, considering both high-level and low-level semantic information. The model achieves better classification performance in remote sensing ship images with multi-granularity mixing. Finally, the model achieves 88.73% and 94.56% accuracy on the public fine-grained ship collection-23 (FGSC-23) and FGSCR-42 datasets, respectively, while the parameter size is only 53.47 M, the floating point operations is 9.9 G. The experimental results show that the classification effect of VAN-MR is superior to that of traditional CNNs model and visual model with Transformer structure under the same parameter quantity.Keywords
Remote sensing ship classification technology is widely used in maritime trade, military security, and other fields. The classification of remote sensing ship targets can be divided into coarse-grained classification and fine-grained classification. The coarse-grained classification takes the ship target as the fundamental category to participate in the overall classification. The coarse-grained classification focuses on the ship subclasses that fall under the same primary category, like Ford-class aircraft carriers, Arleigh Burke-class destroyers. Therefore, the fine-grained classification task requires that the model can extract more abundant and fine-grained features.
Detailed analysis of the remote sensing ship image data shows it has two typical characteristics: mixed multi-grain size features and complicated backgrounds. First, the mixed multi-grain size features are caused by the minor intra-class differences and the enormous intra-class differences. There are tiny differences in the same type of ships. Take the destroyer, for example, Arleigh Burke-class destroyers, Autumn Moon class destroyers, and others. They have remarkable similarities in hull appearance, superstructure, and weapon configuration. However, fine-grained classification requires accurate classification of specific models, which is more complicated. Second, the background in remote sensing ship images is complex. For example, port ship targets can be mixed with complex shore structures or other ships and targets, interfering with the model classification results. Therefore, more attention should be given to the complex background and mixed granularity in ship target classification tasks to achieve good generality on natural ship image data.
For the problem of complex backgrounds and diverse information granularity in ship images, this paper proposed a Metaformer [1] and Residual fusion network based on Visual Attention Network (VAN-MR) to solve these problems. Unlike Transformer [2], which uses block stacking to form a backbone network, VAN-MR proposes the structure of the network, which fused the Metaformer and residual structure shown in Fig. 1a. With the fused novel structure, VAN-MR can retain adequate underlying semantic information while acquiring high-level semantic information. Using this structure resolves the issue with multi-granularity hybrid scale classification. In addition, unlike traditional CNN networks that focus on picture information indiscriminately, VAN-MR adopts an attention structure with large kernel attention and spatial attention in parallel to enhance the model’s attention to the region of interest. The architecture enhances the model’s capacity to extract features from complicated backgrounds.

Figure 1: Metaformer and residuals structure. The backbone of the classical visual Transformer and visual Multilayer Perceptron (MLP) consists of the block shown in (b), on which the parallel residual feature extraction module (c) is designed in this paper, which together forms a new backbone for the remote sensing ship image classification (a)
The main contributions of this paper are as follows:
1. This paper analyzes two challenges faced by the fine-grained classification task of ship images: complex background and multi-granularity feature confusion. Meanwhile, the paper proposes a solution based on a new backbone network to solve the challenges traditional image classification networks face in the above feature problems.
2. For remote sensing ship targets under complex backgrounds, this paper adopts the method of large kernel attention and space attention in parallel. In order to solve the problem of multi-granularity feature confounding in remote sensing ship images, a structure of network based on the fusion of Metaformer structure and residual structure is proposed. The new structure of the network has better image understanding ability and performs well in fine-grained classification tasks of remote sensing ships.
3. Experiments have been carried out on the model proposed in this paper, which thoroughly verifies the model’s effectiveness. Compared with other methods, the framework has shown the most advanced performance on the publicly available remote sensing ship classification datasets FGSC-23 [3] and FGSCR-42 [4].
This paper is structured as follows: Section 1 presents the definition of fine-grained classification tasks for remote sensing ships and the research direction of this paper. Section 2 introduces the background and motivation of this study. Section 3 presents the technical development related to the research in this paper. Section 4 introduces the overall structure of the model and details of improvements. In Section 5, experiments and analyses are presented. Ablation and comparison experiments are designed to verify the effect of the model. Section 6 discusses the content of adversarial attacks, and Section 7 summarizes the work of this paper.
There are many excellent methods in the field of remote sensing ship image classification, but there are also many problems that need to be solved. This paper hopes to provide a solution by designing a new backbone network. This section first analyzes the effectiveness threats faced by research, then introduces the application and existing problems of CNN and Transformer in ship image classification technology, and finally puts forward the research motivation of this paper.
As a threat to external validity, we note that our method is specific to the Python language and has not been tried to run in other language environments. In addition, the accuracy of labels can also affect the classification results. Although experienced experts label the data sets, errors inevitably occur. As a threat to internal validity, we note that the model may generate noise data in the data preprocessing stage. Secondly, the hardware device states that the model training depends on is fluctuating, resulting in subtle differences in the weight data generated during the training process, which affects the effect of model training. As a threat to conclusion validity, we note that this paper only selects four evaluation indicators commonly used in image classification tasks, reducing the randomness of the evaluation results.
The image classification technology based on deep learning is different from traditional methods [5,6], Contrary to traditional methods, it automatically extracts shallow and deep information using convolution operations without requiring artificial feature extraction criteria. In computer vision, the method based on CNN first achieves excellent performance beyond the traditional method. Alex-Net [7] adapted a convolutional neural network (CNN) to deep and comprehensive models in 2012. Subsequently, convolutional neural networks like VGG [8], Google-Net [9], ResNet [10], and others were proposed, gradually boosting their complexity and efficacy. Liu et al. [11] improved the inceptionV3 [12] network, and the network achieved better results in classifying obscured ship targets. Zhao et al. [13] proposed a feature balancing strategy and, at the same time, using an iterative interaction mechanism that could effectively enhance the model classification effect generation by generation. Zhang et al. [14] proposed the AMEFRN model and designed an attribute feature learning branch supervised by attribute information to enhance the model learning ability. Song et al. [15] used methods such as attention cropping and attention classification module to enhance the classification ability of the model.
Although the rapid development of CNN series models has made CNN effectively applied in the field of fine-grained classification of remote sensing ships, most CNN models are designed for natural pictures, and their effects in remote sensing image classification tasks are limited due to the complex background information in remote sensing images. In addition, in fine-grained classification tasks, traditional CNN models use large depth feature extraction networks to extract features, which is easy to lose the target spatial location information, resulting in the loss of coarse-grained features and affecting the classification effect of the model. Therefore, the above series of CNN-based methods have room for improvement in accuracy and complexity. The attention mechanism adopted in this paper can help CNN model to extract more fine-grained features and enhance model performance.
In recent years, the image classification network based on Transformer [2] structure has achieved better results than basic CNN-based methods. In 2020, Google proposed VIT [16] network and successfully applied the Transformer structure in computer vision. Swin-Transformer [17] further improves the performance of the Transformer structure in the CV field. Xu et al. [18] integrated the advantages of ResNet and VIT models through knowledge distillation (KD) to improve the performance of VIT in remote sensing image scene classification. Huang et al. [19] applied Swin to the fine-grained classification task of remote sensing ships for the first time and designed a feature extraction backbone network integrating CNN and Transformer structure. The network can effectively extract ship targets’ coarse-grained and fine-grained features and perform well in the available remote sensing ship classification dataset.
Although the classification network based on the Transformer structure has achieved a classification accuracy surpassing that of the CNN network, its structural complexity results in significant computational overhead, leading to decreased model inference speed in ship scenes. Furthermore, the existing Transformer-based methods fail to adequately capture spatial location information. Given the challenge posed by coarse and fine granularity in ship images, there is scope for enhancing the performance of Transformer-based classification networks. The adoption of a parallel residual structure in this study enables the incorporation of crucial semantic information such as spatial location, thereby improving model performance in fine-grained classification tasks involving remote sensing ship images.
Since the success of the Transformer structure in the field of computer vision [20], many scholars have explored the reasons why Transformer can be effective. Many believe the attention-based Token Mixer contributes significantly to the model’s performance [21]. Therefore, some scholars have proposed improving the attention module to enhance the model’s performance, providing many ideas for improving the attention mechanism [22,23]. However, Lee-Thorp et al. [24] found that the model could achieve similar results even when using the Fourier transform instead of a complex attention network. Further, Yu et al. [1] argued that VIT and other improved models are effective because of the use of a generic structure Metaformer. The authors proposed the PoolFormer [1] network based on a generic architecture using a simple pooling operation instead of an attention network, and experimental results showed that the new model achieved results beyond Swin. The comparison of the different classification networks is shown in Table 1.

With fewer parameters and a straightforward structure, the pure CNN network built on Metaformer architecture has the potential to outperform the Transformer network. It has been successful in several tasks in the vision field. However, it is rarely applied to the remote sensing field. We hope to apply the Metaformer structure to the fine-grained classification task of remote sensing ships and, at the same time, propose an improvement scheme to address the problems of insufficient feature extraction ability and failure to consider the multi-granularity feature mixing in the traditional network, to adapt to the fine-grained classification task of remote sensing ships.
3 Literature Review/Related Work
In the field of computer vision, many scholars have done a lot of research work, which has accelerated the development of image classification, object detection and other technologies. In these works, deep learning method and remote sensing ship image classification technology have a lot of relevance to this research.
Deep learning is a deep machine learning model. Deep learning methods bring significant progress to computer vision and machine learning. At present, deep learning has been applied in many fields. Chakravarthy et al. [25] applied the decision tree to web mining to find the web patterns that users are interested in more accurately. Arunkumar et al. [26] adopted support vector machine and other machine learning methods to improve the accuracy of emotional evaluation of medical videos. Devi et al. [27] used stacked convolutional neural network to analyze the authors of WHATSAPP accurately. Raja et al. [28] proposed a new conditional generation network C-GAN, which improved the recognition accuracy of autism spectrum disorders.
In recent years, pure CNN networks based on Metaformer architecture have achieved rapid development in computer vision. They have outperformed both traditional CNN-based networks and Transformer-based networks on public datasets. Touvron et al. proposed a ResMLP [29] model based on Metaformer architecture, which did not adopt any self-attention module, but only contained a linear layer and GeLU [30]. It has achieved competitive results on the public data set ImageNet-1k. Guo et al. proposed a VAN [31] network based on the Meta-Former architecture, using a large kernel attention mechanism LKA instead of a complex self-attentive mechanism, which significantly reduces the number of parameters of the model, and experiments show that the VAN network achieves beyond Swin in down-stream tasks such as classification and detection in vision domain. Guo et al. proposed the SegNeXt [32] network for segmentation task, which achieved good performance on ADE20K [33], Cityscapes [34], and COCO-Stuff [35] datasets by using multi-branch large kernel attention instead of self-attention networks.
3.2 Fine-Grained Ship Classification
There are two essential datasets in the fine-grained classification of remote sensing ships. The first is FGSC-23 [3], proposed by Yao et al., and the second is FGSCR-42 [4], proposed by Di et al. These publicly available fine-grained classification datasets of remote sensing ships provide data support for the research work of other scholars.
Facing the challenges of fine-grained classification, many scholars have achieved better application results by improving classification networks. Chen et al. [36] used gradient-weighted class activation feature maps, which can effectively locate regions in the pictures where ship features are concentrated. In addition, they mirrored self-calibrated convolution in the network and expanded the model horizon by collecting richer contextual information in this way. Then, to enhance the model’s capacity to extract global features, Zhang et al. [37] replaced some branches of the BCNN model based on the BCNN with the inception module and added a new activation function, AM-Softmax, to minimize inter-class differences while increasing intra class similarities. A memory network with an adaptive selection learning strategy was proposed by Xu et al. [38] after they thoroughly analyzed the fine-grained classification problem under the sample imbalance condition. This memory network can extract compelling features from the imbalanced ship dataset and improve classification performance. Chen et al. [39] proposed P2Net based on contrast learning, which uses a two-branch network and an image aggregation module to achieve good fine-grained classification performance. Li et al. [40] proposed a foreground aware Feature Pyramid Network (FPN) network for the small sample problem. They proposed two methods for computing foreground weights to effectively solve the fine-grained classification problem of ships in the small sample case.
The above model proposes solutions to the problems in remote sensing image classification tasks. In this paper, based on the above models, this paper continue exploring the fine-grained classification problem in the case of complex backgrounds and multi-granularity feature mixing and propose a new feature extraction network to solve such problems better.
In the fine-grained classification task, the model have to pay attention to the target’s minute features and overall features at the coarse-grained level. Moreover, the remote sensing ship images have mixed multi-grain size features and complex backgrounds. The traditional backbone network improves the model’s ability to extract high-level semantic information by deepening the network. However, it needs to gain the underlying semantic information, leading to poor results in the case of complex background of remote sensing images. Based on the VAN model, the paper proposes the framework design of the parallelized residual network and improved attention. The residual structure can retain the underlying semantic information of the image, and the improved attention structure can better focus on and extract fine-grained features. The overall structure of the model is shown in Fig. 2.

Figure 2: VAN-MR model architecture
The backbone network of the model is composed of two parallel feature extraction branches, namely the Metaformer branch and the residual branch. Metaformer branch learns from the classic architecture of the VAN network and is repeatedly stacked by the same blocks. The 2D convolution method is adopted in the patch embedding to downsample the feature map. The four patch embedding convolution steps are 4, 2, 2, 2, and the size of the particular map after downsampling is H/4 × W/4, H/8 × W/8, H/16 × W/16. H/32 × W/32, the subsampled feature map is input into the corresponding stage, and the blocks contained in each stage are {3, 5, 27, 3}. The output feature map size of each stage is H/4 × W/4, H/8 × W/8, H/16 × W/16, and H/32 × W/32, respectively, which is the same as the input. The residual branch adopts residual connection mode, which is composed of a convolution layer, normalization layer, and activation function. The input of the first residual structure is the output feature map of stage 1, and the input of other residual structures is obtained by adding the output feature map of the last residual structure and stage. After each residual, the size of the feature map is halved, which is consistent with the result generated by the patch embedding structure. At the end of the feature extraction network, the feature graphs generated by the two branches are added and output to the classification network to get the final result.
The Metaformer branch of the model consists of a patch embedding and a block with the same structure. Patch embedding performs a downsampling operation on the feature map and outputs it to the block. The block structure is shown in Fig. 1b, where the input features pass through two residual serial blocks. The first residual block consists of Batch Normalization (BN) layer, an attention mechanism, and the second residual block consists of a BN layer and channel MLP.
The VAN model uses the large kernel attention (LKA) instead of the self-attention module. In neural networks, a large convolution kernel will have a larger effective receptive field, which is conducive to obtaining remote global information. Still, a large convolution kernel will increase the computational load, and a small convolution kernel will help get local information, but the effective receptive field needs to be more significant. Although self-attention can capture remote dependencies, the number of parameters is vast. LKA divided large kernel convolution into deep convolution (DW-Conv), profound dilation (DW-D-Conv) convolution, and Pointwise Conv, and comprehensively considered local context information and remote relations while maintaining a small number of parameters. As a result, the VAN network is thriving in natural image classification tasks. However, since remote sensing ship images have characteristics such as complex backgrounds (described in Section 2.2). Therefore, the attention module needs to locate the target of interest more accurately in the feature space for the classification model to accomplish the fine-grained classification task of remote sensing ships.
Inspired by the attention network of the Convolutional Block Attention Module (CBAM) [41], the model added a parallel spatial attention module to the LKA attention network to further enhance the feature extraction capability of the attention network. The overall structure of the attention network is shown in Fig. 3a.
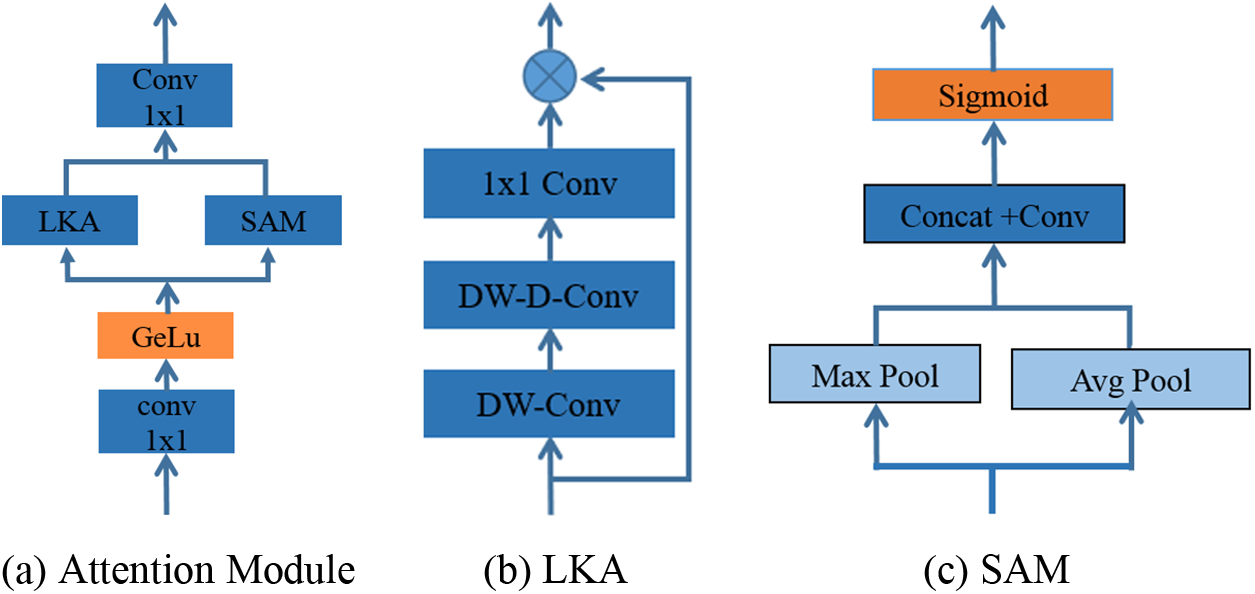
Figure 3: Attention structure
The structure of the large kernel attention is shown in Fig. 3b. A large kernel convolution can be divided into three components: a spatial local convolution (depth-wise convolution), a spatial long-range convolution (depth-wise dilation convolution), and a channel convolution (1 × 1 convolution), as shown in Eq. (1):
where x represents the input feature graph,
In the SAM part, the feature maps are respectively subjected to maximum pooling and average pooling, then the two feature maps are fused, and finally, the spatial attention features are obtained through convolution operation. The expression is shown in Eq. (2):
where x represents the input feature graph,
The following pseudocode visually demonstrates the workflow of the attention module.
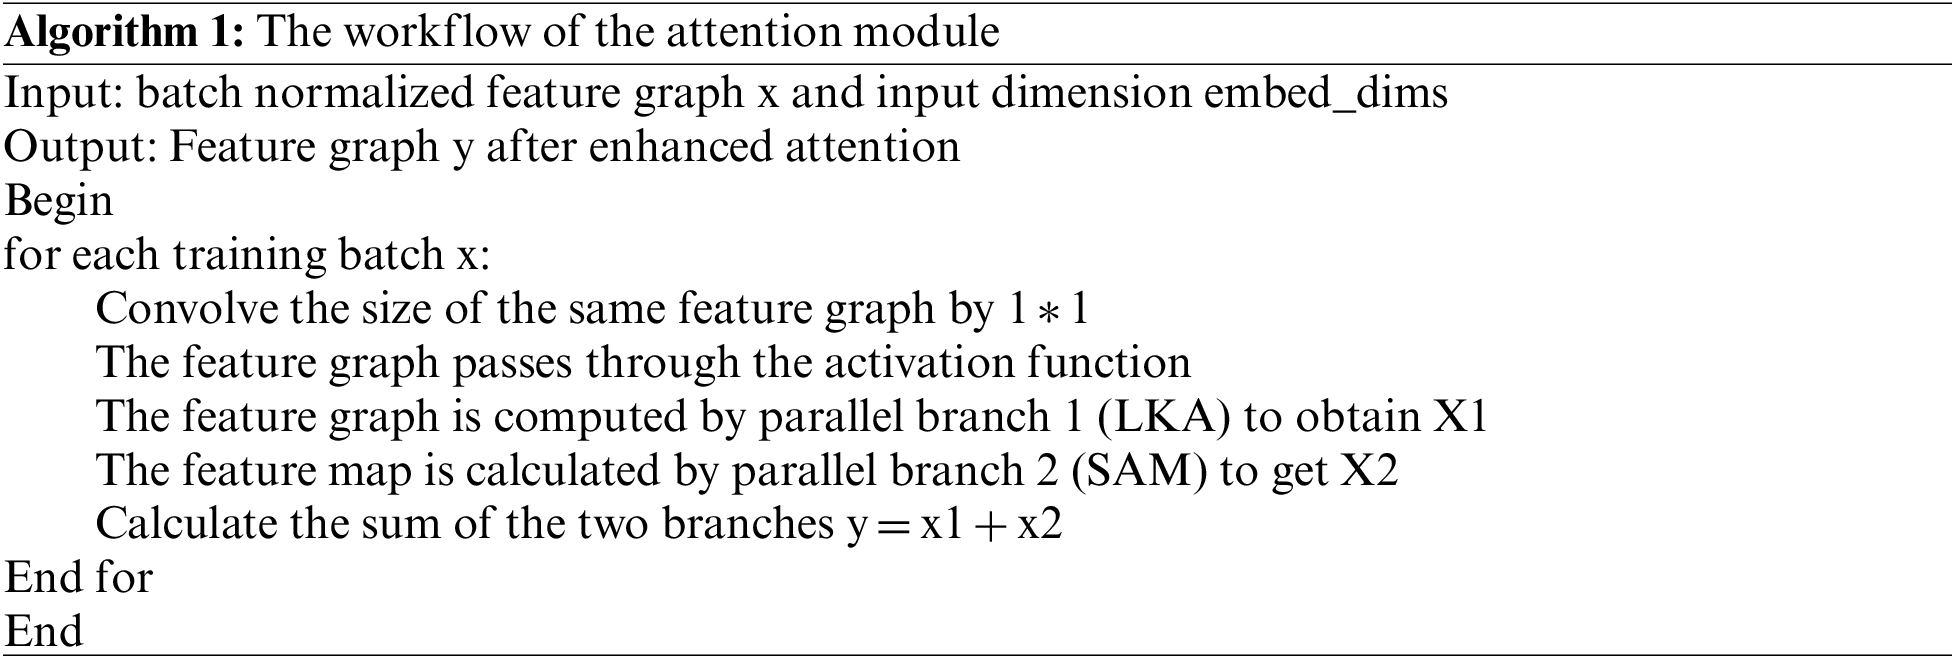
In the pseudo-code above, embed_dims is the input dimension, which in the Metaformer structure is the same as the output dimension, so the output dimension is also represented as embed_dims. As can be seen from the pseudo-code, the input feature graph passes through two attention networks, respectively, and finally, the output feature graph is fused to achieve the parallel attention mechanism.
In the fine-grained classification task of remote sensing ship images, the classification model will be interfered with by the mixed information of multi-grained information, resulting in poor classification performance. The classification model needs to focus on both coarse-grained features and fine-grained features of the target, which is the key to accomplishing the fine-grained classification task of remote sensing ships. Therefore, paper proposed a residual structure in parallel with Metaformer. The structure has the ability to extract high-level semantic information, and at the same time, it retains sufficient underlying semantic information for the model. Therefore, it helps the model to achieve complementary underlying and deep semantic information and enhances the image understanding capability of the model.
The residual branch consists of 3 residual modules in series. The internal structure of the three residual modules is the same. Each residual network receives the fusion feature map generated by the previous residual network and the previous stage as input. In the residual module, the feature map first passes through a 2 × 2 convolution layer, which downsamples the feature map to 1/2 of its original size, maintaining the same feature map size as the sibling stage, and this operation ensures that the feature maps can be fused in subsequent operations. The featured graph after subsampling will pass through a residual connection, and the connection structure is shown in Fig. 1c. The residual connection is composed of three BN layers and two 3 × 3 convolution layers alternately. Among them, the step size of the 3 × 3 convolution operation is 1, and the padding is 1. Therefore, the convolution layer will not change the size of the feature graph. Compared with a large number of block structures and convolution operations in the stage part, two 3 × 3 convolution structures are adopted for residual connection, which avoids the destruction of underlying semantic information based on ensuring the model’s effective extraction of target features. The BN layer can speed up model training and convergence without increasing the number of parameters and excessive memory usage. The operation process of the residual error module can be expressed by the formula as follows:
where
The following pseudocode visually illustrates the workflow of parallelizing residual branches.
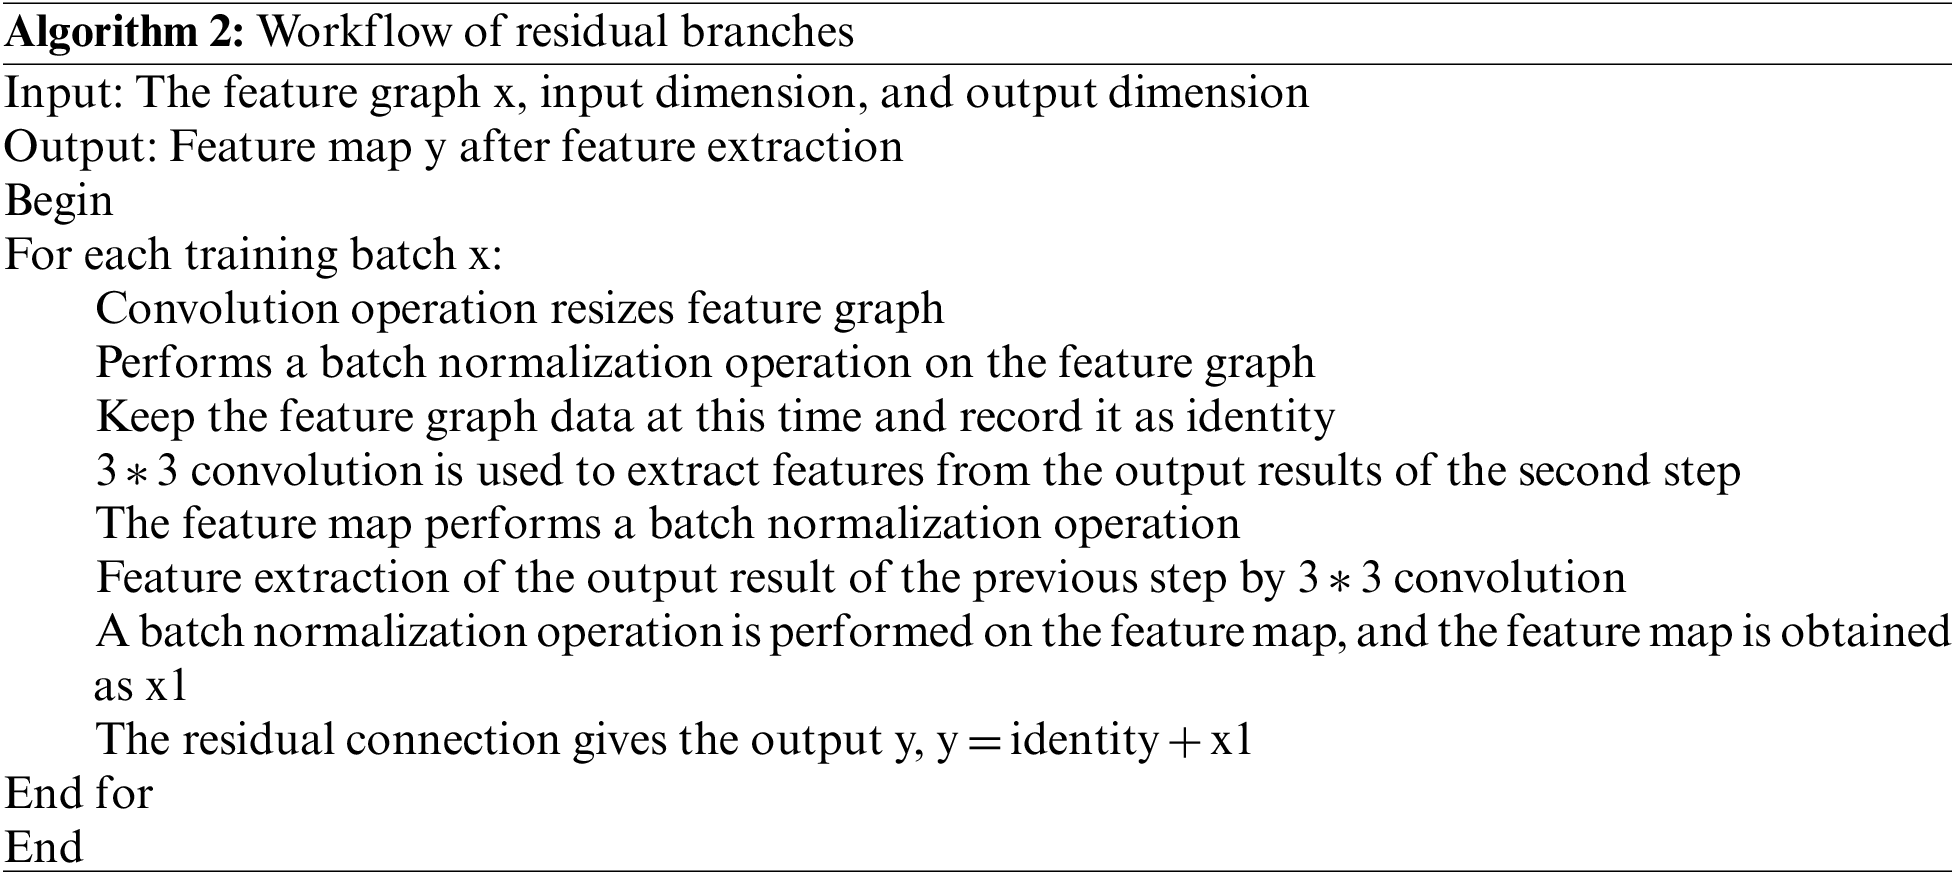
In the above pseudo-code, the input dimension differs from the output dimension, and the dimension adjustment is realized through the convolution operation before the residual join. In the residual join, the size of the feature graph will not be changed. The output of the residual connection will be sent to the next stage of the network.
In this paper, the effectiveness of the method was verified in a large number of experiments, including sensitivity analysis, comparison test and ablation experiment, and the experimental results were analyzed.
To verify the model’s validity in fine-grained tasks of remote sensing ships, paper conducted experiments on typical publicly available fine-grained classification datasets of remote sensing ships, namely FGSC-23 and FGSCR-42.
FGSC-23 is a high-resolution remote sensing ship image dataset derived from publicly available remote sensing images of Google Earth and GF-2 satellite surface scenes, containing 23 categories of more than 4,000 ship targets. Compared with other ship datasets, FGSC-23 is characterized by various targets, diverse backgrounds, and high precision compared with other ship datasets.
FGSCR-42 consists of 9,320 remote sensing images with different spatial resolutions, including 42 models from 10 major ship categories. The image size ranges from 50 × 50 to 1500 × 1500 pixels. Fig. 4 shows some pictures of the FGSC-23 dataset, and Fig. 5 shows some of the FGSCR-42 dataset.
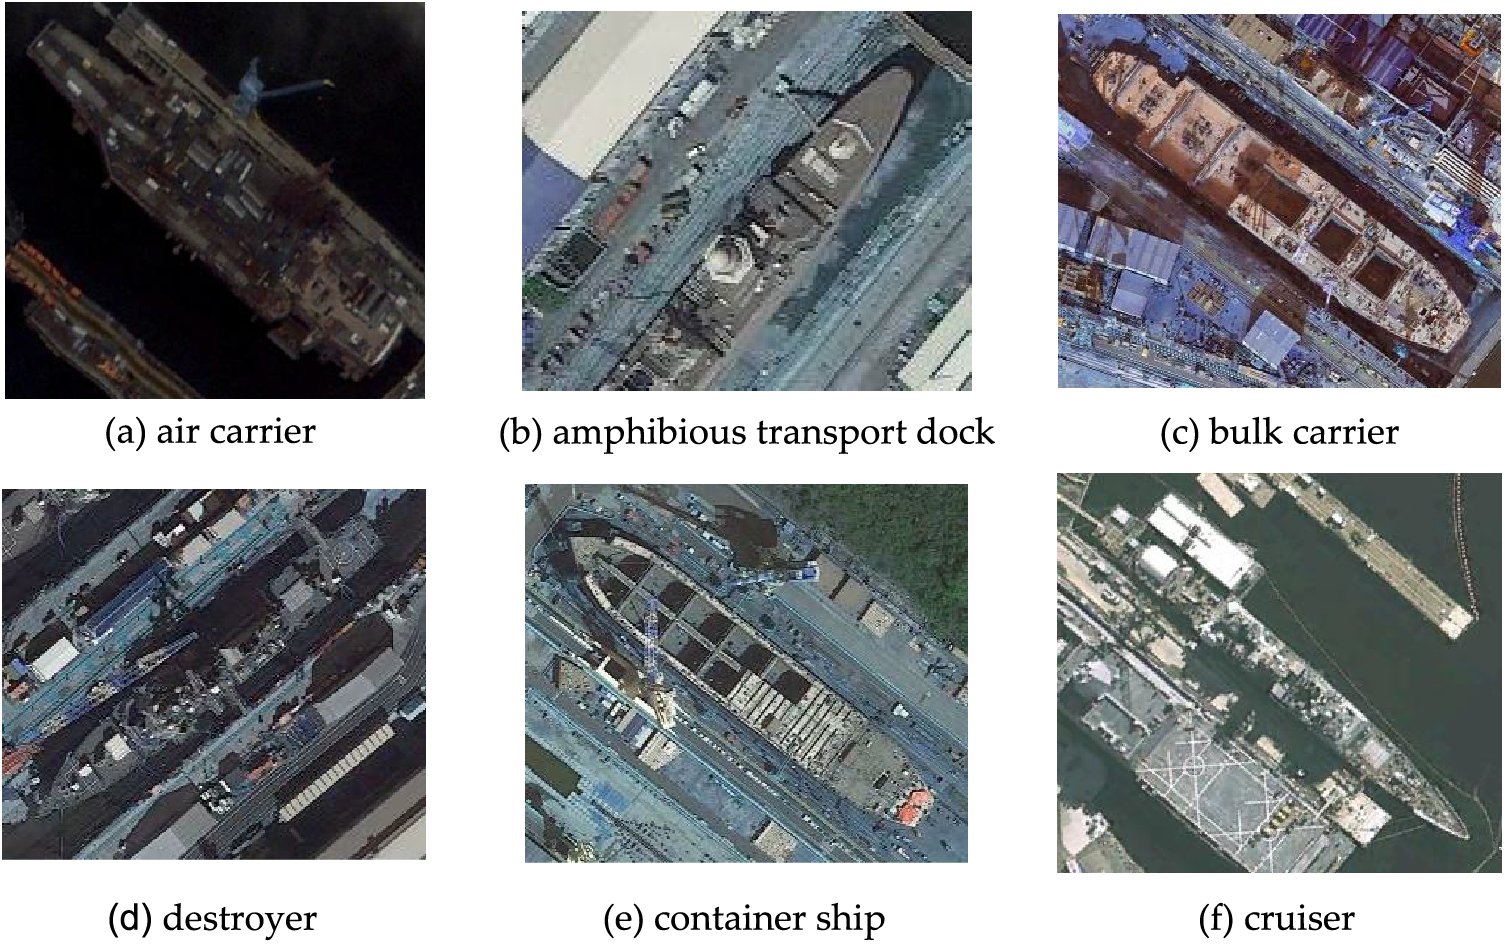
Figure 4: Image of FGSC-23 dataset
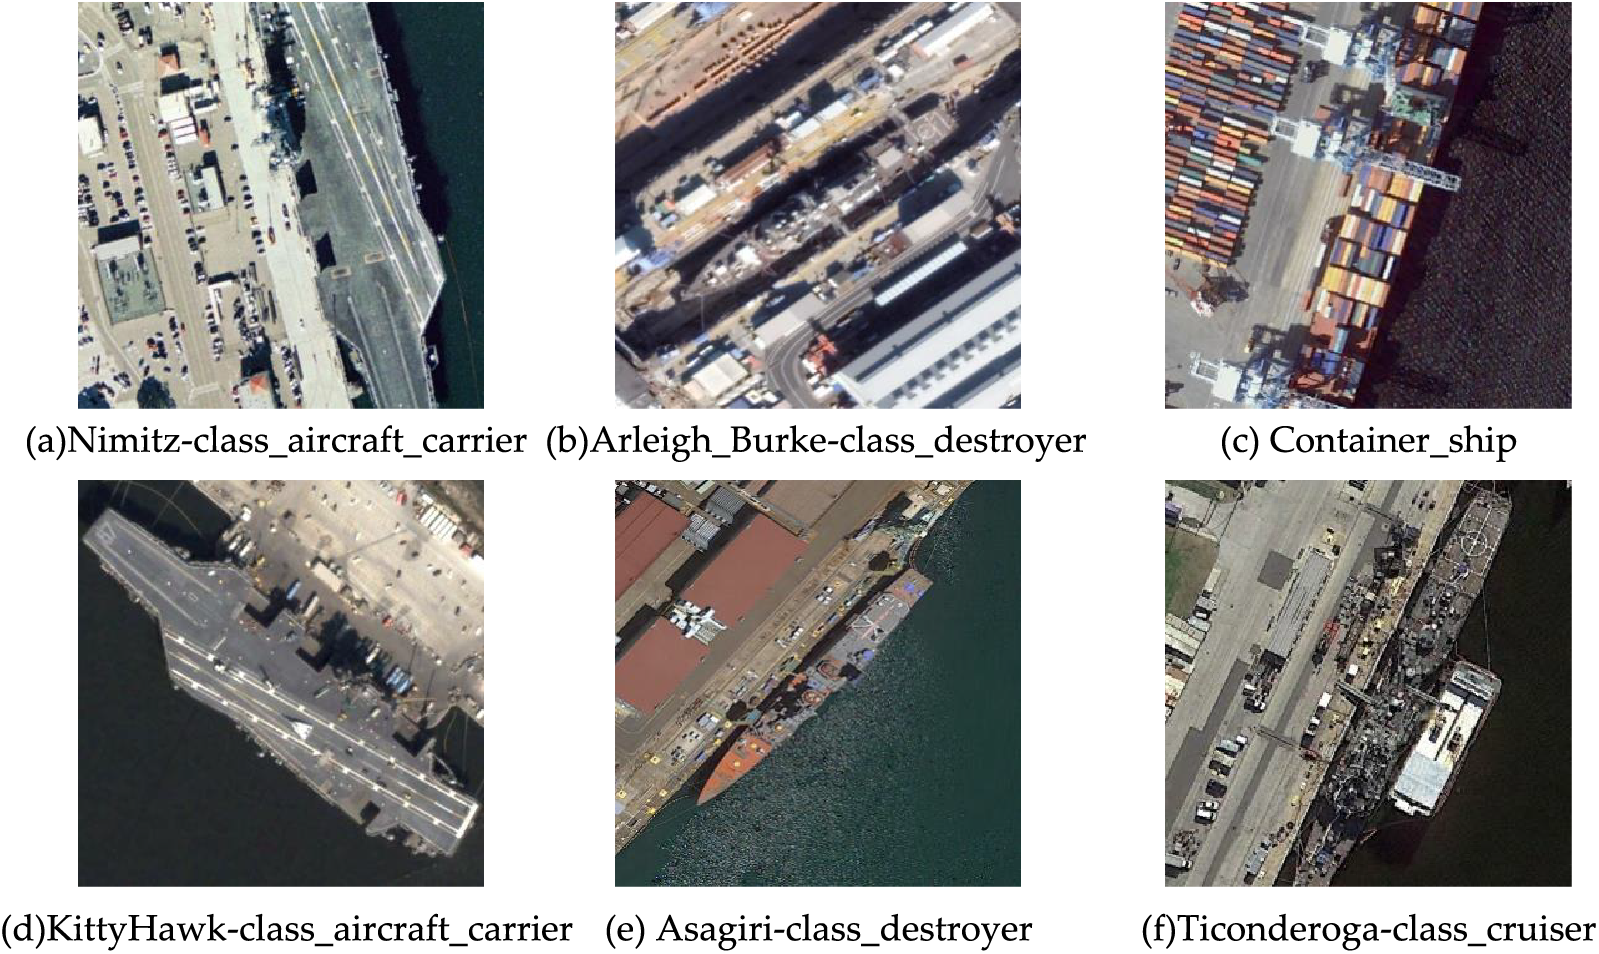
Figure 5: Image of FGSCR-42 dataset
As shown in Figs. 4a, 4c, and 4f, there are significant differences in the appearance of different types of ships, such as aircraft carriers, cargo ships, and cruisers. The classification model can complete the task according to the global coarse-grained features. However, some different types of ships will also show similar shapes from a specific perspective, as shown in Figs. 4b, 4d, and 4f. In addition, different subclasses belonging to the same ship class have very similar shape features and superstructures. As shown in Figs. 5a and 5d belong to the same aircraft carrier but belong to different subcategories. They have similar appearance and superstructure. In the case of mixed multi-granularity features, the model must pay attention to coarse and fine-grained features to complete the fine-grained classification task. Observing Figs. 4 and 5, we can also find that remote sensing ship targets usually contain complex background information. As shown in Figs. 4b, 4c, and 4e, the background of the ship image in the dock contains a variety of objects. In Fig. 4f, Figs. 5c, and 5f, the background of the port ship image contains many shore targets. In remote sensing ship images with a complex background, the classification model must accurately locate the target of interest.
The experiment was completed using a 64-bit computer with an NVIDIA-2080 GPU equipped with the Ubuntu20.04 system. In this paper, all the experiments adopted the MMClassification framework, and the model training lasted 100 rounds. batch_size is 8, and the data enhancement methods are BatchMixup, BatchCutMix, RandomResizedCrop, and RandomFlip.
In this study, top-1 accuracy, top-5 accuracy, Precision, Recall, and F1-score were used as evaluation values to measure the model’s performance in the data set. Top-1 accuracy refers to the ratio of the number of correct labels included in the first classification probability of all test pictures to the number of total test pictures; top-5 accuracy refers to the ratio of the number of correct labels included in the first five classification probabilities of all test pictures to the number of total test pictures. The calculation formula of the evaluation index is as follows:
In the above formula, TP represents the number of real targets marked as positive samples by the classification model, FP represents the number of false targets marked as positive samples by the classification model, and FN represents the number of real targets marked as negative samples by the classification model.
In order to verify the validity of the model in the fine-grained classification task of remote sensing ships, the paper designed a comparison experiment and an ablation experiment, all of which adopted the same parameter setting and data enhancement methods. In the comparison experiment, We used the pre-improved classification network VAN as the baseline, the classical CNN classification model and Swin-Transformer are selected as comparison models. In the ablation experiment, the paper respectively verify the effectiveness of the improved attention module and parallel residual structure. By comparison of classification accuracy and class activation maps, the effectiveness of the proposed model in the fine-grained classification task of remote sensing ships is demonstrated.
The variation curves of top-1 and top-5 accuracy during model training in this paper are shown in Fig. 6. As seen from the figure, the accuracy increased rapidly in the early stage of training. After training rounds, top-5 accuracy reached the maximum value near 98% and then changed steadily. After 40 rounds of training, top-1 accuracy reached the maximum value near 88%. The final top-1 accuracy reached 88.73%.
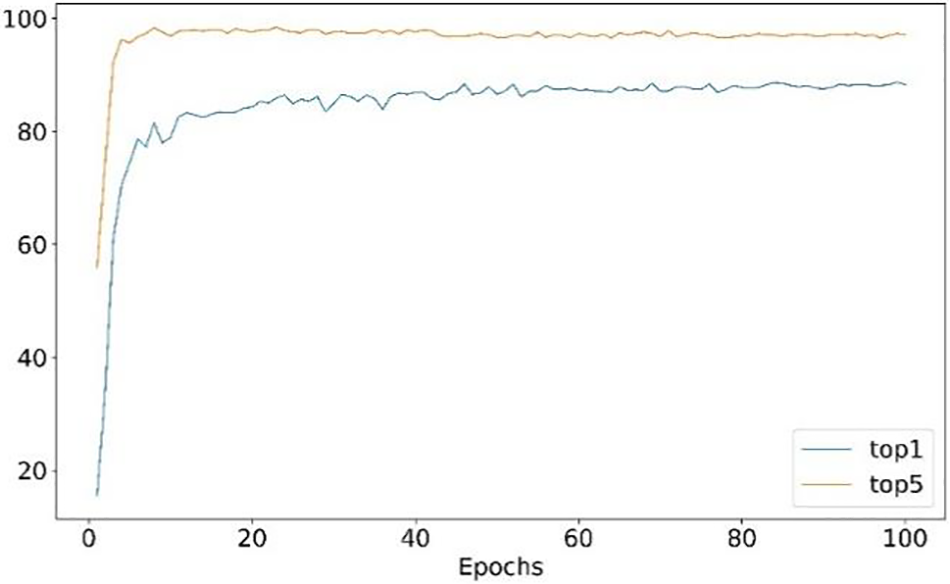
Figure 6: Variation curves of top-1 and top-5 accuracy
The model can perform better classification tasks in this experiment by adjusting batch size, iteration number, and learning rate attenuation strategy. The experimental results of parameter sensitivity with 50 epochs are shown in Table 2, and the evaluation standard is top-1 accuracy (%).

The experimental results of parameter sensitivity with 100 epochs are shown in Table 3.

By comparing the data in Tables 2 and 3, it can be seen that the model has achieved better classification performance in 50 rounds of training, which can also be seen from the trend of accuracy change shown in Fig. 5. In addition, Tables 2 and 3 reflect that different batches only impact the model’s progress a little. When batches 2, 4, 8, and 16 are selected, respectively, the difference in accuracy brought by them is no more than 1.27%, and the best training batch is 8. In addition, different learning rate attenuation strategies significantly impact the model’s training effect. In this experiment, four commonly used attenuation strategies are selected: CosineAnnealingLR, StepLR, LinearLR, and MultiStepLR. The cosine annealing strategy is the widely used learning rate attenuation strategy. This experiment also shows the best training effect. Under the same iteration number and batch conditions, the classification accuracy of the trained model is 0.49%–4.98% higher than that of the model using other attenuation strategies.
First, as a pure CNN model, the paper designed a comparison experiment with traditional CNN models such as the VGG, RegNet [42], and ConvNeXt [43]. Then, as an efficient classification backbone network, paper design a comparison experiment with the Swin-Transformer network. The experiment also includes a performance comparison with the latest classification backbone networks, specifically RIFormer [44], Rev-vit [45] and EVA-02 [46]. In addition, the paper shows the comparison results of the number of parameters between the VAN-MR model and the above models, which is convenient for showing the degree of resource consumption of the model. Table 4 shows the top-1 accuracy, top-5 accuracy, and parameter quantity obtained by various networks in fine-grained classification tasks.

As can be seen from Table 4, in the FGSC-23 dataset, the accuracy of the VGG network top-1 was 80%, the accuracy of ConvNeXt was 83.15%, and the classification effect of the Swin-small network exceeded that of the traditional CNN network, reaching 86.92%. The top-1 accuracy of Swin-base, more extensive structure network of the same type, is 87.21%. The accuracy of the top-1 model in this paper is 88.73%. Transformer has achieved a good effect compared to the traditional CNN network, and the ConvNeXt network, with similar structure and training skills, has also achieved high accuracy. Compared with the latest backbone network, the proposed model also maintains advantages. The classification accuracy of EVA-02 and Rev-vit is close to that of the proposed model. Still, the number of parameters and time complexity are higher. In contrast, the time complexity of RIFormer is lower, but the classification accuracy is slightly lower than that of the proposed model. In addition, we can find that compared with the benchmark model VAN, the time complexity of the model in this paper has a slight increase. Still, compared with other models, the time complexity of VAN-MR remains at a low level, and at the same time, the classification accuracy of VAN-MR is much greater than that of the benchmark model, surpassing other models. Compared with the above model, the new backbone network, which provides more comprehensive granular information to the model, achieved the best results.
Compared with other classical networks, it can be found that the top-1 accuracy of the VAN-MR network is 4.49% higher than that of VAN, but the number of parameters only increases by 6.19 M. This is because the parallel residual network provides adequate underlying semantic information, while the number of parameters increased by the simple residual structure is very limited. Compared with Swin-small, the number of VAN-MR parameters is similar, but top-1 accuracy is improved by 2.37%. Swin-base is much closer to VAN-MR in terms of accuracy, with a difference of only 1.52%, but the number of parameters in Swin-base is already much more extensive than VAN-MR. Swin-base uses a deeper network, meaning more blocks and self-attention modules. These structures bring additional parameters. However, the parallel structure of large kernel attention and spatial attention adopted by VAN-MR has only a small number of parameters. However, it provides a compelling image understanding ability, enabling VAN-MR to focus better on the target area of interest, thus improving model performance.
FGSCR-42 contains more samples than FGSC-23, so the same model will perform better on the FGSCR-42 dataset. In Table 4, we can see that VAN-MR also achieves sota effect.
Table 5 shows the performance of the proposed model and other models in Precision, Recall and F1-score. As shown in Table 5, the Precision and Recall of VAN-MR have achieved the best performance on the two data. Compared with the benchmark model VAN, VAN-MR has made significant progress. Compared with SWIN series classification networks, the proposed model also has advantages. The network that most closely matches the F1-score of VAN-MR is the swin-base, but VAN-MR has only 62% of the parameters of the swin-base. Through observation and comparison of experimental results, we can find that VAN-MR has more robust feature extraction and feature fusion capabilities, which is more suitable for fine-grained classification tasks of remote sensing ships and has achieved good performance on fine-grained classification data sets of remote sensing ships with complex background.
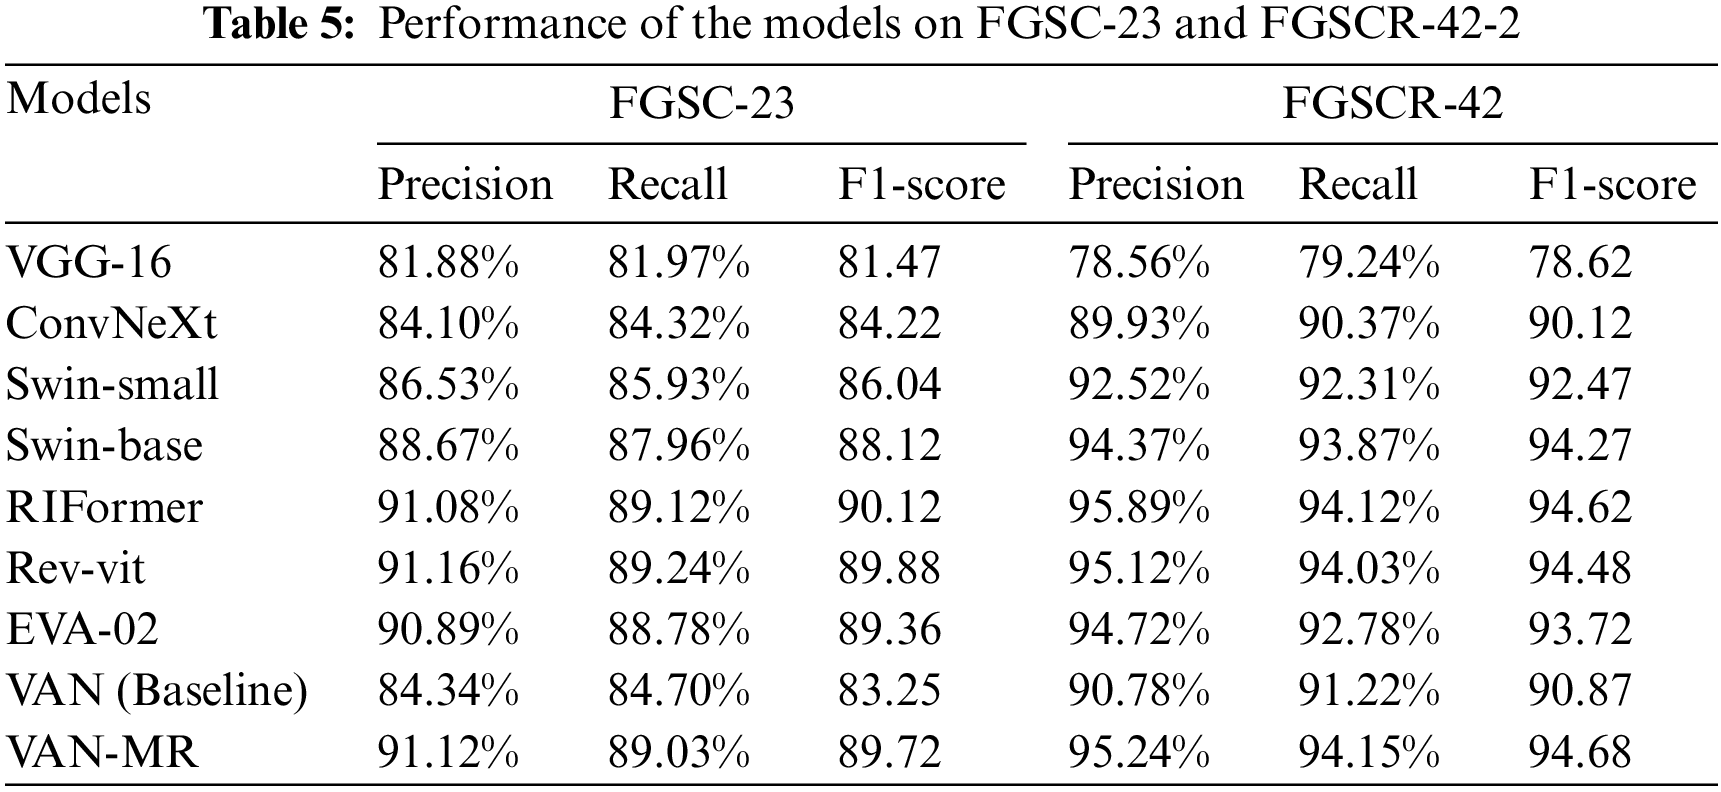
Fig. 7 shows the confusion matrix based on the classification results of the four models on the FGSC-23 dataset. The confusion matrix is mainly used for the classification performance of the visualization algorithm, where the horizontal axis is the predicted result, and the vertical axis is the natural result. The darkest regions in the confusion matrix are clustered along the diagonal, indicating successful classification. In the figure, the X-axis of the confusion matrix represents the prediction category, the Y-axis represents the actual category, and the diagonal numbers represent each category’s prediction accuracy. As can be seen from the confusion matrix, Swin and VAN networks have similar classification effects, both of which are better than VGG networks. For categories 12 and 19, Swin has a classification accuracy of 84% and 73%, respectively, while VAN has a classification accuracy of 81% and 55% for the same target. The classification accuracy of the proposed algorithm for the same target is 87% and 92%, respectively, significantly improved compared with the VAN network and exceeds Swin.
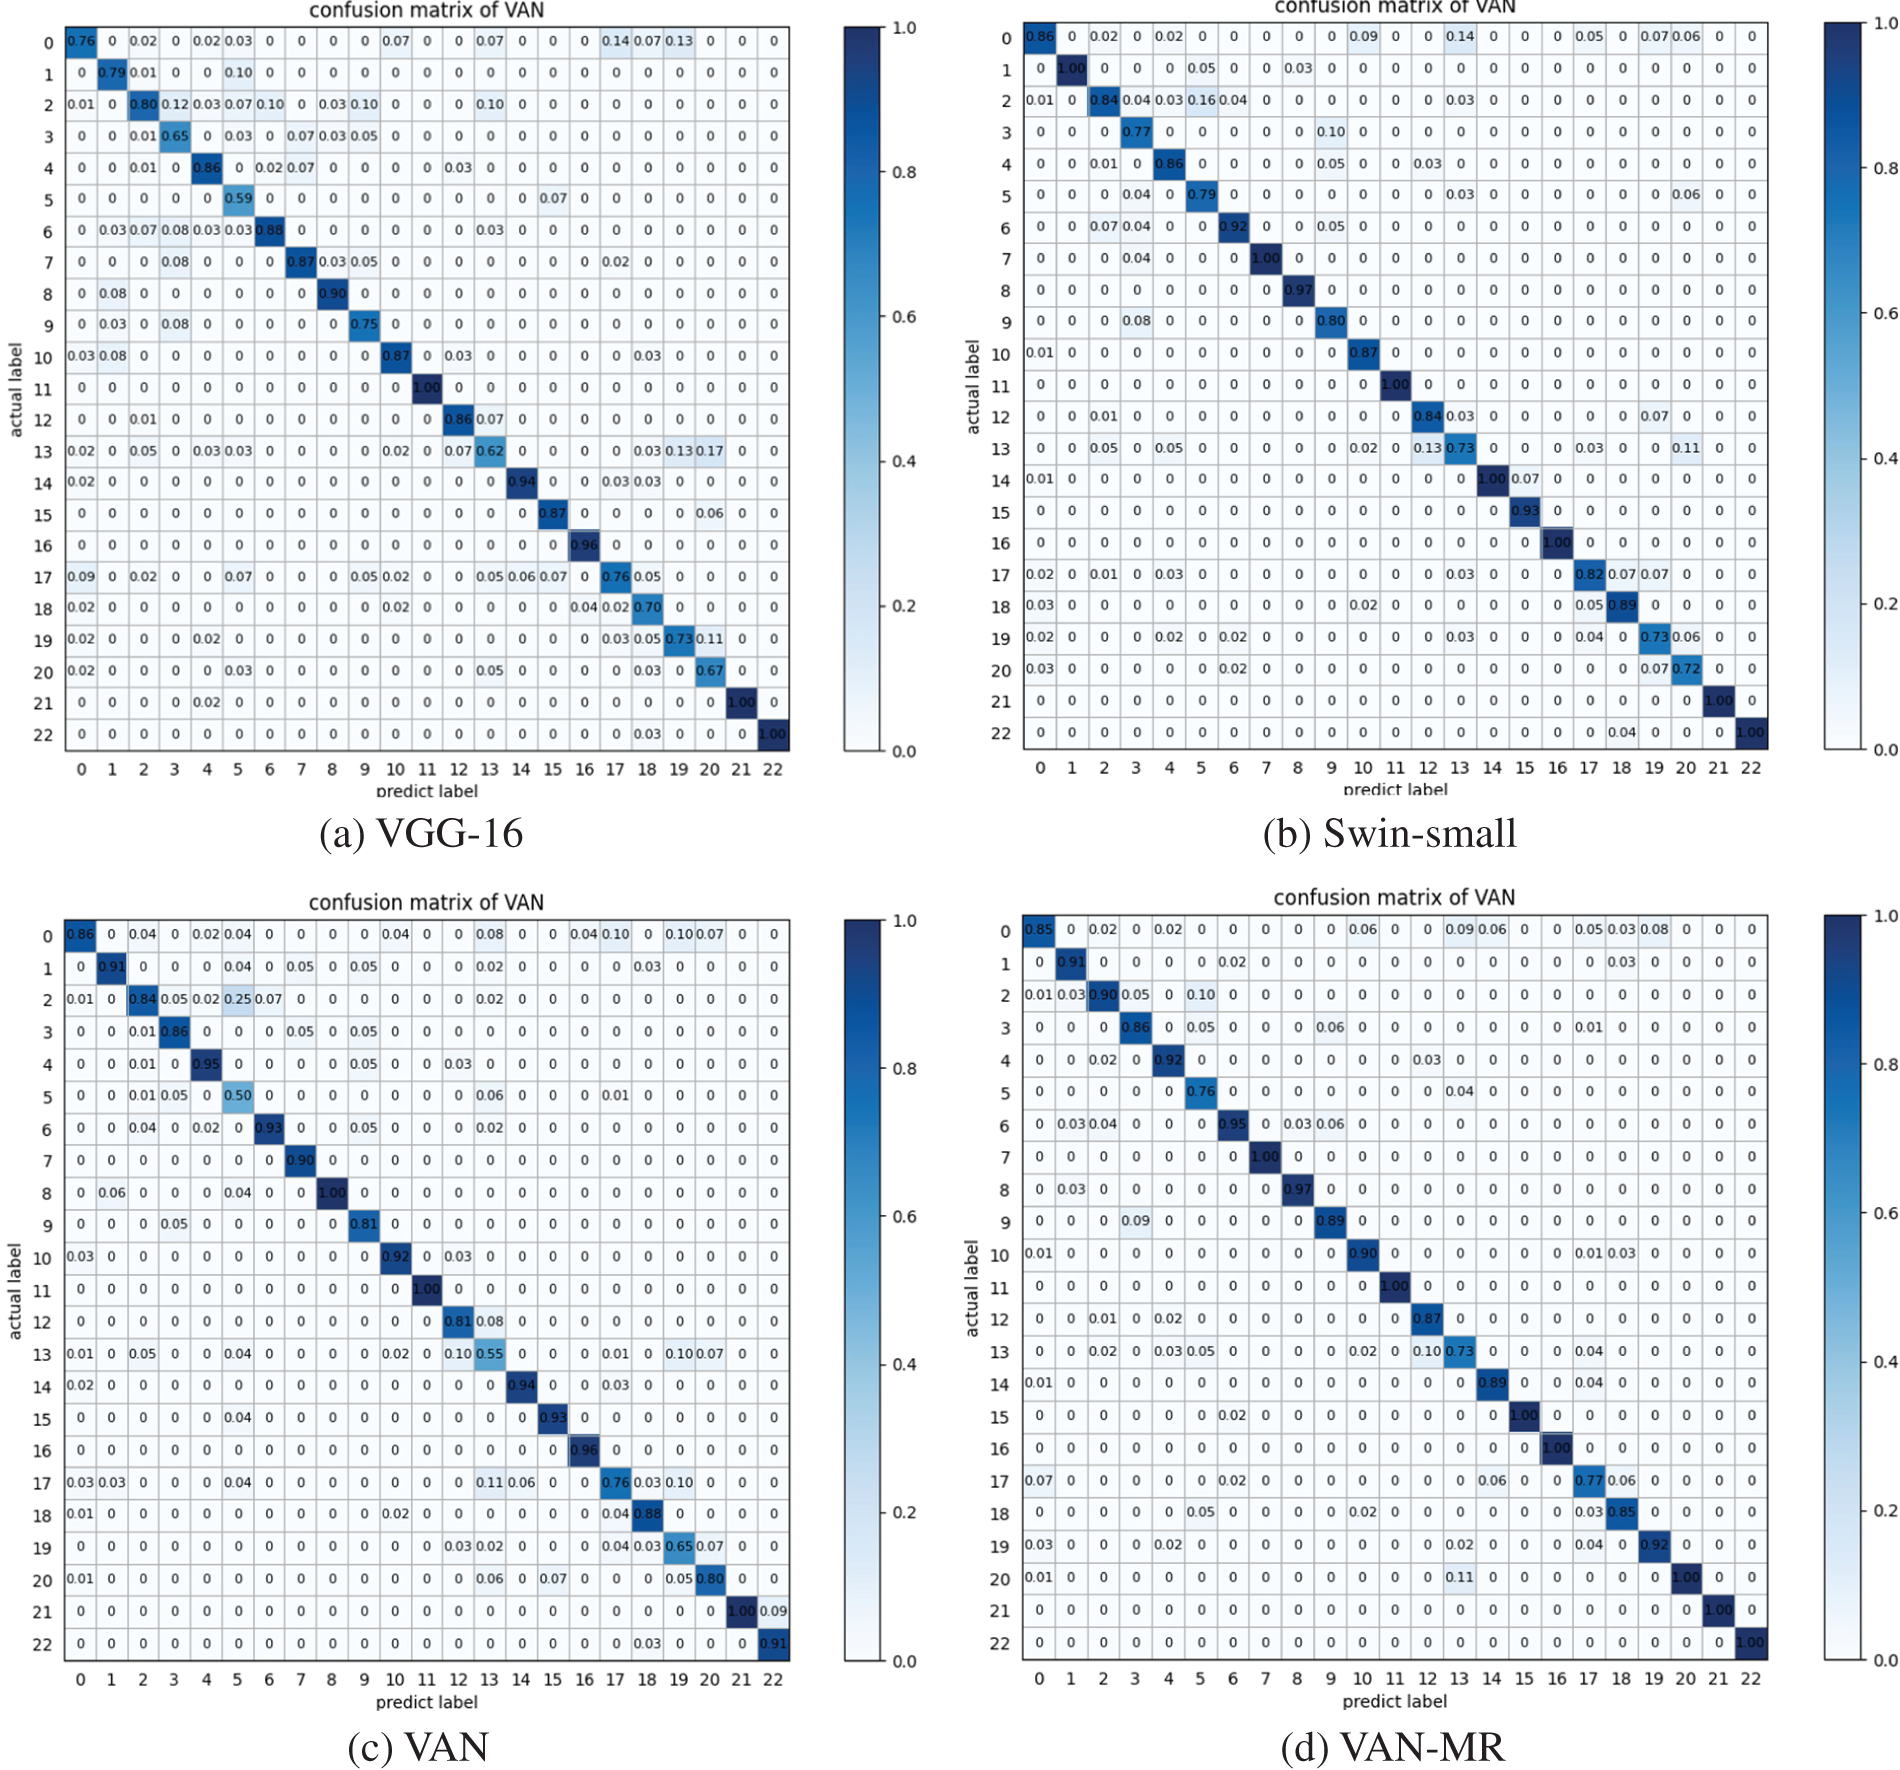
Figure 7: Confusion matrices of different models on FGSC-23 data set (a) VGG-16, (b) Swin-small, (c) VAN, (d) VAN-MR
As shown in Fig. 7d, the classification accuracy of categories 15, 20, and 22 reached 100%, significantly improving the classification effect compared with VANs. Categories 15 and 22 are car carriers and barge, respectively. They appear similar to other ships in remote sensing images, but their superstructures are very different, and the models must fully extract fine-grained features. Category 20 is a passenger ship with many shore-based targets in its background. In this case, the classification model must focus more on the passenger ship and suppress background interference. VAN-MR used the parallel spatial attention and residual method to strengthen the model’s ability to extract multi-granularity features and focus on targets of interest, which improved the classification effect. At the same time, we found that the model’s classification accuracy could have been higher for categories 5, 13, and 17, which were amphibious transport dock, auxiliary ship, and bulk carrier, respectively. The remote sensing images of the three kinds of ships mentioned above contained pictures of subclasses with very different structures belonging to the same big category (amphibious transport dock/auxiliary ship/bulk carrier). This is a problem for fine-grained classification models, which mistakenly think they belong to different categories, resulting in classification failures.
By comparing the confusion matrix of VAN and VAN-MR, it can be found that among the 23 types of targets, the detection accuracy of 13 types of targets has improved, demonstrating the excellent classification ability of the proposed model in complex background images.
In order to understand the different effects of different model structures on the final classification effect, the paper designed an ablation experiment. Table 6 shows the performance of different model structures on the FGSC-23 dataset.
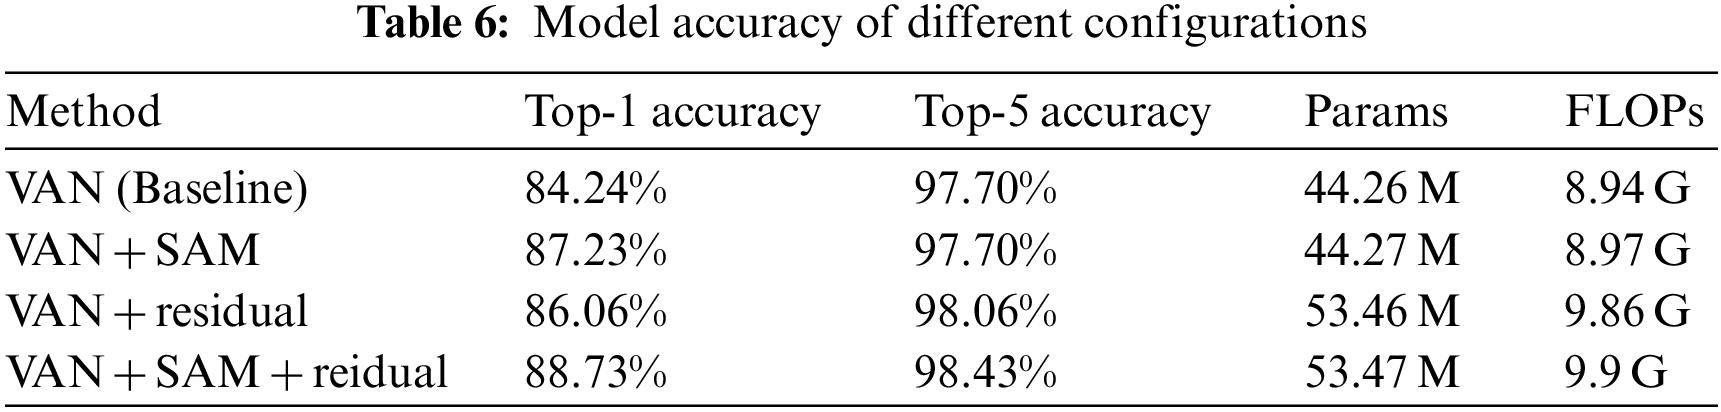
As shown in Table 6, the top-1 accuracy of the VAN network on the FGSC-23 dataset is 84.24%, and when the parallel SAM module is added alone, the top-1 accuracy is 87.23%, an increase of 2.99%. At the same time, the parameter number of the model is minimal, only 0.01 M, and the computational complexity is only slightly increased. When a residual module is added alone, the top-1 accuracy of the network is 86.06%, an increase of 1.82%. Because the residual convolutional layer is too large, about 9.21 M parameters are introduced, and the time complexity is increased by 0.92 G. When the residual module is added alone, the top-1 accuracy of the network is 86.06%, up by 1.82%. When two improvement schemes were added, the model effect reached the highest value, 88.73%. Compared with the baseline model, the classification accuracy of VAN-MR is improved by 4.49%.
In order to better understand the contribution of different model structures to model classification performance, the experiment shows the class activation maps of models with different structures in the same picture. The class activation maps are used to show which parts of the input image play a role in the classification and judgment of the model, which reflects the model’s ability to understand the image features. Generally speaking, the brightly colored part of the class activation maps is the primary source of features extracted from the network. The class activation maps are shown in Fig. 8. As can be seen from the first line in the figure, feature extraction of remote sensing ship targets by the VAN network focuses on fine-grained local features. In ship images with a complex background, the location of feature extraction needs to be more accurate, as shown in the class activation maps of the frigate. The class activation maps with the SAM attention network added are shown in the second line. SAM provides more comprehensive spatial information, and the model can pay attention to more local features but still needs to provide a broad view. The third line shows the class activation maps effect after the residual module is only added. We can see that the residual module retains sufficient underlying semantic information for the model, and the model pays attention to all target information. The target area has the deepest color but contains more background information. The class activation maps of the VAN-MR model are shown in the fourth line. VAN-MR can cover all features of the ship target. Meanwhile, due to the better image understanding ability provided by the attention network, VAN-MR can better suppress the background information. The addition of the SAM and residual modules, as indicated by the class activation maps, improved the model’s ability to extract features, reflected in the classification accuracy, as shown in the table. Therefore, VAN-MR has strong classification ability in fine-grained data sets of remote sensing ships with complex backgrounds.

Figure 8: Class activation maps of different configuration models
To check the performance changes of the comparison method under different training amounts and the performance fluctuations of the model in multiple experiments, we designed five rounds of experiments for each case, and the accuracy changes obtained in the experiments are shown in Table 7. What's more, the number of training samples and test samples of FGSC-23 is 8:2, but we split the FGSC-23 by 7:3, 6:4, 5:5, 4:6, 3:7 for training and validation. The results are as follow:
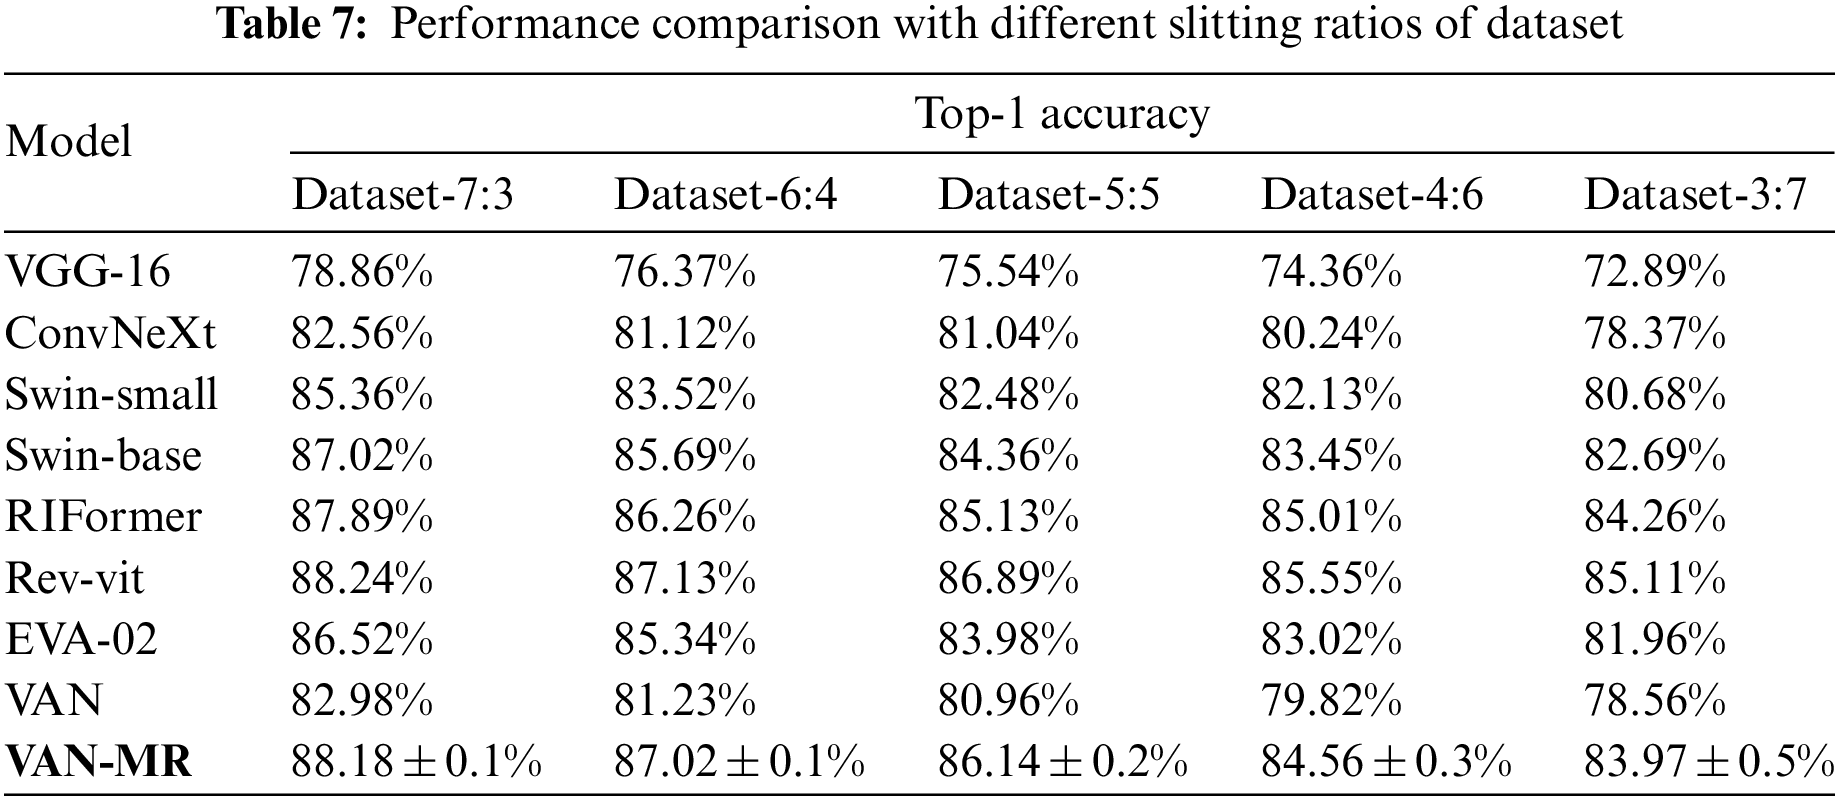
We can discover from the table that in Dataset-7:3, while we have 5 runs for our model, the variance of the results is controlled to within 0.1%. Its accuracy is still very competitive compared with other state-of-the-art models, proving that the model in this paper has high stability. In addition, we designed comparative experiments with different data segmentation ratios. As can be seen from the table, the smaller the ratio of training data to test data, the lower the classification accuracy of the model, but in each case of dataset distribution, compared with other models, the model in this paper maintains the advantage of accuracy.
This paper proposes a fine-grained classification model for remote sensing ship images. Like most image classification models, they all rely on the quality of training data sets. Accurate labeling and explicit image content are the keys to successful model training. Although most deep neural networks can extract the target features of the input images, the input-output mapping learned by the network is discontinuous, and introducing subtle perturbations in the images may lead to model classification errors. Therefore, training the model against attack and attack and defense is significant. The method in this paper has achieved specific results on the open remote sensing ship image classification data set. Still, the premise of the work is that no counterattack has been accepted. How to deal with the attack and strengthen the anti-jamming ability of the model is an essential direction of future research.
Compared with the natural image classification task, the remote sensing ship fine-grained classification task has two unique characteristics: complex background and mixed multi-grained features. The general CNN network and Transformer structure are used in vision tasks but lack the attention for these unique characteristics. Therefore, the paper proposed a classified backbone network VAN-MR based on the fusion of the Metaformer and residual structure. Specifically, the paper designed a parallel structure of a large core and spatial attention to enhance the feature extraction capability under complex backgrounds. This parallel structure can effectively suppress the interference of complex backgrounds. In addition, the model adopts a concurrent residual structure to extract high-level semantic information and low-level semantic information. This contemporary residual structure retains the mixed multi-granularity characteristics through top-down convolution operation. In general, VAN-MR achieved 88.71% and 94.56% accuracy on FGSC-23 and FGSCR-42 data sets, respectively, while retaining only 50.47 M parameters, providing a solution to the problem of complex background and mixed granularity information in remote sensing ship images.
The model in this paper has achieved specific results on the public remote sensing ship image classification data set. Still, we found that the background suppression ability of the model will be slightly decreased when only residual structure is introduced. We will explore other CNN structures to pursue better feature extraction and background suppression ability. In the next step, we will further the model’s lightweight transformation to better meet the needs of platform deployment. On the other hand, maintaining a good classification ability after introducing perturbations is also a field that will be explored further.
Acknowledgement: The authors extend their appreciation to the anonymous reviewers for their constructive comments and suggestions.
Funding Statement: The authors received no specific funding for this study.
Author Contributions: The authors confirm contribution to the paper as follows: study conception and design: Guoqing Zhou, Liang Huang; data collection: Guoqing Zhou, Qiao Sun; analysis and interpretation of results: Guoqing Zhou, Liang Huang; draft manuscript preparation: Guoqing Zhou, Qiao Sun. All authors reviewed the results and approved the final version of the manuscript.
Availability of Data and Materials: Not applicable.
Conflicts of Interest: The authors declare that they have no conflicts of interest to report regarding the present study.
References
1. W. Yu, M. Luo, P. Zhou, C. Si, Y. Zhou et al., “MetaFormer is actually what you need for vision,” in 2022 IEEE/CVF Conf. on Computer Vision and Pattern Recognition (CVPR), New Orleans, LA, USA, pp. 10809–10819, 2022. [Google Scholar]
2. A. Vaswani, N. Shazeer, N. Parmar, J. Uszkoreit, L. Jones et al., “Attention is all you need,” in Annual Conf. on Neural Information Processing Systems (NIPS), Long Beach, CA, USA, vol. 30, pp. 5998–6008, 2017. [Google Scholar]
3. L. B. Yao, X. H. Zhang, Y. F. Lv, W. W. Sun and M. Y. Li, “FGSC-23: A large-scale dataset of high-resolution optical remote sensing image for deep learning-based fine-grained ship recognition,” Journal of Image and Graphics, vol. 26, no. 10, pp. 2337–2345, 2021. [Google Scholar]
4. Y. Di, Z. Jiang and H. Zhang, “A public dataset for fine-grained ship classification in optical remote sensing images,” Remote Sensing, vol. 13, pp. 747, 2021. [Google Scholar]
5. Y. Cui, F. Zhou, J. Wang, X. Liu, Y. Lin et al., “Kernel pooling for convolutional neural networks,” in 2017 IEEE Conf. on Computer Vision and Pattern Recognition (CVPR), Honolulu, HI, USA, pp. 3049–3058, 2017. [Google Scholar]
6. B. Zvolanek, “Autonomous ship classification by moment invariants,” in Proc. of SPIE-The Int. Society for Optical Engineering, vol. 292, no. 12, pp. 241–248, 1981. [Google Scholar]
7. A. Krizhevsky, I. Sutskever and G. E. Hinton, “ImageNet classification with deep convolutional neural networks,” Communications of the ACM, vol. 60, no. 6, pp. 84–90, 2012. [Google Scholar]
8. S. Karen and A. Zisserman, “Very deep convolutional networks for large-scale image recognition,” in 3rd Int. Conf. on Learning Representations (ICLR), San Diego, CA, USA, pp. 1–14, 2015. [Google Scholar]
9. C. Szegedy, W. Liu, Y. Jia, P. Sermanet, S. E. Reed et al., “Going deeper with convolutions,” in 2015 IEEE Conf. on Computer Vision and Pattern Recognition (CVPR), Boston, MA, USA, pp. 1–9, 2015. [Google Scholar]
10. K. M. He, X. Y. Zhang, S. Q. Ren and J. Sun, “Deep residual learning for image recognition,” in 2016 IEEE Conf. on Computer Vision and Pattern Recognition (CVPR), Seattle, USA, pp. 770–778, 2015. [Google Scholar]
11. K. Liu, S. Yu and S. Liu, “An improved InceptionV3 network for obscured ship classification in remote sensing images,” IEEE Journal of Selected Topics in Applied Earth Observations and Remote Sensing, vol. 13, pp. 4738–4747, 2020. [Google Scholar]
12. C. Szegedy, V. Vanhoucke, S. Ioffe, J. Shlens and Z. Wojna, “Rethinking the inception architecture for computer vision,” in 2016 IEEE Conf. on Computer Vision and Pattern Recognition (CVPR), Las Vegas, NV, USA, pp. 2818–2826, 2016. [Google Scholar]
13. W. Zhao, T. Tong, L. Yao, Y. Liu, C. Xu et al., “Feature balance for fine-grained object classification in aerial images,” IEEE Transactions on Geoscience and Remote Sensing, vol. 60, pp. 1–13, 2022. [Google Scholar]
14. X. Zhang, Y. Lv, L. Yao, W. Xiong and C. Fu, “A new benchmark and an attribute-guided multilevel feature representation network for fine-grained ship classification in optical remote sensing images,” IEEE Journal of Selected Topics in Applied Earth Observations and Remote Sensing, vol. 13, pp. 1271–1285, 2020. [Google Scholar]
15. Y. Song, F. Song, L. Jin, T. Lei, G. Liu et al., “An attention cut classification network for fine-grained ship classification in remote sensing images,” Remote Sensing Letters, vol. 13, no. 4, pp. 418–427, 2022. [Google Scholar]
16. A. Dosovitskiy, L. Beyer, A. Kolesnikov, D. Weissenborn, X. Zhai et al., “An image is worth 16 × 16 words: TransFormers for image recognition at scale,” arXiv preprint arXiv: 2010.11929, 2020. [Google Scholar]
17. Z. Liu, Y. Lin, Y. Cao, H. Hu, Y. Wei et al., “Swin Transformer: Hierarchical vision transformer using shifted windows,” in 2021 IEEE/CVF Int. Conf. on Computer Vision (ICCV), Montreal, QC, Canada, pp. 9992–10002, 2021. [Google Scholar]
18. K. Xu, P. Deng and H. Huang, “Vision transformer: An excellent teacher for guiding small networks in remote sensing image scene classification,” IEEE Transactions on Geoscience and Remote Sensing, vol. 60, pp. 1–15, 2022. [Google Scholar]
19. L. Huang, F. Wang, Y. Zhang and Q. Xu, “Fine-grained ship classification by combining CNN and Swin transformer,” Remote Sensing, vol. 14, pp. 3087, 2022. [Google Scholar]
20. S. Zheng, J. Lu, H. Zhao, X. Zhu, Z. Luo et al., “Rethinking semantic segmentation from a Sequence-to-Sequence perspective with transformers,” in 2021 IEEE/CVF Conf. on Computer Vision and Pattern Recognition (CVPR), Nashville, TN, USA, pp. 6877–6886, 2021. [Google Scholar]
21. L. Yuan, Y. Chen, T. Wang, W. Yu, Y. Shi et al., “Tokens-to-Token ViT: Training vision transformers from scratch on imageNet,” in 2021 IEEE/CVF Int. Conf. on Computer Vision (ICCV), Montreal, Canada, pp. 538–547, 2021. [Google Scholar]
22. K. Han, A. Xiao, E. Wu, J. Guo, C. Xu et al., “Transformer in Transformer,” arXiv preprint arXiv: 2103.00112, 2021. [Google Scholar]
23. W. Wang, E. Xie, X. Li, D. Fan, K. Song et al., “Pyramid vision transformer: A versatile backbone for dense prediction without convolutions,” in 2021 IEEE/CVF Int. Conf. on Computer Vision (ICCV), Montreal, QC, Canada, pp. 548–558, 2021. [Google Scholar]
24. J. Lee-Thorp, J. Ainslie, I. Eckstein and S. Ontañón, “FNet: Mixing tokens with fourier transforms,” arXiv preprint arXiv: 2105.03824, 2021. [Google Scholar]
25. D. G. Chakravarthy and S. Kannimuthu, “Extreme gradient boost classification based interesting user patterns discovery for web service composition,” Mobile Networks and Applications, vol. 24, pp. 1883–1895, 2019. [Google Scholar]
26. P. M. Arunkumar, S. Chandramathi and S. Kannimuthu, “Sentiment analysis-based framework for assessing internet telemedicine videos,” International Journal of Data Analysis Techniques and Strategies, vol. 11, pp. 328–336, 2019. [Google Scholar]
27. V. S. Devi and S. Kannimuthu, “Author profiling in code-mixed WhatsApp messages using stacked convolution networks and contextualized embedding based text augmentation,” Neural Processing Letters, vol. 55, pp. 589–614, 2022. [Google Scholar]
28. K. Raja and S. Kannimuthu, “Conditional generative adversarial network approach for autism prediction,” Computer Systems Science and Engineering, vol. 44, no. 1, pp. 741–755, 2022. [Google Scholar]
29. H. Touvron, P. Bojanowski, M. Caron, M. Cord, A. El-Nouby et al., “ResMLP: Feedforward networks for image classification with data-efficient training,” IEEE Transactions on Pattern Analysis and Machine Intelligence, vol. 45, no. 4, pp. 5314–5321, 2023. [Google Scholar] [PubMed]
30. D. Hendrycks and K. Gimpel, “Gaussian error linear units (GELUs),” arXiv preprint arXiv: 1606.08415, 2016. [Google Scholar]
31. M. Guo, C. Lu, Z. Liu, M. Cheng and S. Hu, “Visual attention network,” arXiv preprint arXiv: 2202.09741, 2022. [Google Scholar]
32. M. Guo, C. Lu, Q. Hou, Z. Liu, M. Cheng et al., “SegNeXt: Rethinking convolutional attention design for semantic segmentation,” arXiv preprint arXiv: 2209.08575, 2022. [Google Scholar]
33. B. Zhou, H. Zhao, X. Puig, S. Fidler, A. Barriuso et al., “Scene parsing through ADE20K dataset,” in 2017 IEEE Conf. on Computer Vision and Pattern Recognition (CVPR), Honolulu, HI, USA, pp. 5122–5130, 2017. [Google Scholar]
34. M. Cordts, M. Omran, S. Ramos and T. Rehfeld, “The cityscapes dataset for semantic urban scene understanding,” in 2016 IEEE Conf. on Computer Vision and Pattern Recognition (CVPR), Las Vegas, NV, USA, pp. 3213–3223, 2016. [Google Scholar]
35. H. Caesar, J. Uijlings and V. Ferrari, “COCO-stuff: Thing and stuff classes in context,” in 2018 IEEE/CVF Conf. on Computer Vision and Pattern Recognition, Salt Lake City, UT, USA, pp. 1209–1218, 2018. [Google Scholar]
36. Y. Chen, Z. Zhang, Z. Chen, Y. Zhang and J. Wang, “Fine-grained classification of optical remote sensing ship images based on deep convolution neural network,” Remote Sensing, vol. 14, pp. 4566, 2022. [Google Scholar]
37. Z. Zhang, T. Zhang, Z. Liu, P. Zhang, S. Tu et al., “Fine-grained ship image recognition based on BCNN with inception and AM-Softmax,” Computers, Materials & Continua, vol. 73, no. 1, pp. 1527–1539, 2022. [Google Scholar]
38. Y. Xu, M. Yan, C. Xu, H. Zhang, Y. Liu et al., “Adaptive selecting and learning network and a new benchmark for imbalanced fine-grained ship classification,” IEEE Access, vol. 9, pp. 58116–58126, 2021. [Google Scholar]
39. J. Chen, K. Chen, H. Chen, W. Li, Z. Zou et al., “Contrastive learning for fine-grained ship classification in remote sensing images,” IEEE Transactions on Geoscience and Remote Sensing, vol. 60, pp. 1–16, 2022. [Google Scholar]
40. Y. Li and C. Bian, “Few-shot fine-grained ship classification with a foreground-aware feature map reconstruction network,” IEEE Transactions on Geoscience and Remote Sensing, vol. 60, pp. 1–12, 2022. [Google Scholar]
41. S. Woo, J. Park, J. Lee and I. Kweon, “CBAM: Convolutional block attention module,” European Conference on Computer Vision, vol. 11211, pp. 3–19, 2018. [Google Scholar]
42. I. Radosavovic, R. P. Kosaraju, R. Girshick, K. He and P. Dollár, “Designing network design spaces,” in 2020 IEEE/CVF Conf. on Computer Vision and Pattern Recognition (CVPR), Seattle, WA, USA, pp. 10425–10433, 2020. [Google Scholar]
43. Z. Liu, H. Mao, C. Y. Wu, C. Feichtenhofer, T. Darrell et al., “A ConvNet for the 2020s,” in 2022 IEEE/CVF Conf. on Computer Vision and Pattern Recognition (CVPR), New Orleans, LA, USA, pp. 11966–11976, 2022. [Google Scholar]
44. J. Wang, S. Zhang, Y. Liu, T. Wu, Y. Yang et al., “RIFormer: Keep your vision backbone effective but removing token Mmixer,” in 2023 IEEE/CVF Conf. on Computer Vision and Pattern Recognition (CVPR), Vancouver, BC, Canada, pp. 14443–14452, 2023. [Google Scholar]
45. K. Mangalam, H. Fan, Y. Li, C. Wu, B. Xiong et al., “Reversible vision transformers,” in 2022 IEEE/CVF Conf. on Computer Vision and Pattern Recognition (CVPR), New Orleans, LA, USA, pp. 10820–10830, 2022. [Google Scholar]
46. Y. Fang, Q. Sun, X. Wang, T. Huang, X. Wang et al., “EVA-02: A visual representation for neon genesis,” arXiv preprint arXiv: 2303.11331, 2023. [Google Scholar]
Cite This Article
 Copyright © 2023 The Author(s). Published by Tech Science Press.
This work is licensed under a Creative Commons Attribution 4.0 International License , which permits unrestricted use, distribution, and reproduction in any medium, provided the original work is properly cited.
 Downloads
 Citation Tools