 Open Access
ARTICLE
An Enhanced Automatic Arabic Essay Scoring System Based on Machine Learning Algorithms
1 Department of Information Systems, Faculty of Computers and Information Science, Mansoura University, Mansoura, 35516, Egypt
2 Department of Information Systems, College of Computer and Information Sciences, Jouf University, Sakaka, Saudi Arabia
3 College of Computing and Informatics, University of Sharjah, Sharjah, United Arab Emirates
* Corresponding Author: Abdulaziz Shehab. Email:
(This article belongs to the Special Issue: Cognitive Computing and Systems in Education and Research)
Computers, Materials & Continua 2023, 77(1), 1227-1249. https://doi.org/10.32604/cmc.2023.039185
Received 13 January 2023; Accepted 07 June 2023; Issue published 31 October 2023
Abstract
Despite the extensive effort to improve intelligent educational tools for smart learning environments, automatic Arabic essay scoring remains a big research challenge. The nature of the writing style of the Arabic language makes the problem even more complicated. This study designs, implements, and evaluates an automatic Arabic essay scoring system. The proposed system starts with pre-processing the student answer and model answer dataset using data cleaning and natural language processing tasks. Then, it comprises two main components: the grading engine and the adaptive fusion engine. The grading engine employs string-based and corpus-based similarity algorithms separately. After that, the adaptive fusion engine aims to prepare students’ scores to be delivered to different feature selection algorithms, such as Recursive Feature Elimination and Boruta. Then, some machine learning algorithms such as Decision Tree, Random Forest, Adaboost, Lasso, Bagging, and K-Nearest Neighbor are employed to improve the suggested system’s efficiency. The experimental results in the grading engine showed that Extracting DIStributionally similar words using the CO-occurrences similarity measure achieved the best correlation values. Furthermore, in the adaptive fusion engine, the Random Forest algorithm outperforms all other machine learning algorithms using the (80%–20%) splitting method on the original dataset. It achieves 91.30%, 94.20%, 0.023, 0.106, and 0.153 in terms of Pearson’s Correlation Coefficient, Willmot’s Index of Agreement, Mean Square Error, Mean Absolute Error, and Root Mean Square Error metrics, respectively.Keywords
Assessment is an essential component of the educational process. Two types of writing assessment are as follows [1]: Long essay scoring is used to estimate relatively long responses that can help students to improve their writing skills and reflect their abilities to understand the subject content. It generally includes an introduction, body, and conclusion. Short essay scoring is frequently used for scoring short text answers for “define” and “why” questions. The content of the responses determines it, and the style is unimportant [2]. Manual assessment is a labor-intensive task that necessitates significant effort, time, and resources. It puts a lot of strain on teachers, especially if they teach a large number of students and they frequently assign writing assignments. Moreover, in the manual assessment of writing questions, different human graders can assign different scores for the same question, which many students regard as unfair grading.
Text similarity is a text classification category determined by how similar two texts are to one another [3]. It can be approached in three ways [4]: string-based similarities, corpus-based similarities, knowledge-based similarities, or a selection of possible combinations between them. Character-based and term-based techniques, which determine similarity by counting the number of distinctive characters in these two sequences, are the two categories of string-based similarities [4]. Examples of character-based distance measures are Damera-Levenshtein (DL) [5], N-Gram [6], Smith-Waterman, Jaro, etc. Examples of term-based distance measures are the Overlap coefficient [7], Matching Coefficient [8], Cosine similarity [9], etc. Corpus-based similarities, such as Latent Semantic Analysis (LSA) [10], Extracting DIStributionally similar words using CO-occurrences (DISCO1) [11], and DISCO2 [12], are measures that recognize the degree of similarity between words by utilizing exclusive information derived from large corpora. The knowledge-based similarity is a semantic similarity approach that specifies the degree of similarity between words using data from semantic networks [13]. The most well-known widely-adopted semantic networks used in knowledge-based similarities are Arabic WordNet [14] and English WordNet [15]. Finally, a selection of possible combinations is used together to achieve the best performance.
One of the most common applications of text similarity is the Automatic Essay Scoring (AES) system. It is designed to score and evaluate student responses automatically based on a predefined trained set of answer documents, and it frequently provides appropriate feedback and corrections for the assessment process [16,17]. Compared with a manual process, AES systems reduce effort, time, and the cost of institutional resources while also achieving fairness in marking student answers [17]. Some studies for scoring Arabic essays have been presented. Unfortunately, given differences in writing methods, answer lengths, multiple synonyms, spelling errors, grammar, and morphological structure, no empirical AES software systems for Arabic have been developed. So, the main question in this research is how Arabic questions, with these challenges, will be used in Arabic universities and schools that depend on smart learning, Artificial Intelligence (AI), and Natural Language Processing (NLP) technologies. More detail will be presented in Section 2.
This study prepares a dataset in the sociology course, which includes 270 short answers (27 essay questions × 10 student answers/questions). It is an extension of Shehab et al. [18] and is utilized to build the proposed system, which consists of two main components. First, the grading engine measures the similarity values between students’ answers and answer models using some similarity measures, including string-based and corpus-based algorithms under various scenarios. Second, the adaptive fusion engine fuses the similarity scores to enhance the overall system accuracy by providing a better accurate correlation and reducing the error. In this engine, six Machine Learning (ML) algorithms are applied, namely, Decision Tree (DT), Random Forest (RF), Adaboost, Lasso, Bagging, and K-Nearest Neighbor (KNN), after applying some Feature Selection (FS) algorithms, such as Recursive Feature Elimination (RFE) and Boruta algorithms.
The main contributions of this paper are as follows:
• Creating a novel dataset that might help many interested researchers in the field of Arabic essay scoring systems.
• Comparing the performance of a set of widely-adopted text similarity measures that belong to different categories including string-based similarity measures and corpus-based similarity measures in assessing the answers to essay questions in the Arabic language.
• Designing and implementing an automated Arabic essay questions grading system that consists of two main subsystems: grading engine which measures the similarity between students’ answers and answers models using a number of similarity measures, and adaptive fusion engine which fuses the similarity scores using ML algorithms to enhance the overall system accuracy.
• Using various evaluation methods such as the Pearson’s Correlation Coefficient (CORR), Willmot’s Index of Agreement (D), Mean Square Error (MSE), Mean Absolute Error (MAE), Root Mean Square Error (RMSE), and Runtime to assess the models’ performance
• Providing feedback and reports for each institution, student, and teacher who rely on smart learning, AI, and NLP technologies.
The rest of this work is organized as follows: Section 2 presents some related work. Section 3 describes the proposed framework. Section 4 shows the experimental results and discussion. Section 5 presents the conclusion and future work.
Several automatic grading systems in English have been used: Project Essay Grading (PEG) [19], IntelliMetric [20], C-rater [21], Paperless School free-text Marking Engine (PS-ME) [22], Automark [23], and Bayesian Essay Test Scoring System (BETSY) [24], whereas a few studies have been conducted in Arabic [25–34]. Thus, this section discusses some of the efforts made toward developing Arabic automatic essay grading systems.
Reafat et al. [25] proposed an LSA-based method for evaluating Arabic essays. Only 29 student answer papers were used in the experiment (5 papers for training and 24 for testing). The proposed method is primarily concerned with reducing the deleted stop-words to achieve a satisfactory grading level. According to the system, the correlation between automatic and manual scores is 0.91. However, it lacks feedback on answers for students and teachers.
Gomaa et al. [26] used a hybrid approach in which they combined multiple similarity measures, including the longest common subsequence. They created a dataset containing 610 Arabic-language student responses. This proposal estimates the student responses after they have been translated into English. They tried to treat the challenges of processing Arabic text. However, the proposed framework has many drawbacks, such as the absence of good stemming techniques, the loss of context structure because many words are not semantically translated from Arabic to English, and the experimental results that must be fed to a machine-learning algorithm that takes a long time to process.
Gomaa et al. [27] investigated similarity algorithms for Arabic automatic short-answer grading. String-based and corpus-based similarity measures are being combined and assessed. Students’ answers are handled holistically and partially, and useful feedback is provided. Moreover, the authors created a new benchmark Arabic dataset with 50 questions and 12 answers for each question. Finally, the results of the evaluation measures demonstrated that the proposed model could be deployed in the actual environment.
Ewees et al. [28] compared the Cosine similarity and KNN algorithm in the LSA method to score Arabic essays automatically. They also enhanced LSA using some pre-processing tasks, such as processing the entered text, unifying letterforms, removing formatting, replacing synonyms, stemming, and removing “stop-words.” The system outputs revealed that using Cosine similarity with LSA produced better values than using KNN with LSA. This system has a 0.88 overall correlation with the teachers’ evaluations.
Alghamdi et al. [29] demonstrated a hybrid computerized Arabic essay assessment system that combines LSA with the three linguistic aspects: 1) word frequency, 2) word stemming, and 3) spelling errors. This suggestion should determine the reduced dimensionality to use in LSA to assess the effectiveness of this suggested system. According to the system, 96.72% of the test data is correctly graded and automatic and manual scores correlated at 0.78, similar to the inter-human correlationof 0.7.
Al-Jouie et al. [30] presented an automatic evaluator of student essays in Arabic. A system modeled after the scheme used by schoolteachers in Riyadh, Saudi Arabia’s capital. Language proficiency, essay structure, and content that is relevant to the topic are the criteria to be used to grade the essays. Thus, they created a method based on the LSA similarity measure and rhetorical structure theory. The system was tested on over 300 different essays, all of which were handwritten by schoolchildren and covered a wide range of topics. Machine-human correlation in grading was used to assess performance. This system has a 0.79 overall correlation with the teachers’ evaluations and a 78.33% overall accuracy on the test data.
Shehab et al. [18] applied four text similarity measures, two for string-based algorithms and two for corpus-based algorithms to 210 Arabic students’ answers from an in-house dataset to score them and find an efficient method for essay grading. When compared with the word-based approach, the N-Gram approach is used in this model because it is simpler and produces a more reliable result when dealing with noisy data, such as grammatical or spelling errors. The researchers showed that the character-based N-Gram algorithm outperformed the other three types in terms of CORR (0.82): Damera-Levenshtein, LSA, and DISCO2.
Azmi et al. [31] presented a hybrid Arabic scoring system that considers LSA, writing style, spelling errors, and some other lexical aspects. The 350 Arabic essays collected from schoolchildren were used to test the system. The best accuracy was reported to be 0.9, with a CORR of 0.76. The relatively high accuracy value may be because auto-“exact” scores and “within range” scores are acceptable and correct scores. The auto-score is “exact” when the difference between it and the actual score is between 0 and 0.5, and the auto-score is “within range” when the difference between it and the actual score is between 0.5 and 2.5.
Al Awaida et al. [32] proposed the lone work that utilized Arabic WordNet (AWN) in Arabic AES systems. The intention was to increase the system’s accuracy by swapping out student answer word synonyms. The authors used the f-score to add the selected features to the feature space, and Cosine similarity to measure the similarity between the student answer and the model answer. Schoolchildren collected and tested an in-house dataset containing 120 questions and three model answers for each question. The impact of using AWN is compared. The authors reported CORR ranges of 0.5–1 and MAE of 0.117, and they concluded that using AWN improves text similarity accuracy.
Abdeljaber [17] suggested a string-based text similarity measure, namely, the Longest Common Subsequence (LCS) for grading short answers to Arabic essay questions depending on Arabic WordNet. The authors reported that the framework achieved the best results with an RMSE value of 0.81 and a CORR value of 0.94 on a dataset of 330 students’ answers. However, feedback and correction on the answers for students and teachers were not given.
Nael et al. [33] were the first researchers to develop a method for assessing Arabic quick answers using deep learning approaches. They proposed AraScore after conducting empirical research and studies with a baseline model, Recurrent Neural Network (RNN), Long Short-Term Memory (LSTM), Bidirectional LSTM (Bi-LSTM), and two transformer-based language models: Bidirectional Encoder Representations from Transformers (BERT) and Efficiently Learning an Encoder that Classifies Token Replacements Accurately (ELECTRA). They ran all the tests on the Automated Student Assessment Prize (ASAP) short answer scoring dataset, which has 17,205 responses and approximately 1,600 answers for each question. As a result, they achieved cutting-edge performance with a Quadratic Weighted Kappa (QWK) score of 0.78, demonstrating the strength and robustness of modern Arabic NLP techniques. However, this proposed system was trained and tested on the translated text that differed syntactically from real Arabic text.
Badry et al. [34] attempted to create an Automatic Arabic Short Answer Grading (AASAG) model by utilizing semantic similarity techniques. It is employed to gauge how semantically similar the student’s response is to the sample response. The suggested approach is applied to the Arabic Dataset for Automatic Short Answer Grading Evaluation (AR-ASAG). It is one of the few publicly accessible Arabic datasets. It includes 2133 pairs of student responses and model responses in formats like txt, xml, and db. Through two tests that used two weighting schemas: local and hybrid local and global weighting schema. The efficacy of the proposed approach was assessed. The hybrid local and global weight-based LSA approach that was created produced superior outcomes than local weight-based LSA, with an F1-score value of (82.82%) and an RMSE value of 0.798, respectively.
To conclude, the most of aforementioned studies lack high accuracy, low processing time, and provide feedback. As a result, the missing feedback and low correction on the answers to Arabic essay questions for students and teachers with high processing time are considered research gaps and should be addressed using an effective tool based on text similarity and ML algorithms as presented in the proposed system.
Table 1 shows the current state-of-the-artwork-related Arabic automatic essay grading systems. For each previous work, the used text similarity approach, the used dataset size, and the used evaluation measures are stated.

This section explains the components of building the proposed system. The next subsections illustrate dataset description, text pr-processing, grading engine, adaptive fusion engine, and report with score and feedback. Fig. 1 summarizes these components in a block diagram, and each component is discussed in detail in the following subsections.
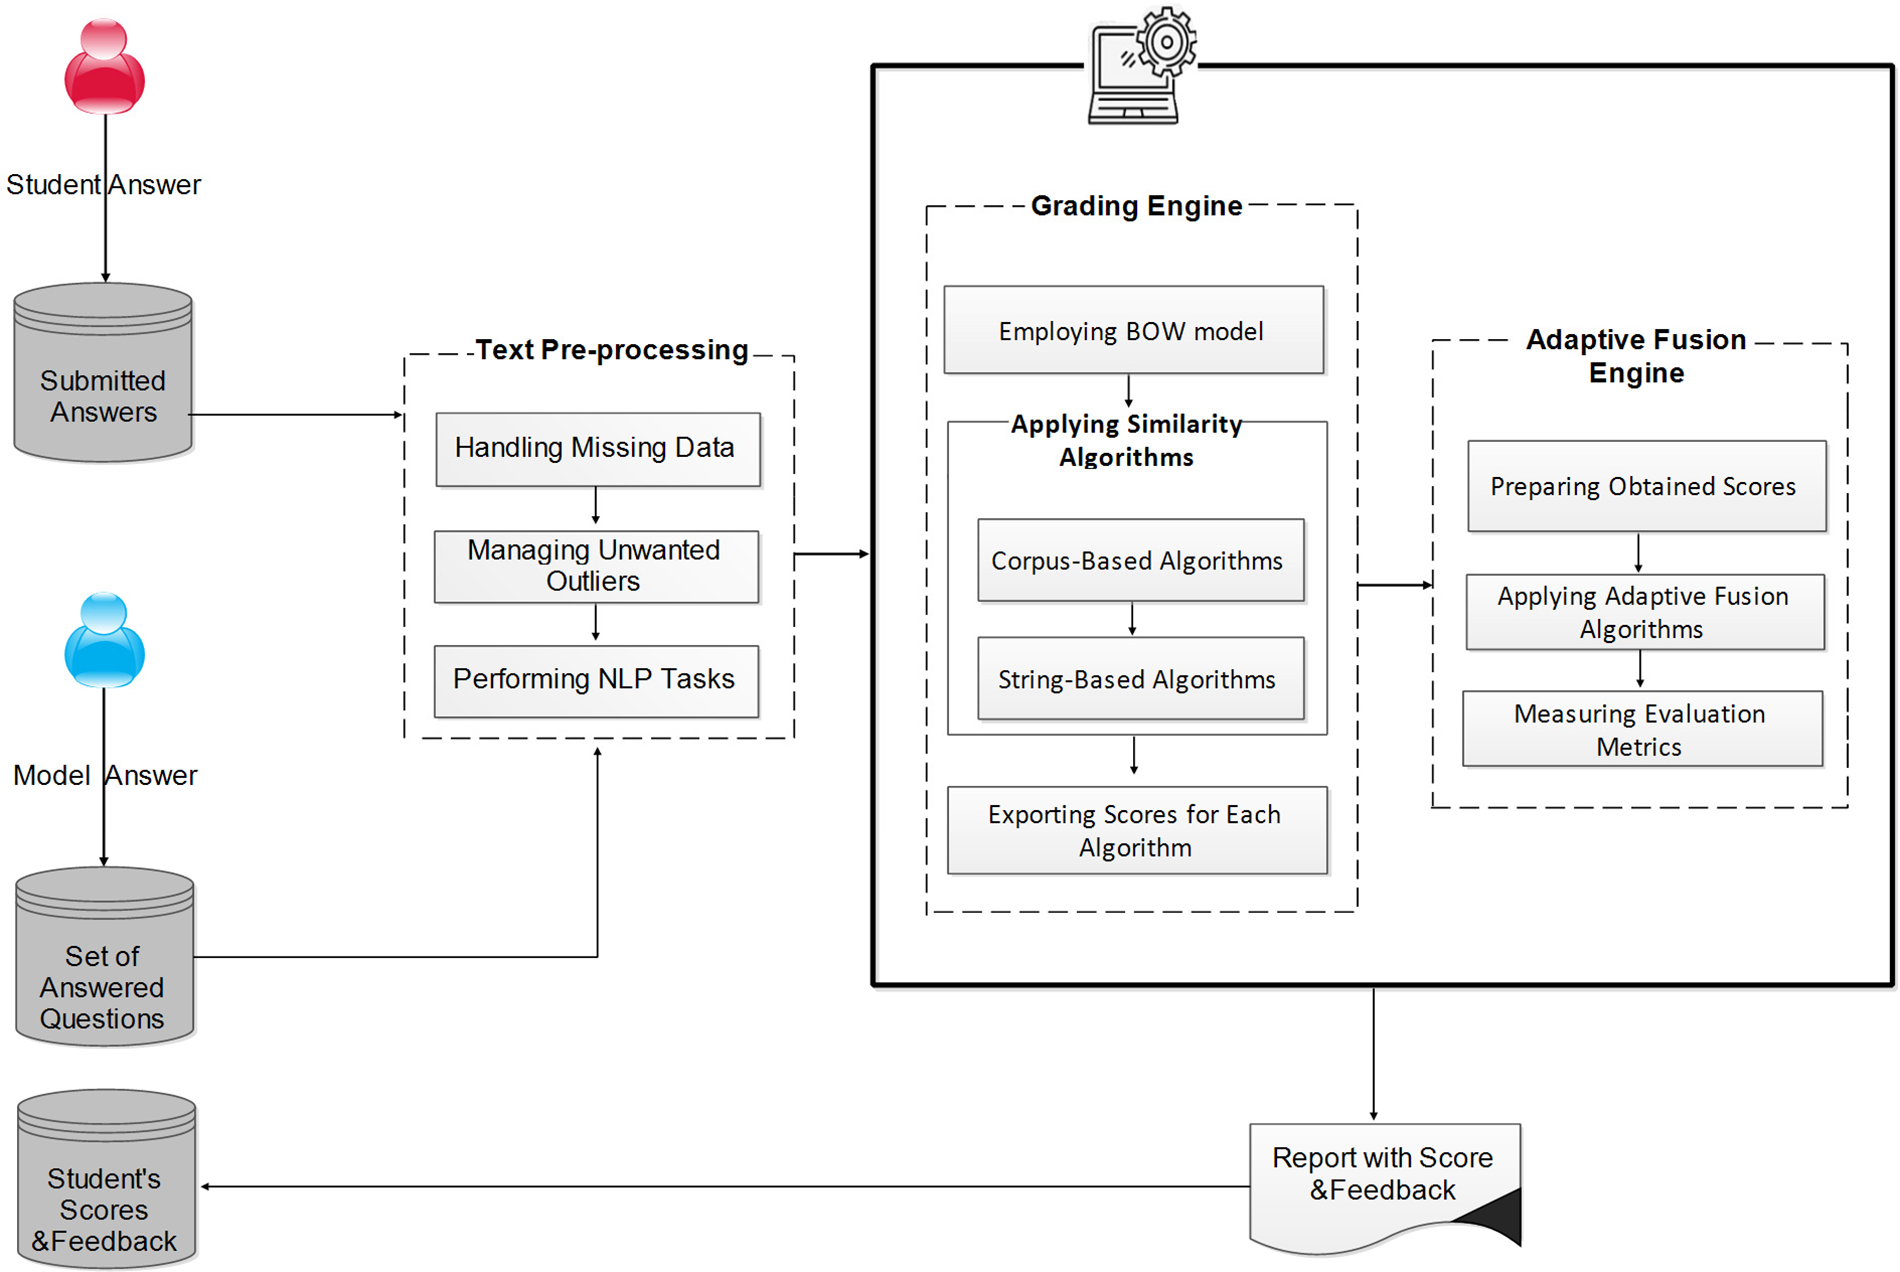
Figure 1: The proposed system’s flow diagram
3.1 Student Answer and Model Answer (SA&MA) Dataset
We depended on a dataset prepared in a sociology course to apply the similarity algorithms between SA and MA. It is an extension to the dataset used in Shehab et al. [18], which was taken by secondary level 3 students, with the total student answers being 270 (27 questions/assignment × 10 student answers/questions). Human graders evaluated the dataset question answers using model answers, with scores ranging from 0 (completely incorrect) to 5 (completely correct). Each judge had no idea about the other judge’s correction and grade. The mean score of two graders is calculated to consider the essential standard of the grading process. Table 2 displays a sample question, model answer, student answers, and the average scores that consider dataset attributes of Arabic text in a sociology course.

This crucial stage in any model transforms raw data into a format that can be used to correct errors in the dataset collected from the actual world and produce more accurate results and performances [35–37]. The text pre-processing component is achieved by the following processes: data cleaning and NLP tasks. These processes are described in detail below.
A better probability of getting good results if the used dataset has been well-cleaned. As a result, two sub-processes involved in data cleaning are applied: rebuilding missing data and managing unwanted outliers.
• Rebuilding missing data: The used original dataset contains some missing data, such as the absence of a student’s degree in any sociology question. As a result, the rebuilding missing data are applied to remove it using the strategy of the mean where the average values of the scores are taken and exchanged the null value with the average value.
• Managing unwanted outliers: In the used dataset, manually, the questions, answers, and scores that consider outliers are removed and can be enhanced the performance of the system.
3.2.2 Natural Language Processing (NLP) Tasks
NLP tasks consider the scenarios of the grading process while measuring the similarity values between SA and MA. The major NLP tasks are Raw, Tokenization, Stop-words, Stemming, and Stop-stem. Raw calculates the values for similarity without utilizing any NLP tasks. Tokenization reduces a text sequence to a series of sentences, and then those sentences to individual tokens [4,18]. Stop-words must be eliminated from the text because they are of no notable significance and don’t add any meaning to the text’s classification. Stemming eliminates all prefixes, suffixes, and infixes from the word, returning it to its original root. Finally, Stop-stem applies Stop-words and Stemming NLP tasks. An example applied to sample Arabic data.
Text:

Token as:

The Stop-words process output as:

The Stemming process output as:

The Stop-stem process output as:

The objective of the grading engine is to compute the similarity values between SA and MA using some text similarity measuring algorithms, including string-based and corpus-based algorithms, separately under various scenarios. To test the grading engine, thirteen string-based algorithms and two corpus-based algorithms are implemented.
The proposed system employs the Bag-Of-Words (BOW) model to compute sentence-to-sentence similarity instead of word-to-word similarity. The BOW model represents each sentence as a collection of words without order and regards grammar rules.
The similarity score between SA and MA is computed by computing the similarity score for each pair of words and then computing the overall score based on these similarity score values [38]. To compute the overall similarity score, a N × M similarity matrix is constructed, where N indicates the word count in the MA and indicates the word count in the SA. Moreover, in the similarity matrix, each word in MA is represented using a row while each word in SA is represented by a column. The similarity score between the SA and MA is computed after the similarity matrix is constructed using Eq. (1) [26].
where f(w) represents the word’s relative frequency that belongs to MA or SA and Sim (w, SA) can be computed either by the maximum similarity (MaxSim) or the average similarity (Avgsim). MaxSim indicates the biggest similarity score between a certain word w and the remaining words in the SA, whereas Avgsim is computed by the summing the similarity values of a certain word w and dividing the result by the word count in the SA. Sim (w, MA) is computed in the same way.
To determine how closely the model and the grader are correlated in the process of assigning grades, measures of the correlation are applied. Depending on the experimental results of the CORR and D values, it is noticed that more work is needed to maximize correlation at a desired and satisfying level. Thus, the adaptive fusion engine component is added to combine the different obtained similarity values to enhance the efficiency of the proposed system.
This component is applied by the following processes: preparing obtained scores, applying feature selection algorithms, validating the model’s results, applying machine learning algorithms, and measuring evaluation metrics. These processes are described in detail below.
In the proposed system, sixty features that consider fifteen well-known text similarity string-based and corpus-based measuring algorithms under four various scenarios including Raw, Stemming, Stop-words, and Stop-stem are employed. The values of the scores acquired using a single text similarity algorithm under a single NLP scenario are represented as a feature. Two sub-processes involved in feature preparation are applied: normalization and feature scaling.
• Normalization: Normalization entails changing the data, namely, translating the source data into a different format that enables efficient data pre-processing. A minimax scaler is used to scale and transform the features using a specific range of 0 and 1 [39], as shown in Eq. (2).
where min, max = feature range.
A similarity value for each feature bounded by the interval [0, 1] is produced, where 1 indicates that the findings are identical and 0 indicates no meaningful resemblance between SA and MA.
• Feature Scaling: Feature scaling is a method for effectively distributing the independent features in the dataset over a predetermined range. The standard scaler is one of the most widely used algorithms in feature scaling pre-processing. It is critical because it speeds up the algorithm’s learning process [40]. This algorithm is executed for each normalized input feature in the original dataset, resulting in better results for the proposed framework. The average and standard deviation are measured for each normalized feature to standardize it. Then, the new value of
where
3.4.2 Feature Selection (FS) Algorithms
The computational cost and memory usage are usually exponential because of the massive number of high-dimensional data during modern data analysis, visualization, and modeling. To address these issues, the FS process is one of the most basic techniques that is frequently used. It applies by eliminating no longer relevant, noisy, or redundant features and retaining relevant information for resolving the specific problem [41].
Filter, wrapper, and embedded are the three different types of FS methods. Using the characteristics of the data, filter methods select the most discriminative features depending on a two-step strategy. First, all features are ranked based on specific criteria. Second, the features with the highest rankings are chosen [42,43]. Wrapper methods evaluate the features using the intended learning algorithm [42,43]. Finally, embedded methods select features while the modeling algorithm is running. Two popular FS algorithms are used in the proposed system: RFE and Boruta algorithms, to reduce the features and improve the results.
● Recursive Feature Elimination (RFE) Algorithm
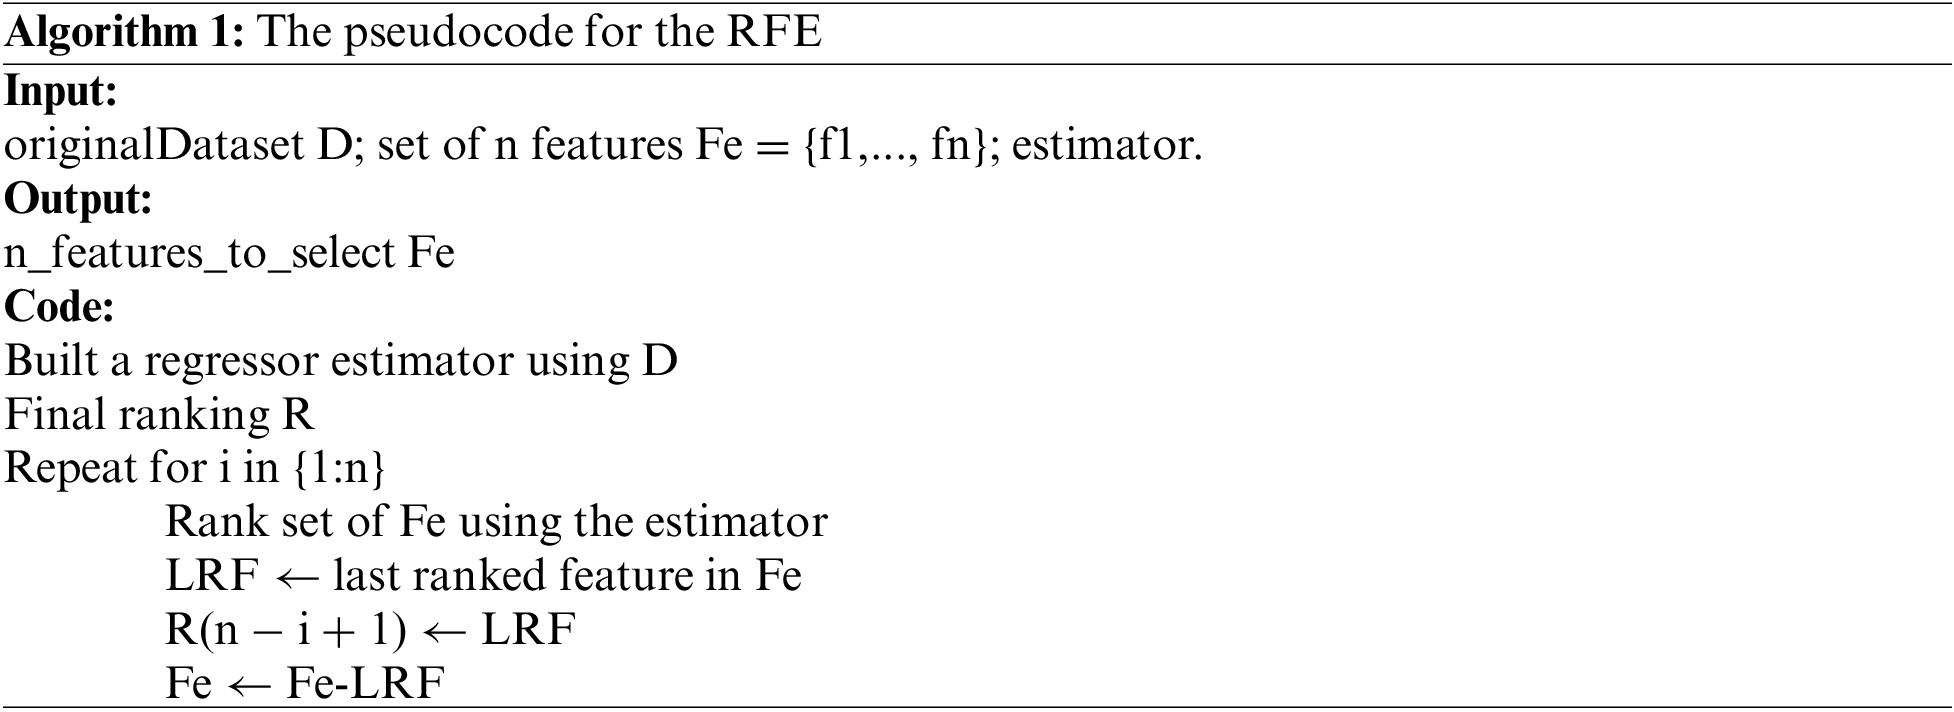
The RFE algorithm is executed by Guyon et al. [44]. Its popularity is because of its simplicity and effectiveness during setup and usage. Two essential configuration parameters are applied during the implementation. The first configuration is a number of features, and the second is the technique that is used to select this feature with its parameters (estimator).
To select the features using the recursion method, according to [45], the relative importance of each feature can change significantly when evaluated over a different subset of features during the stepwise elimination process. Then, A final ranking is constructed based on the (inverse) order in which features are eliminated. Finally, the FS process is determined by selecting the first n features from the ranking. The RFE algorithm’s pseudo-code is shown in Algorithm 1.
● Boruta Algorithm
The Boruta algorithm is a wrapper for the random forest classification algorithm, which is implemented in the R package randomForest [46]. It considers multivariable relationships and is effective for classification and regression problems. Moreover, it is based on the idea that by adding randomness to the system and collecting results from an ensemble of randomized samples, random fluctuations, and correlations can be reduced in their misleading impact [47].
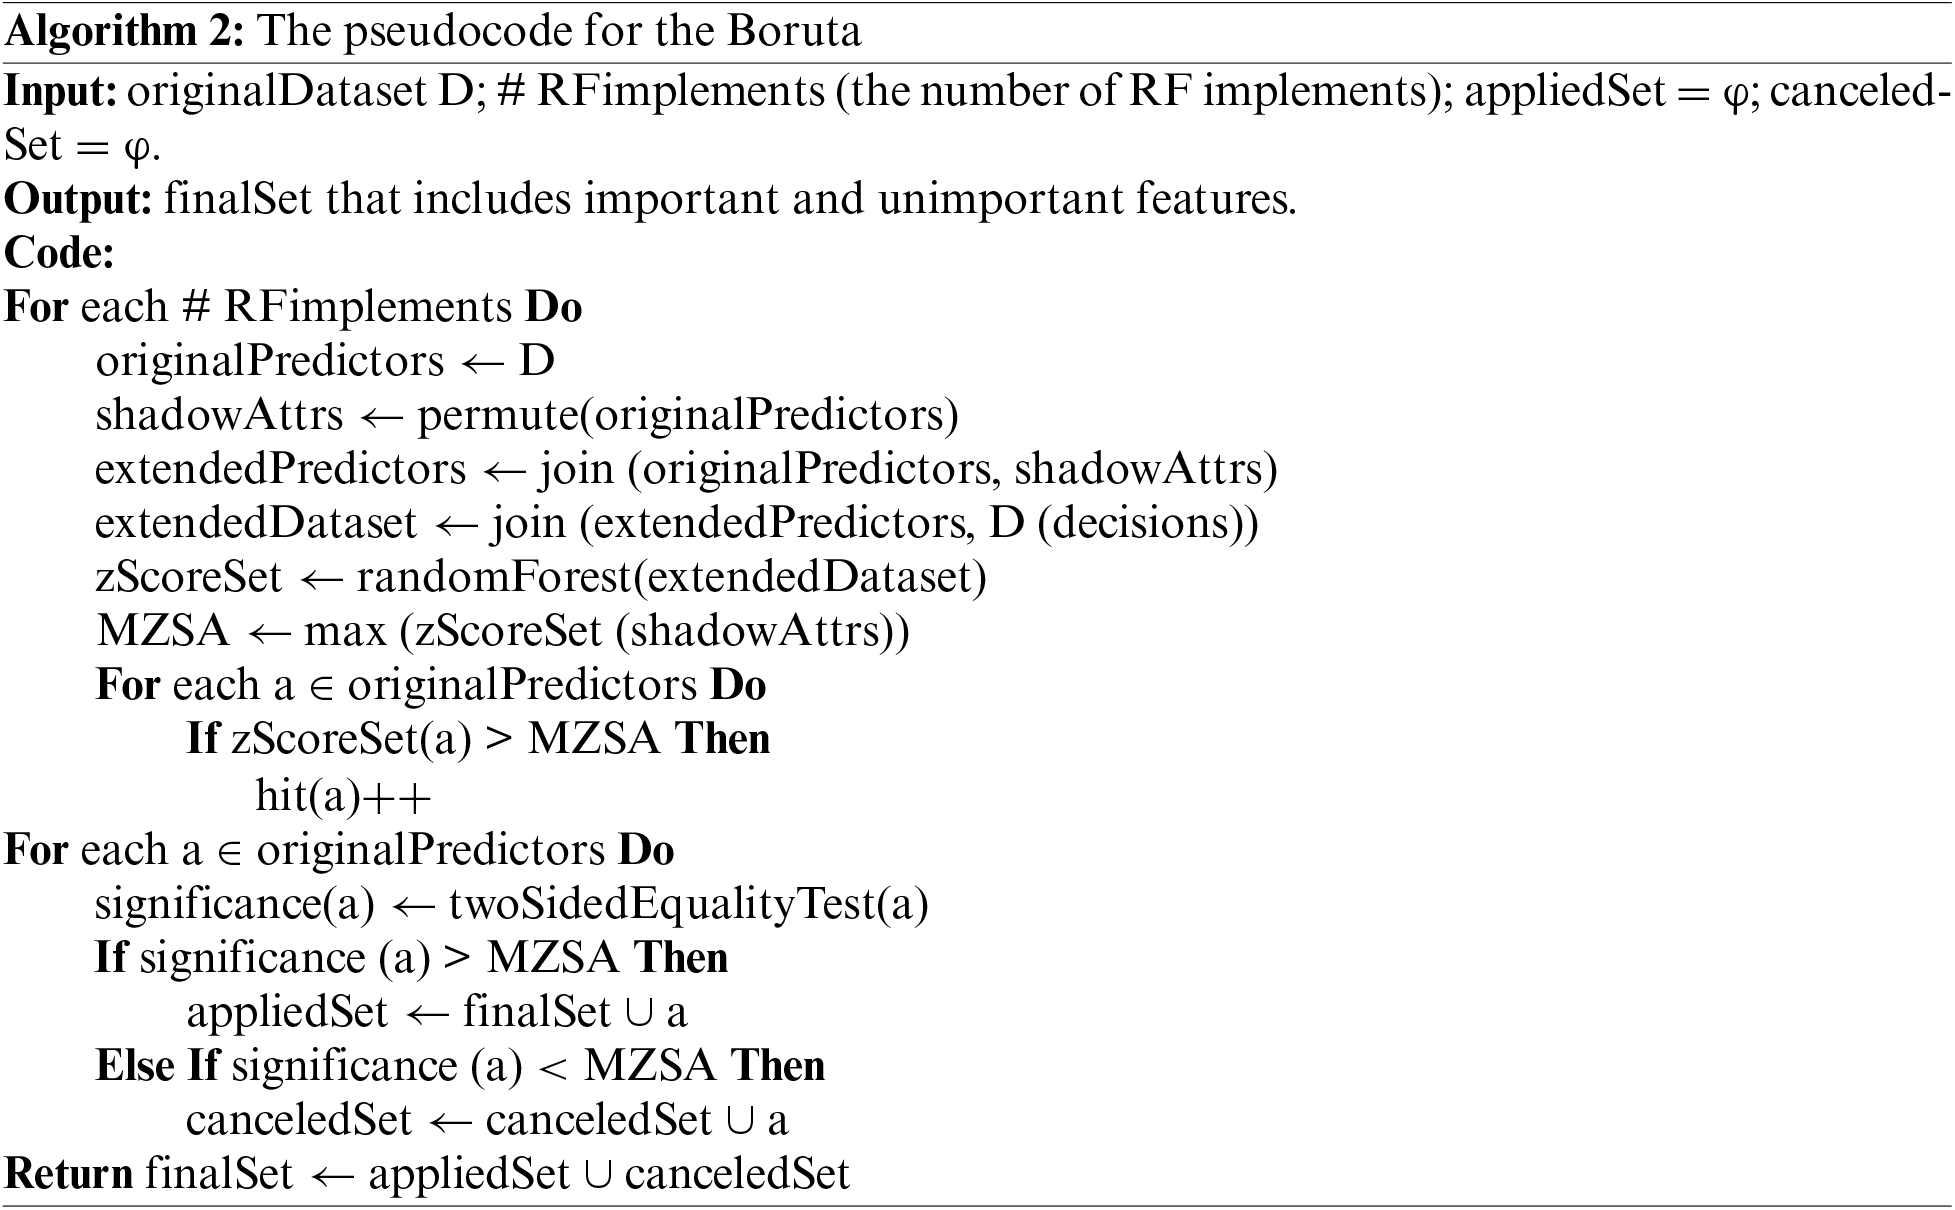
Algorithm 2 shows the working steps of the Boruta algorithm. To select the features using the Boruta method, according to [48], shadow attributes (shadowAttrs) are created by extending the original dataset (D), the RF algorithm is applied to the extended dataset (extendedDataset), and the measure of Z score is applied to each feature (zScoreSet). Consequently, the maximum value of zScoreSet among shadowAttrs (MZSA) is defined, and the hit is selected for each feature that is considered better than MZSA. Then, MZSA employs a two-sided equality test. The features with more significance than MZSA are considered important (appliedSet), and the features with less significance than MZSA are considered unimportant (canceledSet). Finally, the algorithm is executed in several iterations until the number of RF implements is achieved or the features are assigned as important or unimportant.
As mentioned above, the FS approach is a solution for high data dimensionality that improves the performance of models, reduces the data dimensionality, and increases the accuracy and reliability. In RFE, the forty-four features are extracted and eliminated sixteen features using the estimator as an RF regressor and determined the number of features with the (n_features_to_select) parameter. In Boruta, thirty-seven features are extracted and eliminated twenty-three features using the RF regressor estimator, and selected the number of RF implements with the n_estimators’ parameter.
In implemented experiments, we used the widely used method of cross-validation: the random hold-out method. The random hold-out method is applied to estimate the effectiveness of ML algorithms for predictive modeling problems on a dataset that was not executed in the training model. It is a quick and simple procedure and can be applied to any supervised learning algorithm for regression or classification problems.
This procedure divides the dataset into two groups. The first group, known as the training dataset, is used to fit and transform the model, and the second group, known as the test dataset, is used to predict unknown values of the model [49]. The used dataset was randomly divided into many training-testing phases, but two methods are chosen because of their effectiveness. The two methods are 70%–80% for the training phase and 30%–20% for the testing phase. These attempts aim to find the best training-testing phase that maximizes the CORR and D values between manual and automatic grading for essay question assessment while reducing the teacher’s inaccuracy.
3.4.4 Machine Learning (ML) Models
Some ML algorithms were used, namely, K-Nearest Neighbor (KNN), Lasso, Random Forest (RF), Decision Tree (DT), Bagging, and Adaboost algorithms. Table 3 shows the parameters of the ML methods used in implemented experiments.

Five evaluation metrics were used in implemented experiments, namely, CORR, D, MSE, MAE, and RMSE, to calculate and evaluate the performance of the models.
Pearson’s Correlation Coefficient: Pearson’s Correlation Coefficient (CORR) is used to calculate to what extent the model and the grader are correlated when assigning grades. It is computed using Eq. (4).
Willmot’s index of agreement: Willmot’s index of agreement (D), which ranges from 0 to 1, is a standardized measure of the level of model prediction error [50]. A perfect match is represented by an agreement value of 1, whereas total discord is represented by a value of 0 [50]. The index of agreement can identify proportional and additive discrepancies between the variances and means of the real and simulated data [51]. It is computed using Eq. (5).
Mean Square Error: Mean Square Error (MSE) in statistical models quantifies the amount of error. It is computed by the average squared difference between the observed and predicted values. It is never a negative value and is employed in regression predictive modeling. When the value of MSE is small, the best-fit line can be found easily. It is computed using Eq. (6).
Mean Absolute Error: Mean Absolute Error (MAE) is known as the average of the absolute differences between the predicted and observed values. It is never a negative value and is employed in regression predictive modeling. It can detect errors despite its limited sensitivity to outliers. It is computed using Eq. (7).
Root Mean Square Error: Root Mean Square Error (RMSE) is a popular metric for calculating the difference between predicted and observed values. It is never a negative value. A lower RMSE value is preferable to a higher RMSE value. It is computed using Eq. (8).
where N is the number of values,
4 Experimental Results and Discussion
The experiments were implemented on a Z Book laptop with the characteristics of Intel (R) Core (TM) i7-6600U (Central Processing Unit) CPU @ 2.60 GHz 2.81 GHz of processor, 16 GB of Random Access Memory (RAM), and 64-bit Operating System (OS) of system type. A common Java software, NetBeans (IDE 8.2), is used to apply text similarity algorithms at the grading engine and a common Python software, Anaconda (Jupter-python 3), to develop and evaluate the proposed framework at the adaptive fusion engine. Furthermore, four different methods Raw, Stemming, Stop-words, and Stop-stem are used in testing for each text similarity technique and divided the used dataset into training and testing phases using the random hold-out technique after applying the FS methods for model validation to be executed on the ML algorithms.
The main components of the proposed system were grading and adaptive fusion engines. The following sub-sections present the results in detail.
4.2.1 Results of the Grading Engine
Some results of similarity algorithms are mentioned according to the most suitable CORR & D values and ignored the other similarity algorithms, as shown in Table 4.

Based on Table 4, the DISCO2 similarity measure is the best compared with other string-based and corpus-based similarity algorithms under various scenarios with CORR and D values of 79.90% & 83.60%, respectively in the Raw task, 80.60% & 85.10%, respectively in the Stemming task, 79.10% & 82.60%, respectively in the Stop-words task, and 79.40% & 83.00%, respectively in the Stop-stem task. In general, the results of DISCO2 produced the best CORR and D values compared with other similarity algorithms because of existing groups of words with similar distributions.
4.2.2 Results of the Adaptive Fusion Engine
The ML algorithms were applied to the results of similarity algorithms to enhance the correlation values and reduce the errors.
In this sub-section, five experiments have been conducted to evaluate the proposed system. The evaluation metrics CORR, D, MSE, MAE, and RMSE are used to represent the models’ performance. Moreover, the Runtime during the training and testing models is calculated to show how a dataset with FS algorithms reduced the time compared with a dataset without FS algorithms.
These experiments are summarized in experiments A, B, C, D, and E. Experiment A shows the CORR and D metrics. Experiment B shows the MSE metric. Experiment C shows the MAE. Experiment D shows the RMSE metric. Finally, Experiment E shows the Runtime for each training and testing time. Moreover, each experiment is discussed using the (70%–30%) training-testing phase and (80%–20%) training-testing phase to present the results.
Experiment A: CORR & D Evaluation Metrics of the Regressors
According to Figs. 2 and 3, in (a), the best CORR and D values in ML algorithms are achieved by the RF and Bagging algorithms, whether the dataset is with or without FS algorithms. In the dataset without FS, the RF and Bagging achieve CORR values of 87.60% and 86.50% and D values of 92.10% and 91.70%, respectively. For the RFE algorithm, RF and Bagging achieve CORR values of 88.00% and 86.50% and D values of 92.00% and 91.70%, respectively. Moreover, for the Boruta algorithm, RF and Bagging achieve CORR values of 88.20% and 86.80% and D values of 92.50% and 91.90%, respectively. However, the DT has the worst results with CORR and D values of 72.00% and 75.00% for the dataset without FS, 71.00% and 74.00% for the RFE algorithm, and 74.10% and 77.20% for the Boruta algorithm, respectively.
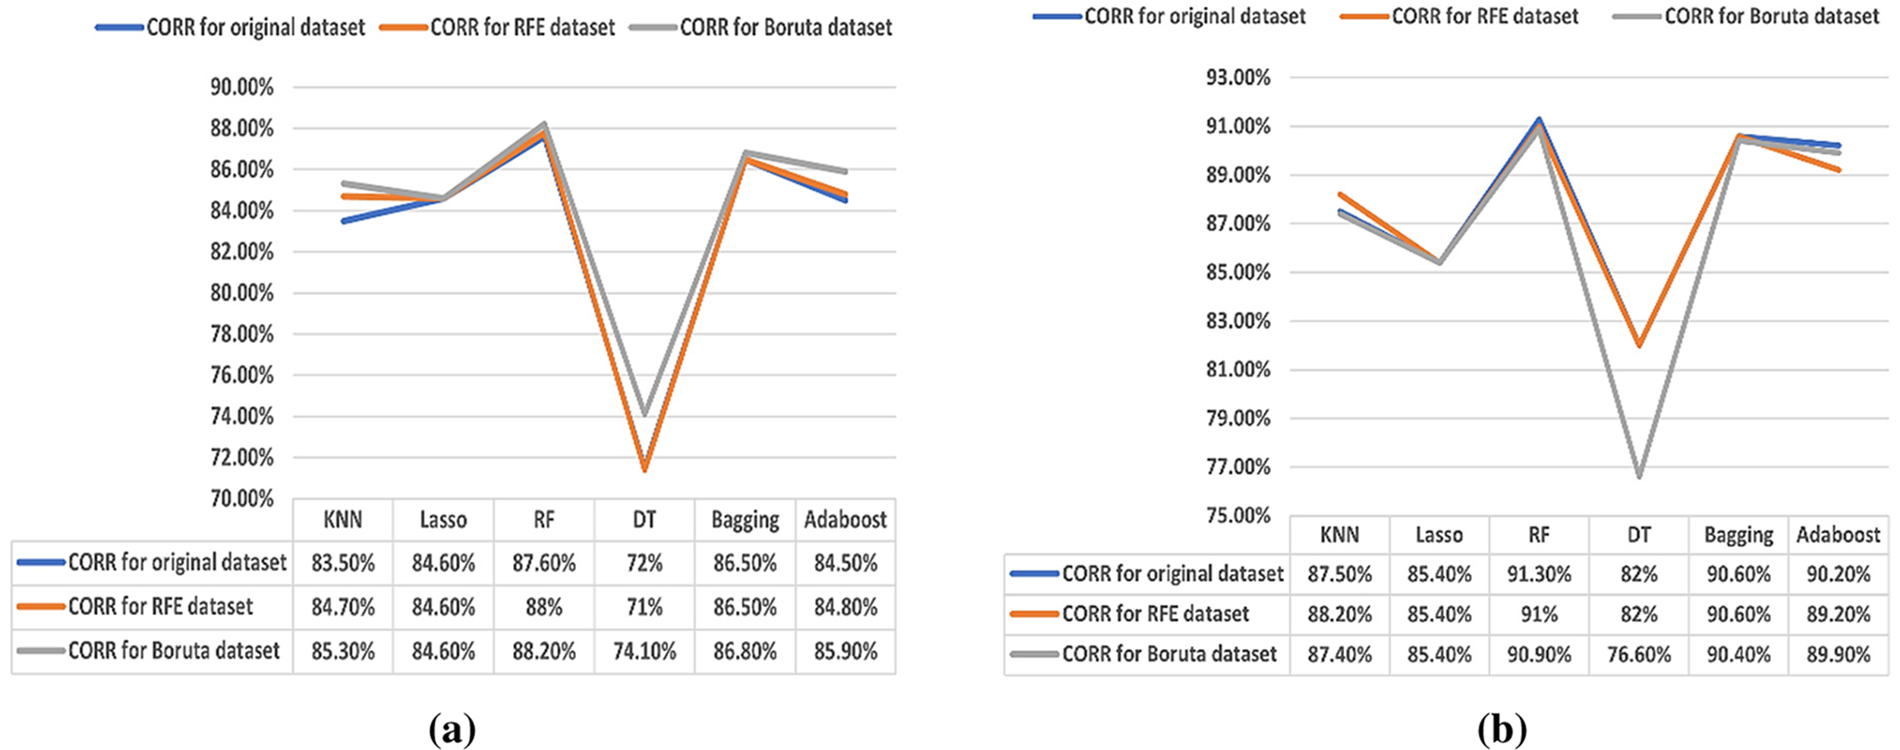
Figure 2: (a) Results of the CORR (70%–30%). (b) Results of the CORR (80%–20%)
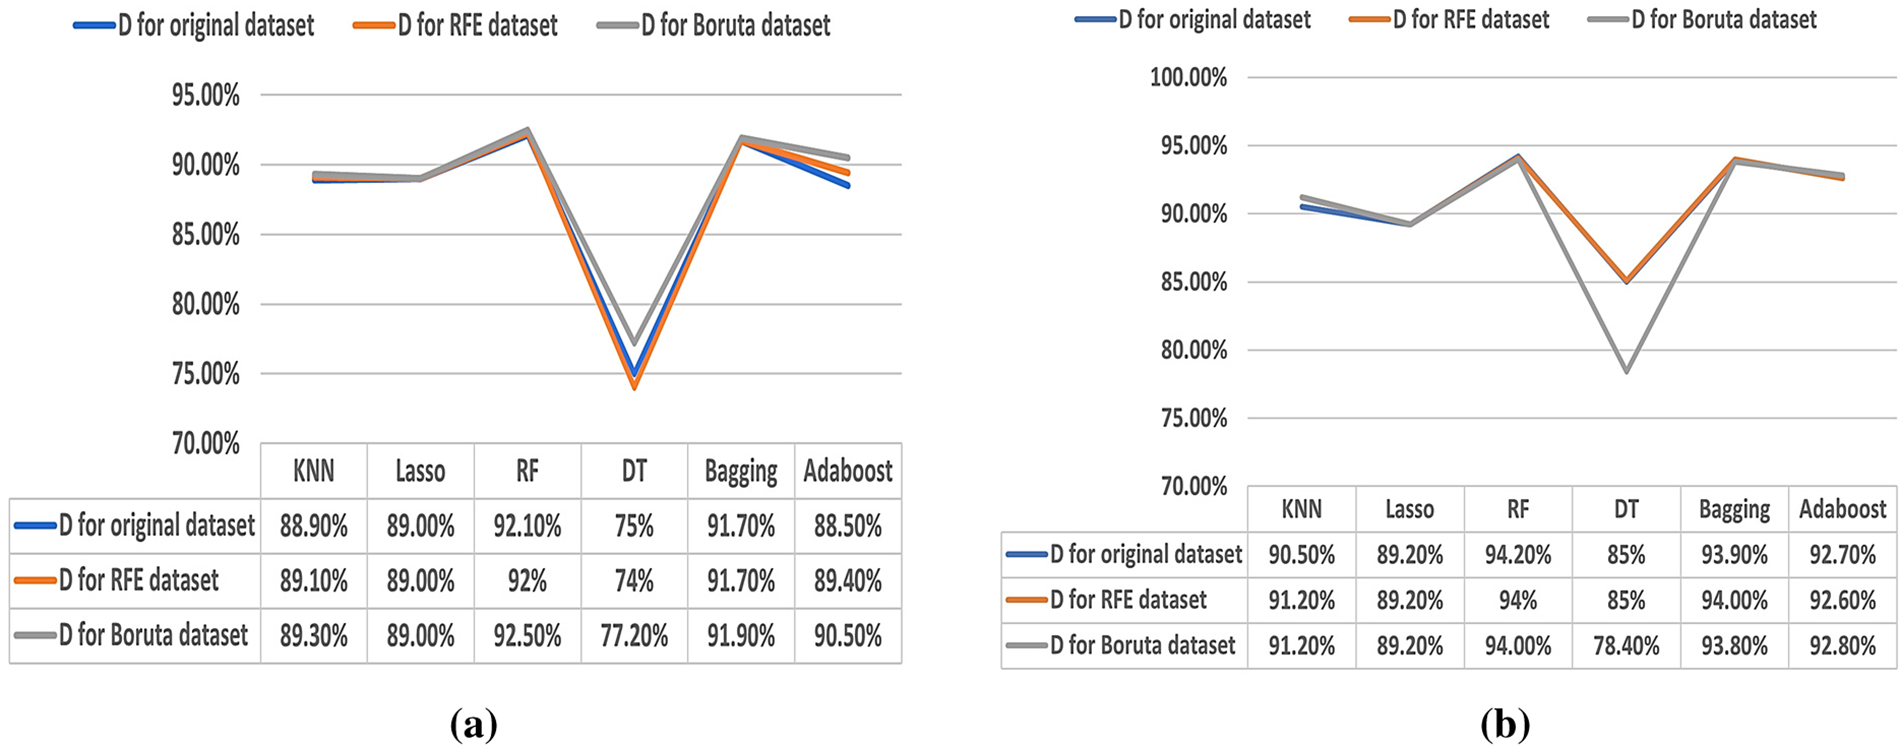
Figure 3: (a) Results of the D (70%–30%). (b) Results of the D (80%–20%)
In (b), RF and Bagging ensemble methods are the best algorithms for CORR and D values whether the dataset is with or without FS algorithms. In the dataset without FS algorithms, the CORR and D values of 91.30% and 94.20% for the RF algorithm and 90.60% and 93.90% for the Bagging algorithm are achieved. For the RFE algorithm, CORR values of 91.00% and 90.60%, and the same D value of 94.00% are achieved by RF and Bagging, respectively. Moreover, for the Boruta algorithm, RF and Bagging achieve CORR values of 90.90% and 90.40% and D values of 94.00% and 93.80%, respectively. However, the DT has the worst results with CORR and D values of 82.00% and 85.00% for each dataset without the FS algorithm and the RFE algorithm, respectively. Also, it achieves CORR and D values of 76.60% and 78.40% for the Boruta algorithm, respectively.
Experiment B: MSE Evaluation Metric of the Regressors
According to Fig. 4, in (a), the best MSE values in ML algorithms are achieved by the RF and Bagging algorithms, whether the dataset is with or without FS algorithms. The dataset without FS achieves MSE values of 0.029 and 0.030 for RF and Bagging algorithms, respectively. For the RFE algorithm, RF and Bagging achieve MSE values of 0.028 and 0.030, respectively. For the Boruta algorithm, RF and Bagging achieve the MSE values of 0.027 and 0.030, respectively. However, the DT achieves the worst results with MSE values of 0.062 for the dataset without FS, 0.063 for the RFE algorithm, and 0.056 for the Boruta algorithm.
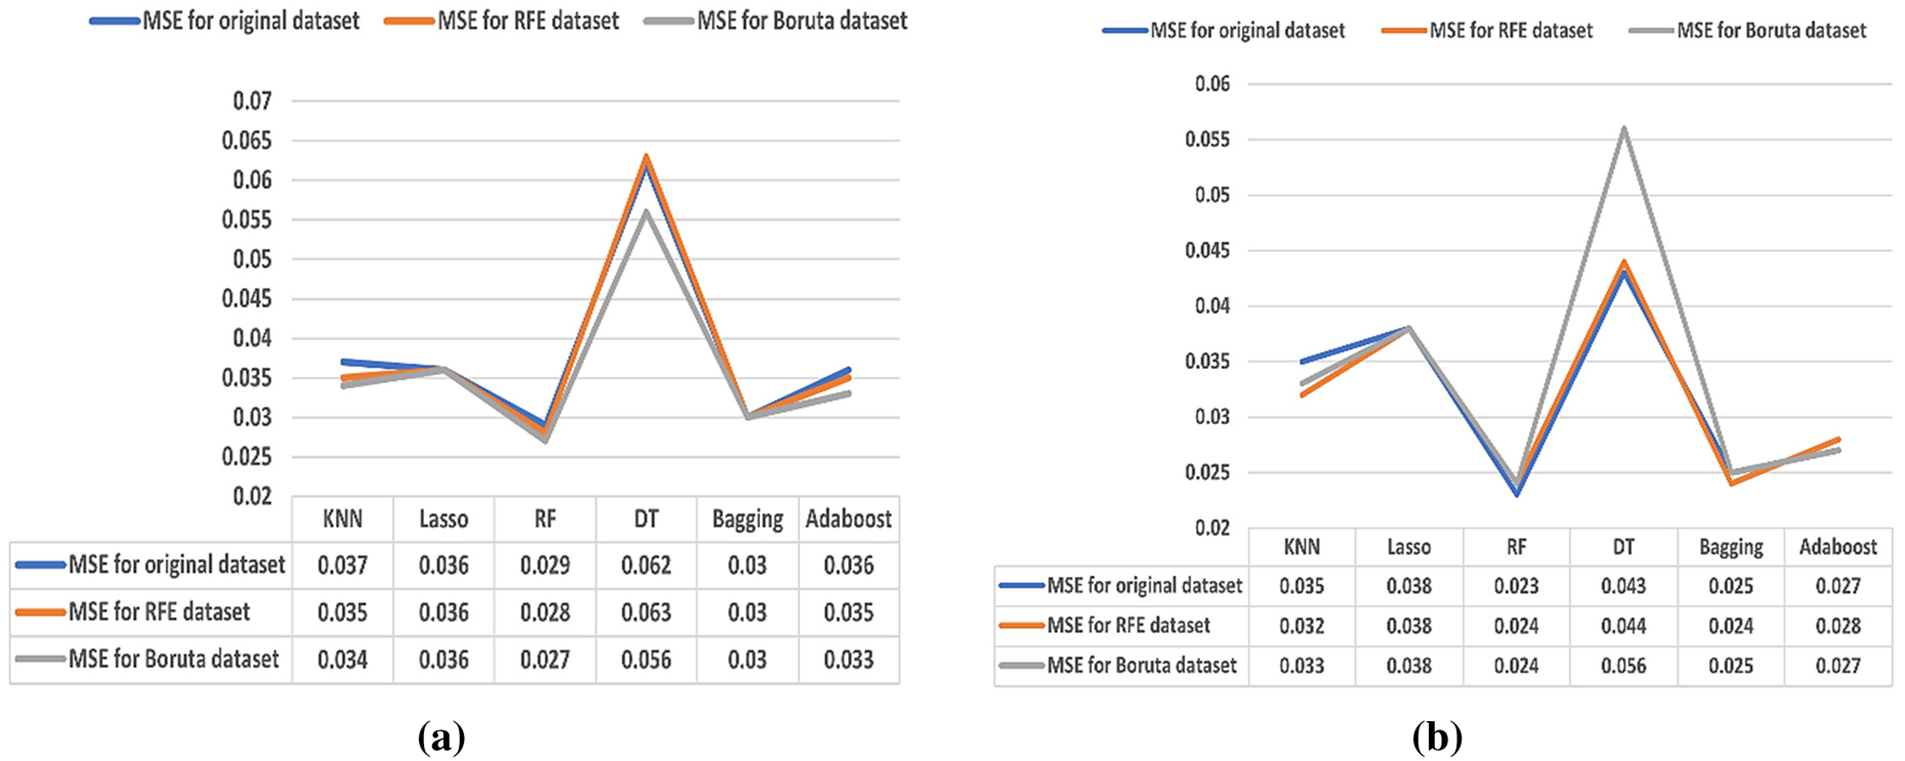
Figure 4: (a) Results of the MSE (70%–30%). (b) Results of the MSE (80%–20%)
In (b), RF and Bagging ensemble methods were noted as the best algorithms for MSE values. In the dataset without FS, the MSE values of 0.023 for the RF algorithm and 0.025 for the Bagging algorithm are achieved. For the RFE algorithm, the best MSE values are for RF and Bagging with the same MSE value of 0.024. For the Boruta algorithm, the best MSE values are for RF and Bagging at 0.024 and 0.025, respectively. However, the DT records the worst results with MSE values of 0.043 for the dataset without FS, 0.044 for the RFE algorithm, and 0.056 for the Boruta algorithm.
Experiment C: MAE Evaluation Metric of the Regressors
According to Fig. 5, in (a), the best MAE values in ML algorithms are achieved by the RF and Bagging algorithms, whether the dataset is with or without FS algorithms. The dataset without FS achieves MAE values of 0.114 and 0.115 for RF and Bagging algorithms, respectively. For the RFE algorithm, RF and Bagging achieve MAE values of 0.112 and 0.115, respectively. For the Boruta algorithm, RF and Bagging achieve MAE values of 0.110 and 0.114, respectively. However, the DT has the worst results with MAE values of 0.173 for each dataset without FS and the RFE algorithm and 0.167 for the Boruta algorithm.
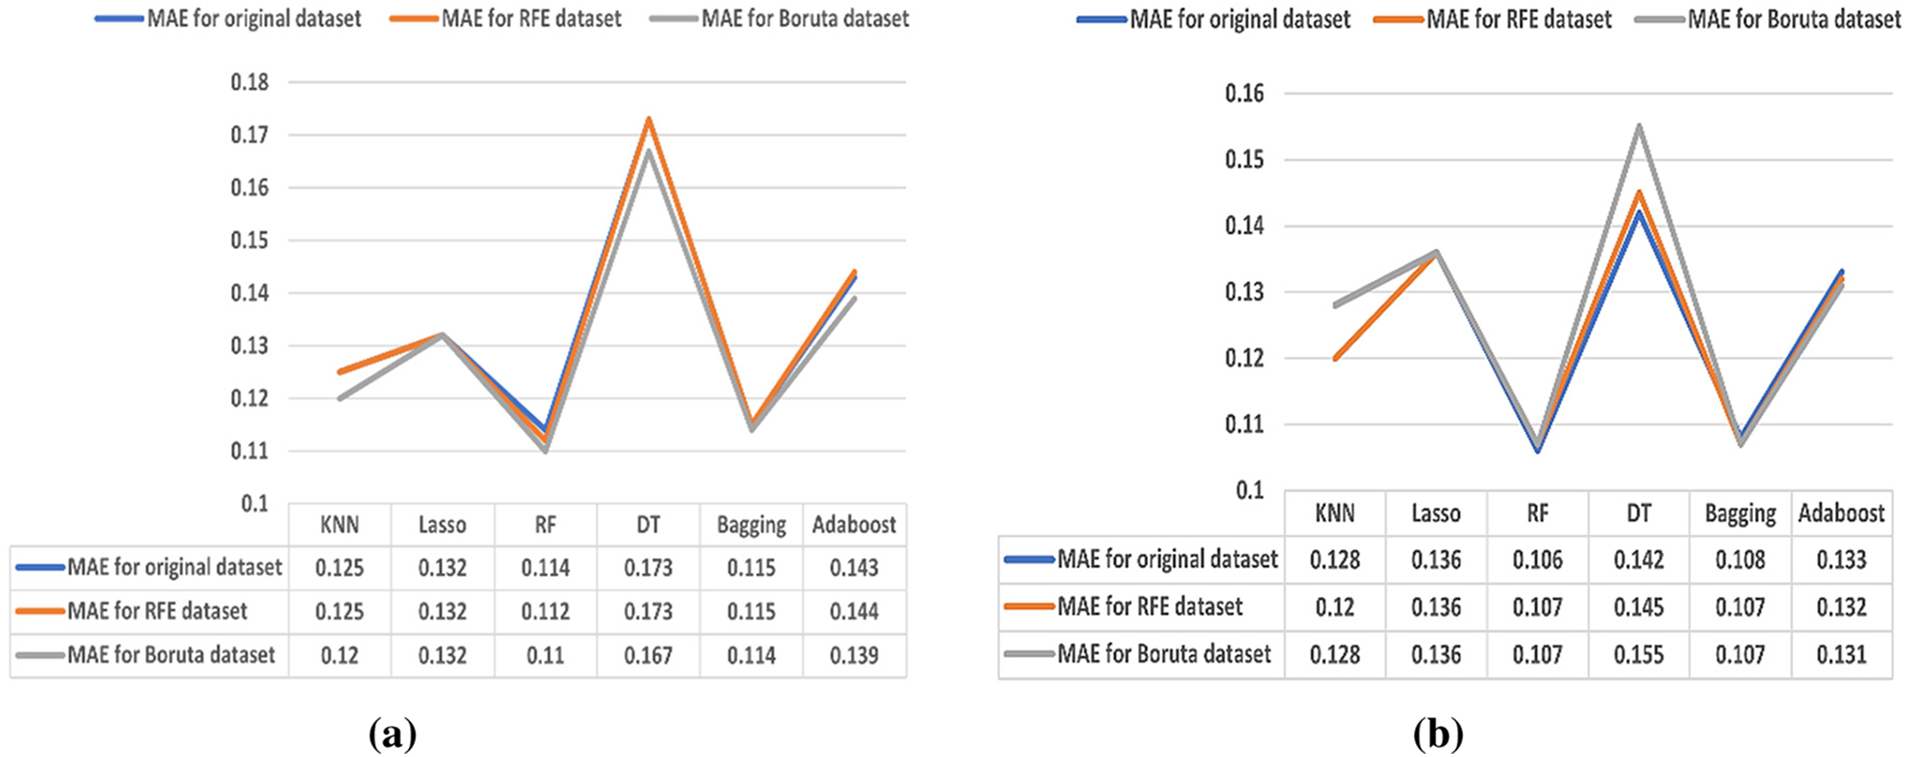
Figure 5: (a) Results of the MAE (70%–30%) (b) Results of the MAE (80%–20%)
In (b), RF and Bagging ensemble methods are the best algorithms for MAE values. In the dataset without FS, the MAE values of 0.106 for the RF algorithm and 0.108 for the Bagging algorithm are achieved. For the RFE and Boruta algorithms, the best MAE values are the same for RF and Bagging at 0.107. The DT has the worst results with MAE values of 0.142 for the dataset without FS, 0.145 for the RFE algorithm, and 0.155 for the Boruta algorithm.
The MAE evaluation metric of the regressors is not accurate because the gradient magnitude is dependent only on the sign of
Experiment D: RMSE Evaluation Metric of the Regressors
Fig. 6 (a) shows that the best RMSE values in ML algorithms are achieved by the RF and Bagging algorithms, whether the dataset is with or without FS algorithms. The dataset without FS achieves RMSE values of 0.169 and 0.174 for RF and Bagging algorithms, respectively. For the RFE algorithm, RF and Bagging achieve RMSE values of 0.168 and 0.175, respectively. For the Boruta algorithm, RF and Bagging achieve RMSE values of 0.165 and 0.173, respectively. However, the DT has the worst results with RMSE values of 0.249 for the dataset without FS, 0.250 for the RFE algorithm, and 0.237 for the Boruta algorithm.
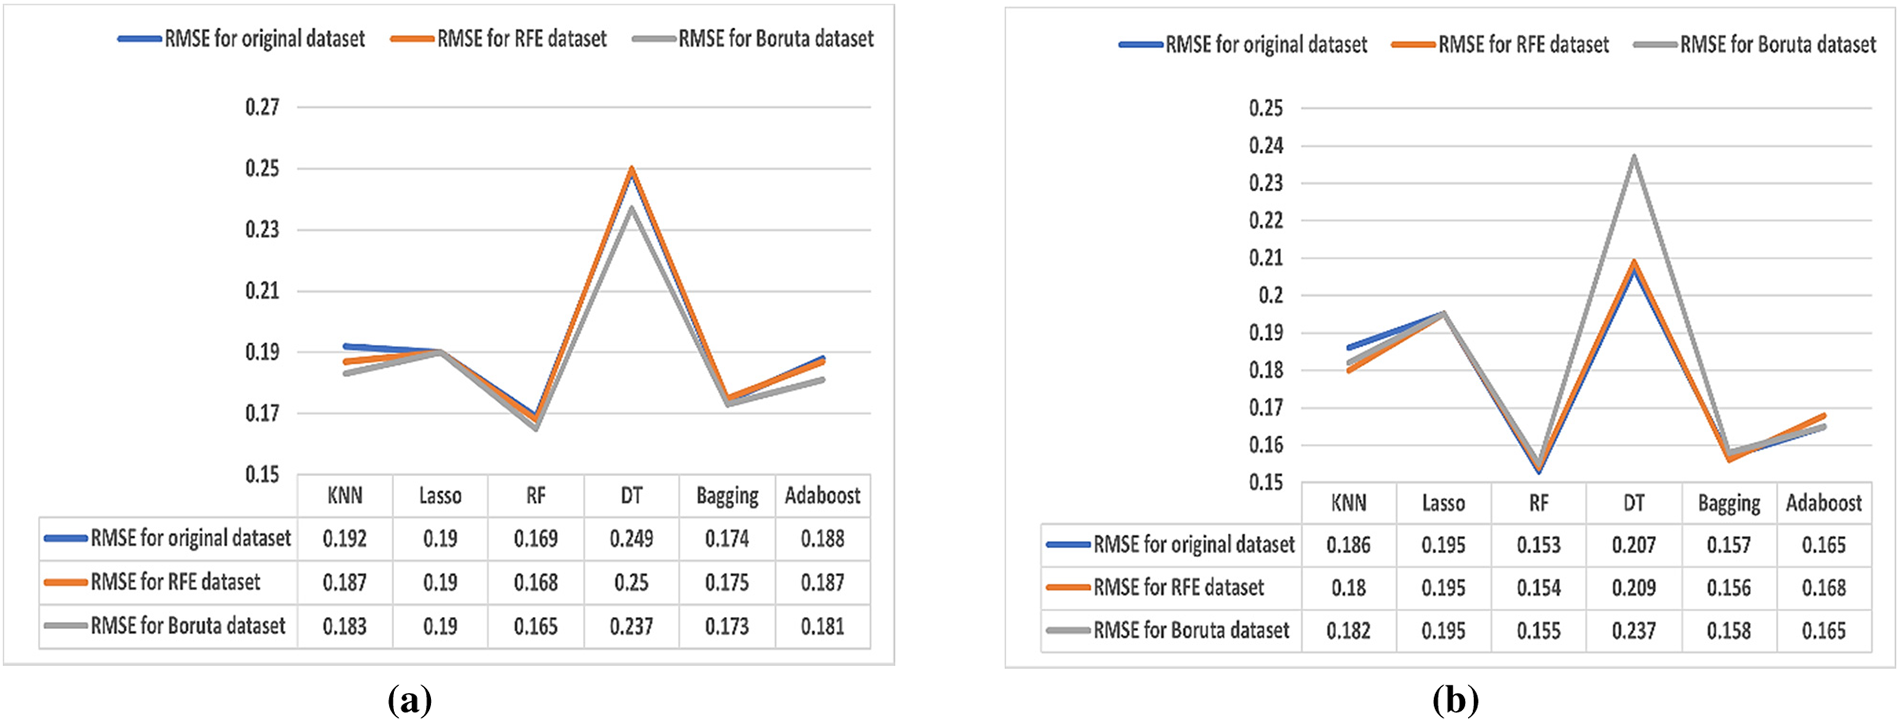
Figure 6: (a) Results of the RMSE (70%–30%). (b) Results of the RMSE (80%–20%)
In (b), RF and Bagging ensemble methods are the best algorithms for RMSE values. In the dataset without FS, the RMSE values of 0.153 for the RF algorithm and 0.157 for the Bagging algorithm are achieved. For the RFE algorithm, the best RMSE values are for RF and Bagging with RMSE values of 0.154 and 0.156, respectively. For the Boruta algorithm, the best RMSE values are for RF and Bagging at 0.155 and 0.158, respectively. However, the DT achieves the worst results with RMSE values of 0.207 for the dataset without FS, 0.209 for the RFE algorithm, and 0.237 for the Boruta algorithm.
The reasons RF and Bagging algorithms outperform the other ML algorithms in the experiments above: They can transform the weak learners into strong learners by combining N learners; they can enhance the accuracy in the regression problem; they can automatically balance datasets; they can effectively execute on continuous values; and they can automate the detection of missing values in data. Furthermore, the RF can handle large amounts of data with thousands of features and limit the features that each tree can use, whereas the Bagging stays all of the features in each tree. This advantage contributes to the RF algorithm’s results being better than the Bagging algorithm’s results. Thus, DT records the worst accuracy results because of instability, that is, any changes in the dataset lead to changes in the architecture of the optimal decision tree. Moreover, it is frequently erroneous in decision-making.
In the FS algorithms, RFE and Boruta reduced the features and improved the evaluation metrics nearly as if the original dataset was used. In general, RFE achieves these results because of its simplicity during usage and its effectiveness in identifying the features of the dataset. Moreover, Boruta achieves its results because it becomes extremely important when a dataset with multiple variables is provided for model building.
Experiment E: Runtime of the Regressors
Time reduction considers an important factor during the execution of the models. Its importance appears in reducing costs and improving productivity. Figs. 7 and 8 show the training and testing run times of the models on the dataset before and after applying FS algorithms in milliseconds (ms). It is noticed that training and testing runtimes decreased after applying the FS. Furthermore, the Boruta algorithm achieved the lowest result of runtime in all the phases, whether in the training or testing.
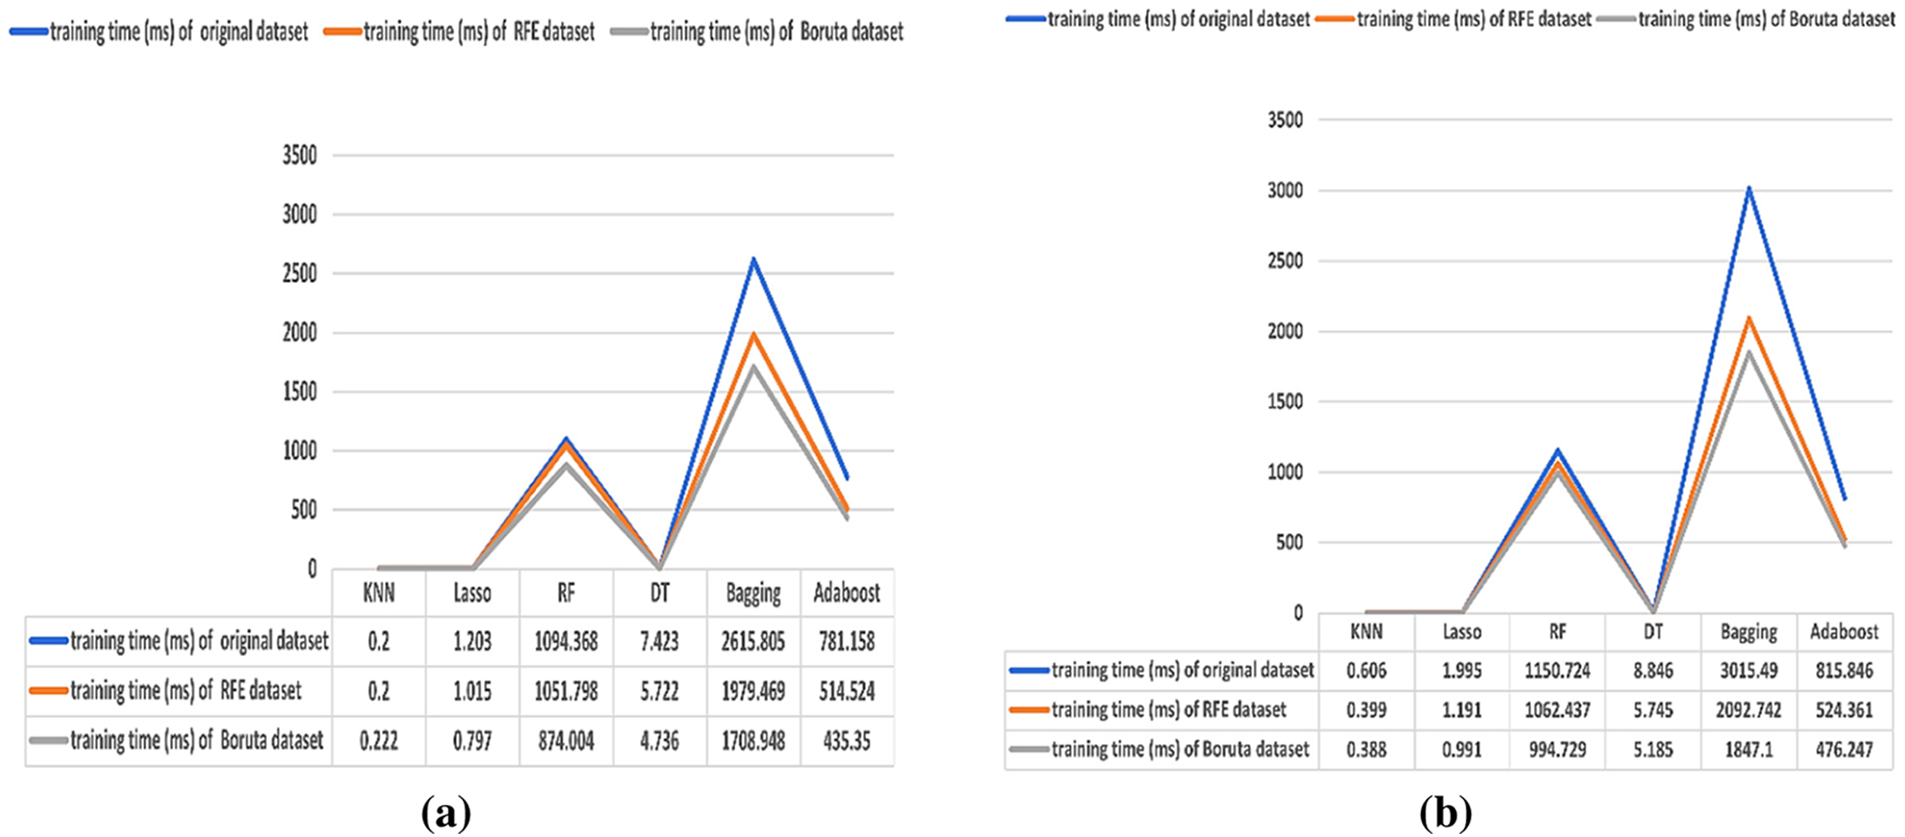
Figure 7: (a) Results of the training time (70%). (b) Results of the training time (80%)
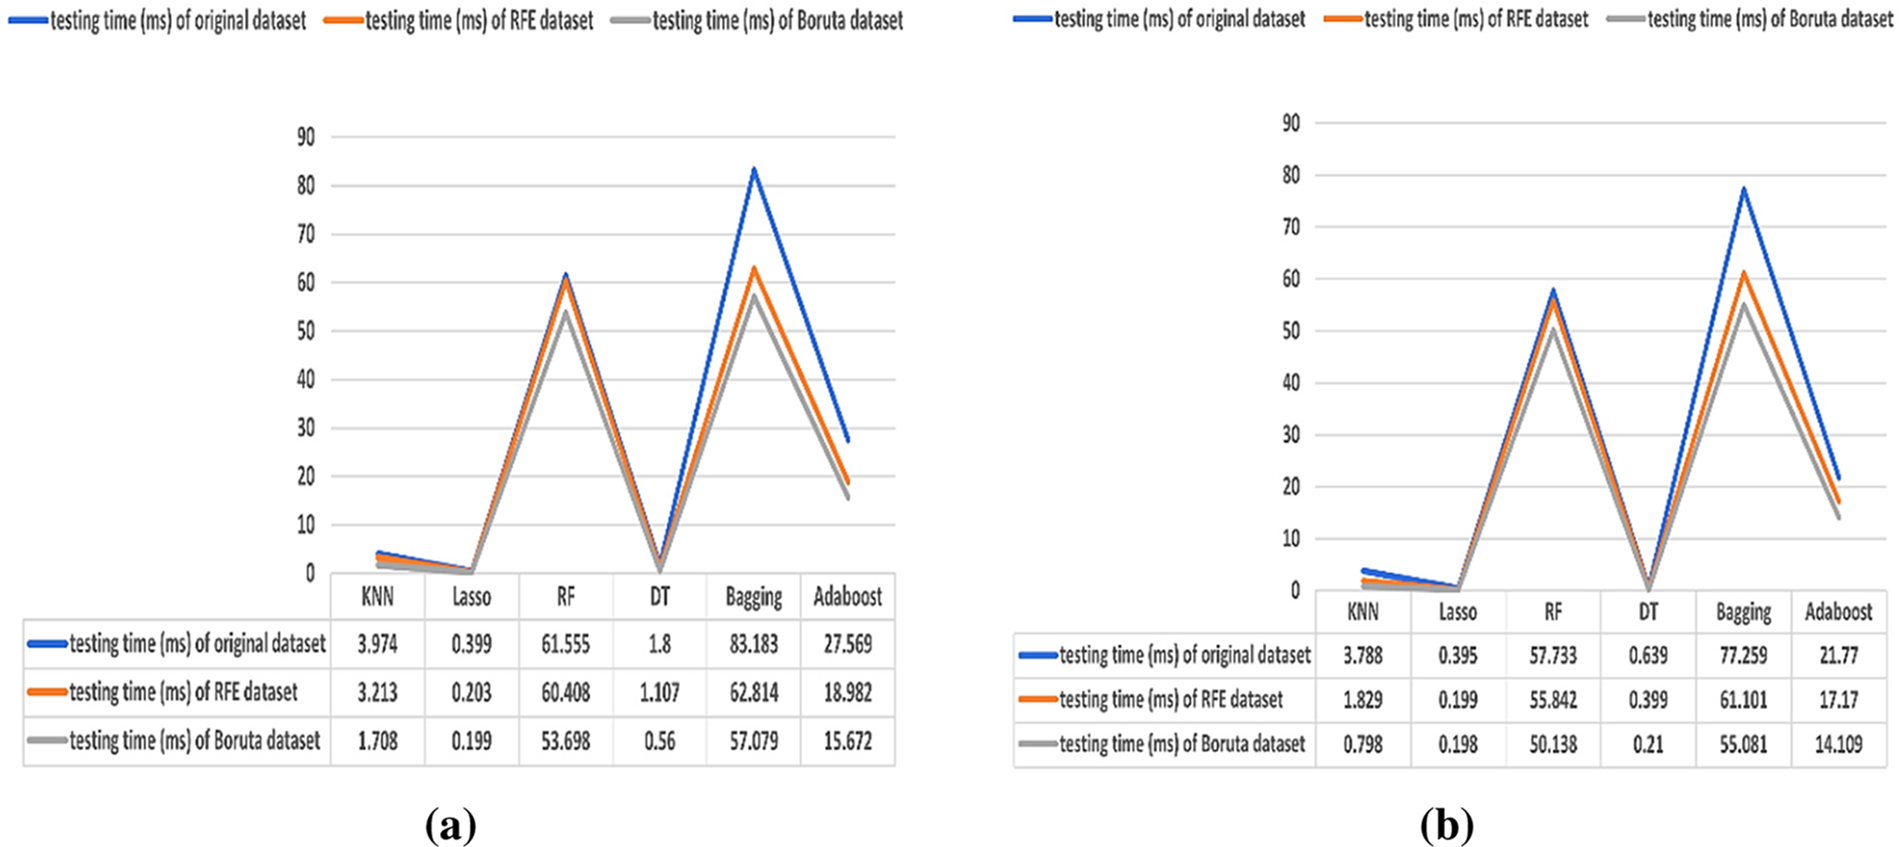
Figure 8: (a) Results of the testing time (30%). (b) Results of the testing time (20%)
To conclude the discussion, despite the efforts to determine the best training-testing phase that maximizes the correlation value, the results of the 80%–20% training-testing phase achieved a better performance than the results of the 70%–30% training-testing phase. Therefore, the user decides what random hold-out method will depend on the user’s desires. Also, the obtained findings demonstrated that the proposed system outperforms [18] and can accurately forecast student answer scores.
The essay question is a crucial type of inquiry that can enhance students’ writing abilities and reveal their comprehension of the subject matter. However, manually grading essay responses can be arduous for instructors, especially when dealing with large classes and frequent writing assignments. Automatic assessment technology, such as Automated Essay Scoring (AES) systems, can be a viable solution to this issue. These systems grade and assess student responses automatically based on a set of pre-trained questions and provide feedback to the educational institution. This study developed and evaluated an Arabic AES system that uses NLP techniques and machine learning algorithms to grade essay responses. The system has two key components: the grading engine and the adaptive fusion engine. The grading engine uses similarity algorithms to compare student responses with model answers, while the adaptive fusion engine employs FS and machine learning algorithms to improve grading accuracy. The system’s experimental results revealed that the DISCO2 similarity measure and the RF algorithm outperformed other measures and algorithms, respectively. The study demonstrated that FS and machine learning algorithms can provide instructors with a precise and efficient solution for grading student essays. Future research will expand the dataset and assess the system’s applicability to various subjects and use knowledge-based measurements. Moreover, to improve the accuracy and generalizability of the proposed system, the pre-trained and fine-tuned transformer models will be considered in the future work.
Acknowledgement: Thankful to Prof. Amira Rezk for the guidance, encouragement, and unlimited support from the start to end for giving the great and valuable ideas to enhance this study.
Funding Statement: The authors received no specific funding for this study.
Author Contributions: Study conception and design: Nourmeen Lotfy, Abdulaziz Shehab; data collection: Nourmeen Lotfy; analysis and interpretation of results: Nourmeen Lotfy, Abdulaziz Shehab. Mohammed Elhoseny; draft manuscript preparation: Nourmeen Lotfy, Abdulaziz Shehab. Ahmed Abu-Elfetouh. All authors reviewed the results and approved the final version of the manuscript.
Availability of Data and Materials: Data available on request from the authors. The data that support the findings of this study are available from the corresponding author, Abdulaziz Shehab, upon reasonable request.
Conflicts of Interest: The authors declare that they have no conflicts of interest to report regarding the present study.
References
1. A. Alqahtani and A. Alsaif, “Automatic evaluation for Arabic essays: A rule-based system,” in 2019 IEEE Int. Symp. on Signal Processing and Information Technology (ISSPIT), Ajman, United Arab Emirates, pp. 1–7, 2019. [Google Scholar]
2. S. Pulman and J. Sukkarieh, “Automatic short answer marking,” in Proc. of the Second Workshop on Building Educational Applications Using NLP, Michigan, USA, pp. 9–16, 2005. [Google Scholar]
3. M. Farouk, “Measuring sentences similarity: A survey,” Indian Journal of Science and Technology (IJST), vol. 12, no. 25, pp. 1–11, 2019. [Google Scholar]
4. S. E. Odeh Al-Awaida, “Automated Arabic essay grading system based on support vector machine and text similarity algorithm,” M.S. dissertation, Middle East University, Jordan, 2019. [Google Scholar]
5. J. L. Peterson, “Computer programs for detecting and correcting spelling errors,” Communications of the Association for Computing Machinery, vol. 23, no. 12, pp. 676–687, 1980. [Google Scholar]
6. A. Barrón-Cedeno, P. Rosso, E. Agirre and G. Labaka, “Plagiarism detection across distant language pairs,” in Proc. of the 23rd Int. Conf. on Computational Linguistics (Coling 2010), Beijing, China, pp. 37–45, 2010. [Google Scholar]
7. T. E. Clemons and E. L. Bradley Jr, “A nonparametric measure of the overlapping coefficient,” Computational Statistics & Data Analysis, vol. 34, no. 1, pp. 51–61, 2000. [Google Scholar]
8. W. H. Gomaa and A. A. Fahmy, “Short answer grading using string similarity and corpus-based similarity,” International Journal of Advanced Computer Science and Applications (IJACSA), vol. 3, no. 11, pp. 115–121, 2012. [Google Scholar]
9. A. R. Lahitani, A. E. Permanasari and N. A. Setiawan, “Cosine similarity to determine similarity measure: A study case in online essay assessment,” in 2016 4th Int. Conf. on Cyber and IT Service Management, Bandung, Indonesia, pp. 1–6, 2016. [Google Scholar]
10. T. K. Landauer and S. T. Dumais, “A solution to Plato’s problem: The latent semantic analysis theory of acquisition, induction, and representation of knowledge,” Psychological Review, vol. 104, no. 2, pp. 211, 1997. [Google Scholar]
11. P. A. V. Hall and G. R. Dowling, “Approximate string matching,” ACM Computing Surveys, vol. 12, no. 4, pp. 381–402, 1980. [Google Scholar]
12. P. Kolb, “Disco: A multilingual database of distributionally similar words,” in KONVENS 2008—Ergänzungsband: Textressourcen und Lexikalisches Wissen, 1st ed., Berlin, Germany: Citeseer, pp. 37–44, 2008. [Google Scholar]
13. R. Mihalcea, C. Corley and C. Strapparava, “Corpus-based and knowledge-based measures of text semantic similarity,” American Association for Artificial Intelligence, vol. 6, no. 2006, pp. 775–780, 2006. [Google Scholar]
14. W. Black, C. Fellbaum, M. Alkhalifa, S. Elkateb, A. Pease et al.,, “Introducing the Arabic wordnet project,” in Proc. of the Third Int. WordNet Conf., Jeju, South Korea, pp. 295–299, 2006. [Google Scholar]
15. G. A. Miller, “WordNet: A lexical database for English,” Communications of the ACM, vol. 38, no. 11, pp. 39–41, 1995. [Google Scholar]
16. Z. Ke and V. Ng, “Automated essay scoring: A survey of the state of the art,” in Proc. of the Twenty-Eighth Int. Joint Conf. on Artificial Intelligence (IJCAI-19), Macao, China, pp. 6300–6308, 2019. [Google Scholar]
17. H. A. Abdeljaber, “Automatic Arabic short answers scoring using longest common subsequence and Arabic wordnet,” IEEE Access, vol. 9, no. 99, pp. 76433–76445, 2021. [Google Scholar]
18. A. Shehab, M. Faroun and M. Rashad, “An automatic Arabic essay grading system based on text similarity algorithms,” International Journal of Advanced Computer Science and Applications, vol. 9, no. 3, pp. 263–268, 2018. [Google Scholar]
19. E. B. Page, “Project essay grade: PEG,” in Automated Essay Scoring: A Cross-Disciplinary Perspective, 1st ed., Mahwah, Bergen: Lawrence Erlbaum Associates, pp. 43–54, 2003. [Google Scholar]
20. S. Elliot, “IntelliMetric: From here to validity,” in Automated Essay Scoring: A Cross-Disciplinary Perspective, 1st ed., Mahwah, Bergen: Lawrence Erlbaum Associates, pp. 71–86, 2003. [Google Scholar]
21. C. Leacock and M. Chodorow, “C-rater: Automated scoring of short-answer questions,” Computers and the Humanities, vol. 37, no. 4, pp. 389–405, 2003. [Google Scholar]
22. O. Mason and I. Grove-Stephensen, “Automated free text marking with paperless school,” in Proc. of the 6th Computer Applications and Quantitative Methods in Archaeology (CAA) Conf., London, England, pp. 129735, 2002. [Google Scholar]
23. T. Mitchell, T. Russell, P. Broomhead and N. Aldridge, “Towards robust computerized marking of free-text responses,” in Proc. of the Sixth Int. Computer Assisted Assessment Conf., London, England, pp. 233–249, 2002. [Google Scholar]
24. L. M. Rudner and T. Liang, “Automated essay scoring using Bayes’ theorem,” Journal of Technology, Learning, and Assessment, vol. 1, no. 2, pp. 1–22, 2002. [Google Scholar]
25. M. M. Reafat, A. A. Ewees, M. M. Eisa and A. Ab Sallam, “Automated assessment of students Arabic free-text answers,” International Journal of Intelligent Computing and Information Sciences,vol. 12, no. 1, pp. 213–222, 2012. [Google Scholar]
26. W. H. Gomaa and A. A. Fahmy, “Automatic scoring for answers to Arabic test questions,” Computer Speech & Language, vol. 28, no. 4, pp. 833–857, 2014. [Google Scholar]
27. W. H. Gomaa and A. A. Fahmy, “Arabic short answer scoring with effective feedback for students,” International Journal of Computer Applications, vol. 86, no. 2, pp. 35–41, 2014. [Google Scholar]
28. A. A. Ewees, M. Eisa and M. M. Refaat, “Comparison of cosine similarity and k-NN for automated essays scoring,” International Journal of Advanced Research in Computer and Communication Engineering, vol. 3, no. 12, pp. 8669–8673, 2014. [Google Scholar]
29. M. Alghamdi, M. Alkanhal, M. Al-Badrashiny, A. Al-Qabbany, A. Areshey et al.,, “A hybrid automatic scoring system for Arabic essays,” AI Communications, vol. 27, no. 2, pp. 103–111, 2014. [Google Scholar]
30. M. F. Al-Jouie and A. M. Azmi, “Automated evaluation of school children essays in Arabic,” in Procedia Computer Science, Dubai, United Arab Emirates, pp. 19–22, 2017. [Google Scholar]
31. A. M. Azmi, M. F. Al-Jouie and M. Hussain, “AAEE-Automated evaluation of students’ essays in Arabic language,” Information Processing & Management, vol. 56, no. 5, pp. 1736–1752, 2019. [Google Scholar]
32. S. Al Awaida, B. Al-Shargabi and T. Al-Rousan, “Automated Arabic essays grading system based onF-score and Arabic wordnet,” Jordanian Journal of Computers and Information Technology, vol. 5, no. 3, pp. 170–180, 2019. [Google Scholar]
33. O. Nael, Y. ELmanyalawy and N. Sharaf, “AraScore: A deep learning-based system for Arabic short answer scoring,” Array, vol. 13, no. 4, pp. 100109, 2022. [Google Scholar]
34. R. M. Badry, M. Ali, E. Rslan and M. R. Kaseb, “Automatic Arabic grading system for short answer questions,” IEEE Access, vol. 11, pp. 39457–39465, 2023. [Google Scholar]
35. S. B. Kotsiantis, D. Kanellopoulos and P. E. Pintelas, “Data preprocessing for supervised learning,” International Journal of Computer Science, vol. 1, no. 2, pp. 111–117, 2006. [Google Scholar]
36. R. Ghorbani and R. Ghousi, “Comparing different resampling methods in predicting students’ performance using machine learning techniques,” IEEE Access, vol. 8, no. 1, pp. 67899–67911, 2020. [Google Scholar]
37. A. Nabil, M. Seyam and A. Abou-Elfetouh, “Prediction of students’ academic performance based on courses’ grades using deep neural networks,” IEEE Access, vol. 9, pp. 140731–140746, 2021. [Google Scholar]
38. J. Xu, J. Mu and G. Chen, “A multi-view similarity measure framework for trouble ticket mining,” Data & Knowledge Engineering, vol. 127, pp. 101800, 2020. [Google Scholar]
39. E. Bisong, “Introduction to Scikit-learn,” in Building Machine Learning and Deep Learning Models on Google Cloud Platform: A Comprehensive Guide for Beginners, 1st ed., vol. 18. New York, USA: Springer, pp. 215–229, 2019. [Google Scholar]
40. E. A. Amrieh, T. Hamtini and I. Aljarah, “Mining educational data to predict student’s academic performance using ensemble methods,” International Journal of Database Theory and Application, vol. 9, no. 8, pp. 119–136, 2016. [Google Scholar]
41. S. Khalid, T. Khalil and S. Nasreen, “A survey of feature selection and feature extraction techniques in machine learning,” in 2014 Science and Information Conf., London, UK, pp. 372–378, 2014. [Google Scholar]
42. J. Miao and L. Niu, “A survey on feature selection,” in Procedia Computer Science, Asan, Korea, vol. 91, pp. 919–926, 2016. [Google Scholar]
43. A. E. E. D. Rashed, H. M. Amer, M. El-Seddek and H. E. D. Moustafa, “Sequence alignment using machine learning-based Needleman-Wunsch algorithm,” IEEE Access, vol. 9, pp. 109522–109535, 2021. [Google Scholar]
44. I. Guyon, J. Weston, S. Barnhill and V. Vapnik, “Gene selection for cancer classification using support vector machines,” Machine Learning, vol. 46, no. 1, pp. 389–422, 2002. [Google Scholar]
45. P. M. Granitto, C. Furlanello, F. Biasioli and F. Gasperi, “Recursive feature elimination with random forest for PTR-MS analysis of agroindustrial products,” Chemometrics and Intelligent Laboratory Systems,vol. 83, no. 2, pp. 83–90, 2006. [Google Scholar]
46. A. Liaw and M. Wiener, “Classification and regression by randomForest,” R News, vol. 2, no. 3, pp. 18–22, 2002. [Google Scholar]
47. M. B. Kursa and W. R. Rudnicki, “Feature selection with the Boruta package,” Journal of Statistical Software, vol. 36, no. 11, pp. 1–13, 2010. [Google Scholar]
48. W. Paja, K. Pancerz and P. Grochowalski, “Generational feature elimination and some other ranking feature selection methods,” in Advances in Feature Selection for Data and Pattern Recognition, 1st ed.,vol. 6. Charm, Switzerland: Springer, pp. 6.1–6.4, 97–112, 2018. [Google Scholar]
49. R. N. Afungang, C. V. de Meneses Bateira and C. A. Nkwemoh, “Assessing the spatial probability of landslides using GIS and informative value model in the Bamenda highlands,” Arabian Journal of Geosciences, vol. 10, no. 384, pp. 1–15, 2017. [Google Scholar]
50. H. D. Hejazi and A. A. Khamees, “Opinion mining for Arabic dialect in social media data fusion platforms: A systematic review,” Fusion: Practice and Applications, vol. 9, no. 1, pp. 8–28, 2022. https://doi.org/10.54216/FPA.090101 [Google Scholar] [CrossRef]
51. P. K. Singh and G. J. McCabe Jr, “Plithogenic set for multi-variable data analysis,” International Journal of Neutrosophic Science, vol. 1, no. 2, pp. 81–89, 2020. https://doi.org/10.54216/IJNS.010204 [Google Scholar] [CrossRef]
Cite This Article
 Copyright © 2023 The Author(s). Published by Tech Science Press.
This work is licensed under a Creative Commons Attribution 4.0 International License , which permits unrestricted use, distribution, and reproduction in any medium, provided the original work is properly cited.


 Submit a Paper
 Propose a Special lssue
 View Full Text
 Download PDF
 Downloads
 Citation Tools