
 Submit a Paper
 Propose a Special lssue
 Open Access
ARTICLE

DT-Net: Joint Dual-Input Transformer and CNN for Retinal Vessel Segmentation
1 School of Information Science and Technology, Shijiazhuang Tiedao University, Shijiazhuang, China
2 School of Mathematics and Information Science, Zhangjiakou University, Zhangjiakou, China
* Corresponding Author: Yan Sun. Email:
(This article belongs to the Special Issue: Recent Advances in Ophthalmic Diseases Diagnosis using AI)
Computers, Materials & Continua 2023, 76(3), 3393-3411. https://doi.org/10.32604/cmc.2023.040091
Received 04 March 2023; Accepted 28 June 2023; Issue published 08 October 2023
 View Full Text
 Download PDF
Abstract
Retinal vessel segmentation in fundus images plays an essential role in the screening, diagnosis, and treatment of many diseases. The acquired fundus images generally have the following problems: uneven illumination, high noise, and complex structure. It makes vessel segmentation very challenging. Previous methods of retinal vascular segmentation mainly use convolutional neural networks on U Network (U-Net) models, and they have many limitations and shortcomings, such as the loss of microvascular details at the end of the vessels. We address the limitations of convolution by introducing the transformer into retinal vessel segmentation. Therefore, we propose a hybrid method for retinal vessel segmentation based on modulated deformable convolution and the transformer, named DT-Net. Firstly, multi-scale image features are extracted by deformable convolution and multi-head self-attention (MHSA). Secondly, image information is recovered, and vessel morphology is refined by the proposed transformer decoder block. Finally, the local prediction results are obtained by the side output layer. The accuracy of the vessel segmentation is improved by the hybrid loss function. Experimental results show that our method obtains good segmentation performance on Specificity (SP), Sensitivity (SE), Accuracy (ACC), Curve (AUC), and F1-score on three publicly available fundus datasets such as DRIVE, STARE, and CHASE_DB1.Keywords
The vessels in fundus images are currently the only microvascular system that can be directly visualized non-invasively and painlessly. The pathological characteristics of related diseases can be observed by the morphology and changing information of retinal vessels. For example, diabetic patients are prone to retinopathy, macular degeneration, and blindness [1–3]. The retinal vessels of hypertensive patients have higher curvature and narrowing, which can easily lead to retinal hemorrhage [4]. Therefore, visualizing the distribution and details of retinal vessels can help doctors diagnose diseases more efficiently [5]. However, retinal vessels have the following problems: complex and diverse structures, tiny vessels, low contrast, and easy confusion with the background. A significant amount of time and effort is required to segment the vessels manually. Therefore, an automatic retinal vessel segmentation method is essential to assist doctors in diagnosing diseases quickly.
Artificial intelligence technology shortens the distance between human life and computer, and the method based on deep learning is applied to various tasks. For example, Sultan et al. used deep learning to deal with the segmentation task of high-resolution aerial images [6,7]. Liu et al. [8] and Qin et al. [9] applied deep learning to image fusion. Jin et al. [10] applied deep learning to classification tasks to provide accurate ERM automatic grading for clinical practice. Deep learning is also widely used in the task of medical image segmentation [11,12] and other fields [13,14]. Among them, convolutional neural networks (CNN) have made great progress in location-sensitive tasks [15–17]. In recent years, U-Net [18] based on the full convolution network (FCN) [19] has been widely used in medical image segmentation [20–24]. However, U-Net is difficult to deal with irregular and tiny vessels. M-Net [25] is an improved U-Net framework that uses the image pyramid mechanism to realize multi-level receptive fields and can learn image features at different scales. However, the feature filtering is not realized in the hopping connection in the M-Net model. ResU-Net [26] is derived from the U-Net architecture. It uses residual blocks to replace convolutional layers and increases the depth of the model to get more vessel features. But the contrast-limited adaptive histogram equalization (CLAHE) operation increases the noise of the image. UNet++ [27] redesigns the skip connection part of U-Net, which is the aggregation of features of different semantic scales in the decoder. But it consumes too much memory and takes a lot of time on small datasets. IterNet [28] is an encoder-decoder model like U-Net, which adopts U-Net as the basic module to improve the connectivity of vessel segmentation results by expanding the depth of the model through multiple iterations.
Based on U-Net, Deformable U-Net (DUNet) [29] adds deformable convolution [30] to adaptively adjust the receptive field according to the size and shape of vessels and improve segmentation accuracy and noise immunity. MAU-Net [31] uses modulated deformable convolution [32] as an encoding and decoding unit and uses position and channel attention block to realize vascular segmentation. Recently, the transformer has been successfully applied to the field of computer vision. Inspired by this, TransUNet uses a hybrid of CNN and transformer as an encoder and uses a skip connection and decoder for medical image segmentation [33]. The encoder, bottleneck, and decoder of Swin-Unet [34] use the Swin-transformer block [35] to realize medical image segmentation. FAT-Net [36] implements a dual encoder, including both CNN and transformer branches, to achieve skin lesion segmentation. Although it can get better performance, these models based on the transformer are both complicated and time-consuming, which will influence the practicability to some extent.
These segmentation methods have the following problems: (1) The method used can only extract the local information in the image and can not deal with the global features. (2) The accuracy of segmentation is low. (3) The structural information in the vascular image can not be obtained well. Given the above problems, we use deformable convolution to extract complex and variable structural information, which has better learning ability than ordinary convolution. In addition, we use the transformer to capture long-term dependencies through a self-attention mechanism and help CNN overcome its inherent spatially induced biases [37]. Therefore, a segmentation network based on a combination of deformable convolution [32] and transformer is proposed to solve the challenging task of retinal vessel segmentation. The proposed network uses convolution to extract local features and the transformer to construct long-term dependencies. And pre-training on large-scale datasets is not required and achieves better results on small-scale datasets. Our main contributions are summarized as follows:
(1) We propose an end-to-end deep learning network named DT-Net, which is very effective for retinal vessel segmentation. The network takes into account multi-scale input, structural information, and long-term dependency, and provides more powerful technical support for clinical diagnosis and processing.
(2) Combine deformable convolution with transformer. Deformable convolution can extract structural information in retinal vessels. Transformer makes up for the defect that CNN can only obtain local information and enhances the extraction ability of feature information to achieve a better segmentation effect.
(3) A dual-input MHSA algorithm was proposed to extract multi-scale image information of fundus vascular images with different resolutions. The output of multi-scale image information is fused by skip connection to compensate for the information loss in feature extraction. A mixed loss function was used to improve the accuracy of retinal vessel segmentation.
(4) We conducted experiments on DRIVE, STARE, and CHASE_DB1 with accuracy rates of 96.31%, 97.03%, and 97.37%, respectively. The experimental results showed that our segmentation performance was superior to other methods.
The remainder of this paper is organized as follows: Section 2 describes our proposed approach in detail. Section 3 presents the fundus dataset, preprocessing methods, and experimental results. Finally, we conclude with a summary and outlook in Section 4.
The architecture of the proposed DT-Net is shown in Fig. 1. It consists of four main parts: encoder, decoder, multi-scale input and side output. We improve on U-Net, one of the simplest and most popular architectures in medical image segmentation. Firstly, because the information obtained by the single-scale input of U-Net is limited, we use multi-scale layers to construct image pyramid input, and average pooling is used on the retinal images of size
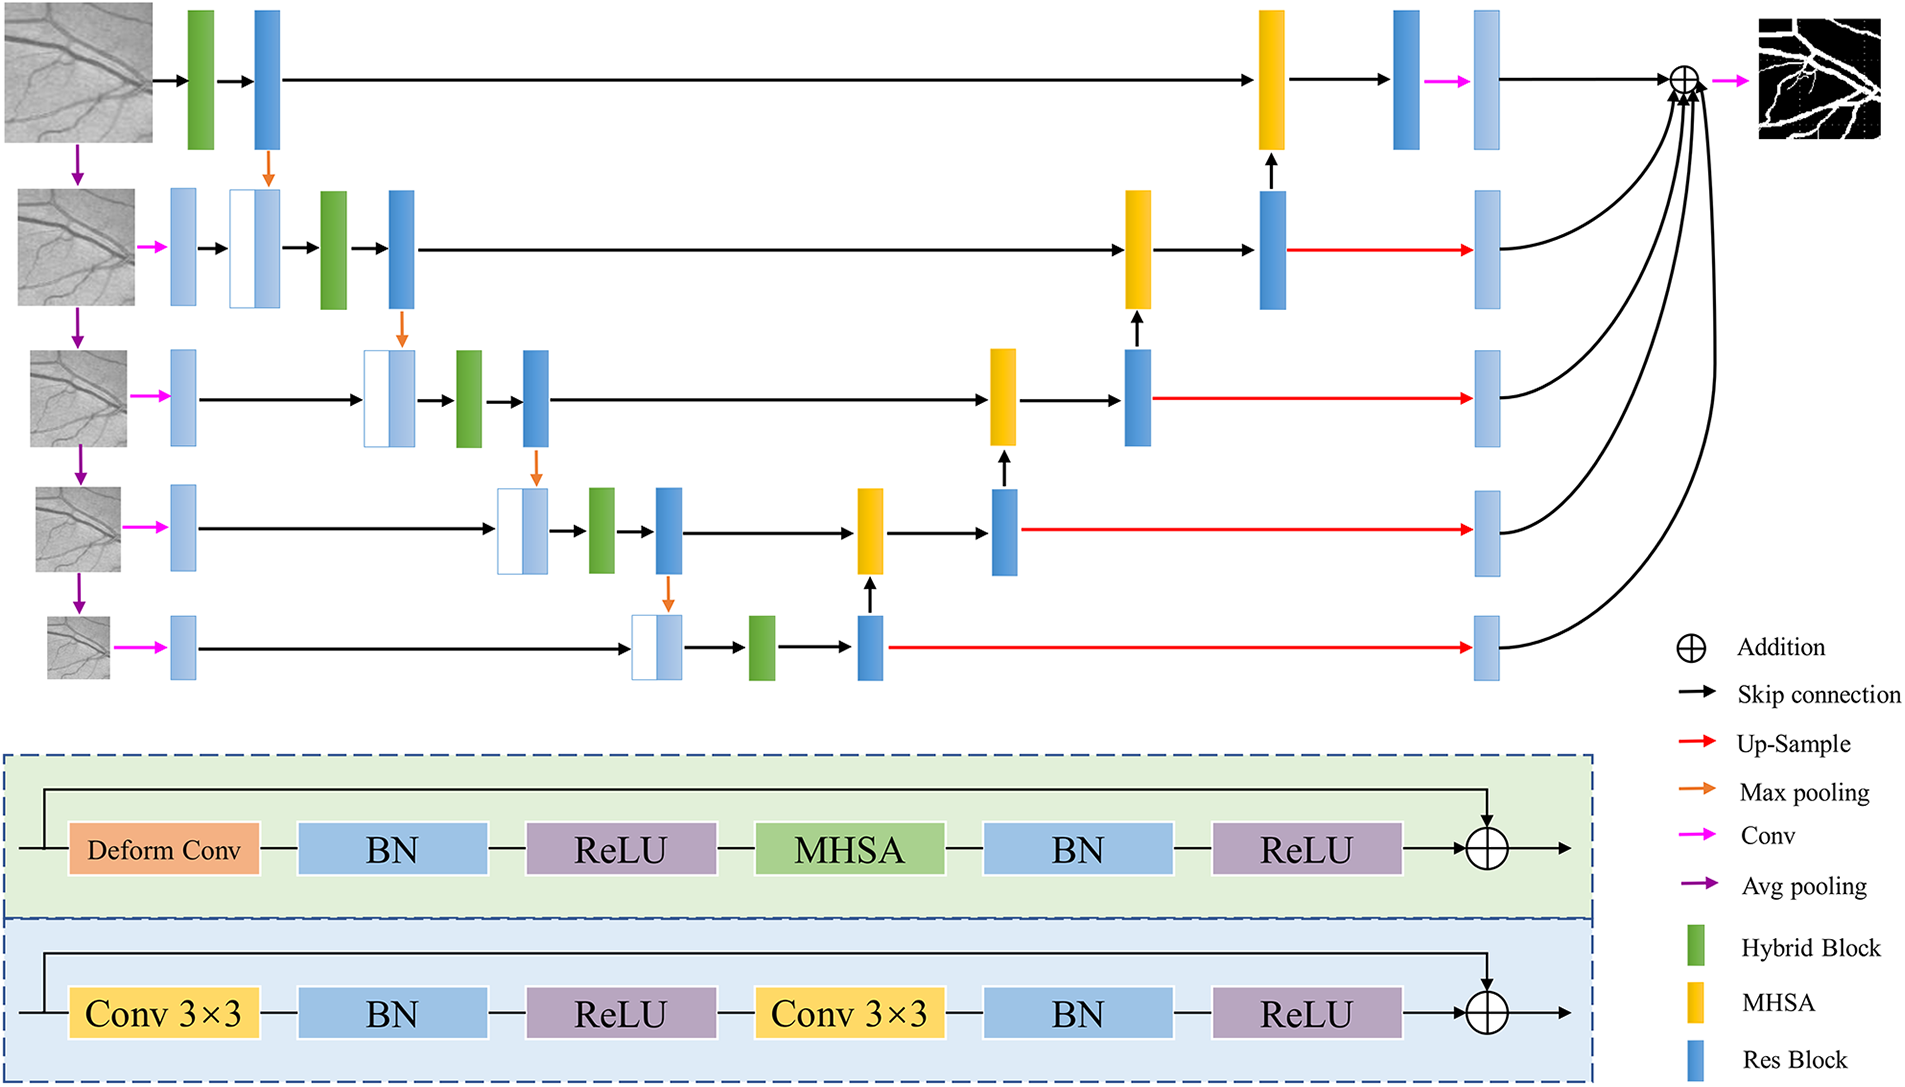
Figure 1: DT-Net network architecture diagram
This paper uses a novel decoder structure to fuse the high-resolution and low-resolution information. The decoder uses dual-input MHSA to obtain low-resolution and high-resolution information and then passes through the residual block [38] to achieve feature reuse, alleviate the problem of gradient disappearance, prevent the occurrence of overfitting, and improve segmentation capabilities. The blue-shaded part at the bottom of Fig. 1 is the structure of the residual block. Finally, multi-scale features are fused using image information at different scales. This structure of first down-sampling and then up-sampling reduces the risk of overfitting to a certain extent. In the side output path, the feature map is spatially up-sampling, and then
Most of the original CNN extract feature information at a fixed position in an image based on a fixed receptive field structure, and cannot adaptively generate deformable receptive fields and convolution kernel shapes according to different image features [39]. However, the vessel structure is irregular and complex, and the introduction of deformable convolution can enhance the construction ability of retinal vessel geometric deformation. On the basis of the traditional convolution, the deformable convolution increases the direction vector of the convolution kernel to make the shape of the convolution kernel closer to the feature. A learnable offset is introduced into the deformable convolution. Offset learning is the use of interpolation algorithm, through back propagation learning. The effective receptive field can more accurately cover the actual shape of the vessel to learn more features. Therefore, deformable convolution is used in this paper to enhance the generalization ability of the adaptability to different position information of the image and the mapping ability during the convolution process. The deformable convolution formula is as follows:
Let
2.3 Multi-Head Self-Attention Mechanism
MHSA is an attention mechanism that pays more attention to the internal structure, inherently has a global receptive field, and is good at capturing long-distance dependencies. The input feature map can be expressed as
where three
Because the image is highly structured data, in the local characteristics of high resolution, in addition to the border area, most of the pixels with similar features. Therefore, computing the attention among all pixels is very inefficient and redundant. So, we propose an efficient self-attention for the task of vessel segmentation, as shown in Fig. 2. The proposed self-attention decoder architecture is used to recover detailed information from the skip connections of the encoder, where
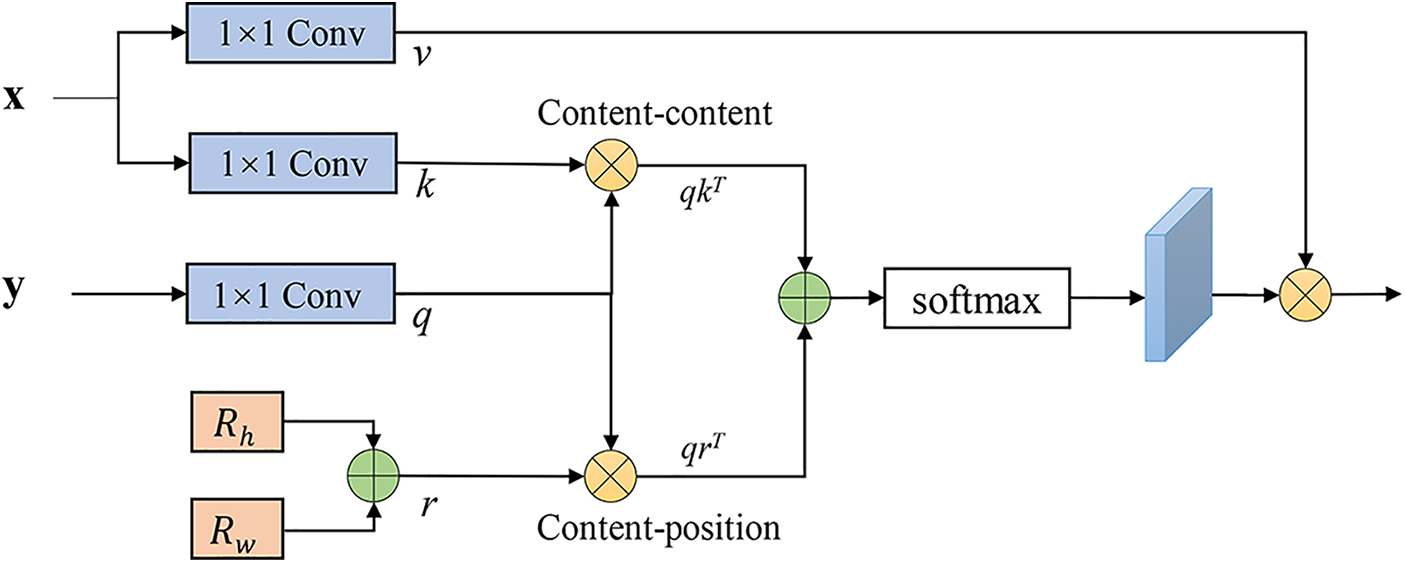
Figure 2: MHSA decoder
Loss function has a significant influence on deep learning training tasks. Most existing methods use only a single loss function to evaluate the network performance. Image segmentation tasks usually use cross-entropy as a loss function, and the ratio of foreground and background pixels in the retinal image is severely imbalanced, resulting in the features of retinal vessels cannot be effectively learned by the model. In the binary segmentation task, the Dice loss function can alleviate the above problems, and its essence is to measure the degree of overlap between two samples However, adjusting the weight of the network according to a single loss function can easily lead to the loss of the feature information of the middle and lower layers of the network. Mixed loss can effectively help the model training and enhance segmentation quality. Therefore, the network is trained using a hybrid loss function. Compare the output with the ophthalmologist’s criteria and calculate the loss between them:
where
where
In this paper, we run all experiments based on Windows 10, Intel Core i5-10400F CPU, GeForce GTX 1080ti GPU, Python 3.7 language, and PyTorch deep learning framework. The parameters in the network are optimized using the Adam optimizer with an initial learning rate of 0.0005 and a weight decay of 0.001. To dynamically adjust the training process, a cosine annealing strategy is utilized to update the learning rate. The proposed DT-Net framework is trained for 200 epochs with a batch size of 2. Fig. 3 shows the loss function curves of the proposed method for training and verifying datasets relative to iteration on three datasets: DRIVE [41], STARE [42], and CHASE_DB1 [43]. The horizontal coordinate of the image is the iteration period “Epoch”, and the ordinate is the loss value “Loss”. Legend “training” means training, and Legend “validation” means validation. When the proposed method is trained on three datasets, the training and validation losses converge rapidly within 50 epochs, flatten out within 150 epochs, and then reach a stable value.
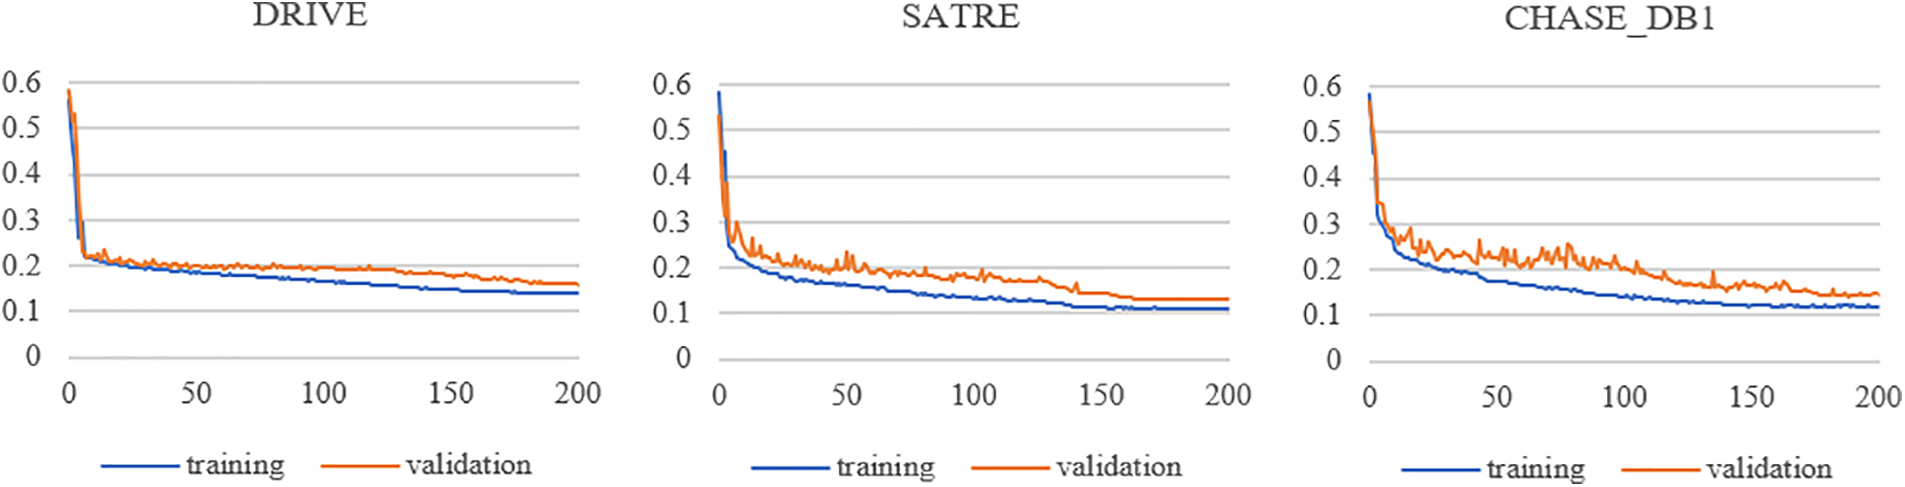
Figure 3: Loss function curves vs. iterations for the training and validation datasets
We use the public and widely used standard datasets DRIVE, STARE, and CHASE_DB1 as the training and testing datasets of the proposed network. Sample images for the three datasets are shown in Fig. 4, along with their ground truth vessel segmentation masks and field-of-view (FOV) masks. The DRIVE dataset consists of 40 fundus images with an image resolution of 584 × 565, and it is specified that the training set and the test set both contain 20 images. The STARE dataset consists of 20 fundus images with an image resolution of 700 × 605, including 10 retinal images with pathological features. This dataset can evaluate the ability of the model to segment abnormal fundus images. The CHASE_DB1 dataset consists of 28 retinal images of 14 children with an image resolution of 960 × 999. Since the STARE and CHASE_DB1 datasets do not officially specify the training set and test set, we use the first 10 images of the STARE dataset for model training according to DUNet [29], and the remaining 10 images are used for model performance evaluation. For the CHASE_DB1 datasets, we follow a common protocol [44], selecting the first 20 images for model training and the remaining 8 images for model performance evaluation. The three datasets contain the results of the manual segmentation of retinal images by two experienced ophthalmologists. We used the segmentation results of the first ophthalmologist as the ground truth for network training [45] and also as the standard segmentation results for network model and algorithm evaluation.

Figure 4: Sample images from DRIVE, STARE, and CHASE_DB1. (A) Original image; (B) ground truth; (C) field-of-view masks
Retinal images often contain noise and uneven illumination, so all images from these three datasets undergo four kinds of preprocessing for image enhancement before the training and testing datasets of the network. The preprocessing process of the fundus images is shown in Fig. 5. Firstly, the color images are converted into grayscale images, simplifying the subsequent preprocessing steps and reducing the computation during training. Secondly, each pixel in the grayscale image is normalized to reduce the data dimension and speed up the convergence. Then, the CLAHE method [46] is used to suppress image noise and enhance the details of the vessel and the contrast between the vessel and background. Finally, nonlinear transformation and gamma correction are performed to solve the image quality problem caused by the brightness of the input images, enhance the contrast, make the vessel in the darker area clearer, and improve the image quality. After the above processing, it can be found that the distinction between the retinal vessel and the background is significantly improved at this time, which is conducive to feature extraction in the training process and enhances the segmentation quality of the retinal vessel.

Figure 5: Image preprocessing of fundus images, from left to right, are original image, image graying, image normalization, gradient histogram equalization, gamma correction, original images patches, and ground truth patches
Due to the limited number of images in the fundus datasets, patch processing is adopted to expand the datasets to reduce the effect of overfitting. In the training process, each image of the pre-processed datasets is first randomly cropped into a patch of size 64 × 64 for the training of the network. The corresponding patches are also extracted from the ground truth to ensure the original images and the ground truth. In the experiments, 90% of the extracted patches are used for training and the remaining 10% are used for validation. Fig. 5 shows some image patches and the corresponding ground truth of the fundus images.
Similar to most methods of retinal image segmentation, we will compare the proposed DT-Net method with other algorithms and evaluate it through the following indicators: Accuracy (ACC), Specificity (SP), Sensitivity (SE), F1-score, and Area Under Receiver Operating Characteristic (ROC) Curve (AUC). Acc is used to evaluate the overall segmentation performance of the model. The larger the ACC, the more accurate the segmentation. The specific mathematical expression is as follows:
SP is an important metric of retinal vessel segmentation. It is the ratio of correct negative predictions to the total number of negative predictions. It mainly evaluates the ability to recognize background in retinal images. The better the SP value, the lower the false positive rate (FPR). The specific mathematical expression is as follows:
SE mainly evaluates the ability to recognize retinal vessels (positive) in retinal images. It is the ratio of correct positive predictions to the total number of positive predictions in the predicted results. The specific mathematical expression is as follows:
F1-score for evaluation of segmentation results and the similarity criteria of ophthalmology. The larger the value is, the closer the algorithm segmentation result is to the gold standard, and the segmentation effect. The specific mathematical expression is as follows:
Among them, true positive (TP) means correctly identified vessel pixels, true negative (TN) means correctly identified non-vessel pixels, false positive (FP) means non-vessel pixels identified as vessels, and false negative (FN) means vessel pixels identified as non-vessel.
In addition, we also introduce AUC to evaluate the segmentation performance of the model. AUC is a professional metric of retinal vessel segmentation. The closer its value is to 1, the better the performance of the algorithm and the stronger the robustness. The ROC curve describes the relationship between the true position rate and the false position rate under the different classification thresholds. The closer the value of the area under the AUC is to 1, the better the algorithm performs and the more robustness.
To further verify the effectiveness of the proposed network for vessel segmentation, we conduct ablation experiments on the DRIVE dataset. The prediction results of the network are compared in terms of five performance metrics: ACC, SE, SP, AUC, and F1-score. To more clearly see the improvement of the accuracy of retinal vessel segmentation by each module proposed in the model, the segmentation performance of different methods is shown in Table 1. M0 uses a hybrid loss function based on U-Net. M1 adds multiple inputs and side outputs based on M0. M2 adds the encoder hybrid block based on M1. M3 adds the transformer decoder block based on M1. M4 adds the encoder hybrid block and transformer decoder block based on M1.

As shown in Table 1, when multi-scale input and side output is added to M0, each index is significantly improved, and the segmentation performance of the network is improved. After adding the hybrid block to the network, AUC and F1-score in M2 are 0.51% and 2.01% higher than M1, respectively, which verifies the effectiveness of the hybrid block. In M3, SE, AUC, and F1-score are 4.25%, 0.3%, and 2.3% higher than M1, respectively. It is shown that the proposed MHSA decoder block is effective in retinal vessel segmentation and enhances the performance of retinal vessel segmentation.
We can see from the last row of Table 1 that the values of SE, AUC, and F1-score of the proposed network are increased from 74.68%, 96.70%, 81.13% of M0 to 86.36%, 98.43%, 84.88%, respectively. Experiments show that using either the hybrid block of the encoder or the attention block of the decoder can improve the segmentation performance of the network, which shows their rationality and effectiveness. Therefore, the proposed method has advantages in retinal vessel segmentation.
Ablation experiments are performed by setting different loss functions to verify which loss function is more suitable for the proposed method. The effects of varying loss functions on performance indexes are shown in Table 2. First, “DT+BCE” uses a BCE loss function to train the network. “DT+Dice” uses the Dice loss function. “DT+BCE+Dice” combines the BCE loss function and the Dice loss function. The results in Table 2 show that almost all the metrics are improved with the help of the hybrid loss, which proves that the hybrid loss contributes to enhancing the accuracy of the model.

The learning rate, as an essential parameter in the process of model training, controls the learning progress of the network model. To explore the influence of different learning rates on segmented images, Table 3 shows the segmentation results when the learning rate of this method is 0.0001, 0.0003, 0.0005, 0.0007, 0.0009, and 0.0011. When the learning rate is set to 0.0005, the best performance is achieved for all metrics. When the learning rate increases or decreases, both F1-score and AUC will decrease.

3.5 Comparison with Other Methods
We chose five other retinal vessel segmentation methods to compare with our method to prove the advantages of the proposed method. The five methods are U-Net [18], DUNet [24], GT U-Net [47], Attention Residual U Network (AReN-UNet) [48], and Multistage Dual-Path Interactive Refinement Network (Multistage DPIRef-Net) [49]. For a better comparison with these methods, these models are trained using the same experimental settings as in this paper. In addition, we compare the performance with UNet++ [27], Li et al. proposed mothed [44], D-MNet [50], WA-Net [51], and TUnet-LBF [52]. Among them, GT U-Net modifies both the encoder and decoder to achieve good performance on tooth segmentation. The AReN-UNet proposes a novel cascaded network driven by integrating attention and residual modules. It improves convergence and stability and reduces vessel breakdown in the vessel map. Multistage DPIRef-Net uses multi-stage dual-path interaction to refine the network, retain the vascular branch edges, suppress the false positive rate, and accurately segment the arteriovenous vascular map of the retinal surface. The Multistage DPIRef-Net is a vessel segmentation architecture with a single encoder and dual decoder. It requires annotated labels of arteries and veins, while our network uses only one kind of annotated label. Therefore, to be fair, we use the experimental data of this paper in the same experimental setting, i.e., using one kind of annotated label. The modified network mainly consists of one backbone network and three single-path stages. The D-MNet uses deformable convolution and attention modules to improve the accuracy and connectivity of vessel segmentation.
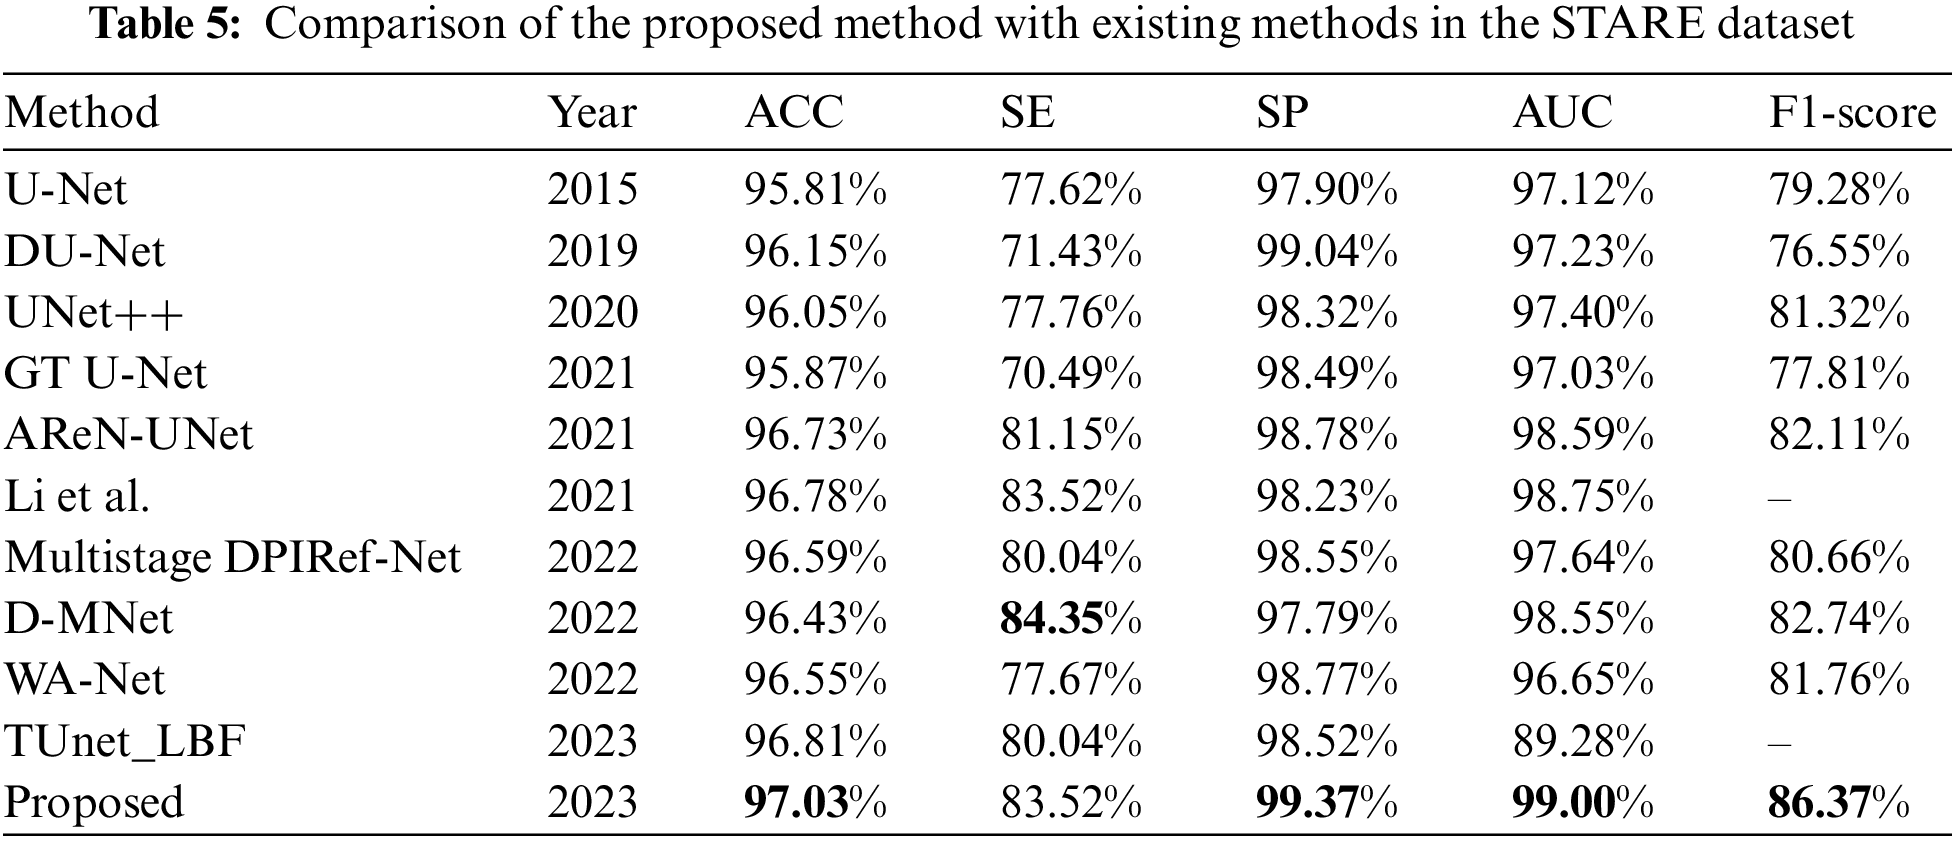
Tables 4–6 evaluate the different vessel segmentation methods in the DRIVE, STARE, and CHASE_DB1 datasets. Because there are more background pixels than vessel pixels in the fundus images, AUC and F1-score metrics are more suitable for evaluating the vessel segmentation method. In Table 4, compared with the maximum of existing methods, our proposed method performs better on the DRIVE dataset. There is a 2.83% increase in SE, 0.2% in SP, 0.22% in AUC, and 1.22% in F1-score, respectively. The highest SE and SP of the proposed model means that retinal vessels can be identified more accurately, and noise information can be suppressed. This is because the MHSA mechanism focuses on capturing global vessel details. We can observe from Table 5 that the proposed method achieves the best performance for ACC, SP, AUC, and F1-score on STARE datasets compared to other methods. The proposed method performs better, indicating that the framework is effective for vessel segmentation. Since there are many lesion images in the STARE dataset, the SE is not optimal all metrics of our method are highest on the CHASE_DB1 dataset except the SE and ACC metric. On the whole, our method performs well. As seen from Tables 4–6, the proposed method has the highest F1-score metrics on the three datasets compared to the maximum value of each metric of the other methods, with an increase of 1.85%, 3.61%, and 0.26%, respectively. This indicates that the proposed method can distinguish retinal vessel pixels and background pixels effectively and accurately. In general, compared with these methods, the proposed method can segment retinal vessels more accurately and has good prospects for application in clinical medical imaging diagnosis.


To further observe the segmentation results of the models, partial segmentation results on the three datasets are given for visual comparison, as shown in Figs. 6–8. It can be seen that the DT-Net model produces more details of the vessel segmentation. Compared with U-Net, DT-Net can detect more vessels. Compared with DUNet and GT U-Net, DT-Net can detect some details of missing vessels and thus complete segmentation more efficiently. Compared with AReN-UNet and Multistage DPIRef-Net, DT-Net has better vessel continuity. We can observe that the DT-Net is superior to the other five methods on three datasets. As can be seen in Figs. 6–8, the segmentation effect of the proposed method is very close to the standard of ophthalmologist manual segmentation, obtaining more continuous vessels. It can successfully segment the continuous tiny vessels and has good generalization ability when segmenting different datasets. This proves the network can reduce background noise, enhance contrast, and preserve irregular vessels well. Visualization further illustrates the importance of multi-scale contextual information and capturing long-term dependencies in retinal vessel segmentation. This suggests that the proposed method can segment retinal vessel images, help specialized physicians in disease diagnosis, and reduce the workload of clinical medical specialists. In addition, we use the ROC curve to evaluate the model, shown in Fig. 9. The closer the ROC curve is to the upper left boundary, the more accurate the network is. Fig. 10 shows a locally enlarged view of the tiny vessel in the segmentation result. This is because, in retinal images, tiny vessels are not significantly different from the image background. Therefore, to help the network pay attention to essential features and suppress unnecessary features, we use the MHSA mechanism in both the encoder and decoder. It can be seen from Fig. 10 that the proposed algorithm has good robustness to the intersection of the vessel and tiny vessel areas with low contrast and maintains the degree and connectivity of thick and thin vessels, and the segmentation results of the lesion region are relatively close to the standard segmentation. The reliability and robustness of this algorithm for retinal vessel segmentation are verified. The above experimental results can prove that the performance of the proposed model is generally better, it can more accurately identify vessels and backgrounds, and segment tiny vessels better.

Figure 6: The segmentation results of different models on DRIVE datasets. (A) Original images; (B) ground truth images; (C) U-Net; (D) DUNet; (E) GT U-Net; (F) AReN-UNet; (G) multistage DPIRef-Net; (H) ours

Figure 7: The segmentation results of different models on STARE datasets. (A) Original images; (B) ground truth images; (C) U-Net; (D) DUNet; (E) GT U-Net; (F) AReN-UNet; (G) multistage DPIRef-Net; (H) ours

Figure 8: The segmentation results of different models on CHASE_DB1 datasets. (A) Original images; (B) ground truth images; (C) U-Net; (D) DUNet; (E) GT UNet; (F) AReN-UNet; (G) multistage DPIRef-Net; (H) ours

Figure 9: The ROC curves of the DT-Net model on different datasets. (A) DRIVE dataset. (B) STARE dataset. (C) CHASE DB1 dataset

Figure 10: Partial increased view of different models on different datasets. From top to bottom are the fundus images from the DRIVE, STARE, and CHASE DB1 datasets. From left to right: (A) original images; (B) partial views; (C) ground truth; (D) U-Net; (E) DUNet; (F) GT U-Net; (G) AReN-UNet; (H) multistage DPIRef-Net; (I) ours
In our work, we propose a hybrid convolution and transformer network evolved from the classical model U-Net, which aims to aggregate multi-scale feature information at different resolutions to achieve accurate and efficient vessel segmentation. The fundus image is full of noise and low contrast. Therefore, we first preprocess to improve image contrast and suppress the background noise of the source image. To fully use multi-scale information, DT-Net uses multi-scale images as input, and then we introduce deformable convolution to change the convolution kernel according to the actual shape of blood vessels to obtain more accurate structural information. Meanwhile, the MHSA mechanism is used to capture the distant relationship of fundus images, making up for the defect that CNN cannot extract global features.
In addition, the proposed network is verified by ablative experiments. The ACC and AUC indexes of the network improved significantly after the addition of a mixing block to the encoder, and the SE and F1-scoring indexes of the network improved significantly after the addition of a transformer decoder block. Of course, the current study of DT-Net proposed has the following shortcomings: (1) Due to the similarity between the background and blood vessels in the datasets, our method cannot achieve the best performance in each index; (2) They inevitably lose some container details due to constant up-sampling. In the future, we will introduce more advanced methods, such as the encoding pattern in Swin-Unet, to preserve more details in the original image and make our model perform better on various metrics.
We propose a network named DT-Net for fundus blood vessel segmentation. The performance of this method is mainly improved by the introduction of variable convolution and multiple self-attention mechanisms, which not only extract the structural information easily ignored in fundus blood vessel images but also effectively extract information at different scales. And the DT-Net presented in the DRIVE, STARE, and CHASE_DB1 datasets is significantly improved. Experimental results show that this method can better process different fundus data sets, has better generalization ability, and provides more accurate segmentation results for medical diagnosis and treatment. In terms of segmentation results, our model can segment more vascular details and has better connectivity.
Acknowledgement: We thank the High-Performance Computing Center of the Shijiazhuang Tiedao University for their support.
Funding Statement: This work was supported in part by the National Natural Science Foundation of China under Grant 61972267; the National Natural Science Foundation of Hebei Province under Grant F2018210148; the University Science Research Project of Hebei Province under Grant ZD2021334.
Author Contributions: WJ and SM design of study, analysis of data. WJ and SM conducted experiments and drafted the manuscript. PG and SM revised and edited the manuscript. YS and PG polished the manuscript. All authors reviewed the results and approved the final version of the manuscript.
Availability of Data and Materials: Publicly available datasets were analyzed in this study. This data can be found here: DRIVE: https://drive.grand-challenge.org; STARE: https://cecas.clemson.edu/~ahoover/stare/; CHASE_DB1: https://blogs.kingston.ac.uk/retinal/chasedb1.
Conflicts of Interest: The authors declare that they have no conflicts of interest to report regarding the present study.
References
1. A. Bilal, G. M. Sun and S. Mazhar, “Diabetic retinopathy detection using weighted filters and classification using CNN,” in IEEE Int. Conf. on Intelligent Technologies, Hubli, India, pp. 1–6, 2021. [Google Scholar]
2. A. Bilal, G. M. Sun, Y. Li, S. Mazhar and A. Q. Khan, “Diabetic retinopathy detection and classification using mixed models for a disease grading database,” IEEE Access, vol. 9, pp. 23544–23553, 2021. [Google Scholar]
3. A. Bilal, G. M. Sun and S. Mazhar, “Survey on recent developments in automatic detection of diabetic retinopathy,” Journal Français d’Ophtalmologie, vol. 44, no. 3, pp. 420–440, 2021. [Google Scholar] [PubMed]
4. K. Kipli, M. E. Hoque, L. T. Lim, M. H. Mahmood, S. K. Sahari et al., “A review on the extraction of quantitative retinal microvascular image feature,” Computational and Mathematical Methods in Medicine, vol. 2018, no. 4, pp. 1–21, 2018. [Google Scholar]
5. R. Xu, T. T. Liu, X. C. Ye, F. Liu, L. Lin et al., “Joint extraction of retinal vessels and centerlines based on deep semantics and multi-scaled cross-task aggregation,” IEEE Journal of Biomedical and Health Informatics, vol. 25, no. 7, pp. 2722–2732, 2021. [Google Scholar] [PubMed]
6. K. Sultan, A. Louai and B. Saleh, “DSMSA-Net: Deep spatial and multi-scale attention network for road extraction in high spatial resolution satellite images,” Arabian Journal for Science and Engineering, vol. 48, pp. 1907–1920, 2022. [Google Scholar]
7. K. Sultan, A. Louai and B. Sale, “An encoder-decoder deep learning framework for building footprints extraction from aerial imagery,” Arabian Journal for Science and Engineering, vol. 48, no. 2, pp. 1723–1284, 2023. [Google Scholar]
8. H. R. Liu, M. Z. Liu, D. F. Li, W. F. Zheng, L. R. Yin et al., “Recent advances in pulse-coupled neural networks with applications in image processing,” Electronics, vol. 11, no. 20, pp. 3264, 2022. https://doi.org/10.3390/electronics11203264 [Google Scholar] [CrossRef]
9. X. M. Qin, Y. X. Ban, P. Wu, B. Yang, S. Liu et al., “Improved image fusion method based on sparse decomposition,” Electronics, vol. 11, no. 15, pp. 2321, 2022. [Google Scholar]
10. K. Jin, Y. Yan, S. Wang, C. Yang, M. Chen et al., “iERM: An interpretable deep learning system to classify epiretinal membrane for different optical coherence tomography devices: A multi-center analysis,” Journal of Clinical Medicine, vol. 12, no. 2, pp. 400, 2023. [Google Scholar] [PubMed]
11. E. Shibuya and K. Hotta, “Feedback U-Net for cell image segmentation,” in IEEE/CVF Conf. on Computer Vision and Pattern Recognition Workshop, Seattle, WA, USA, pp. 974–975, 2020. [Google Scholar]
12. S. A. Taghanaki, K. Abhishek, J. P. Cohen, J. Cohen-Adad and G. Hamarneh, “Deep semantic segmentation of natural and medical images: A review,” Artificial Intelligence Review, vol. 54, no. 1, pp. 137–138, 2021. [Google Scholar]
13. H. Dai, G. Huang, H. Zeng and R. Yu, “Haze risk assessment based on improved PCA-MEE and ISPO-LightGBM model,” Systems, vol. 10, no. 6, pp. 263, 2022. [Google Scholar]
14. H. Zeng, B. Shao, H. Dai, Y. Yan and N. Tian, “Prediction of fluctuation loads based on GARCH family-CatBoost-CNNLSTM,” Energy, vol. 263, no. 6, pp. 126125, 2023. [Google Scholar]
15. Y. Gao, C. Liu and L. Zhao, “Multi-resolution path CNN with deep supervision for intervertebral disc localization and segmentation,” in Int. Conf. on Medical Image Computing and Computer-Assisted Intervention, Shenzhen, China, pp. 309–317, 2019. [Google Scholar]
16. N. Tajbakhsh, L. Jeyaseelan, Q. Li, J. N. Chiang, Z. Wu et al., “Embracing imperfect datasets: A review of deep learning solutions for medical image segmentation,” Medical Image Analysis, vol. 63, pp. 101693, 2020. [Google Scholar] [PubMed]
17. F. Isensee, P. F. Jaeger, S. A. A. Kohl, J. Petersen and K. H. Maier-Hein, “nnU-Net: A self-configuring method for deep learning-based biomedical image segmentation,” Nature Methods, vol. 18, no. 2, pp. 203–211, 2021. [Google Scholar] [PubMed]
18. O. Ronneberger, P. Fischer and T. Brox, “U-Net: Convolutional networks for biomedical image segmentation,” Medical Image Computing and Computer-Assisted Intervention, vol. 9351, pp. 234–241, 2015. [Google Scholar]
19. J. Long, E. Shelhamer, T. Darrell and M. Intelligence, “Fully convolutional networks for semantic segmentation,” IEEE Transactions on Pattern Analysis and Machine Intelligence, vol. 39, no. 4, pp. 640–651, 2017. [Google Scholar] [PubMed]
20. Y. Weng, T. Zhou, Y. Li and X. Qiu, “NAS-Unet: Neural architecture search for medical image segmentation,” in IEEE Conf. on Computer Vision and Pattern Recognition, Boston, Massachusetts, USA, pp. 44247–44257, 2019. [Google Scholar]
21. A. Bilal, L. C. Zhu, A. N. Deng, H. H. Lu and N. Wu, “AI-based automatic detection and classification of diabetic retinopathy using U-net and deep learning,” Symmetry, vol. 14, no. 7, pp. 1427, 2022. [Google Scholar]
22. A. Bilal, G. M. Sun, S. Mazhar, A. Imran and J. Latif, “A transfer learning and U-net-based automatic detection of diabetic retinopathy from fundus images,” Computer Methods in Biomechanics and Biomedical Engineering: Imaging & Visualization, vol. 10, no. 6, pp. 663–674, 2022. [Google Scholar]
23. A. Bilal, G. M. Sun, S. Mazhar and A. Imran, “Improved grey wolf optimization-based feature selection and classification using CNN for diabetic retinopathy detection,” Evolutionary Computing and Mobile Sustainable Networks, vol. 116, pp. 1–14, 2022. [Google Scholar]
24. F. Zhao, Z. Wu, L. Wang, W. Lin and G. Li, “Spherical deformable U-Net: Application to cortical surface parcellation and development prediction,” Computer Methods and Programs in Biomedicine, vol. 40, no. 4, pp. 1217–1228, 2021. [Google Scholar]
25. H. Fu, J. Cheng, Y. Xu, D. Wong, J. Liu et al., “Joint optic disc and cup segmentation based on multi-label deep network and polar transformation,” IEEE Transactions on Medical Imaging, vol. 37, no. 7, pp. 1597–1605, 2018. [Google Scholar] [PubMed]
26. D. Li, D. A. Dharmawan, B. P. Ng and S. Rahardja, “Residual U-Net for retinal vessel segmentation,” in IEEE Int. Conf. on Image Processing, Taipei, Taiwan, pp. 1425–1429, 2019. [Google Scholar]
27. Z. Zhou, M. Siddiquee, N. Tajbakhsh and J. Liang, “UNet++: Redesigning skip connections to exploit multiscale features in image segmentation,” IEEE Transactions on Medical Imaging, vol. 39, no. 6, pp. 1856–1867, 2020. [Google Scholar]
28. L. Li, M. Verma, Y. Nakashima, H. Nagahara and R. Kawasaki, “IterNet: Retinal image segmentation utilizing structural redundancy in vessel networks,” in IEEE Winter Conf. on Applications of Computer Vision, Snowmass Village, USA, pp. 3656–3665, 2020. [Google Scholar]
29. Q. Jin, Z. Meng, T. D. Pham, Q. Chen, L. Wei et al., “DUNet: A deformable network for retinal vessel segmentation,” Knowledge-Based Systems, vol. 178, pp. 149–162, 2019. [Google Scholar]
30. J. Dai, H. Qi, Y. Xiong, Y. Li, G. Zhang et al., “Deformable convolutional networks,” in IEEE Int. Conf. on Computer Vision, Venice, Italy, pp. 764–773, 2017. [Google Scholar]
31. H. Li, Y. K. Wang, C. Wan, J. X. Shen, Q. L. Yu et al., “MAU-Net: A retinal vessels segmentation method,” in Annual Int. Conf. of the IEEE Engineering in Medicine Biology Society, Montreal, QC, Canada, pp. 1958–1961, 2020. [Google Scholar]
32. X. Zhu, H. Hu, S. Lin and J. Dai, “Deformable convNets v2: More deformable, better results,” in IEEE/CVF Conf. on Computer Vision and Pattern Recognition, Seattle, USA, pp. 9300–9308, 2018. [Google Scholar]
33. J. Chen, Y. Lu, Q. Yu, X. Luo and Y. Zhou, “TransUNet: Transformers make strong encoders for medical image segmentation,” arXiv:2102.04306, 2021. [Google Scholar]
34. H. Cao, Y. Wang, J. Chen, D. Jiang, X. Zhang et al., “Swin-Unet: Unet-like pure transformer for medical image segmentation,” in Computer Vision—ECCV 2022 Workshops, Cham, pp. 205–218, 2023. [Google Scholar]
35. Z. Liu, Y. Lin, Y. Cao, H. Hu, Y. Wei et al., “Swin transformer: Hierarchical vision transformer using shifted windows,” in IEEE/CVF Int. Conf. on Computer Vision, Montreal, QC, Canada, pp. 9992–10002, 2021. [Google Scholar]
36. H. Wu, S. Chen, G. Chen, W. Wang, B. Lei et al., “FAT-Net: Feature adaptive transformers for automated skin lesion segmentation,” Medical Image Analysis, vol. 76, pp. 102327, 2022. [Google Scholar] [PubMed]
37. A. Dosovitskiy, L. Beyer, A. Kolesnikov, D. Weissenborn and N. Houlsby, “An image is worth 16 × 16 words: Transformers for image recognition at scale,” in Int. Conf. on Learning Representations, Vienna, Austria, pp. 1–12, 2021. [Google Scholar]
38. K. He, X. Zhang, S. Ren and J. Sun, “Deep residual learning for image recognition,” in IEEE Conf. on Computer Vision and Pattern Recognition, Las Vegas, NV, USA, pp. 770–778, 2016. [Google Scholar]
39. F. Chen, F. Wu, J. Xu, G. Gao, Q. Ge et al., “Adaptive deformable convolutional network,” Neurocomputing, vol. 453, pp. 853–864, 2021. [Google Scholar]
40. I. Bello, B. Zoph, Q. Le, A. Vaswani and J. Shlens, “Attention augmented convolutional networks,” in IEEE/CVF Int. Conf. on Computer Vision, Seoul, Korea (Southpp. 3286–3295, 2019. [Google Scholar]
41. J. Staal, M. D. Abramoff, M. Niemeijer, M. A. Viergever and B. V. Ginneken, “Ridge-based vessel segmentation in color images of the retina,” IEEE Transactions on Medical Imaging, vol. 23, no. 4, pp. 501–509, 2004. [Google Scholar] [PubMed]
42. A. Hoover, V. Kouznetsova and M. Goldbaum, “Locating blood vessels in retinal images by piecewise threshold probing of a matched filter response,” IEEE Transactions on Medical Imaging, vol. 19, no. 3, pp. 203–210, 2000. [Google Scholar] [PubMed]
43. C. G. Owen, A. R. Rudnicka, R. Mullen, S. A. Barman, D. Monekosso et al., “Measuring retinal vessel tortuosity in 10-year-old children: Validation of the computer-assisted image analysis of the retina (CAIAR) program,” Investigative Ophthalmology & Visual Science, vol. 50, no. 5, pp. 2004–2010, 2009. [Google Scholar]
44. X. Li, Y. Jiang, M. Li and S. Yin, “Lightweight attention convolutional neural network for retinal vessel image segmentation,” IEEE Transactions on Industrial Informatics, vol. 17, no. 3, pp. 1958–1967, 2021. [Google Scholar]
45. H. S. Wu, W. Wang, J. F. Zhong, B. Y. Lei, Z. K. Wen et al., “SCS-Net: A scale and context sensitive network for retinal vessel segmentation,” Medical Image Analysis, vol. 70, no. 1, pp. 102025, 2021. [Google Scholar] [PubMed]
46. S. M. Pizer, E. P. Amburn, J. D. Austin, R. Cromartie, A. Geselowitz et al., “Adaptive histogram equalization and its variations,” Computer Vision, Graphics, and Image Processing, vol. 39, no. 3, pp. 355–368, 1987. [Google Scholar]
47. Y. Li, S. Wang, J. Wang, G. Zeng, W. Liu et al., “GT U-Net: A U-Net like group transformer network for tooth root segmentation,” in Int. Workshop on Machine Learning in Medical Imaging, Virtual, pp. 386–395, 2021. [Google Scholar]
48. A. A. Rahman, B. Biswal, P. P. Geetha, S. Hasan and M. V. S. Sairam, “Robust segmentation of vascular network using deeply cascaded AReN-UNet,” Biomedical Signal Processing and Control, vol. 69, no. 3, pp. 102953, 2021. [Google Scholar]
49. G. Pavani, B. Biswal and T. K. Gandhi, “Multistage DPIRef-Net: An effective network for semantic segmentation of arteries and veins from retinal surface,” Neuroscience Informatics, vol. 2, no. 4, pp. 100074, 2022. [Google Scholar]
50. X. Deng and J. Ye, “A retinal blood vessel segmentation based on improved D-MNet and pulse-coupled neural network,” Biomedical Signal Processing and Control, vol. 73, pp. 103467, 2022. [Google Scholar]
51. D. E. Alvarado-Carrillo and O. S. Dalmau-Cedeno, “Width attention based convolutional neural network for retinal vessel segmentation,” Expert Systems with Applications, vol. 209, no. C, pp. 11, 2022. [Google Scholar]
52. H. Y. Zhang, W. H. Ni, Y. Luo, Y. N. Feng, R. X. Song et al., “TUnet-LBF: Retinal fundus image fine segmentation model based on transformer Unet network and LBF,” Computers in Biology and Medicine, vol. 159, pp. 106937, 2023. [Google Scholar] [PubMed]
Cite This Article
 Copyright © 2023 The Author(s). Published by Tech Science Press.
This work is licensed under a Creative Commons Attribution 4.0 International License , which permits unrestricted use, distribution, and reproduction in any medium, provided the original work is properly cited.
 Downloads
 Citation Tools