
 Submit a Paper
 Propose a Special lssue
 Open Access
ARTICLE
PLDMLT: Multi-Task Learning of Diabetic Retinopathy Using the Pixel-Level Labeled Fundus Images
Department of Computer Science and Engineering, Chongqing University of Technology, Chongqing, 400054, China
* Corresponding Author: Chuncheng Huang. Email:
(This article belongs to the Special Issue: Recent Advances in Ophthalmic Diseases Diagnosis using AI)
Computers, Materials & Continua 2023, 76(2), 1745-1761. https://doi.org/10.32604/cmc.2023.040710
Received 28 March 2023; Accepted 25 May 2023; Issue published 30 August 2023
 View Full Text
 Download PDF
Abstract
In the field of medical images, pixel-level labels are time-consuming and expensive to acquire, while image-level labels are relatively easier to obtain. Therefore, it makes sense to learn more information (knowledge) from a small number of hard-to-get pixel-level annotated images to apply to different tasks to maximize their usefulness and save time and training costs. In this paper, using Pixel-Level Labeled Images for Multi-Task Learning (PLDMLT), we focus on grading the severity of fundus images for Diabetic Retinopathy (DR). This is because, for the segmentation task, there is a finely labeled mask, while the severity grading task is without classification labels. To this end, we propose a two-stage multi-label learning weakly supervised algorithm, which generates initial classification pseudo labels in the first stage and visualizes heat maps at all levels of severity using Grad-Cam to further provide medical interpretability for the classification task. A multi-task model framework with U-net as the baseline is proposed in the second stage. A label update network is designed to alleviate the gradient balance between the classification and segmentation tasks. Extensive experimental results show that our PLDMLT method significantly outperforms other state-of-the-art methods in DR segmentation on two public datasets, achieving up to 98.897% segmentation accuracy. In addition, our method achieves comparable competitiveness with single-task fully supervised learning in the DR severity grading task.Keywords
The past few years have seen great success in interdisciplinary research in artificial intelligence and medical image analysis [1–3]. As these studies have become more widespread, the research on fundus images has become more comprehensive and in-depth, especially in the area of Diabetic Retinopathy (DR) on fundus images. DR is a vascular disease affecting the normal blood vessels of the eye and is the leading cause of preventable blindness worldwide [4]. DR analysis usually has two essential areas of research: disease classification and fine-grained lesion segmentation [5]. Although the former problem depends on the latter, these two problems are usually studied separately.
Disease severity grading can be considered a classification problem, and there is a uniform standard for DR classification, the International Clinical Diabetic Retinopathy Scale (ICDRS) [6]. According to this standard, the severity of DR can classify into five levels, namely 0 (no significant DR), 1 (non-appreciative early DR), 2 (non-appreciative mid-stage DR), 3 (non-appreciative late DR), and 4 (proliferative DR). These require only image-level labeling, and due to the limited labeled data and the subjective labeling of different human graders, the labeling may be noisy. Grading diabetic retinopathy (DR) based on fundus images has attracted increasing interest from academia and industry. Most convolutional neural network (CNN)-based algorithms treat DR grading as a classification task through image-level annotation. However, these algorithms do not fully exploit the valuable information in DR-related lesions. Furthermore, the improvement of generalization and robustness of the classification model eventually obtained by training the model will be a challenge for this task.
Conversely, lesion segmentation requires more specialized pixel-level labeling in DR segmentation tasks. They are commonly performed on soft exudates, hard exudates, microaneurysms, and hemorrhages for single or multiple lesions. Fig. 1 shows the sample retinal images and the corresponding DR pixel-level lesion annotation based on the Indian Diabetic Retinopathy Image Dataset (IDRiD) [7]. Pixel-level data annotation of medical images is very time-consuming and requires experts in the field.
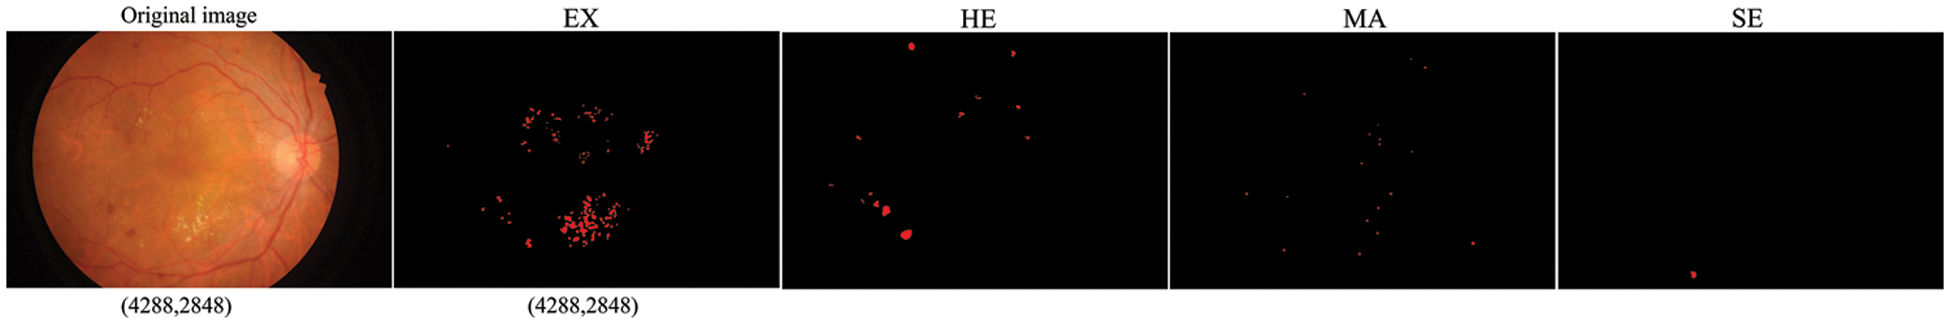
Figure 1: Soft exudates (SE), hard exudates (EX), microaneurysms (MA) and hemorrhages (HE) Pixel-level annotation of individual lesions corresponding to the fundus image. The resolution of both the original image and the individual lesion-labeled images is (4288, 2848). The horizontal resolution is 4288 and the vertical resolution is 2848
Compared to the graded annotated images of fundus images, pixel-level annotated images are challenging to obtain and much smaller in number than the graded annotated images. However, the more annotation information they contain, the easier it is for the model to learn more helpful knowledge. Therefore, we propose to use a pixel-level labeled dataset for segmentation and grading tasks, whose labels for grading tasks obtain from pre-trained classification models.
This paper proposes multi-task learning using pixel-level annotated fundus images called PLDMLT. Our PLDMLT consists of two tasks: DR lesion segmentation and DR severity grading. These two tasks can be considered intermediate and advanced vision tasks [8,9]. Therefore, it is not appropriate to share the hidden layer among the tasks using the traditional multi-task learning approach [10]. To this end, an effective hierarchy of the two tasks is established in our PLDMLT framework. At the same time, a pseudo-label generation method is proposed to obtain high-confidence pseudo-labels for the images of this dataset. In addition, we propose a pre-trained classification model to generate a class activation heat map and fine-tune this heat map for the classification pseudo-labels with the pixel-level labeling ratio of the segmented dataset.
Unlike traditional multi-task learning approaches, our PLDMLT is more flexible and can be used directly in most networks with an encoder-decoder architecture like U-shaped network (Unet), without modifying the network.
Contributions: To our knowledge, our work is the first attempt to perform both medium and high-level medical services simultaneously using only pixel-level annotated fundus images. The main contributions of this paper are as follows:
(1) We propose a method to obtain high-confidence pseudo labeling for learning classification methods for pixel-level labeled images. The simultaneously trained multi-task model can segment and classify fundus images, significantly saving cost and training time.
(2) We designed a label update network for mitigating inter-task gradients.
(3) The proposed PLDMLT framework with extensive experiments verifies that our approach achieves excellent performance in segmentation and comparable results in DR severity classification.
In medical imaging, lesion segmentation, and disease classification are two critical tasks that can drive the progress of computer-aided diagnosis. Research on these two tasks in fundus images is also becoming more and more extensive.
Recently, lesion segmentation tasks and disease grading tasks have been widely explored in the field of medical images. As for the segmentation tasks, most of the proposed models are based on the reconstruction of Fully Convolutional Networks (FCN) or U-Net in order to achieve excellent performance. Subsequently derived for DR segmentation task. Reference [11] proposed an improved U-Net architecture ResUnet based on residual network with periodic blending wash where sub-pixel convolution is initialized to convolutional nearest neighbor size. Transformers and U-Net (TransUNet) [12] using Transformers Make Strong Encoders for Medical Image Segmentation. Deep learning models have also been widely used to grade fundus images for disease. For example, reference [6] utilized the Inception architecture for Computer Vision3 (Inception-V3) for DR grading and designed a pathology-aware network. However, most are model designs or improvements for a single task, and a few work on correlating two tasks.
Weakly supervised learning is introduced to make fuller and more efficient use of the data with reduced annotation effort. Weakly supervised Pseudo labels Existing methods are broadly classified into two categories. One is a one-stage approach which usually comes to build an end-to-end model and introduces multi-instance learning and some other conditions to optimize it, the overall framework is relatively simple, but the accuracy is generally low as in [13]. The other class of methods is a two-stage one, which usually uses some method to generate pseudo-labels first and then uses them for training, such as [14]. Although this method is more accurate than the first-stage method, the overall method is slightly more complicated when the pseudo-label generation may introduce a lot of noise and uncertainty.
With the further development of deep learning image algorithms in the past two years, multi-task learning has become one of the important directions of its research. There is some kind of correlation between different tasks, then multiple tasks can share some feature extraction process between them, and they can share the information they learned in learning training, which is not available in single-task learning. Associated multi-task learning can achieve better generalization than single-task learning. A two-stage Dynamic Convolution Neural Network (DCNN) [15] is proposed that allows the simultaneous description of the lesion and grading of DR severity. In reference [16], attention mechanisms are also commonly used for multi-task learning. Because annotation requires domain expertise and physical labor, it is challenging to train large-scale deep-learning models. Reference [17] proposed DR grading and multiple lesion segmentation tasks using semi-supervised learning and experimenting with the optimal solution for classifying output variants for each grading. Nevertheless, all these methods require many image inputs at a much higher computational cost.
The learning of multi-tasks share a common dataset or image features and generally speaking, this approach is further subdivided into multi-label learning domains. The earliest, mainly proposed machine learning-based approaches to address the problem of multi-label learning, exploring correlations between labels and enabling simultaneous learning of multiple labels. Reference [18] proposed using synthetic datasets to analyze better the behavior of Machine Learning (ML) methods in domains with different characteristics. Reference [19] showed that binary relevance-based methods have much to offer. With the increasing application of deep learning in images, neural networks have been proposed for multi-label learning, and reference [20] constructed a two-branch network with an original image and its transformed image as inputs and introduced a new attention consistency loss. However, multi-label learning methods have yet to be studied much on medical images because medical image datasets usually lack multiple labels. It is tedious to perform pixel- and image-level annotation on the same medical image. We propose a deep learning-based multi-label framework for weakly supervised multi-task learning by generating disease-graded pseudo-labels. The two tasks do not simply share parameters.
An overview of the proposed approach is shown in Fig. 2. The framework is divided into two parts: on the left is the pixel-level labeled image processing part. Given the limited number of images with pixel-level labels, we use a five-fold cross-validation method so that each category of lesions can be fully and effectively trained and learned. Two segmentation datasets with pixel-level annotation are also introduced for joint training to avoid overfitting.
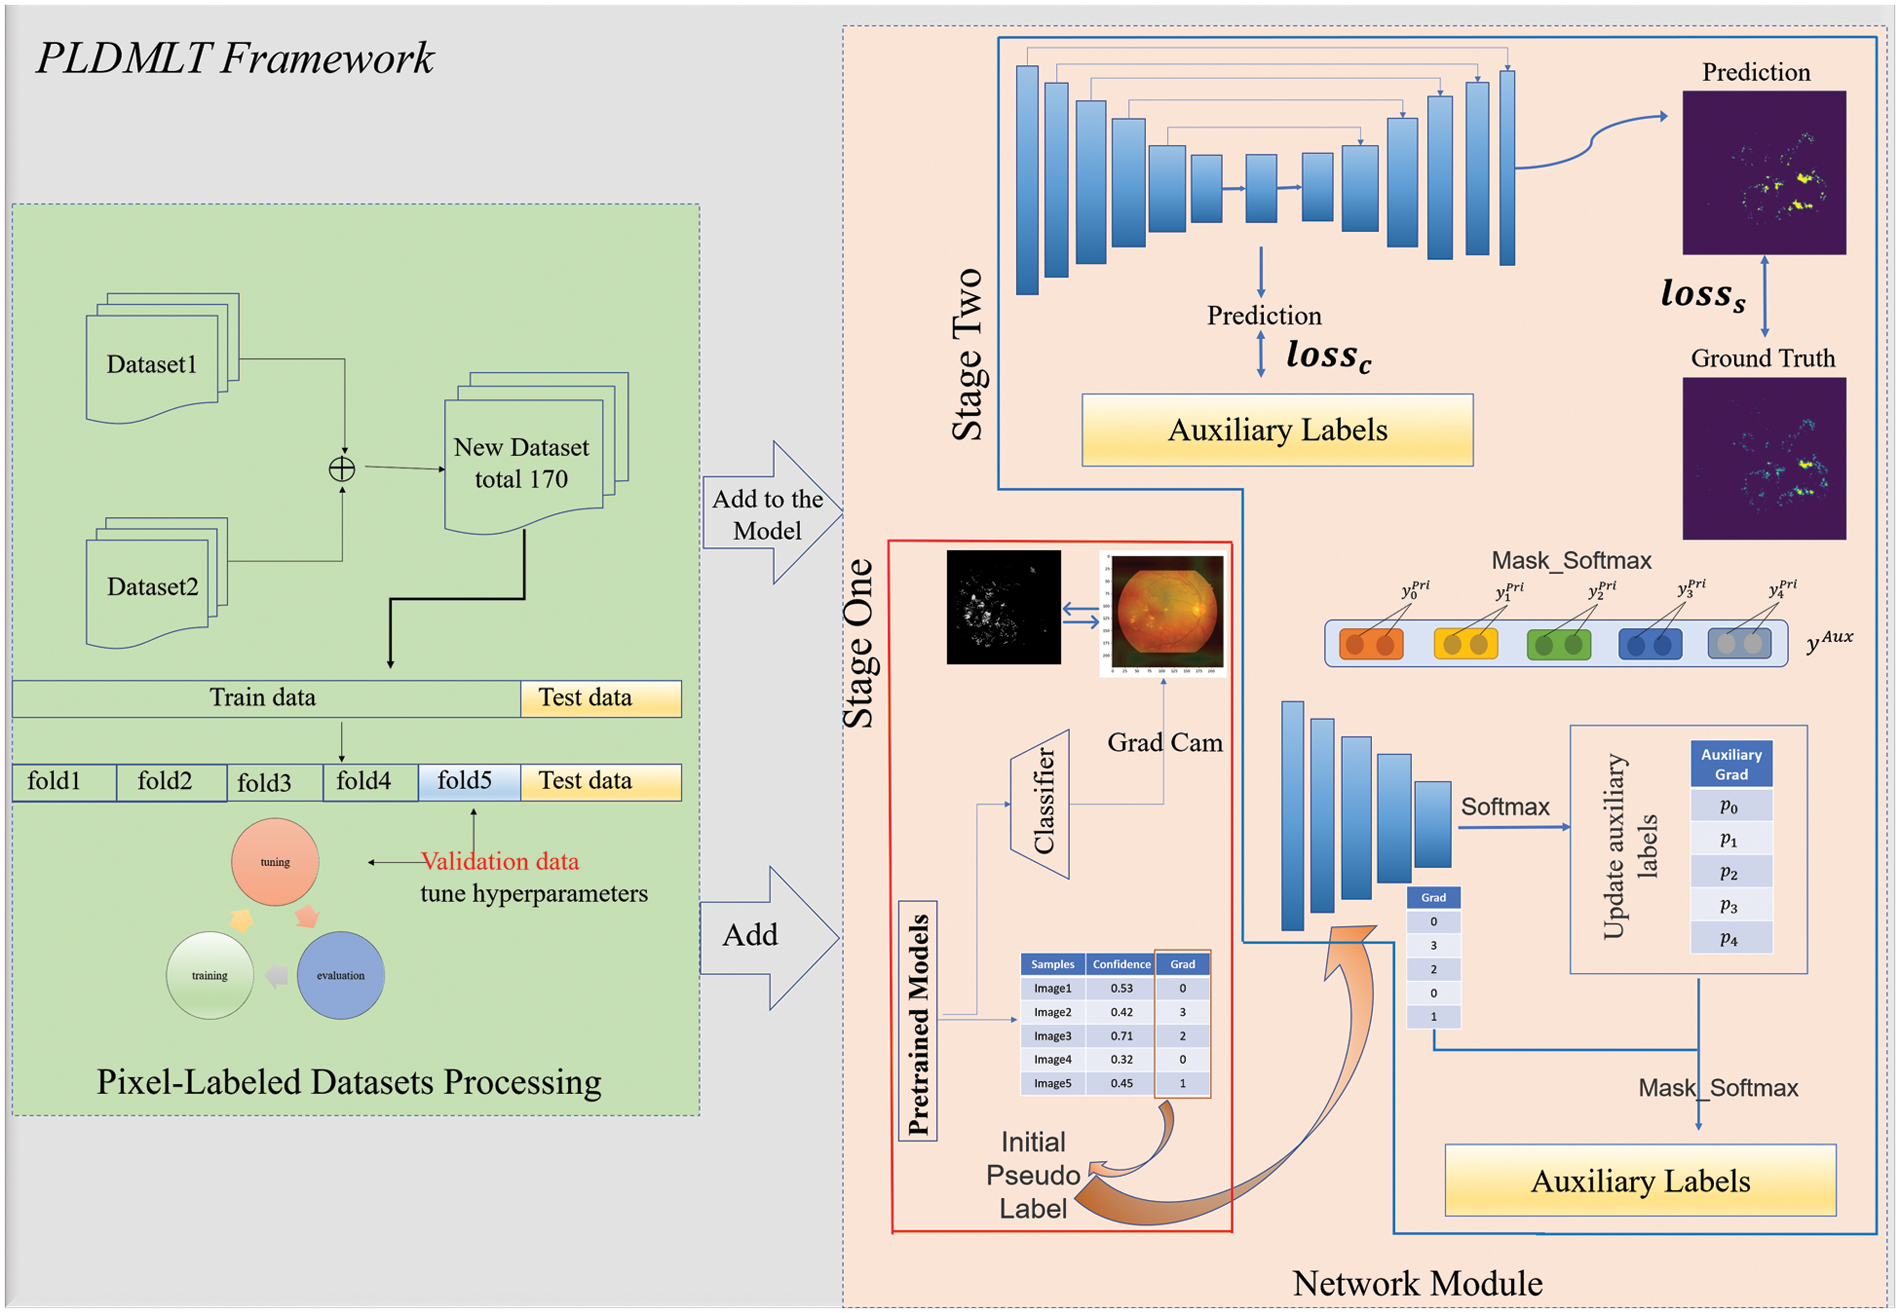
Figure 2: Overall framework
The network module is divided into two stages: the red box indicates the generation of initial pseudo-labels and heat maps using the method. The initial model is trained using IDRiD-D [7], on which pseudo-labels are generated, and the classification basis is visualized using this pre-trained classification model. The blue box indicates multi-task learning, where the auxiliary labels are pseudo-labels generated in one stage for the label update network and the multi-task learning network. The following sections include details of generating pseudo-labels and disease classification heat maps, weakly supervised multi-task learning and label update networks, and the whole training process.
3.1 Generating Pseudo-Labels and Class Activation Heat Maps
In this study, to enable the model to learn two tasks simultaneously for pixel-level labeled images lacking disease grading labels, we propose the approach shown in Fig. 3. The DR severity grading models of Aggregated Residual Transformations Network (ResNeXt) ResNeXt-101 [21] and ResNeXt-50 [21] were first pre-trained using the IDRiD-D dataset. These two pre-trained models predicted disease grading pseudo labeling of pixel-level annotated images. In addition, the pseudo label with the highest confidence in the pseudo label predicted by the two models is selected.
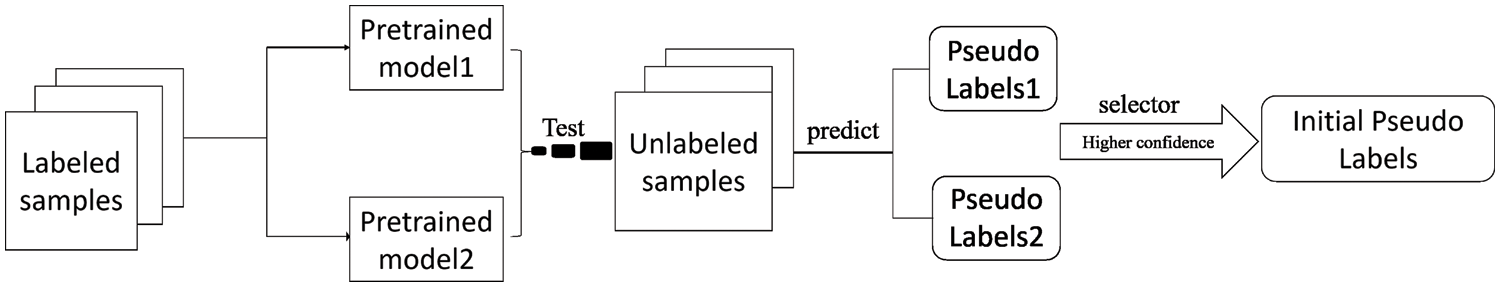
Figure 3: The pseudo-label generation process
Heat maps can provide medical interpretability for deep learning-based medical image analysis. In our work, we propose to use segmentation masks to guide the heat map and fine-tune the pseudo-labeling. The class activation heat map [22] is an improvement to the original Class Activation Mapping (CAM) [23] by calculating the partial derivatives of the category-specific prediction scores concerning each element of the output feature map of the last convolution layer, and thus the degree of influence of each channel of the feature map on the model prediction for a specific category. In our proposed method, the dataset is predicted, and the degree of influence of different categories is visualized. The pixel-level annotation of the dataset can be used as a visual guide to the heat map of the impact level of different categories. Since the grading of DR images is based on typical DR lesions, locating the lesions of interest should be the key for the physician to evaluate the algorithm’s predictions without needing fine segmentation. In medical domain knowledge, DR severity is graded with 0, indicating no DR lesions on the image. 1 indicating only microaneurysms, and 2 indicating not only the presence of microaneurysms. At the same time, the other two levels show more than them in terms of the number of DR lesion categories. For this reason, we propose a secondary modification of the classification pseudo-labeling by comparing the sensitivity of the different categories on the heat map with the corresponding acceptable segmentation annotation of the image.
In Gradient-weighted Class Activation Mapping (Grad-CAM) [22] we take the pre-trained classification model for the last layer of F feature extraction and vary the different severity levels c. k represents k th channel in the feature layer F,
By varying the different DR severity levels of c, the heat map of class activation under each level is obtained.
3.2 Weakly Supervised Multi-Task Learning Network
In this work, The backbone network extracts features due to the excellent performance of Visual Geometry Group16 (VGG16) [24] as feature extraction in either diabetic retinopathy classification or segmentation. VGG16 is used as the backbone of our encoder. In addition, the availability of pre-trained weights of VGG16 on the ImageNet dataset allowed us to take advantage of the successful improvements in image classification and segmentation by migration learning. The model is divided into two parts: encoder and decoder. Segmentation and grading share the encoder part, a pooling layer with a fully connected layer is added at the end of the encoder to obtain a classification output, grading and segmentation share the encoder block, and the output of segmentation is at the end of the decoder. The model is shown in Fig. 4.
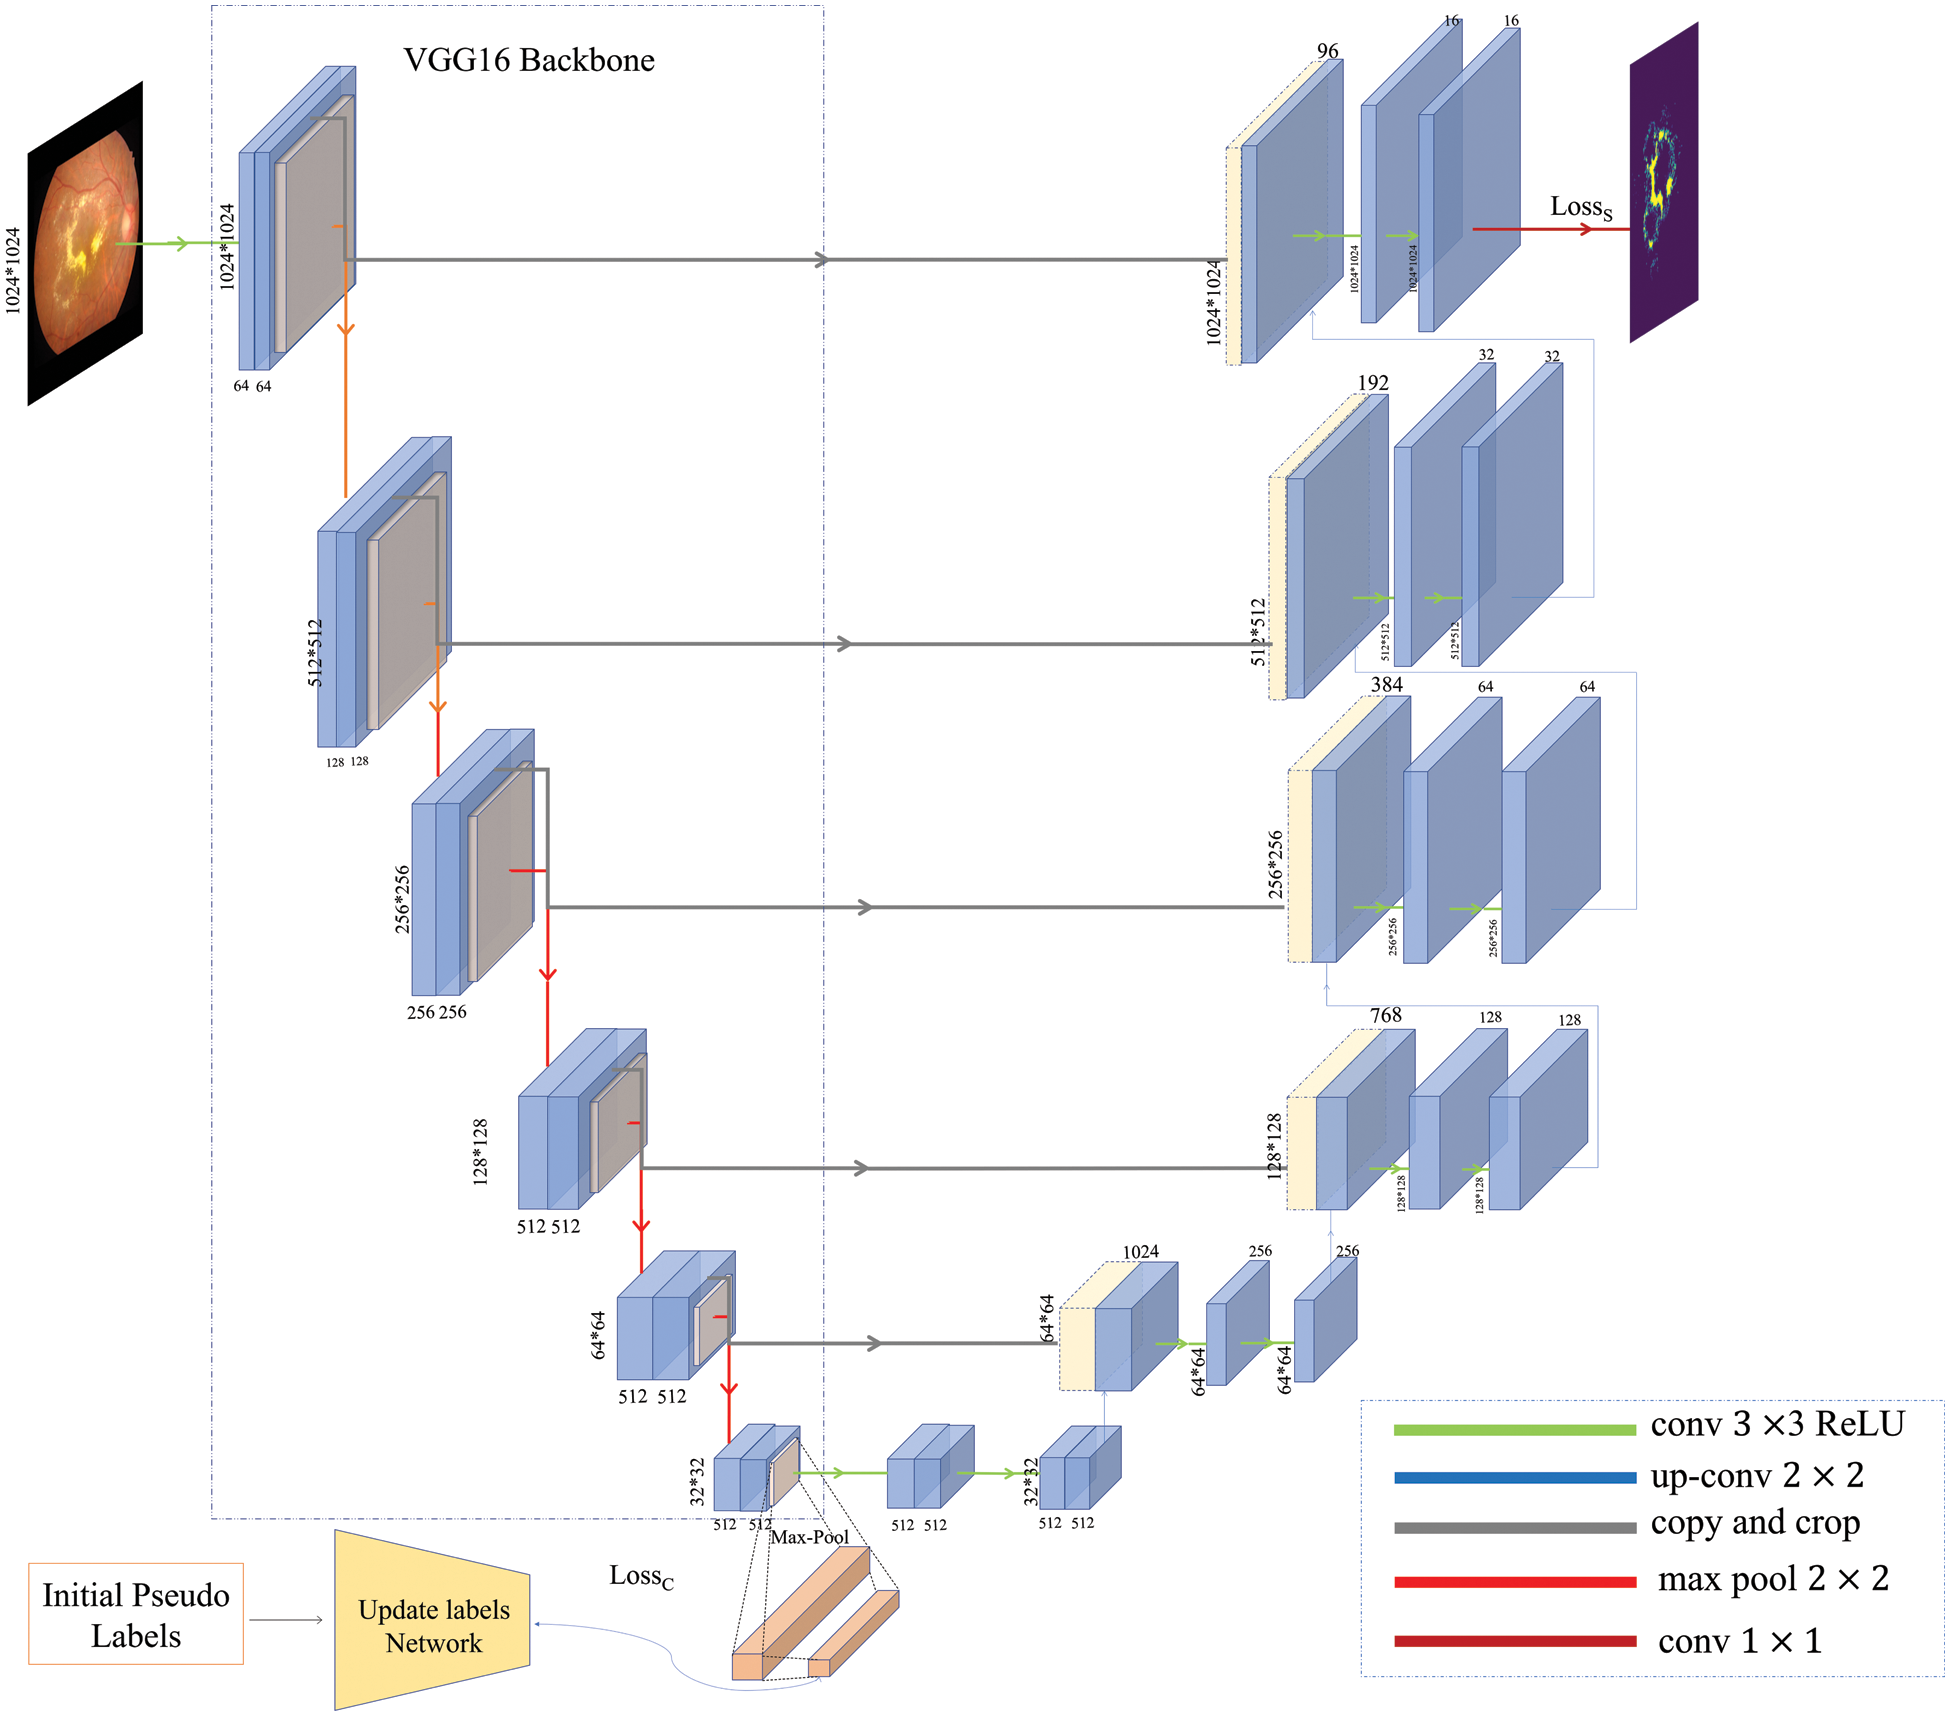
Figure 4: The architecture of the multi-task model
Moreover, during the experiments, we found that simply adding output and transforming it into multi-task learning does not directly lead to an effective improvement of the overall model performance. We need to adjust the weights and design a suitable loss function continuously. For this reason, we focused on the newly added grading task and found that the overall model performance is closely related to its gradient change. Considering the noise and unreliability caused by weak pseudo-labels, we added a self-supervised learning approach. We designed a label update network, which optimizes the loss to alleviate better the impact caused by the gradient imbalance in the shared layer. In the next section, we will introduce it in detail.
The training process for weakly supervised multi-task learning is similar to that of fully supervised. Our proposed network uses two loss functions from the segmentation and DR grading tasks in this multi-task learning. Since, for both tasks, the samples are unbalanced, for this reason, we use the [25] multi-category FocalLoss (CategoricalFocalLoss). The lesion segmentation task has an input image size
The loss function reduces the simple sample loss weights, thus allowing the network to focus more on difficult sample losses. The formula is shown above, where y is the true category value,
where
We designed a label update network for the grading task, Inspired by [26]. As shown in Fig. 5, the network gets new labels by self-supervised learning. The updated labels were used as the input of the grading task, and then supervised training was performed, and it was found that the overall performance was improved, and the model converged better.
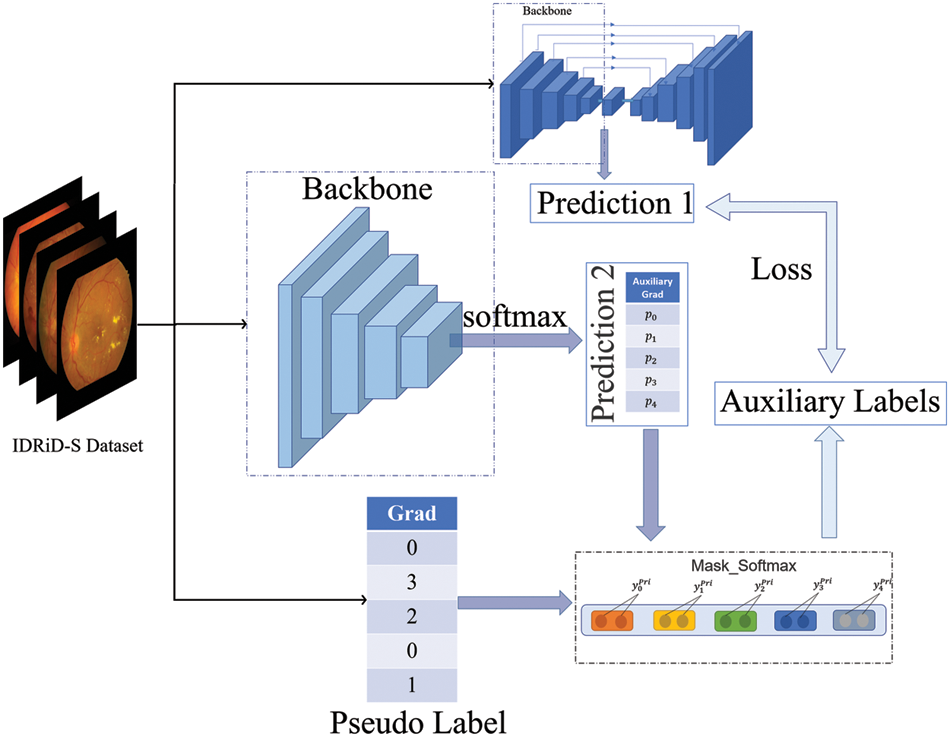
Figure 5: Label update network structure. The final generated grading labels are used to make gradient descent with the predictions of the grading task
Unlike the setting in [26], the initial label of the model is weakly labeled. Similarly, we make the update label network trained simultaneously with the multi-task network and represent the multi-task network as a function
3.3.2 Pseudo-Label Update Method
Through the parameter setting in the above part, we can know that the label update is obtained according to the initial pseudo-label after the formula (4), however, for the disease classification task the number of corresponding data set in each level is not exactly the same, some levels will not even appear, it can be found that the number of categories of the initial pseudo-label is less than or equal to true five classes, the number of categories of
The above equation
3.3.3 Overview of Parameter Updates
The goal of PLDMLT is to update labels and generate pseudo-labels. First, initial pseudo-labels and heat maps are obtained from the pre-trained classification model in the first stage. Secondly, in the second stage, the parameters of the multi-task network and update label network models are updated and converged with loss minimization, respectively. It is worth noting that the label update network is updated by calculating the label update network’s prediction accuracy relative to the multi-task network for the shared parameter network.
In summary, the entire PLDMLT algorithm is defined as follows:

We implemented a joint DR grading task for multifocal region segmentation in the Keras framework and conducted experiments to evaluate its performance. We used the Adam algorithm to optimize the network with an initial learning rate of
This section introduces the experimental results of DR lesion segmentation and grading by PLDMTL in several datasets and compares the evaluation with other networks.
The datasets in the model are preprocessed. Each image corresponds to a mask. We fused the lesions of soft exudates, hard exudates, hemorrhages (including red dots), and microaneurysms. We are using morphological methods [27] on a single image as a new mask for the dataset.
IDRiD-S Indian Diabetic Retinopathy Image Segmentation Dataset (IDRiD-S) [7]. It is a publicly available dataset containing 81 retinal images for the segmentation task, where each image has a manually labeled segmentation mask.
IDRiD-D Indian Diabetic Retinopathy Image Dataset (IDRiD-D) [7]. This publicly available dataset contains 413 images manually classified into 5 DR severity levels. This dataset is primarily used to train DR severity classification models and to predict the output IDRiD-S with weakly supervised pseudo-labeling of DiaRetDB1.
DiaRetDB1 Data from [28]. 89 color fundus images, 84 of which were at least mild non-proliferative signs of diabetic retinopathy (microaneurysms), and 5 were normal, according to all experts involved in diabetic retinopathy, which did not show any signs of diabetic retinopathy. Images were taken using the same 50-degree field-of-view digital fundus camera with different imaging settings. The data correspond to good (not necessarily typical) real-world conditions, and the images are comparable and can be used to assess the general performance of the diagnostic method. The dataset is called “Calibrated Level 1 Fundus Images”.
A General-Purpose High-Quality Dataset for Diabetic Retinopathy (DDR) [29] 757 fundus images of the DDR dataset are annotated with pixel-wise segmentation for four retinal lesions, including microaneurysms (MA), hard exudates (EX), soft exudates (SE), and hemorrhages (HE).
Data Enhancement We applied data augmentation to improve the initial network, as well as the accuracy of this network, using random rotation, vertical/horizontal flipping, rotation, flipping, left/right flipping, and cropping.
The sensitivity of each segmented image at different levels is visualized using Grad-CAM, and is shown in Fig. 6.
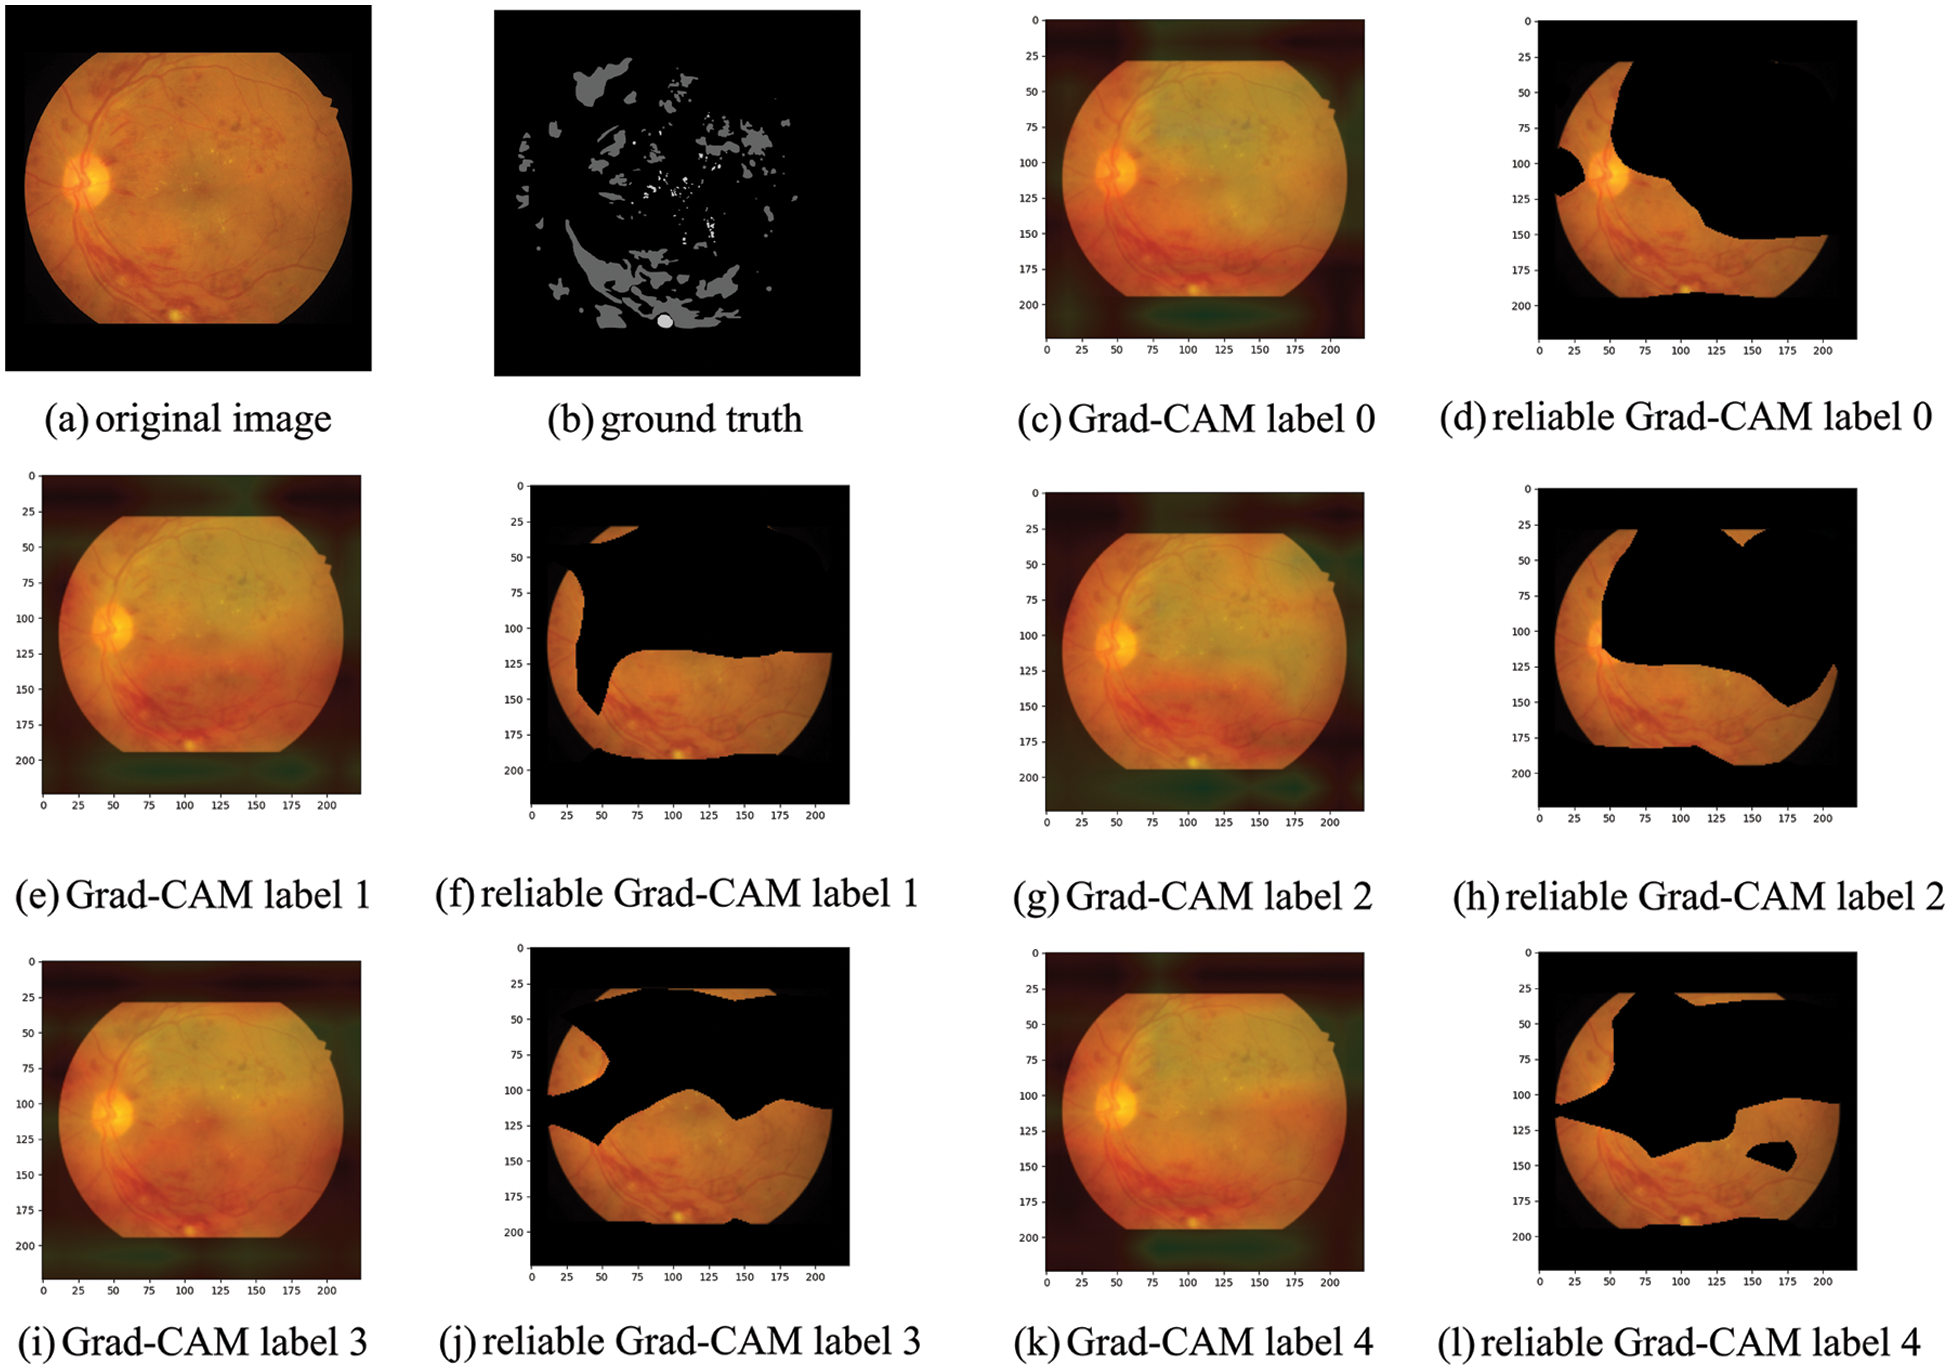
Figure 6: (a) We propose to take the fundus image of each segmented dataset for the original image and plot each severity level’s sensitivity to the lesion’s location using the better-trained pre-trained classification model. (b) The pixel-level labeled segmentation mask of (a). (c) Is the heat map obtained after Grad-CAM. The heat map shows that the red region location is the most sensitive part of the DR severity level. The most sensitive part is when the DR severity level is 0. (d) The sensitive part is visualized. (e, g, i, k) Correspond to the heat map of each DR severity level
Taking the fundus image in the above figure as an example, we can find that the most relevant thermal localization map to the image’s mask is a severity level of 3 or 4. Both level 0 and level 2 have fundus image optic discs as a grading guide, so levels 0 and 2 are not considered a category for classification pseudo labeling, and the upper part of level 1 has only a tiny fraction of sensitive lesion localization. Therefore, it is not considered a category for this label. The pseudo label value predicted by the pre-training model for this image is 4, so it is within our speculative range and is used as the initial pseudo label obtained.
4.3 Evaluation of Multi-Task and Results
We evaluated the performance of the PLDMLT method for DR lesion segmentation and disease classification on the DDR IDRiD-S and DiaRetDB1 datasets. We compared it with various other methods on a single task, such as Unet [30] Linking to the Network (LinkNet) [31], Deep Labelling for Computer Vision plus version (DeepLabv3+) [32], and Feature Pyramid Network (FPN) [33], as well as multi-task methods [17] for comparison. All methods were performed on 1024 × 1024 × 3 fundus images, while we applied different metrics to evaluate the performance of both tasks, for disease classification using accuracy assessment and for segmentation task using average Dice similarity coefficient (Dice) and average Intersection Over Union (IOU), with larger values of these metrics indicating better performance and more accurate segmentation or classification. Tables 1 and 2 list the results of our and other methods. Our PLDMLT method is better than the single-task method and is competitive with the semi-supervised multi-task learning method of [17] for the segmentation task. Specifically, at least 1.05% improvement is achieved on the segmentation task on the IDRiD dataset and 4.68% on the classification task, while similar results can be found on the DDR dataset.


where
It is worth noting that although it is inferior to the semi-supervised learning Multi-task U-shaped network (MTUnet) in terms of disease classification effect, which is related to the sample amount. However, PLDMLT outperforms the existing model in terms of segmentation effect, and the semi-supervised learning MTUnet model requires training a large amount of data with high memory requirements, which consumes more cost compared to the proposed method. At the same time, the trained model can solve both the segmentation task and the disease classification task of fundus images without having to train different models for the two tasks, which would make the medical-aided diagnosis process much more efficient. A comparative study of different segmentation model experiments is done for our proposed method, and the experimental results are visualized. It is shown in Fig. 7.
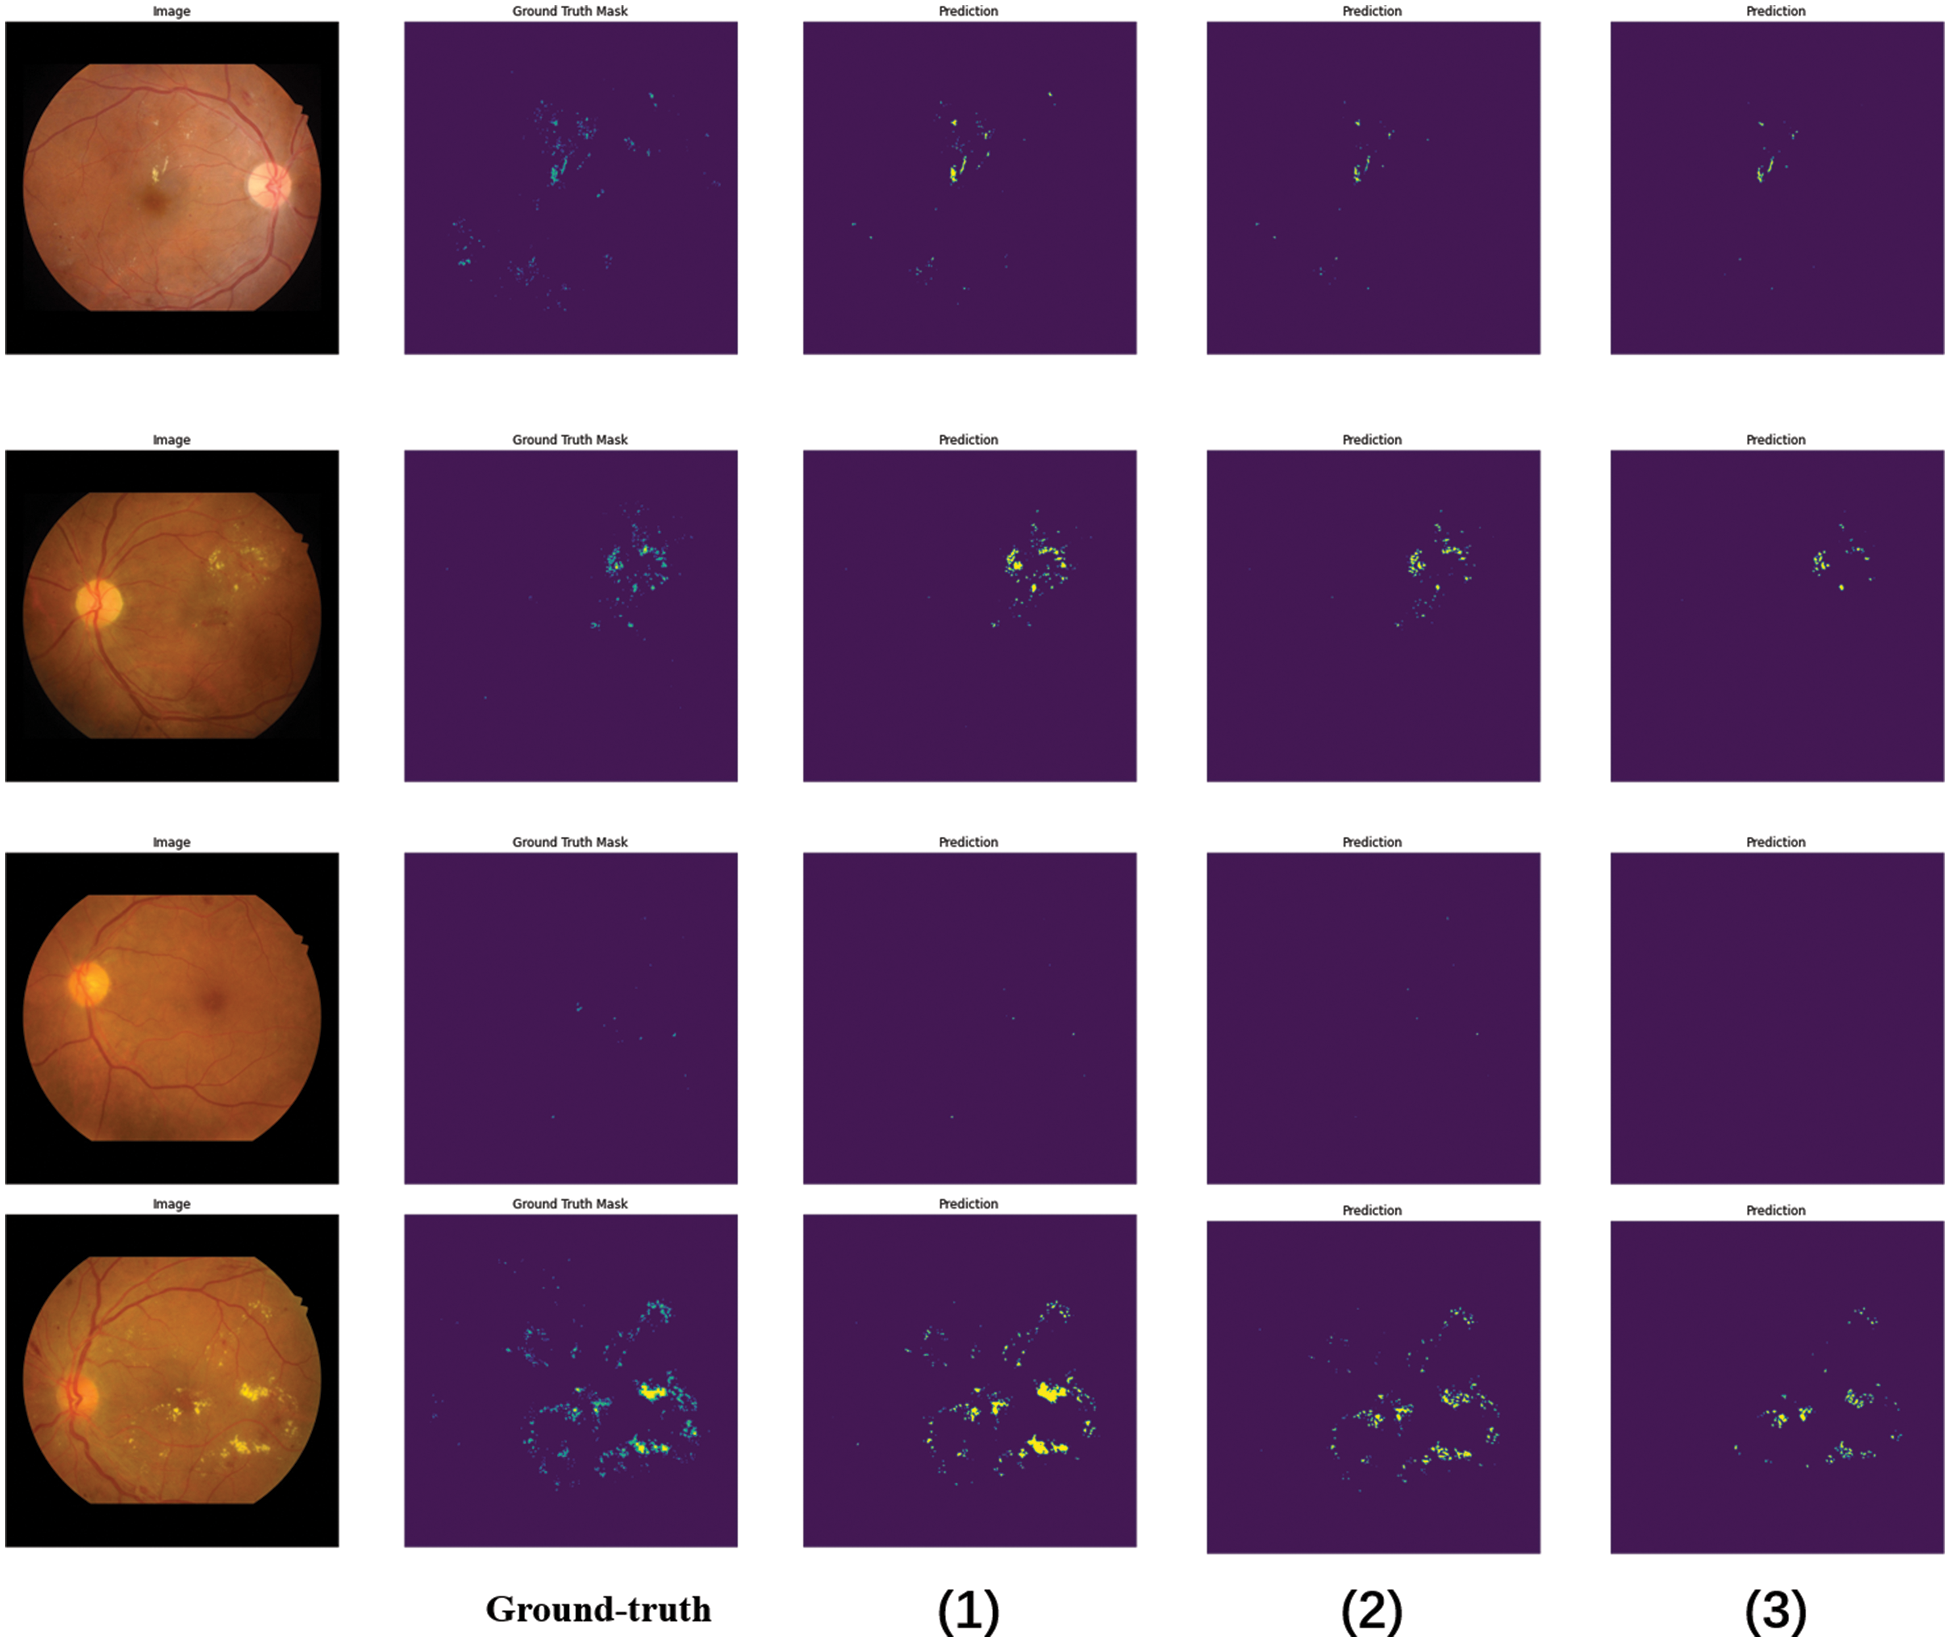
Figure 7: Different network segmentation results in soft and hard exudates. The segmentation results of each model comparison experiment, in which (1) the segmentation result of the PLDMLT method, (2) the segmentation result of LinkNet, (3) the segmentation result with Unet
The proposed multi-task network shows better performance than fully supervised on both segmentation and classification tasks, especially on the segmentation task, even surpassing the performance of semi-supervised learning, as can be seen from the above figure, the segmentation result map predicted by the PLDMLT model with the segmentation label Ground-truth (GT) can predict most of the lesions present, compared to LinkNet and U-net, the method can effectively detect the distribution and location information of lesions. This also validates the effectiveness and superiority of the network.
We ablate different components of our PLDMLT method to analyze their effects on multi-task. The results of the ablation experiments are shown in Table 3.

As can be seen from the above table, the initial segmentation loss
In this paper, We propose a method for multi-task learning using pixel-level annotated images. It is called PLDMLT. We propose taking the graded classification labels from the different pre-trained models. Update the original pseudo label by self-supervision, and use it as the valid label for grading this multi-task model. While coarsely adjusting the pseudo label using the heat map as supervision, the model is divided into encoder and decoder modules. The segmentation and graded classification tasks share the encoder part by training this multi-task model to minimize the segmentation classification loss.
With this approach, we obtain better performance on the segmentation and classification task. The segmentation task achieves an average segmentation accuracy of 96.949% on the datasets IDRiD and DiaRetDB1%, and 98.897% on the DDR dataset. On the classification task, 57.69% and 81.98% accuracy were achieved on the two datasets, respectively. In the future, we want to evaluate whether this method can be applied to other medical segmentation or classification domains and solve the problem of gradient imbalance among multi-tasks.
Funding Statement: This research did not receive any specific grant from funding agencies in the public, commercial, or not-for-profit sectors.
Conflicts of Interest: The authors declare that they have no conflicts of interest to report regarding the present study.
References
1. T. Li, W. Bo, C. Hu, H. Kang, H. Liu et al., “Applications of deep learning in fundus images: A review,” Medical Image Analysis, vol. 69, pp. 101971, 2021. [Google Scholar] [PubMed]
2. J. Jiang, P. Trundle and J. Ren, “Medical image analysis with artificial neural networks,” Computerized Medical Imaging and Graphics, vol. 34, no. 8, pp. 617–631, 2010. [Google Scholar] [PubMed]
3. E. Elyan, P. Vuttipittayamongkol, P. Johnston, K. Martin, K. McPherson et al., “Computer vision and machine learning for medical image analysis: Recent advances, challenges, and way forward,” Artificial Intelligence Surgery, vol. 2, no. 1, pp. 24–45, 2022. [Google Scholar]
4. C. Wilkinson, F. Ferris, R. Klein, P. Lee, C. Agardh et al., “Proposed international clinical diabetic retinopathy and diabetic macular edema disease severity scales,” Ophthalmology, vol. 110, no. 9, pp. 1677–1682, 2003. [Google Scholar] [PubMed]
5. R. Gargeya and T. Leng, “Automated identification of diabetic retinopathy using deep learning,” Ophthalmology, vol. 124, no. 7, pp. 962–969, 2017. [Google Scholar] [PubMed]
6. V. Gulshan, L. Peng, M. Coram, M. C. Stumpe, D. Wu et al., “Development and validation of a deep learning algorithm for detection of diabetic retinopathy in retinal fundus photographs,” Journal of the American Medical Association, vol. 316, no. 22, pp. 2402–2410, 2016. [Google Scholar] [PubMed]
7. P. Porwal, S. Pachade, R. Kamble, M. Kokare, G. Deshmukh et al., “Indian Diabetic Retinopathy Image Dataset (IDRiDA database for diabetic retinopathy screening research,” Data, vol. 3, no. 3, 25, 2018. [Google Scholar]
8. M. Berahim, N. A. Samsudin and S. S. Nathan, “A review: Image analysis techniques to improve labeling accuracy of medical image classification,” in Recent Advances on Soft Computing and Data Mining, Bandung, Indonesia, pp. 298–307, 2018. [Google Scholar]
9. X. Wang, K. Yu, C. Dong and C. C. Loy, “Recovering realistic texture in image super-resolution by deep spatial feature transform,” in IEEE/CVF Conf. on Computer Vision and Pattern Recognition (CVPR), Salt Lake City, UT, USA, pp. 606–615, 2018. [Google Scholar]
10. A. Kendall, Y. Gal and R. Cipolla, “Multi-task learning using uncertainty to weigh losses for scene geometry and semantics,” in IEEE/CVF Conf. on Computer Vision and Pattern Recognition (CVPR), Salt Lake City, UT, USA, pp. 7482–7491, 2018. [Google Scholar]
11. N. Sambyal, P. Saini, R. Syal and V. Gupta, “Modified U-Net architecture for semantic segmentation of diabetic retinopathy images,” Biocybernetics and Biomedical Engineering, vol. 40, no. 3, pp. 1094–1109, 2020. [Google Scholar]
12. J. Chen, Y. Lu, Q. Yu, X. Luo and Y. Zhou, “TransUNet: Transformers make strong encoders for medical image segmentation,” arXiv:2102.04306, 2021. [Google Scholar]
13. B. Zhang, J. Xiao, Y. Wei, K. Huang, S. Luo et al., “End-to-end weakly supervised semantic segmentation with reliable region mining,” Pattern Recognition, vol. 128, pp. 108663, 2022. [Google Scholar]
14. Y. Wang, H. Wang, Y. Shen, J. Fei, W. Li et al., “Semi-supervised semantic segmentation using unreliable pseudo-labels,” in IEEE/CVF Conf. on Computer Vision and Pattern Recognition (CVPR), New Orleans, LA, USA, pp. 4238–4247, 2022. [Google Scholar]
15. Y. Yang, T. Li, W. Li, H. Wu, W. Fan et al., “Lesion detection and grading of diabetic retinopathy via two-stages deep convolutional neural networks,” in Medical Image Computing and Computer Assisted Intervention−MICCAI 2017: 20th Int. Conf., Cham, Springer, 2017. [Google Scholar]
16. S. Ruder, “An Overview of Multi-Task Learning in Deep Neural Networks,” arXiv:1706.05098, 2017. [Google Scholar]
17. A. Foo,W. Hsu, M. L. Lee, G. Lim, T. Y. Wong et al., “Multi-task learning for diabetic retinopathy grading and lesion segmentation,” in Thirty-Fourth AAAI Conf. on Artificial Intelligence, the Thirty-Second Innovative Applications of Artificial Intelligence Conf. and the Tenth AAAI Symp. on Educational Advances in Artificial Intelligence, New York, NY, USA, pp. 13267–13272, 2020. [Google Scholar]
18. O. Luaces, J. Díez, J. Barranquero, J. J. del Coz and A. Bahamonde, “Binary relevance efficacy for multilabel classification,” Progress in Artificial Intelligence, vol. 1, no. 4, pp. 303–313, 2012. [Google Scholar]
19. J. Read, B. Pfahringer, G. Holmes and E. Frank, “Classifier chains for multi-label classification,” Machine Learning, vol. 85, no. 3, pp. 333–359, 2011. [Google Scholar]
20. H. Guo, K. Zheng, X. Fan, H. Yu, S. Wang et al., “Visual attention consistency under image transforms for multi-label image classification,” in IEEE/CVF Conf. on Computer Vision and Pattern Recognition (CVPR), Long Beach, CA, USA, pp. 729–739, 2019. [Google Scholar]
21. S. Xie, R. Girshick, P. Dollar, Z. Tu, K. He et al., “Aggregated residual transformations for deep neural networks,” in 30th IEEE Conf. on Computer Vision and Pattern Recognition (CVPR), Honolulu, HI, USA, pp. 5987–5995, 2017. [Google Scholar]
22. R. R. Selvaraju, M. Cogswell, A. Das, R. Vedantam, D. Parikh et al., “Grad-CAM: Visual explanations from deep networks via gradient-based localization,” International Journal of Computer Vision, vol. 128, no. 2, pp. 336–359, 2020. [Google Scholar]
23. B. Zhou, A. Khosla, A. Lapedriza, A. Oliva, A. Torralba et al., “Learning deep features for discriminative localization,” in IEEE Conf. on Computer Vision and Pattern Recognition (CVPR), Seattle, WA, USA, pp. 2921–2929, 2016. [Google Scholar]
24. K. Simonyan and A. Zisserman, “Very deep convolutional networks for large-scale image recognition,” arXiv:1409.1556, 2014. [Google Scholar]
25. T. Y. Lin, P. Goyal, R. Girshick, K. He and P. Dollar, “Focal loss for dense object detection,” IEEE Transactions on Pattern Analysis and Machine Intelligence, vol. 42, no. 2, pp. 318–327, 2020. [Google Scholar] [PubMed]
26. S. Liu, A. J. Davison and E. Johns, “Self-supervised generalisation with meta auxiliary learning,” in Advances in Neural Information Processing Systems 32 (NIPS), Vancouver, Canada, pp. 1679–1689, 2019. [Google Scholar]
27. D. Schonfeld, “Morphological processing of medical images: An introduction,” in IEEE Int. Symp. on Circuits & Systems, Singapore, vol. 1, pp. 746–749, 1991. [Google Scholar]
28. T. Kauppi, V. Kalesnykiene, J. K. Kamarainen, L. Lensu and J. Pietil, “DIARETDB1 diabetic retinopathy database and evaluation protocol,” in Proc. of the British Machine Vision Conf., Warwick, UK, pp. 15.1–15.10, 2007. [Google Scholar]
29. T. Li, Y. Gao, K. Wang, S. Guo, H. Liu et al., “Diagnostic assessment of deep learning algorithms for diabetic retinopathy screening,” Information Sciences, vol. 501, pp. 511–522, 2019. [Google Scholar]
30. O. Ronneberger, P. Fischer and T. Brox, “U-Net: Convolutional networks for biomedical image segmentation,” in Medical Image Computing and Computer-Assisted Intervention, PT III, Munich, GERMANY, pp. 234–241, 2015. [Google Scholar]
31. A. Chaurasia and E. Culurciello, “LinkNet: Exploiting encoder representations for efficient semantic segmentation,” in IEEE Visual Communications and Image Processing (VCIP), St. Petersburg, FL, USA, IEEE pp. 10–13, 2017. [Google Scholar]
32. X. Peng, Z. Yin and Z. Yang, “Deeplab_v3_plus-net for image semantic segmentation with channel compression,” in IEEE 20th Int. Conf. on Communication Technology (ICCT), Nanjing, China, pp. 1320–1324, 2020. [Google Scholar]
33. T. Y. Lin, P. Dollar, R. Girshick, K. He, B. Hariharan et al., “Feature pyramid networks for object detection,” in 30th IEEE Conf. on Computer Vision and Pattern Recognition (CVPR), Honolulu, HI, USA, pp. 936–944, 2017. [Google Scholar]
34. M. Shafiq and Z. Gu, “Deep residual learning for image recognition: A survey,” Applied Sciences-Basel, vol. 12, no. 18, pp. 8972, 2022. [Google Scholar]
35. B. Zoph, V. Vasudevan, J. Shlens and Q. V. Le, “Learning transferable architectures for scalable image recognition,” in IEEE/CVF Conf. on Computer Vision and Pattern Recognition (CVPR), Salt Lake City, UT, USA, IEEE, pp. 8697–8710, 2018. [Google Scholar]
36. G. Huang, Z. Liu, L. van der Maaten and K. Q. Weinberger, “Densely connected convolutional networks,” in 30th IEEE Conf. on Computer Vision and Pattern Recognition (CVPR), Honolulu, HI, USA, IEEE, pp. 2261–2269, 2017. [Google Scholar]
Cite This Article
 Copyright © 2023 The Author(s). Published by Tech Science Press.
This work is licensed under a Creative Commons Attribution 4.0 International License , which permits unrestricted use, distribution, and reproduction in any medium, provided the original work is properly cited.
 Downloads
 Citation Tools