
 Submit a Paper
 Propose a Special lssue
 Open Access
ARTICLE
Eye-Tracking Based Autism Spectrum Disorder Diagnosis Using Chaotic Butterfly Optimization with Deep Learning Model
1 Department of Computer Science and Engineering, Panimalar Engineering College, Chennai, 600123, India
2 Department of Computer Science, University College of Al Jamoum, Umm Al-Qura University, Makkah, 21421, Saudi Arabia
3 Department of Computer Science and Engineering, Saveetha School of Engineering, Saveetha Institute of Medical and Technical Sciences, Chennai, 602105, India
4 School of Computing, SRM Institute of Science and Technology, Kattankulathur, 603203, India
* Corresponding Author: Surendran Rajendran. Email:
Computers, Materials & Continua 2023, 76(2), 1995-2013. https://doi.org/10.32604/cmc.2023.039644
Received 09 February 2023; Accepted 13 June 2023; Issue published 30 August 2023
 View Full Text
 Download PDF
Abstract
Autism spectrum disorder (ASD) can be defined as a neurodevelopmental condition or illness that can disturb kids who have heterogeneous characteristics, like changes in behavior, social disabilities, and difficulty communicating with others. Eye tracking (ET) has become a useful method to detect ASD. One vital aspect of moral erudition is the aptitude to have common visual attention. The eye-tracking approach offers valuable data regarding the visual behavior of children for accurate and early detection. Eye-tracking data can offer insightful information about the behavior and thought processes of people with ASD, but it is important to be aware of its limitations and to combine it with other types of data and assessment techniques to increase the precision of ASD detection. It operates by scanning the paths of eyes for extracting a series of eye projection points on images for examining the behavior of children with autism. The purpose of this research is to use deep learning to identify autistic disorders based on eye tracking. The Chaotic Butterfly Optimization technique is used to identify this specific disturbance. Therefore, this study develops an ET-based Autism Spectrum Disorder Diagnosis using Chaotic Butterfly Optimization with Deep Learning (ETASD-CBODL) technique. The presented ETASD-CBODL technique mainly focuses on the recognition of ASD via the ET and DL models. To accomplish this, the ETASD-CBODL technique exploits the U-Net segmentation technique to recognize interested AREASS. In addition, the ETASD-CBODL technique employs Inception v3 feature extraction with CBO algorithm-based hyperparameter optimization. Finally, the long-short-term memory (LSTM) model is exploited for the recognition and classification of ASD. To assess the performance of the ETASD-CBODL technique, a series of simulations were performed on datasets from the figure-shared data repository. The experimental values of accuracy (99.29%), precision (98.78%), sensitivity (99.29%) and specificity (99.29%) showed a better performance in the ETASD-CBODL technique over recent approaches.Keywords
Autism spectrum disorder (ASD) is a complex neurodevelopmental syndrome that affects both adults and children and is characterized by difficulties in social interaction and repeated behavioral paradigms. In early infancy, such indications begin manifesting themselves, affecting social communication and interaction in addition to adaptive development and academic performance [1]. Concerning social and interpersonal interaction, children with ASD have difficulties and hurdles in nonverbal and verbal communication [2]. They even tend to engage in repeated behavior. For the initial identification of autism, several physiological and behavioral approaches were utilized to detect autism accurately and effectively in children. Prediction indicators for informing parents of behavior, course of their children, and physiological status very early were required, with updating scientific research centers regarding finding suitable treatments and solutions [3]. Although physiological and clinical features were unidentified early, a few energetic behavioral features have a large capability for determining autism and its grade [4]. Eye-tracking (ET) technique is one of the promising and significant pointers for ASD as it is easy to analyze, speed, applicable to all ages, and inexpensive [5]. Although there are advantages to collecting eye-tracking data for detecting autism spectrum disorder (ASD), there are also some drawbacks to this method of gathering information on the behavior and cognition of people with ASD.
The generalizability of studies using eye-tracking data for ASD detection is sometimes hindered by a small sample size. Eye-tracking data variability: Identifying persistent behavioral patterns that are indicative of ASD can be difficult due to the high inter- and intrasubject variability in eye-tracking tests among people with ASD. Eye-tracking behavior can also be affected by co-occurring illnesses, such as attention deficit hyperactivity disorder (ADHD), which is common among people with an autism spectrum disorder. In persons with autism spectrum disorder, our understanding of the connection between eye movements and behavior is still in its infancy. Certain eye movement patterns have been recognized as being indicative of ASD, but the underlying mechanisms and their relationship to behavior remain poorly understood. Recording and analyzing eye-tracking data is hindered by technological factors including the wide range of available equipment and the complexity of available analytic techniques. The precision and dependability of the data may be compromised as a result of these restrictions. Data gathered from eye-tracking devices may not apply to all activities due to factors like the absence of visual cues or the presence of significant movement throughout the activity. Social attention can be defined as a main functional procedure related to biomarker studies in ASD [6]. Across various works, investigational modalities, and jobs, persons with ASD display a transformed interest in public data matched to non-ASD controls. Eye tracking (ET) provides insight into social attention by permitting accurate moment-by-moment quantification of gaze paradigms of persons since they visually processed social data [7]. As ET can be scalable, safe, non-invasive, and simply accepted by contributors from infancy over maturity and through various functions which include important cognitive impairment [8]. It offers a potent technique for creating and locating social attentional biomarkers in complex disorders like ASD. Like several biomarker technologies, ET-related biomarkers for ASD could develop numerous contexts of use [9], for example, as response biomarkers, diagnostic, prognostic, or predictive. Additionally, BIOMARKERS may act as diagnostic enrichment biomarkers to reduce study population heterogeneity, enabling a more accurate assessment of interference in small homogeneous samples [10]. The technique depends on skeleton data and long-short-term memory (LSTM) was modeled in [11]. In the initial phase of this technique, the OpenPose technique was utilized for gaining the primary skeleton datasets from videos of ASD children. Moreover, 4 demonizing techniques were modeled for eliminating the noise of the initial skeleton dataset. The distance between the old and new skeletons is then used by the authors to track many ASD kids in the same scene. In the final phase, for classifying the ASD children’s activities, the NN depending on LSTM was modeled.
Fang et al. [12] presented a new approach for finding children with ASD dependent on stimuli including gaze-following. Persons with ASD were characterized by having typical visual attention paradigms, particularly in social scenes. The authors modeled a new deep neural network (DNN) model for extracting discriminatory features and classifying children with ASD and healthy controls on single imagery. Elbattah et al. [13] formulated machine learning (ML)-related technique for assisting the diagnosis procedure. This technique depends on learning sequence-oriented paradigms in saccadic eye movement. The main ideology was to signify eye-tracking reports as word-based letters discussing a series of saccades and fixations. Hence, the study borrowed the natural language processing (NLP) approach to change the unstructured eye-tracking dataset. In [14], the authors proposed an automatic assessment structure for assessing common prosody and stereotyped idiosyncratic phrases relevant to ASD. They concentrated on the talking and verbal impairments of younger kids with ASD. Initially, the authors used the Open SMILE toolkit for the extraction of utterance level high dimensional acoustic attributes and support vector machine (SVM) backend as the traditional baseline. Secondly, the authors proposed various endwise DNN setups and configurations for modeling a common prosody label obtained straight from the voice spectrogram after the constant Q transform.
Wei et al. [15] model a new saliency predictive technique for children with ASD. Depending on the convolutional neural network (CNN), the multilevel features were integrated and extracted into 3 attention maps, which were leveraged for generating the forecasted saliency map. The deep administration of attention maps can be used to make connections between the deep layers and ground truth in the NN during the training period. In [16], the authors applied the recent advancements in DNN to the eye-tracking dataset in this study for categorizing children without and with ASD. The authors made an extraction of a dynamic saccadic scan path on all images for every subject depending on the collected eye movement dataset. After, the authors used the hierarchical features learned from multidimensional visual salient features and CNN for encoding the scan paths. Then, the authors adopted the SVM to study the relation between encrypted pieces of scan paths and labeled from 2 classes through supervised learning. In [17], 3 AI methods, namely, ML, deep learning (DL), and a hybrid method, have been developed for the initial diagnosis of autism. The initial approach, neural networks (NN) [Artificial neural networks (ANNs) and feedforward neural networks (FFNNs), depends on the feature classification derived by a hybrid technique between grey level co-occurrence matrix (GLCM) and local binary pattern (LBP) methods. The second method utilized a pretrained CNN method, like ResNet-18 and GoogleNet, dependent on the extraction of deep feature maps. The next method utilized the hybrid technique (ResNet-18 and GoogleNet) and ML (SVM), named ResNet-18 + SVM and GoogleNet + SVM. The eye-tracking approach offers valuable data regarding the visual behavior of children for accurate and early detection. Eye-tracking data can offer insightful information about the behavior and thought processes of people with ASD, but it’s important to be aware of its limitations and to combine it with other types of data and assessment techniques to increase the precision of ASD detection. It operates by scanning the paths of eyes for extracting a series of eye projection points on images for examining the behavior of children with autism. The purpose of this research is to use deep learning to identify autistic disorders based on eye tracking. This study develops an Eye Tracking based Autism Spectrum Disorder Diagnosis using Chaotic Butterfly Optimization with Deep Learning (ETASD-CBODL) technique.
The presented ETASD-CBODL technique mainly focuses on the recognition of ASD via the ET and DL models. To accomplish this, the ETASD-CBODL technique exploits the U-Net segmentation technique to recognize interested AREASS. In addition, the ETASD-CBODL technique employs Inception v3 feature extraction with CBO algorithm-based hyperparameter optimization. An essential component of the ETASD-CBODL technique, the Inception v3 feature extraction, enables it to extract detailed and insightful features from the input images, potentially enhancing the model’s accuracy and robustness. Finally, the long short-term memory (LSTM) model is exploited for the recognition and classification of ASD. The LSTM model, which enables the model to capture the temporal dynamics and dependencies in the time-series data, is an effective tool for identifying and categorizing ASD in the ETASD-CBODL approach. This can give researchers important new insights into how people with ASD behave. In the Contribution of the study, we have developed an automated Autism spectrum disorder (ASD) detection using the proposed Eye tracking (ET) based Autism Spectrum Disorder Diagnosis using Chaotic Butterfly Optimization with Deep Learning (ETASD-CBODL). The presented ETASD-CBODL technique concentrates on the detection and classification of ASD via the ET and DL models. To accomplish this, the ETASD-CBODL technique follows different subprocesses, namely U-Net segmentation, Inception, v3 feature extraction, CBO-based hyperparameter optimizer, and LSTM classification. To assess the performance of the ETASD-CBODL technique, a series of simulations were performed on Datasets from the figure-shared data repository. The remainder of the manuscript is divided into the following sections: Section 2 discusses the proposed ETASD-CBODL technique’s materials and methods. After that, Section 3 analyses the results, and Section 4 talks about the performance evaluation with other approaches. The important findings of the suggested research are then summarized in Section 5.
In this study, we have developed an automated ASD detection using the proposed ETASD-CBODL technique. The presented ETASD-CBODL technique concentrates on the detection and classification of ASD via the ET and DL models. To accomplish this, the ETASD-CBODL technique follows different subprocesses, namely U-Net segmentation, Inception, v3 feature extraction, CBO-based hyperparameter optimizer, and LSTM classification. Fig. 1 represents the workflow of the ETASD-CBODL approach. The performance of the ETASD-CBODL technique, which is a relatively new method for diagnosing autism spectrum disorder (ASD), can vary depending on the accuracy of the data, the selection of hyperparameters, and the particular job at hand. Comparing the ETASD-CBODL method to other methods for identifying ASD, multiple studies have found encouraging results. The capacity of the ETASD-CBODL technique to combine many data modalities, including eye-tracking, motion capture, and voice, to improve the accuracy of ASD identification is one of its main advantages. When opposed to methods that rely on just one type of data modality, the multimodal approach enables the model to capture a variety of behavioral features that are pertinent to ASD. The ETASD-CBODL technique also has the benefit of automatically extracting features from the data using deep learning models, such as the LSTM model and the Inception v3 feature extractor. Due to its ability to identify more intricate patterns and correlations in the data, this feature extraction method may be more efficient than the manual feature selection approaches employed in conventional machine learning techniques. Overall, while more research is needed to fully evaluate the performance of the ETASD-CBODL technique, the existing studies suggest that it has the potential to be an effective approach for detecting ASD, with advantages over existing techniques such as multimodal integration and automatic feature extraction.
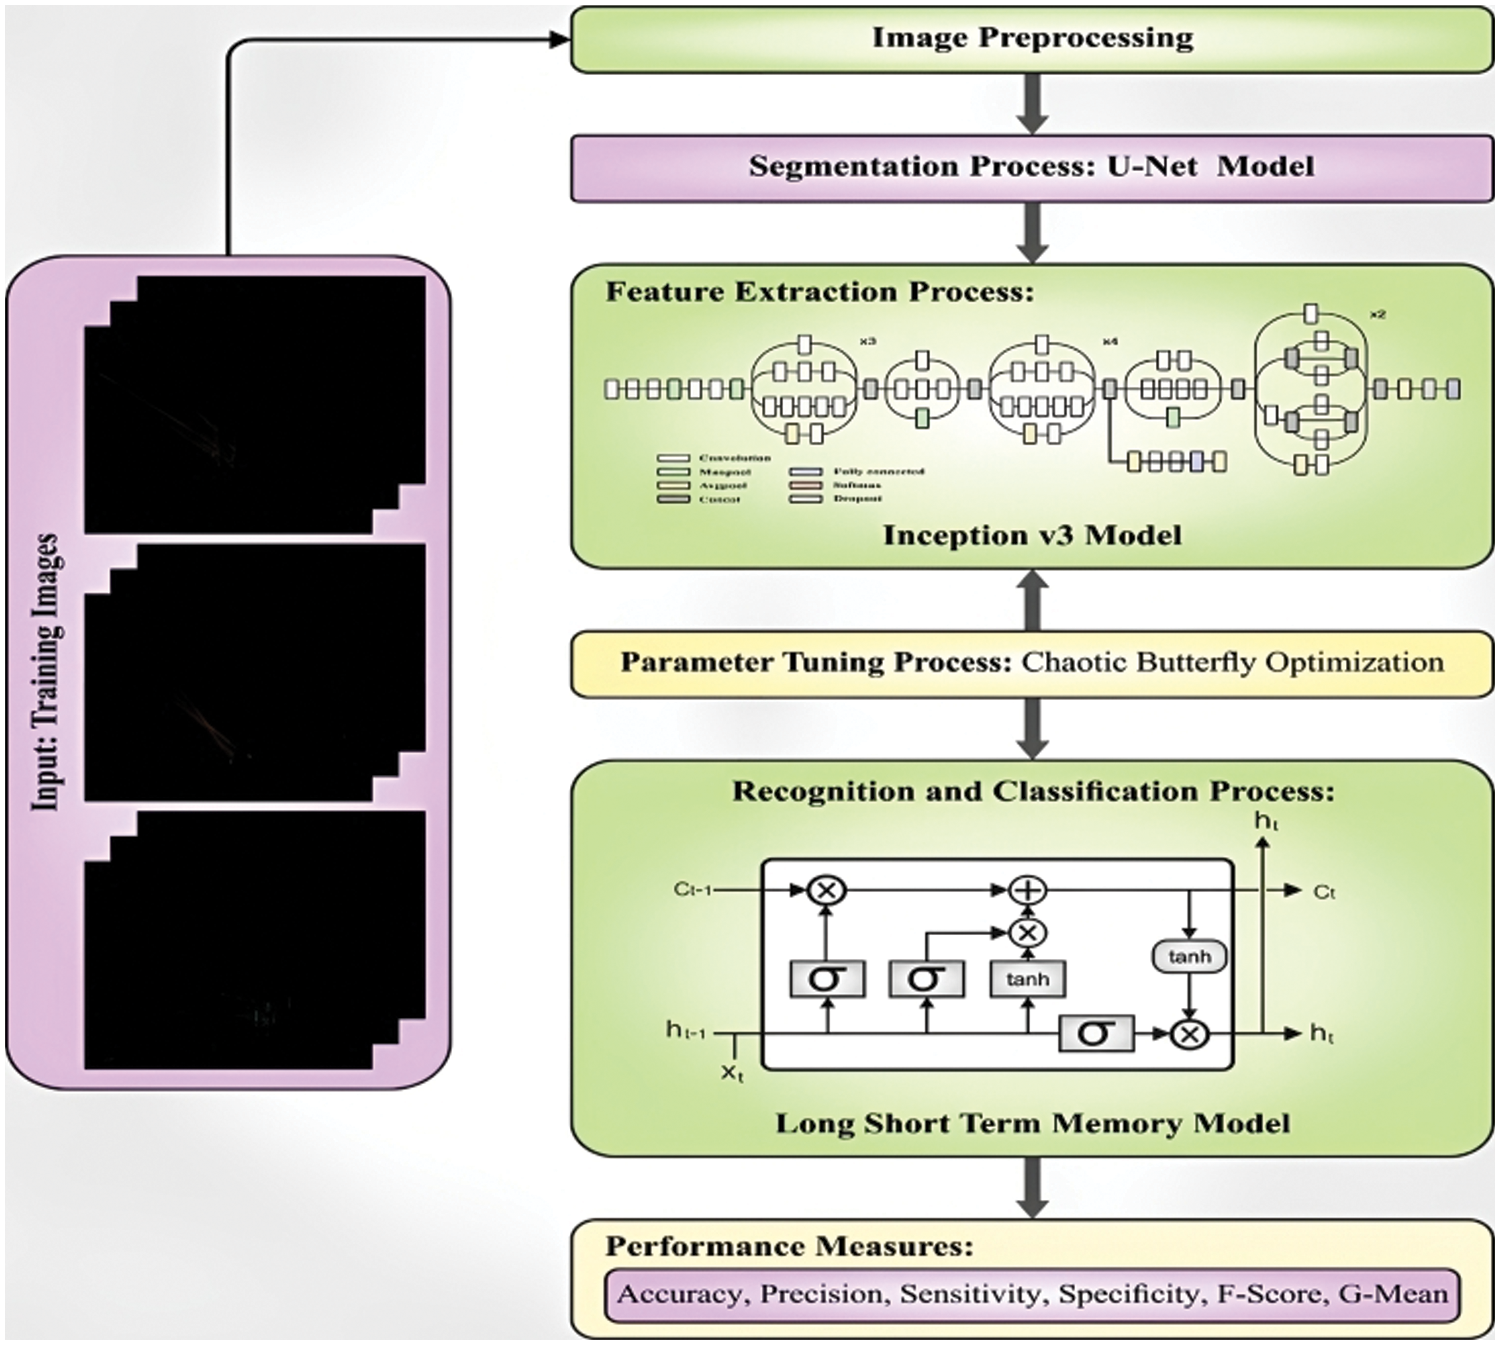
Figure 1: Workflow of ETASD-CBODL system
2.1 The U-Net-Based Segmentation
In this study, the ETASD-CBODL technique exploits the U-Net segmentation technique to recognize interested AREASS. The structure of the
For reducing the count of attributes in the network and the threat of overfitting, a down-sampling function was chosen as an in-between procedure for linking all Conv blocks in the contracting path. The
whereas
Segmenting the input image into various regions or items of interest can aid the ETASD-CBODL approach in recognizing areas of concentration. This is accomplished by utilizing an image segmentation-specific convolutional neural network architecture. The encoder and decoder are the two components that make up the U-Net architecture. While the decoder up samples the feature, maps and creates a segmentation mask for each pixel in the input image, the encoder down samples the input picture and extracts features from it. In addition, the U-Net architecture has to skip links that let the decoder access data from earlier layers of the encoder, aiding in the preservation of spatial information and enhancing segmentation precision. The ETASD-CBODL technique can locate concentrated areas in an input image, such as objects or regions that are important for the job at hand, by employing the U-Net segmentation technique. The U-Net segmentation technique, for instance, can assist in identifying individual cells and separating them from the background if the aim is to detect and classify various types of cells in a biological sample. As a result, the ETASD-CBODL technique may be more accurate and capable of identifying areas of interest.
2.2 Feature Extraction Using Optimal Inception v3 Model
To derive an optimal set of features, the Inception v3 model is used. Although the methods like VGG-16, VGG-19, and so on, there are well-developed structured networks for classification. The important constraint of this network is that they compromise the computation cost [19]. Furthermore, this network was influenced by over fitting problems. Furthermore, propagating gradient updates across the entire network is challenging. The Inception Model was a distinctive portion in the network, where different convolution actions with different filter sizes were the same time made that are later combined and transmit the outcome to the following layer. Based on the concept of Inception, a model, an assured network structure named Inception-Vl (GoogleNet). Inception-Vl is represented as a champion of the Large-Scale Visual Recognition Competition (LSVRC2014), performed by ImageNet. The network structure comprises an overall 22 layers with various inception models. The overall number of convolutional layers in the network is 50, and every model encompasses 1 × 1, 3 × 3, and
where
To cover these issues, the InceptionV2 model is presented, where every 5
where
In Eq. (5),
where
where
At every iteration,
In Eq. (8),
The study demonstrates that the conventional BOA technique has a higher finding ability. But it frequently prematurely reaches a local ideal that reduces the efficiency of the optimization while handling the multi-modal and complex optimization. Hence, it is essential to enhance the performance of the optimization and modify the original BOA. For this reason, some research studies have suggested integrating chaos into BOA for avoiding problems in performance and boosting optimization efficacy. In non-linear dynamic systems, a bounded dynamic behavior named chaos can be described by a chaos map that produces a small range of random numbers regarding the given conditions [28,29]. Through assessing Eq. (4), we have noted that the ability of the butterfly to identify the scent produced by other butterflies is the major aspect of BOA, meanwhile, it directs the flight during the search process [30,31]. Therefore, the parameter c should not be kept constant in the optimization strategy while addressing challenging optimization issues. Finding a smaller
The fitness selection was a main crucial factor in the CBO method. Solution encrypting can be utilized to evaluate the goodness of the candidate solutions. The accuracy value was the main condition leveraged to devise a fitness function.
The expression’s TP and FP letters stand for the true positive and false positive values, respectively.
The Inception of v3 feature extraction, which offers a comprehensive representation of the input images that can capture intricate visual patterns and characteristics, is essential to the success of the ETASD-CBODL approach. A deep convolutional neural network created for image classification tasks is known as the Inception v3 architecture. It starts with several layers of convolutional and pooling operations and continues with some modules that employ parallel convolutions with various filter sizes to capture information at various scales. Additional classifiers in the Inception v3 architecture assist the model to learn features that are helpful for categorization. The Inception v3 architecture serves as a feature extractor in the ETASD-CBODL approach, mapping the input images to a high-dimensional feature space. The ETASD-CBODL model is constructed using the features extracted by Inception v3 as input to some of the convolutional and dense layers. The ETASD-CBODL technique benefits from the Inception v3 feature extraction since it gives the model access to a large number of features that are indicative of the input images. The Inception v3 architecture was developed using millions of photos from countless categories in massive image datasets like ImageNet. The ETASD-CBODL technique can take advantage of the knowledge gained from these sizable datasets and apply it to the target job of interest, such as cell segmentation or object detection, by employing Inception v3 as a feature extractor.
2.3 The LSTM-Based Classification
At the final stage, the LSTM model is exploited for the acknowledgment and classification of ASD. LSTM refers to a kind of Recurrent Neural Network (RNN), viz, multilayer NN. Hochreiter and Schmidhuber originally introduced an LSTM model to overcome the gradient vanishing or exploding problem [32].
The input gate decides what data is transported from the former cell to the present cell. The forget gate is used for storing the data from the input to the preceding memory. The control gate regulates the status of cells and they are expressed as follows:
Here,
The Long Short-Term Memory (LSTM) model captures the temporal dependencies and dynamics in the time-series data, which can provide important information about the behavior of people with ASD, and helps in the recognition and classification of autism spectrum disorder (ASD) in the ETASD-CBODL technique. In the ETASD-CBODL technique, time-series data, such as eye-tracking or motion capture data that capture the movements and behavior of people with ASD are processed using the LSTM model. The LSTM model is a kind of recurrent neural network (RNN) that works well for processing sequential inputs because it can selectively recall and forget information over time. The ETASD-CBODL technique can extract features that are important for identifying and diagnosing ASD by utilizing the LSTM model to capture the temporal dependencies and dynamics in the time-series data. The LSTM model, for instance, can be trained to recognize patterns in the eye-tracking data that are typical of people with ASD, such as prolonged fixations on particular regions of interest or diminished social gaze. To increase the precision of ASD recognition and classification, the LSTM model can also be combined with other forms of data, such as image or audio data. The LSTM model, for instance, can be used to analyse audio recordings of vocalizations and speech patterns made by people with ASD, which can provide more details about their behavior and communication skills.
The accuracy of the model can be significantly impacted by the caliber of the data used to train it. The ETASD-CBODL method can be more accurate by gathering high-quality data that is typical of the population being investigated. The ETASD-CBODL method uses hyper parameters to regulate the complexity of the model and the training process. Using techniques like the CBO algorithm to optimize these hyper parameters can help to increase the model’s precision. Even though the ETASD-CBODL technique uses the Inception v3 feature extractor, which is meant to automatically extract pertinent features from the data, it may still be possible to further optimize the feature selection procedure to increase the model’s accuracy. Although the ETASD-CBODL technique already uses a variety of data modalities, including eye-tracking, motion capture, and speech, it may be possible to include more modalities to increase the model’s precision, such as electroencephalography (EEG) or functional magnetic resonance imaging (fMRI) data. This method entails retraining a deep learning model on a dataset size, and then optimizing it for a particular task on a smaller dataset. The ETASD-CBODL technique may be more accurate by utilizing preexisting knowledge in the model when transfer learning is applied. The ETASD-CBODL technique has produced encouraging results in some studies, but it will be crucial to test its effectiveness on larger datasets to make sure it can be used for a wider range of populations. In this section, the experimental validation of the ETASD-CBODL technique is tested using the ASD dataset with 547 total instances [35], comprising 219 images under the ASD class and 328 images under the TD class as represented in Fig. 2 illustrates the sample images.
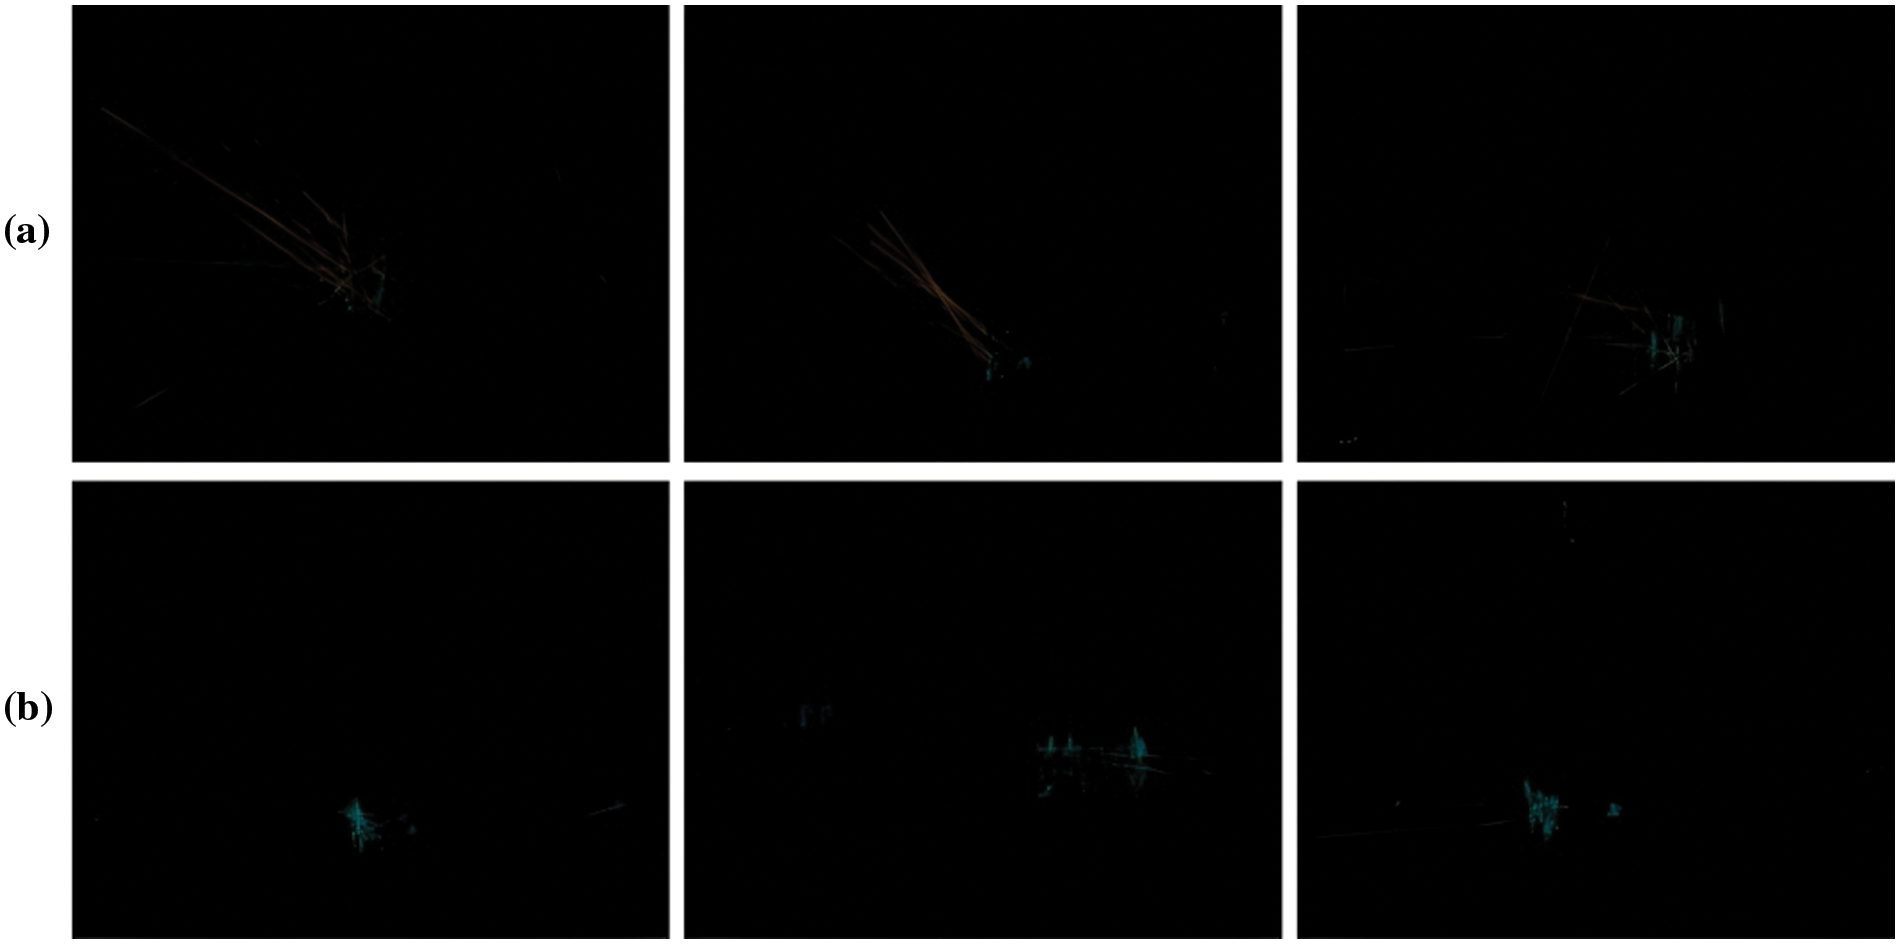
Figure 2: Sample Images (a) ASD (b) TD
The confusion matrix of the ETASD-CBODL technique is illustrated in Fig. 3. With 80% of TRS, the ETASD-CBODL technique categorizes 178 samples into the ASD class and 248 samples into the TD class [36]. Meanwhile, with 20% of TSS, the ETASD-CBODL method categorizes 40 samples into the ASD class and 69 samples into the TD class. Eventually, with 70% of TRS, the ETASD-CBODL approach categorizes 138 samples into the ASD class and 222 samples into the TD class.
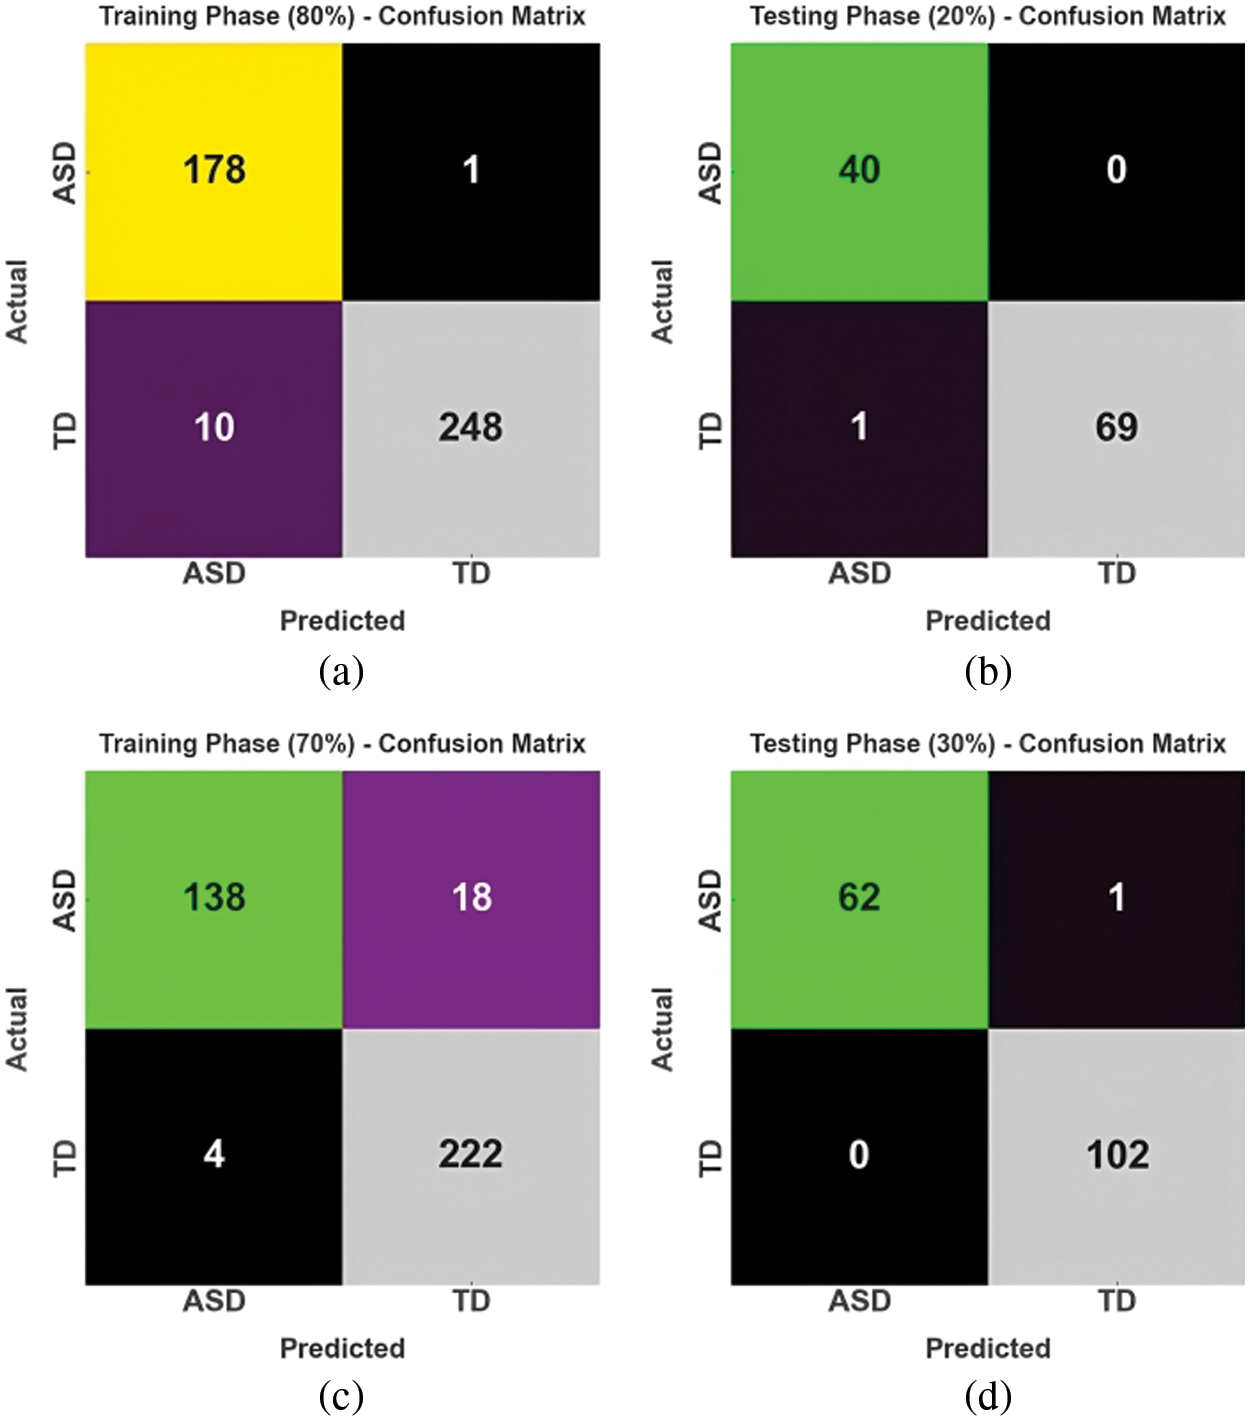
Figure 3: Confusion matrices of ETASD-CBODL approach, (a and b) TRS/TSS of 80:20 and (c and d) TRS/TSS of 70:30
Finally, with 30% of TSS, the ETASD-CBODL algorithm categorizes 62 samples into the ASD class and 102 samples into the TD class. In Fig. 4, an overall classifier outcome of the ETASD-CBODL technique with 80:20 of TRS/TSS is provided. The experimental values represent that the ETASD-CBODL technique has shown proper results under both classes. For instance, with 80% of TRS, the ETASD-CBODL technique reaches average
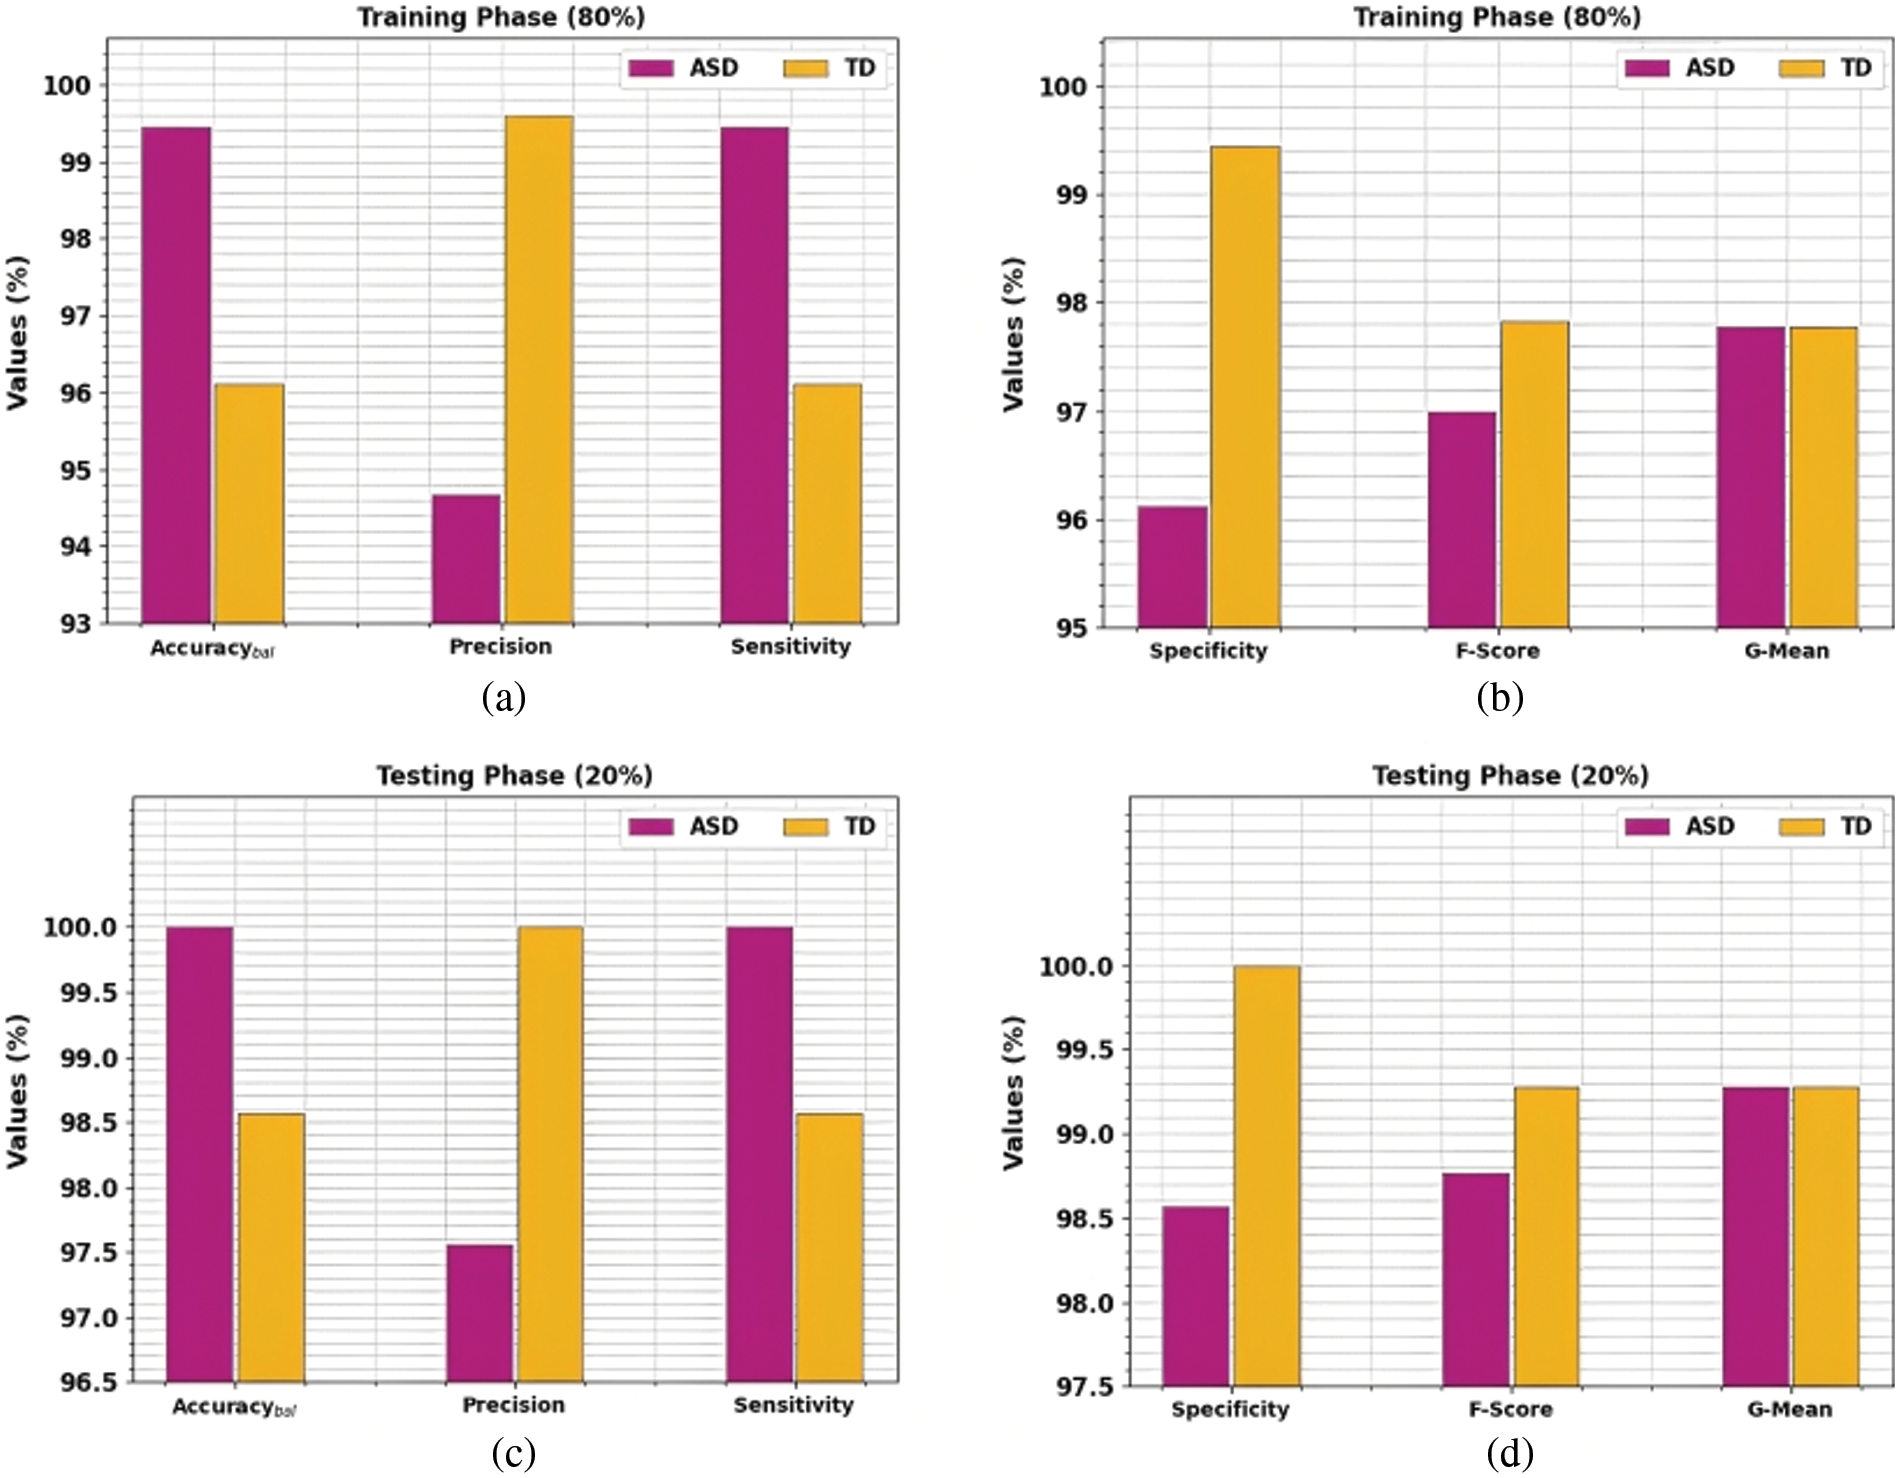
Figure 4: Classifier outcome of ETASD-CBODL approach, (a and b) TRS of 80% and (c and d) TSS of 20%
In Fig. 5, an overall classifier outcome of the ETASD-CBODL approach with 70:30 of TRS/TSS is provided. The results exhibited by the ETASD-CBODL method have shown proper results under both classes. For example, with 70% of TRS, the ETASD-CBODL method reaches an average
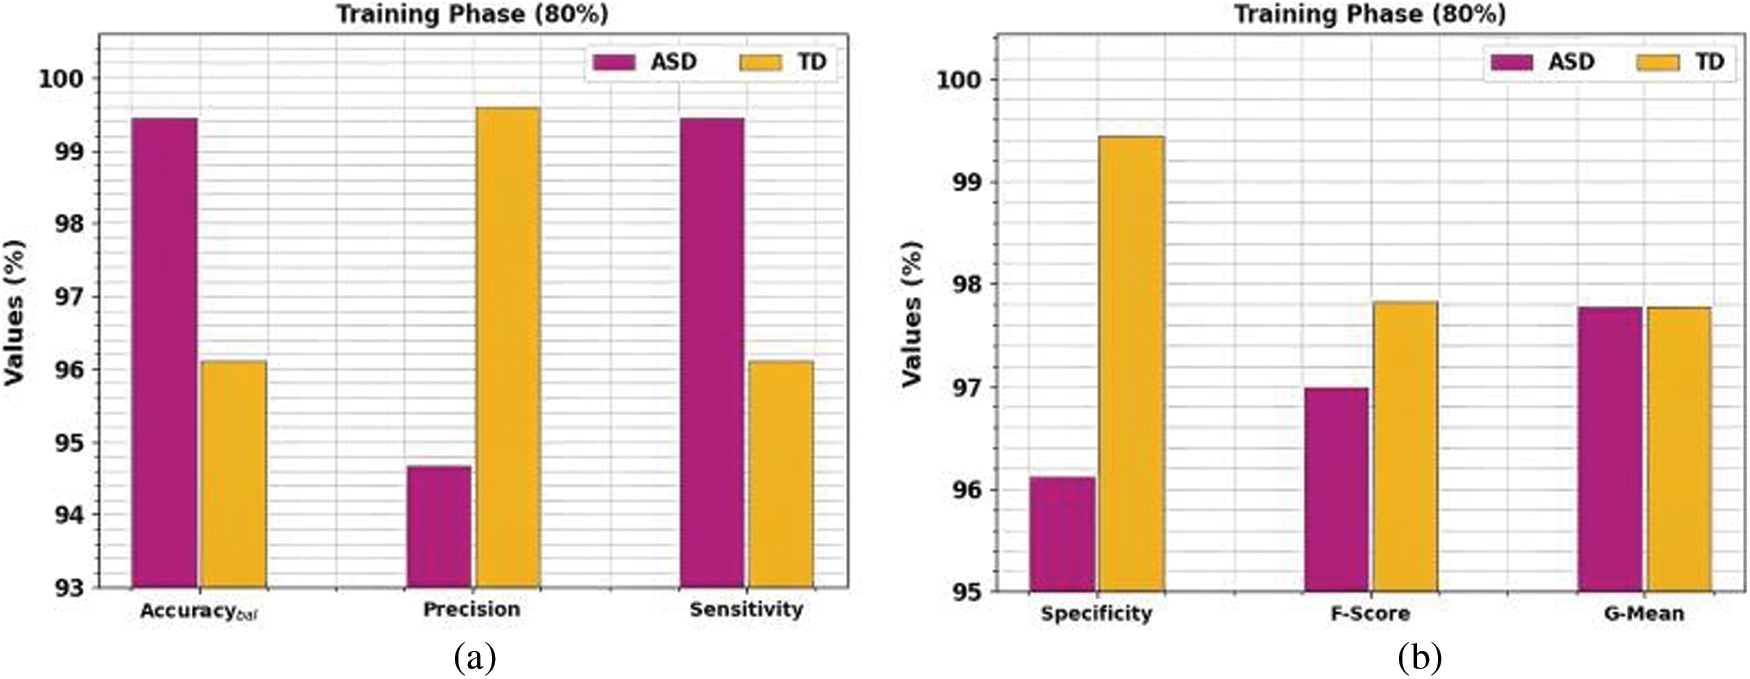
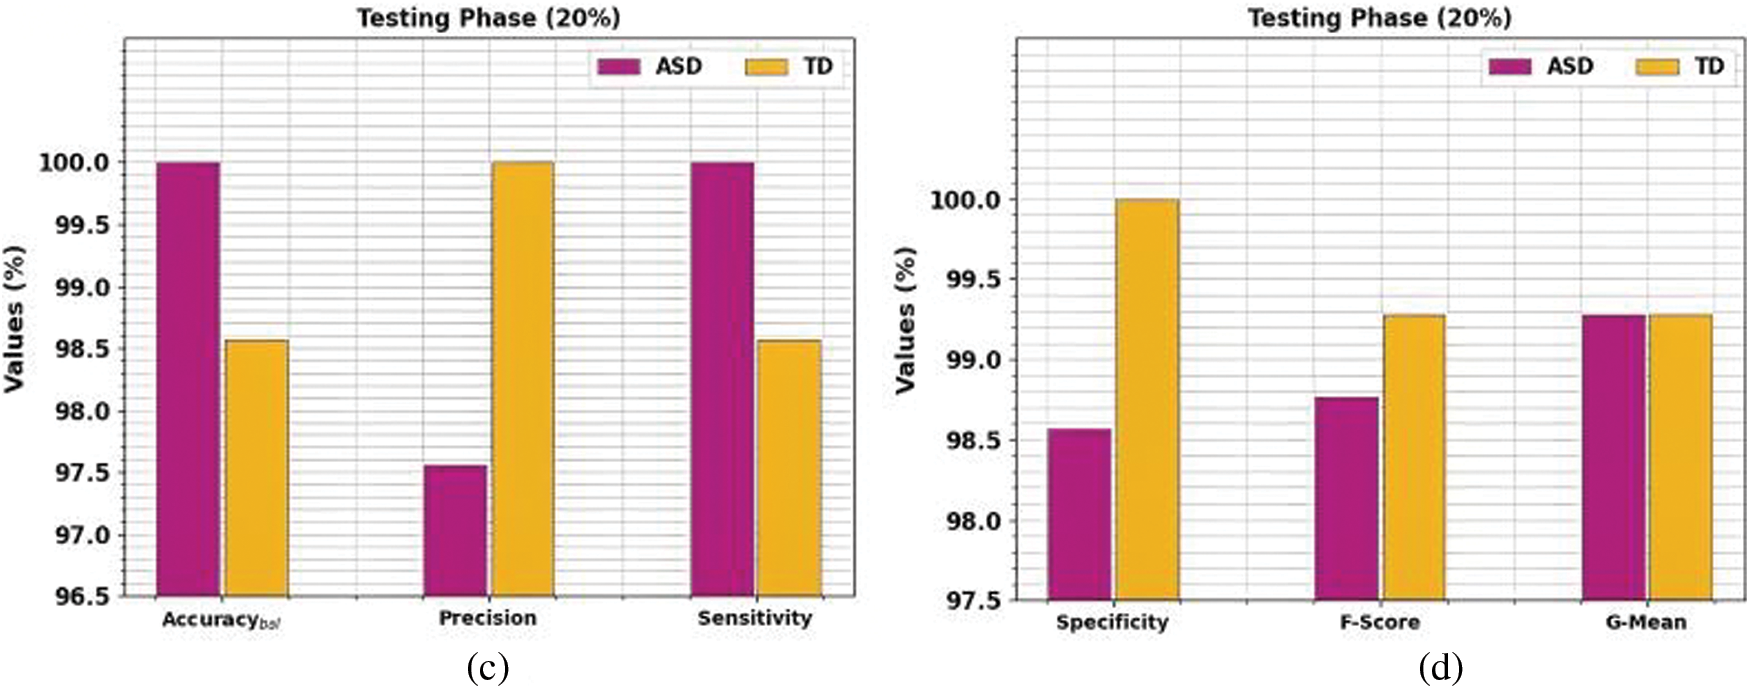
Figure 5: Classifier outcome of ETASD-CBODL approach, (a and b) TRS of 70% and (c and d) TSS of 30%
The TACY and VACY of the ETASD-CBODL approach are investigated with ASD performance in Fig. 6. The figure exhibits that the ETASD-CBODL approach has shown improved performance with increased values of TACY and VACY. Notably, the ETASD-CBODL technique has gained maximum TACY outcomes.
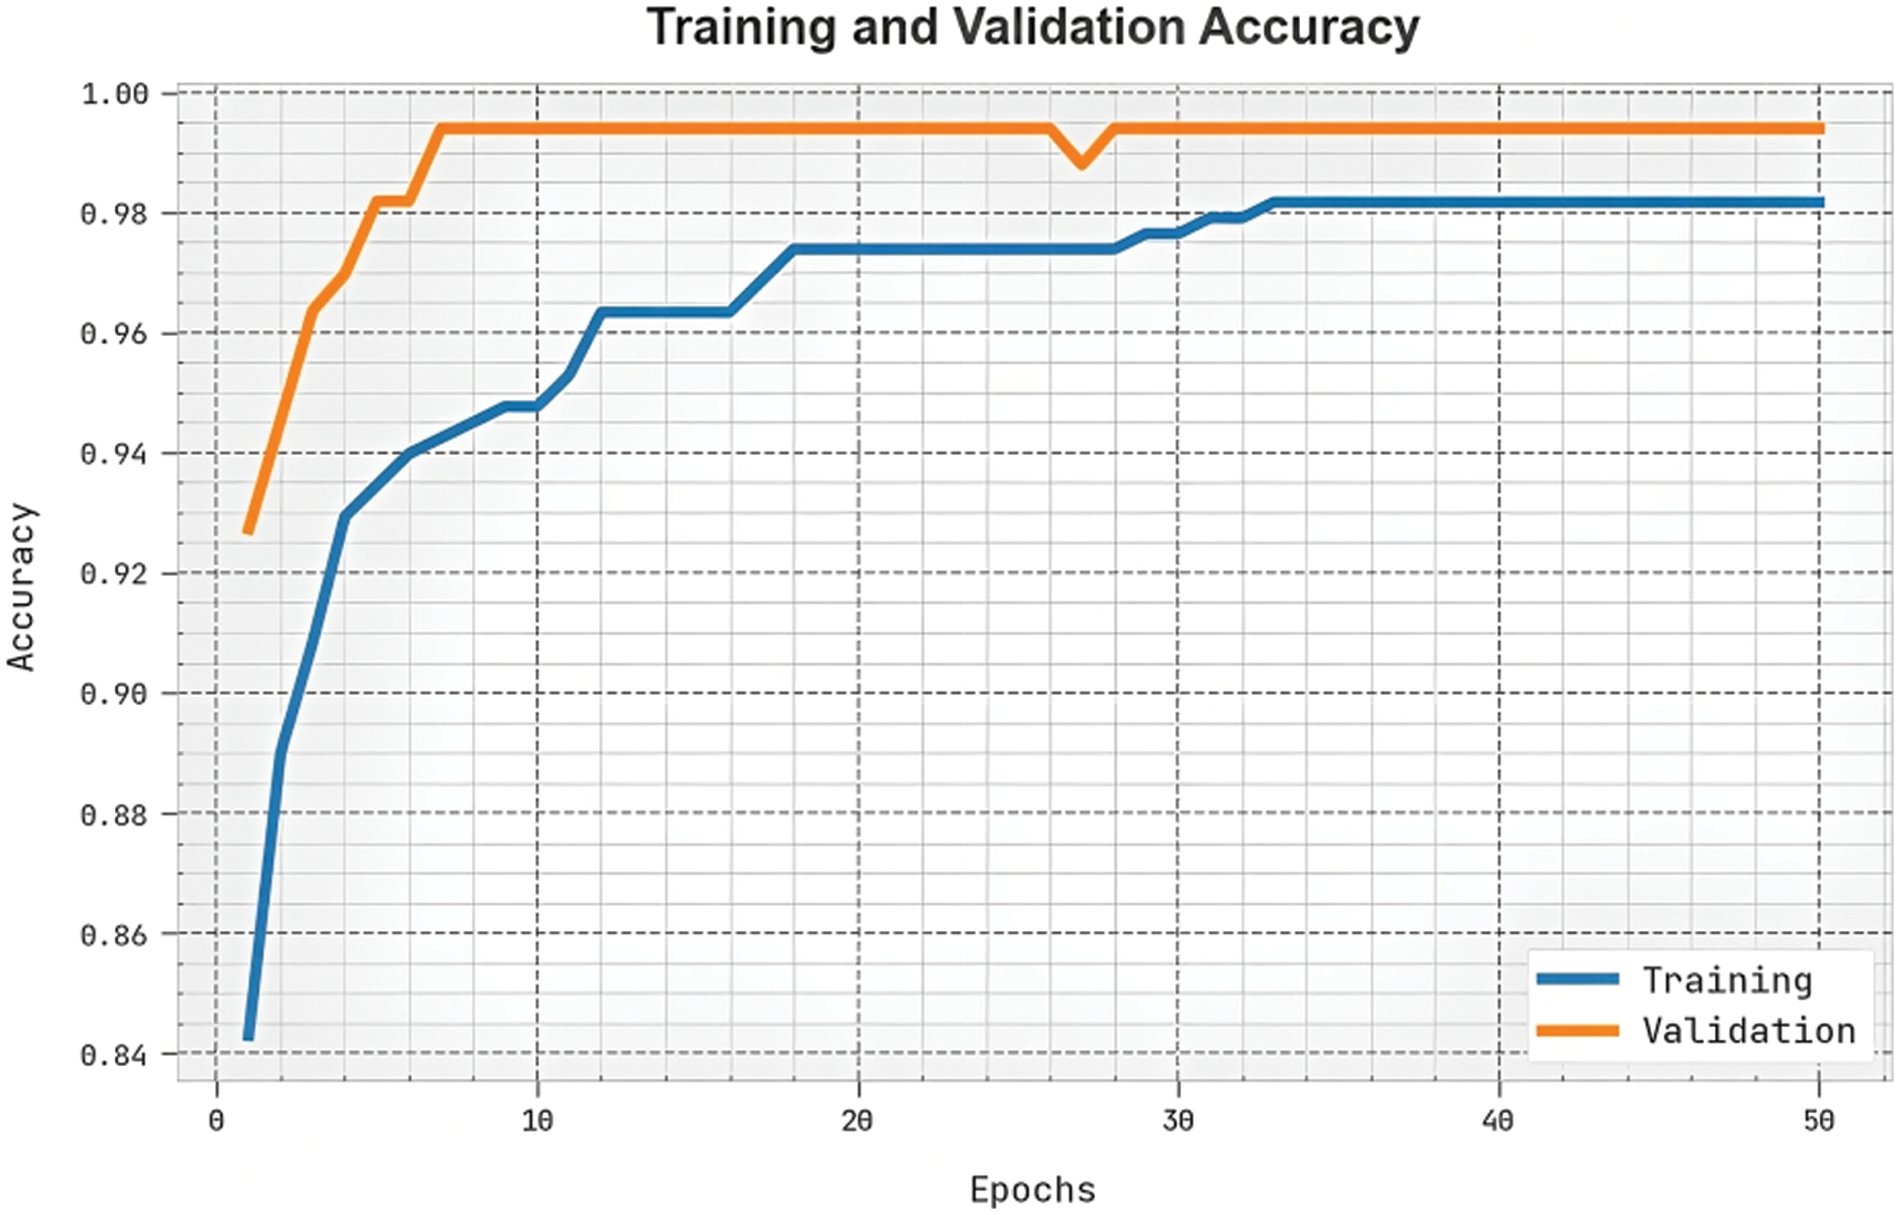
Figure 6: TACY and VACY outcome of ETASD-CBODL approach
The TLOS and VLOS of the ETASD-CBODL approach are tested on ASD performance in Fig. 7. The figure infers that the ETASD-CBODL technique has revealed better performance with minimal values of TLOS and VLOS. Seemingly, the ETASD-CBODL model has reduced VLOS outcomes.
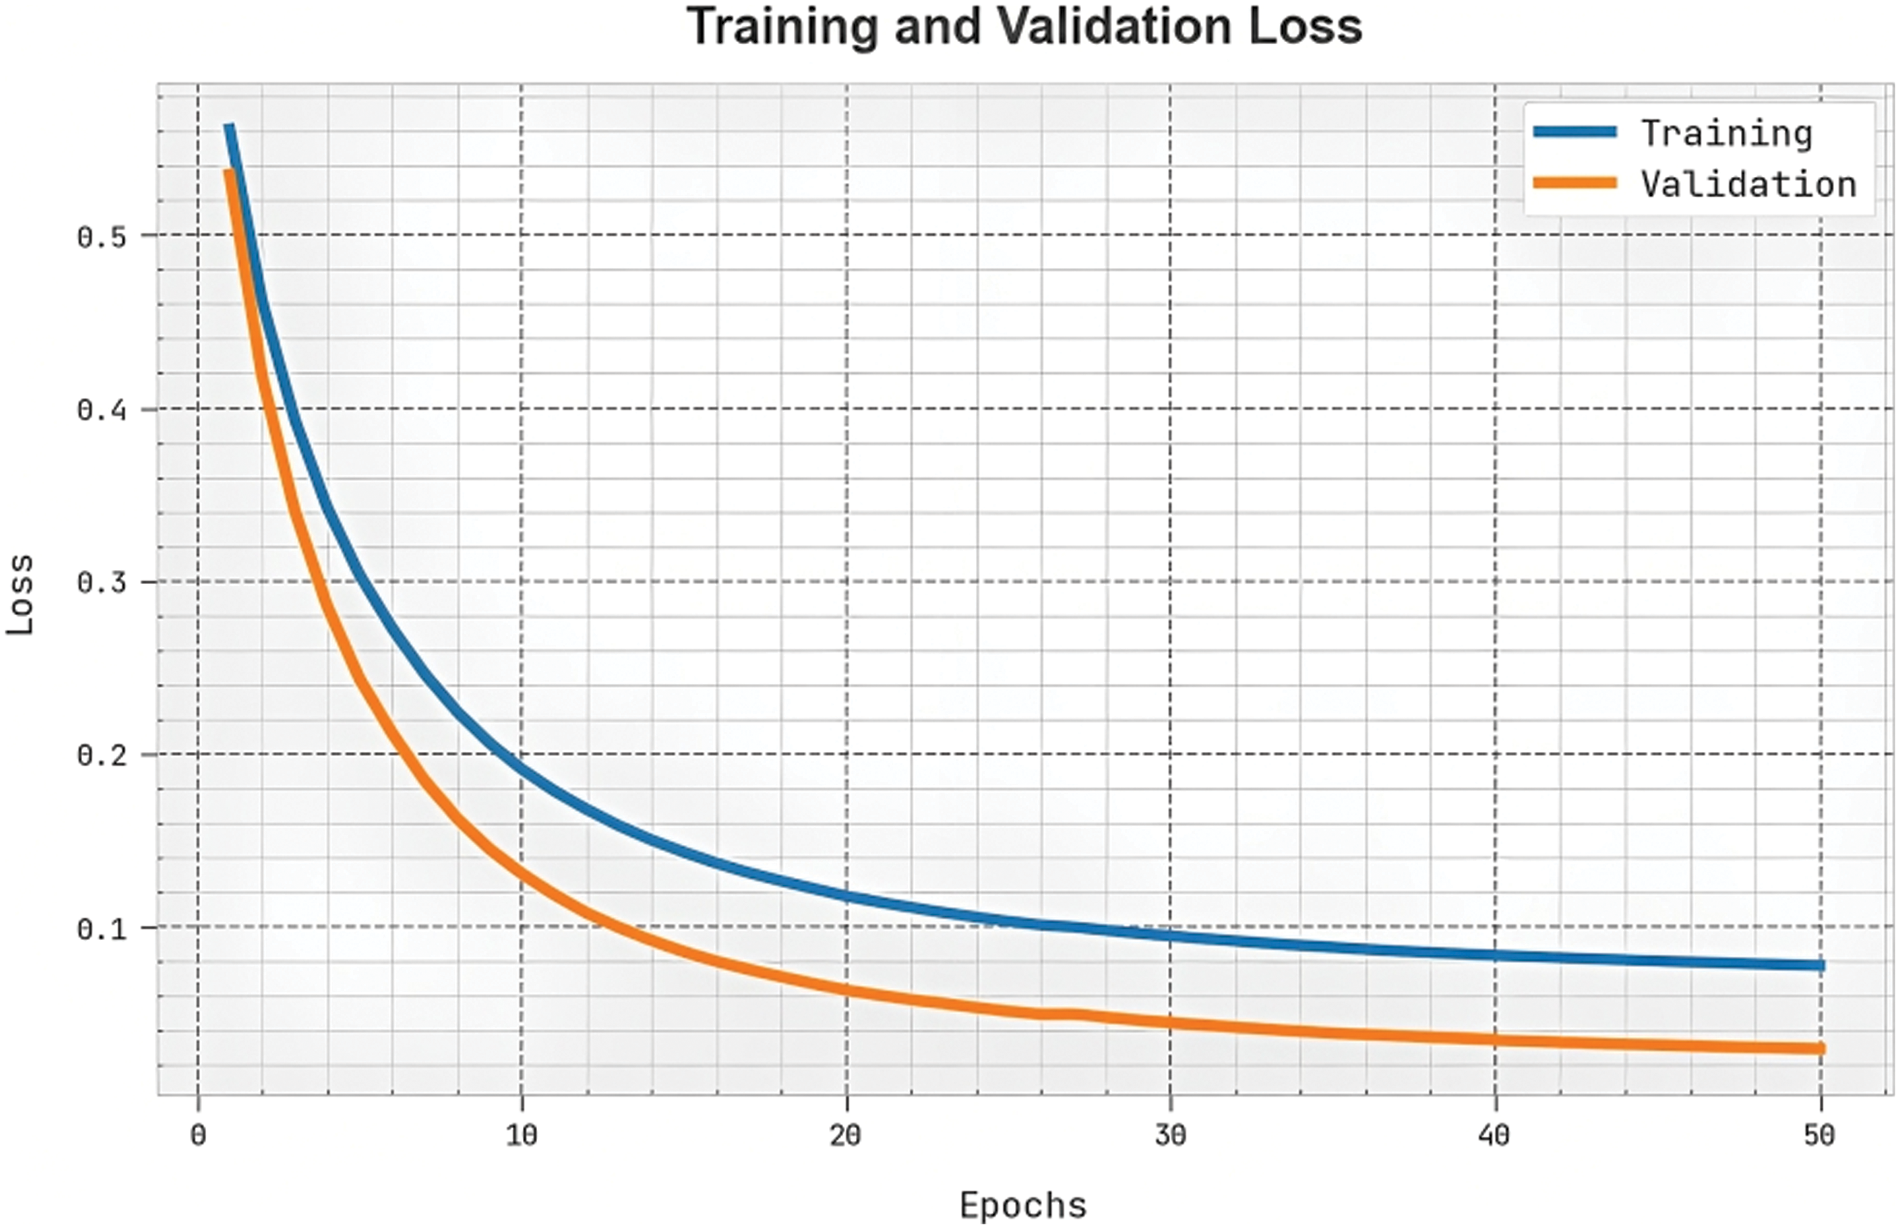
Figure 7: TLOS and VLOS outcome of ETASD-CBODL approach
A clear precision-recall analysis of the ETASD-CBODL approach under the test database is given in Fig. 8. The figure shows the ETASD-CBODL algorithm has enhanced the values of precision recall values under all classes. The detailed ROC study of the ETASD-CBODL algorithm under the test database is depicted in Fig. 9. The results denoted the ETASD-CBODL methodology has shown its capability in classifying different classes under the test database. A comparative MSE examination of the ETASD-CBODL technique with other techniques is performed in Fig. 10. The results infer that the GoogleNet-SVM and ResNet-18-SVM models obtain poor performance with increasing MSE of 0.00049 and 0.00040, respectively. Along with that, the ANN, GoogleNet, and ResNet-18 models obtain closer MSE of 0.00035, 0.00031, and 0.00033, respectively. Meanwhile, the FFNN model results in a near-optimal MSE of 0.00023. Furthermore, the ETASD-CBODL technique gains effectual outcomes with the least MSE of 0.00015.
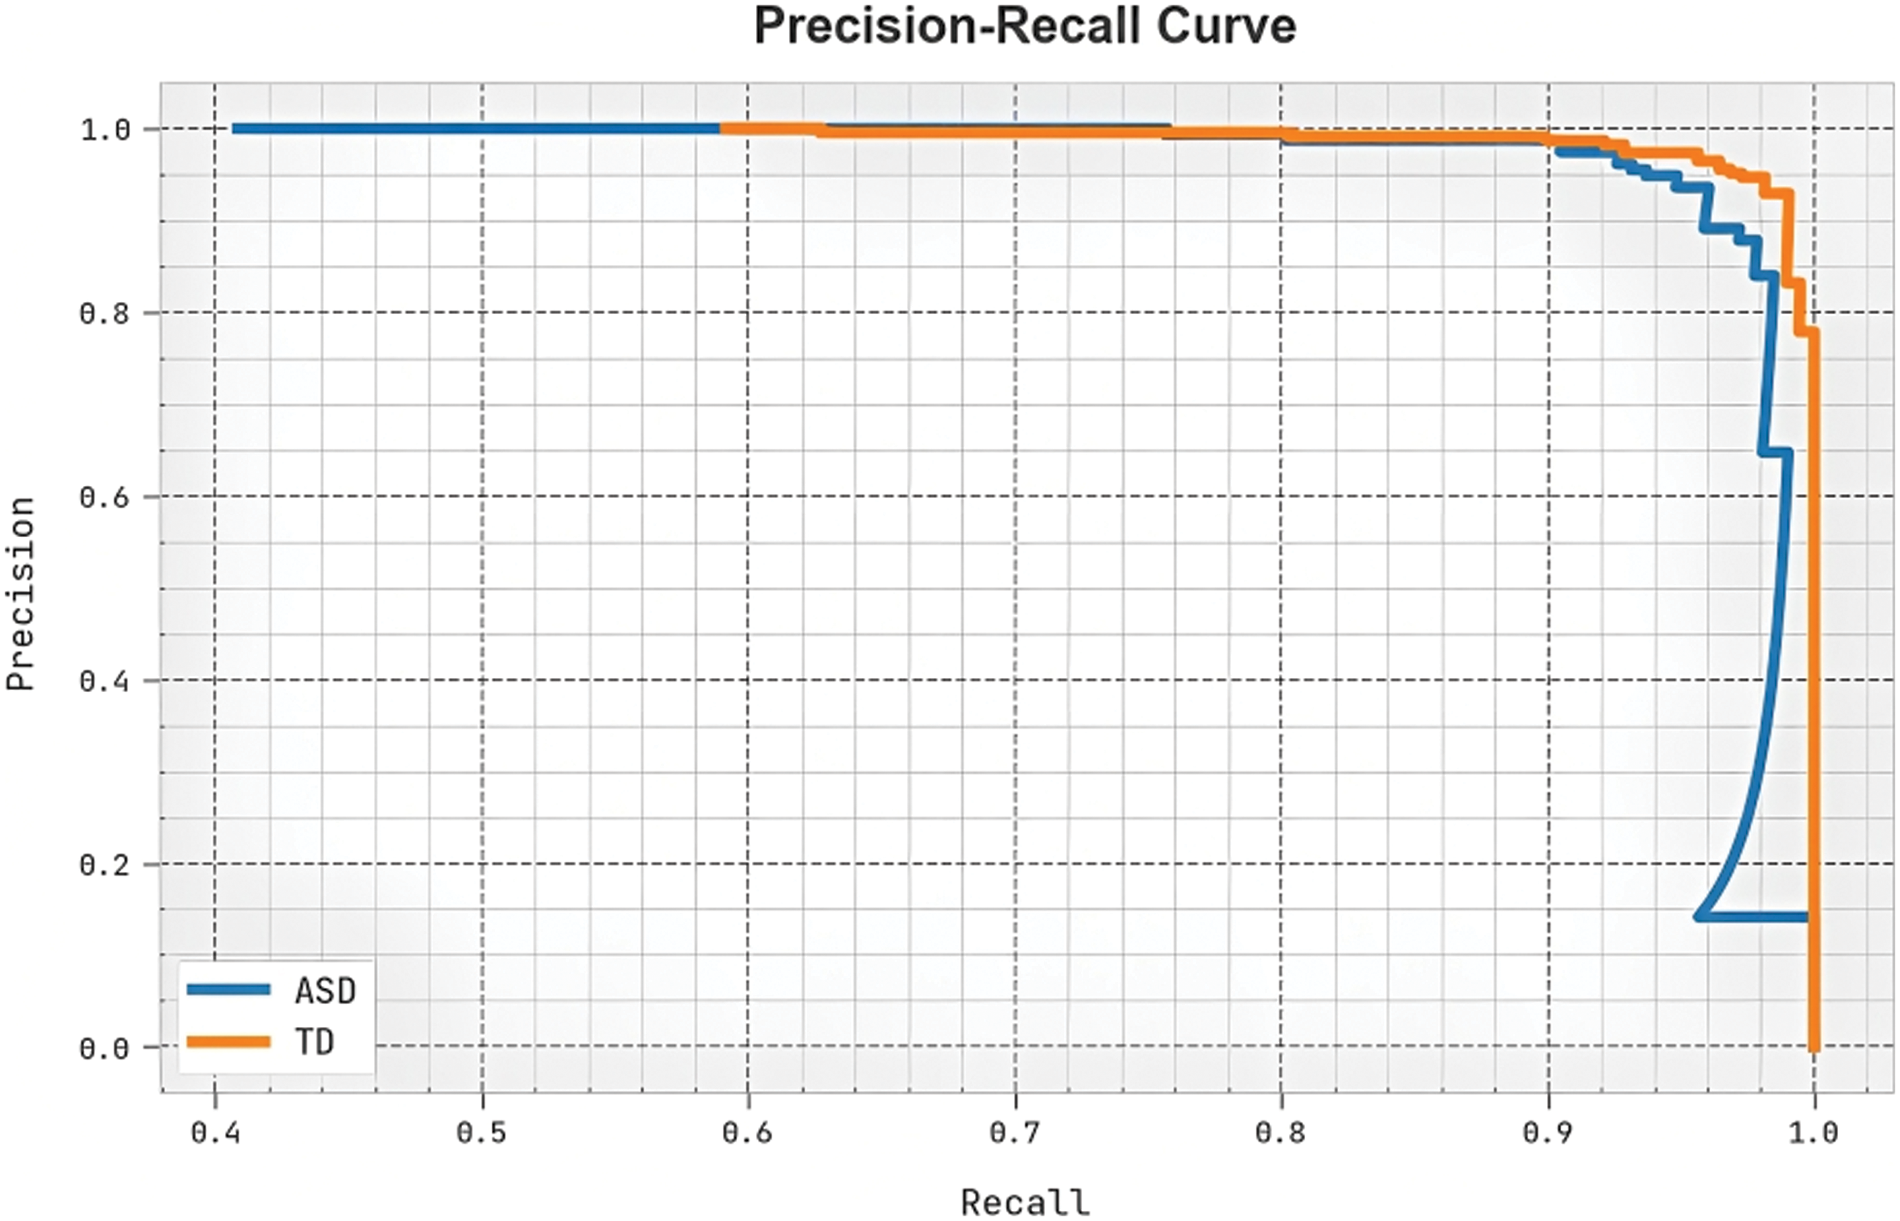
Figure 8: Precision-recall outcome of ETASD-CBODL approach
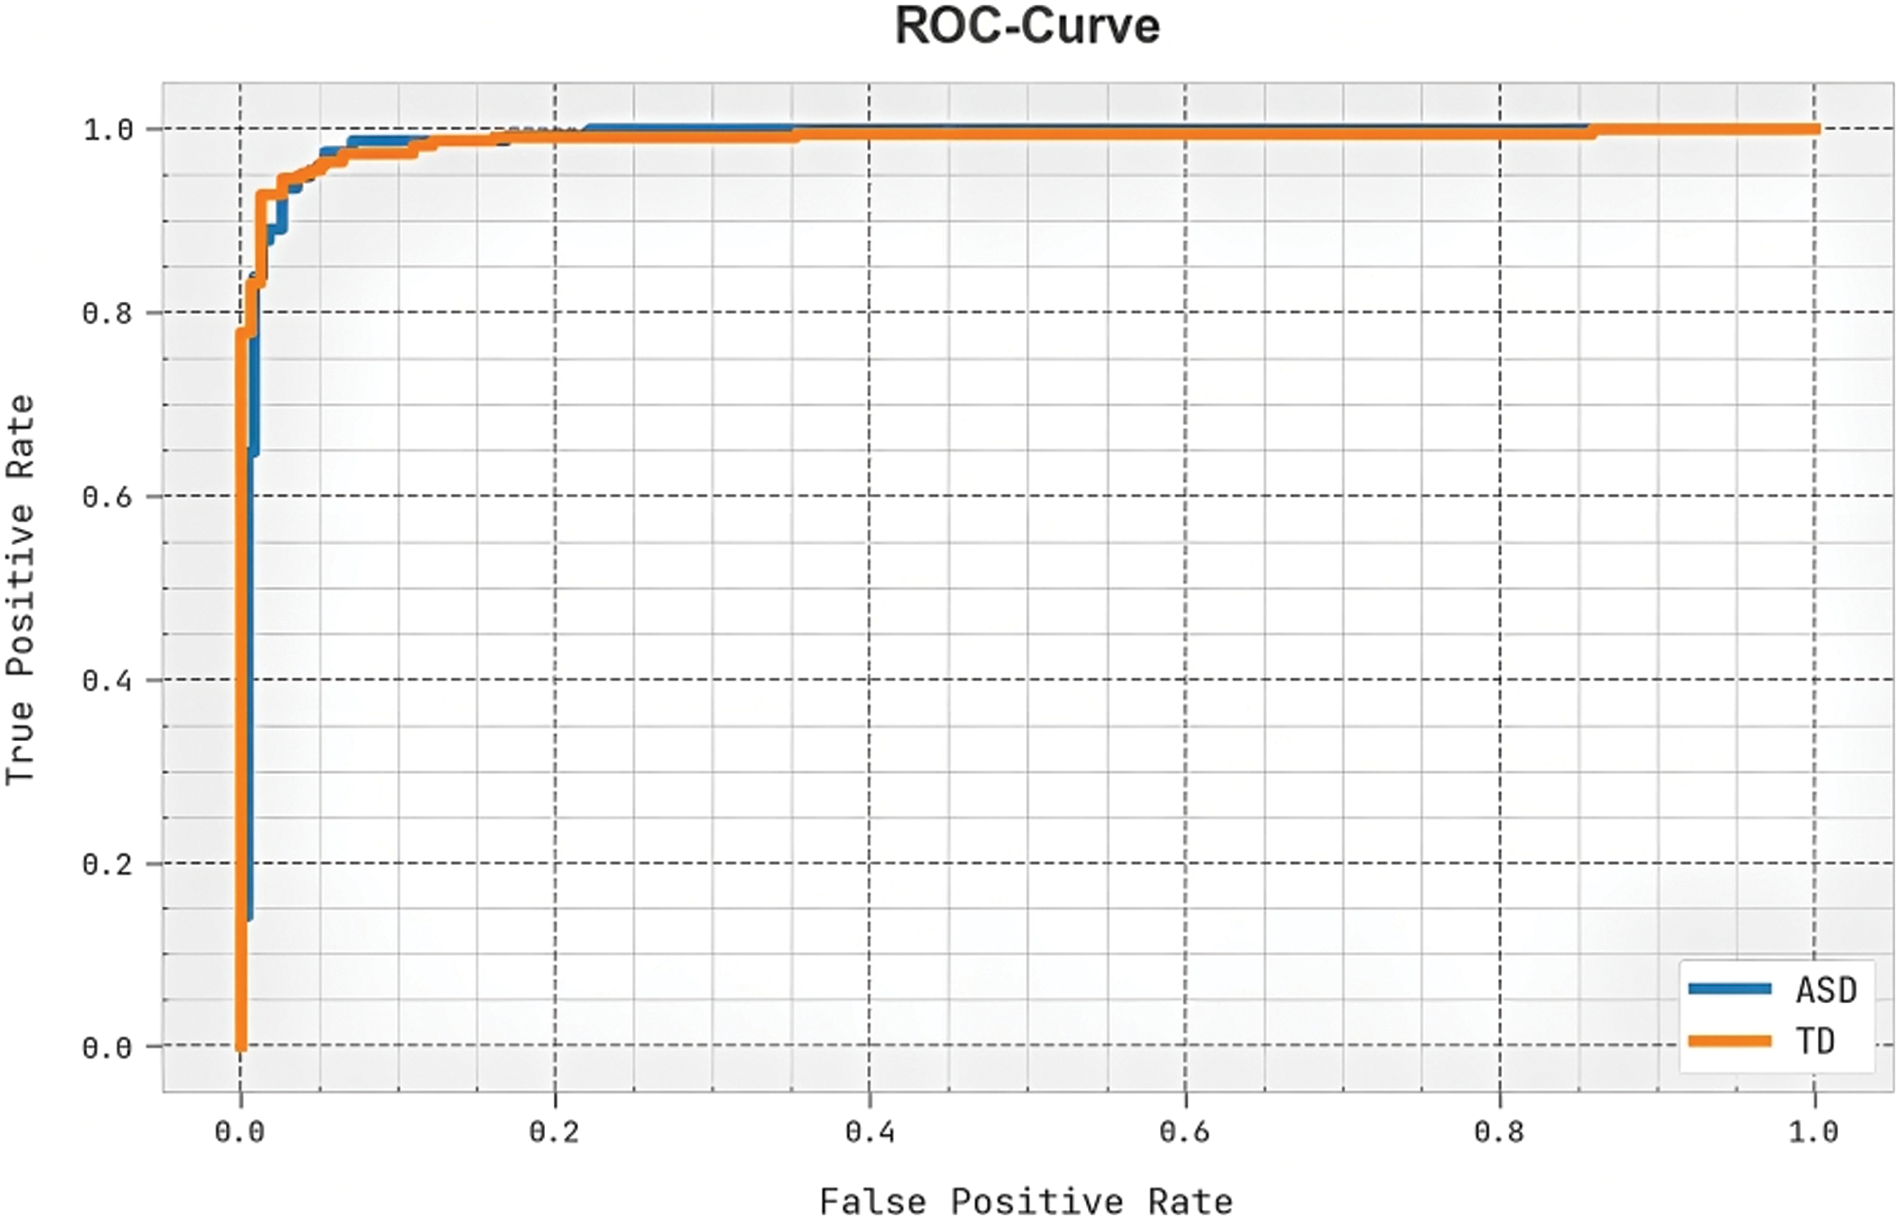
Figure 9: ROC curve outcome of ETASD-CBODL approach
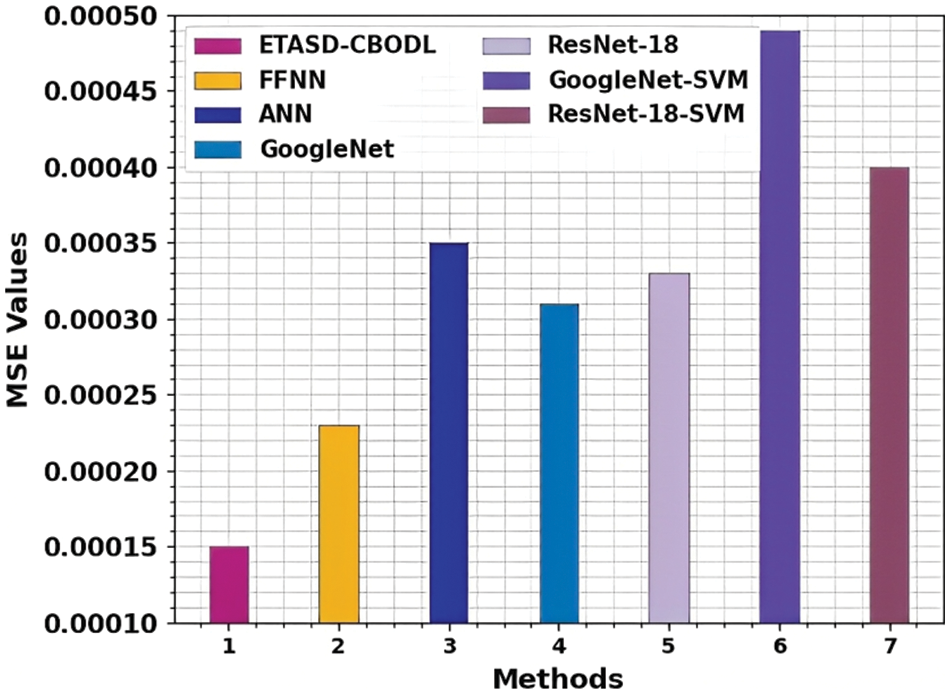
Figure 10: MSE analysis of ETASD-CBODL system with other algorithms
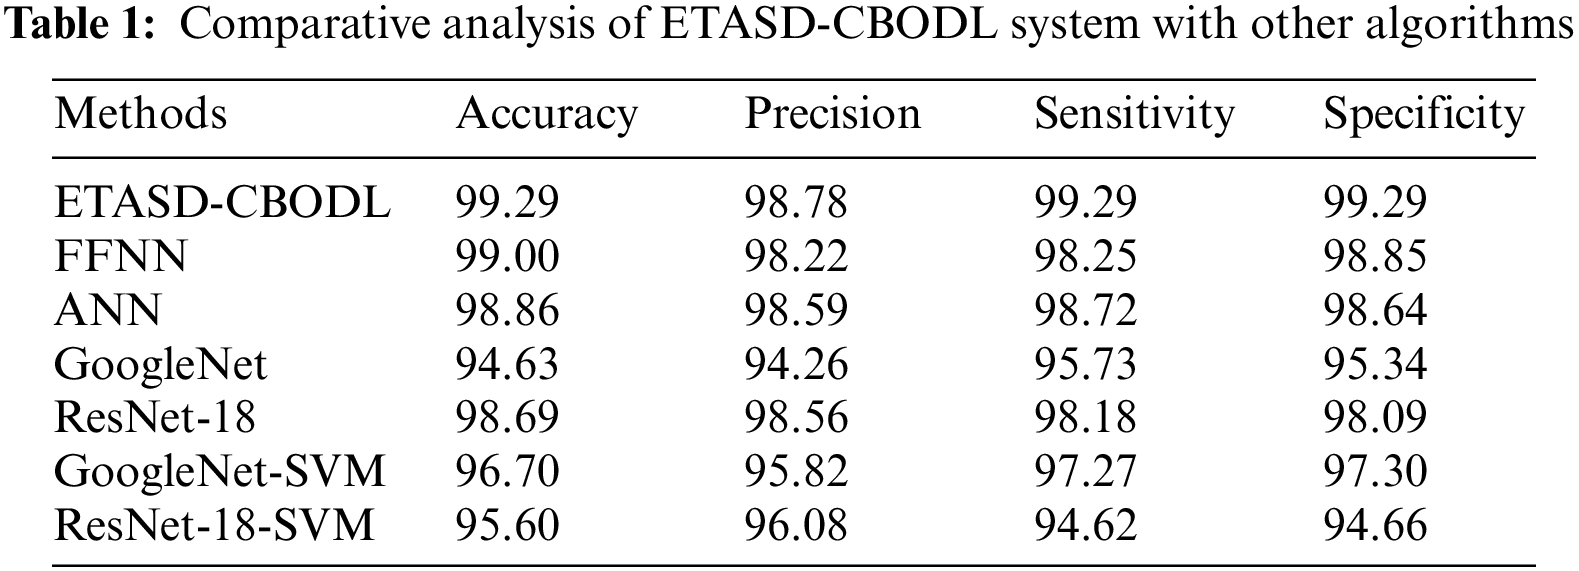
Finally, an extensive comparative study of the ETASD-CBODL technique is made with other techniques in Table 1. The outcomes indicate that the GoogleNet, GoogleNet-SVM, and ResNet-18-SVM methods attain the least classification performance. At the same time, the ANN and ResNet-18 models reached certainly improved outcomes.
The ETASD-CBODL method has the potential to be used to identify autism spectrum disorder (ASD) in real-world situations, however, there are some potential restrictions and difficulties that need to be taken into account. The ETASD-CBODL method depends on the gathering of high-quality, multimodal data, which in practical situations might be difficult. Since noise and distractions might affect the model’s accuracy, it may be challenging to gather data in naturalistic circumstances. Technical drawbacks: The ETASD-CBODL method needs specialized tools, such as eye-tracking and motion capture systems, which may not be easily accessible in real-world situations. The use of these gadgets may also be constrained by technical factors like short battery life or connectivity concerns. User acceptance: The ETASD-CBODL technique must be accepted by its users, including parents, doctors, and people with ASD, to be effective in real-world settings. There can be worries about how invasive the data collection procedure is or the possibility that the data will be abused. The ETASD-CBODL technique has demonstrated promising results in specific populations and contexts, but to assure generalizability, it is crucial to evaluate its performance across a range of people and settings. There are significant ethical issues raised by the gathering and use of sensitive personal data, such as eye tracking and motion capture data. It is crucial to make sure that data gathering and use follow ethical standards and laws. The ETASD-CBODL technique generates complicated outputs that may be challenging for non-experts to understand. Therefore, it is crucial to create user-friendly interfaces that enable physicians and other end users to easily interpret the results.
In this study, we have developed an automated ASD detection using the proposed ETASD-CBODL technique. The presented ETASD-CBODL technique concentrates on the detection and classification of ASD via the ET and DL models. To accomplish this, the ETASD-CBODL technique follows different subprocesses, namely U-Net segmentation, Inception, v3 feature extraction, CBO-based hyper parameter optimizer, and LSTM classification. To assess the performance of the ETASD-CBODL technique, a series of simulations were performed on datasets from the figure-shared data repository. The experimental values showed a better performance of the ETASD-CBODL technique over recent approaches. Therefore, the ETASD-CBODL technique can be employed for accurate ASD detection. In the future, the performance of the ETASD-CBODL technique can be employed by hybrid DL models. The ETASD-CBODL technique’s potential for usage in clinical settings can further optimizes the method’s ability to identify ASD.
Funding Statement: This research has been funded by the Deanship for Research & Innovation, Ministry of Education in Saudi Arabia, for funding this research work through Project Number: IFP22UQU4281768DSR145.
Conflicts of Interest: The authors declare that they have no conflicts of interest to report regarding the present study.
References
1. X. J. Kong, Z. Wei, B. Sun, Y. Tu, Y. Huang et al., “Different eye tracking patterns in autism spectrum disorder in toddler and preschool children,” Frontiers in Psychiatry, vol. 13, 899521, pp. 1–10, 2022. [Google Scholar]
2. E. L. Arbaoui, E. L. Hari and R. Saidi, “A survey on the application of the internet of things in the diagnosis of autism spectrum disorder,” in Proc. in Int. Conf. on Advanced Technologies for Humanity, Rabat, Morocco, Cham, Springer, pp. 29–41, 2021. [Google Scholar]
3. L. Desideri, P. Pérez-Fuster and G. Herrera, “Information and communication technologies to support early screening of autism spectrum disorder: A systematic review,” Children, vol. 8, no. 2, pp. 1–29, 2021. [Google Scholar]
4. Z. Zhao, J. Wei, J. Xing, X. Zhang, X. Qu et al., “Use of oculomotor behavior to classify children with autism and typical development: A novel implementation of the machine learning approach,” Journal of Autism and Developmental Disorders, vol. 53, no. 3, pp. 934–946, 2022. [Google Scholar] [PubMed]
5. A. F. Rashid and S. H. Shaker, “Review of autistic detection using eye tracking and vocalization based on deep learning,” Journal of Algebraic Statistics, vol. 13, no. 1, pp. 286–297, 2022. [Google Scholar]
6. T. Wadhera and D. Kakkar, “Eye tracker: An assistive tool in diagnosis of autism spectrum disorder,” in Emerging Trends in the Diagnosis and Intervention of Neurodevelopmental Disorders, 1st ed., vol. 1. Kharagpur, India: IGI Global Press, pp. 125–152, 2019. [Google Scholar]
7. S. Ahmed, S. B. Nur, F. Hossain, M. S. Kaise, M. Mahmud et al., “Computational Intelligence in detection and support of autism spectrum disorder,” in Proc. in Artificial Intelligence in Healthcare, Singapore, Springer, pp. 179–197, 2022. [Google Scholar]
8. T. H. Wen, A. Cheng, C. Andreason, J. Zahiri, Y. Xiao et al., “Large scale validation of an early-age eye-tracking biomarker of an autism spectrum disorder subtype,” Scientific Reports, vol. 12, no. 1, pp. 1–13, 2022. [Google Scholar]
9. S. Rahman, S. F. Ahmed, O. Shahid, M. A. Arrafi and M. A. R. Ahad, “Automated detection approaches to autism spectrum disorder based on human activity analysis: A review,” Cognitive Computation, vol. 14, no. 1, pp. 1773–1800, 2021. [Google Scholar]
10. R. Anden and E. Linstead, “Predicting eye movement and fixation patterns on scenic images using machine learning for children with autism spectrum disorder,” in Proc. in 2020 IEEE Int. Conf. on Bioinformatics and Biomedicine (BIBM), Seoul, South Korea, pp. 2563–2569, 2020. [Google Scholar]
11. Y. Zhang, Y. Tian, P. Wu and D. Chen, “Application of skeleton data and long short-term memory in action recognition of children with autism spectrum disorder,” Sensors, vol. 21, no. 2, pp. 1–17, 2021. [Google Scholar]
12. Y. Fang, H. Duan, F. Shi, X. Min and G. Zhai, “Identifying children with autism spectrum disorder based on gaze-following,” in Proc. in 2020 IEEE Int. Conf. on Image Processing (ICIP), Abu Dhabi, United Arab Emirates, pp. 423–427, 2020. [Google Scholar]
13. M. Elbattah, J. L. Guérin, R. Carette, F. Cilia and G. Dequen, “NLP-based approach to detect autism spectrum disorder in saccadic eye movement,” in Proc. in 2020 IEEE Symp. Series on Computational Intelligence (SSCI), Canberra, Australia, pp. 1581–1587, 2020. [Google Scholar]
14. M. Li, D. Tang, J. Zeng, T. Zhou, H. Zhu et al., “An automated assessment framework for a typical prosody and stereotyped idiosyncratic phrases related to autism spectrum disorder,” Computer Speech & Language, vol. 56, no. 1, pp. 80–94, 2019. [Google Scholar]
15. W. Wei, Z. Liu, L. Huang, A. Nebout and M. O. Le, “Saliency prediction via multi-level features and deep supervision for children with autism spectrum disorder,” in Proc. in 2019 IEEE Int. Conf. on Multimedia & Expo Workshops (ICMEW), Shanghai, China, pp. 621–624, 2019. [Google Scholar]
16. C. Xia, K. Chen, K. Li and H. Li, “Identification of autism spectrum disorder via an eye-tracking based representation learning model,” in Proc. 7th Int. Conf. on Bioinformatics Research and Applications, Berlin, Germany, pp. 59–65, 2020. [Google Scholar]
17. I. A. Ahmed, E. M. Senan, T. H. Rassem, M. A. Ali, H. S. A. Shatnawi et al., “Eye tracking-based diagnosis and early detection of autism spectrum disorder using machine learning and deep learning techniques,” Electronics, vol. 11, no. 4, pp. 1–30, 2022. [Google Scholar]
18. S. Zhao, F. Kang and J. Li, “Non-contact crack visual measurement system combining improved u-net algorithm and canny edge detection method with laser rangefinder and camera,” Applied Sciences, vol. 12, no. 20, pp. 1–30, 2022. [Google Scholar]
19. R. A. Hazarika, D. Kandar and A. K. Maji, “An experimental analysis of different deep learning based models for Alzheimer’s disease classification using brain magnetic resonance images,” Journal of King Saud University-Computer and Information Sciences, vol. 34, no. 10, pp. 8576–8598, 2022. [Google Scholar]
20. M. Rosić, M. Sedak, M. Simić and P. Pejović, “An improved chaos driven hybrid differential evolution and butterfly optimization algorithm for passive target localization using TDOA measurements,” Applied Sciences, vol. 13, no. 2, pp. 1–16, 2023. [Google Scholar]
21. K. Lakshmanna, N. Subramani, Y. Alotaibi, S. Alghamdi, O. I. Khalafand et al., “Improved metaheuristic-driven energy-aware cluster-based routing scheme for IoT-assisted wireless sensor networks,” Sustainability, vol. 14, no. 7712, pp. 1–19, 2022. [Google Scholar]
22. R. Meenakshi, R. Ponnusamy, S. Alghamdi, K. O. Ibrahim and Y. Alotaibi, “Development of mobile app to support the mobility of visually impaired people,” Computers, Materials & Continua, vol. 73, no. 2, pp. 3473–3495, 2022. [Google Scholar]
23. S. Padhee, M. Johnson, H. Yi, T. Banerjee and Z. Yang, “Machine learning for aiding blood flow velocity estimation based on angiography,” Bioengineering, vol. 9, no. 11, pp. 1–16, 2022. [Google Scholar]
24. Y. Alotaibi, “A new meta-heuristics data clustering algorithm based on tabu search and adaptive search memory,” Symmetry, vol. 14, no. 3, pp. 1–15, 2022. [Google Scholar]
25. T. Tamilvizhi, R. Surendran, K. Anbazhagan and K. Rajkumar, “Quantum behaved particle swarm optimization-based deep transfer learning model for sugarcane leaf disease detection and classification,” Mathematical Problems in Engineering, vol. 2022, 3452413, pp. 1–12, 2022. [Google Scholar]
26. A. Z. Allayali, “Prevalence of using non-prescribed topical corticosteroids on the face of female citizens of Makkah, Saudi Arabia (2020–2021),” Journal of Umm Al-Qura University for Medical Sciences, vol. 8,no. 2, pp. 1–6, 2022. [Google Scholar]
27. K. S. Riya, R. Surendran, C. A. T. Romero and M. S. Sendil, “Encryption with user authentication model for internet of medical things environment,” Intelligent Automation and Soft Computing, vol. 35, no. 1, pp. 507–520, 2023. [Google Scholar]
28. Z. Tarek, S. M. Shohieb, A. M. Elhady, E. M. El-kenawy and M. Y. Shams, “Eye detection-based deep belief neural networks and speeded-up robust feature algorithm,” Computer Systems Science and Engineering,vol. 45, no. 3, pp. 3195–3213, 2023. [Google Scholar]
29. T. Thanarajan, Y. Alotaibi, S. Rajendran and K. Nagappan, “Improved wolf swarm optimization with deep-learning-based movement analysis and self-regulated human activity recognition,” AIMS Mathematics,vol. 8, no. 5, pp. 12520–12539, 2023. [Google Scholar]
30. H. A. Mengash, H. Alqahtani, M. Maray, M. K. Nour, R. Marzouk et al., “Automated autism spectral disorder classification using optimal machine learning model,” Computers, Materials & Continua, vol. 74, no. 3, pp. 5251–5265, 2023. [Google Scholar]
31. D. Anuradha, N. Subramani, O. I. Khalaf, Y. Alotaibi, S. Alghamdi et al., “Chaotic search-and-rescue-optimization-based multi-hop data transmission protocol for underwater wireless sensor networks,” Sensors, vol. 22, no. 8, pp. 1–20, 2022. [Google Scholar]
32. M. Wedyan, J. Falah, R. Alturki, I. Giannopulu, S. F. M. Alfalah et al., “Augmented reality for autistic children to enhance their understanding of facial expressions,” Multimodal Technologies and Interaction, vol. 5, no. 8, pp. 1–17, 2021. [Google Scholar]
33. S. S. Rawat, S. Alghamd, G. Kumar, Y. Alotaibi, O. I. Khalaf et al., “Infrared small target detection based on partial sum minimization and total variation,” Mathematics, vol. 10, no. 671, pp. 1–19, 2022. [Google Scholar]
34. S. M. Yoo, K. N. Kim, S. Kang, H. J. Kim, J. Yun et al., “Prevalence and premature mortality statistics of autism spectrum disorder among children in Korea: A nationwide population-based birth cohort study,” Journal of Korean Medical Science, vol. 37, no. 1, pp. 1–11, 2022. [Google Scholar]
35. https://figshare.com/articles/dataset/Visualization_of_Eye-Tracking_Scanpaths_in_Autism_Spectrum_Disorder_Image_Dataset/7073087 [Google Scholar]
36. N. Q. Abdulmajeed, B. Al-Khateeb and M. A. Mohammed, “Voice pathology identification system using a deep learning approach based on unique feature selection sets,” Expert Systems, vol. 2018, pp. e13327, 2023. [Google Scholar]
Cite This Article
 Copyright © 2023 The Author(s). Published by Tech Science Press.
This work is licensed under a Creative Commons Attribution 4.0 International License , which permits unrestricted use, distribution, and reproduction in any medium, provided the original work is properly cited.
 Downloads
 Citation Tools