
 Submit a Paper
 Propose a Special lssue
 Open Access
ARTICLE

Non-Cooperative Game of Coordinated Scheduling of Parallel Machine Production and Transportation in Shared Manufacturing
1 School of Management, Shenyang University of Technology, Shenyang, 110870, China
2 School of Science, Shenyang Ligong University, Shenyang, 110159, China
* Corresponding Author: Peng Liu. Email:
Computers, Materials & Continua 2023, 76(1), 239-258. https://doi.org/10.32604/cmc.2023.038232
Received 02 December 2022; Accepted 10 April 2023; Issue published 08 June 2023
 View Full Text
 Download PDF
Abstract
Given the challenges of manufacturing resource sharing and competition in the modern manufacturing industry, the coordinated scheduling problem of parallel machine production and transportation is investigated. The problem takes into account the coordination of production and transportation before production as well as the disparities in machine spatial position and performance. A non-cooperative game model is established, considering the competition and self-interest behavior of jobs from different customers for machine resources. The job from different customers is mapped to the players in the game model, the corresponding optional processing machine and location are mapped to the strategy set, and the makespan of the job is mapped to the payoff. Then the solution of the scheduling model is transformed into the Nash equilibrium of the non-cooperative game model. A Nash equilibrium solution algorithm based on the genetic algorithm (NE-GA) is designed, and the effective solution of approximate Nash equilibrium for the game model is realized. The fitness function, single-point crossover operator, and mutation operator are derived from the non-cooperative game model’s characteristics and the definition of Nash equilibrium. Rules are also designed to avoid the generation of invalid offspring chromosomes. The effectiveness of the proposed algorithm is demonstrated through numerical experiments of various sizes. Compared with other algorithms such as heuristic algorithms (FCFS, SPT, and LPT), the simulated annealing algorithm (SA), and the particle swarm optimization algorithm (PSO), experimental results show that the proposed NE-GA algorithm has obvious performance advantages.Keywords
The sharing economy model began to emerge strongly and swiftly with the advent of Internet information technology. Shared manufacturing, which uses Internet technology to optimize and match supply and demand, has become popular in recent years [1]. It may help relieve the structural contradiction of surplus supply capacity as well as the problem of the coexistence of resource scarcity and idle waste. For example, the XCMG HANYUN platform provides equipment for the online construction of Wuhan Huoshenshan Hospital. The Sany RootCloud platform provides technical support for the construction of emergency hospitals in Xi’an, Guangxi, and other locations. The Haier COSMOPlat, BONC Cloudiip, and other cross-industry platforms widely gather industrial resources and achieve innovation leadership. Shared resources in the shared manufacturing mode include soft resources such as software, expertise, and labor, as well as hard resources such as manufacturing equipment, computer resources, and materials. Among these, shared manufacturing equipment can better match idle production equipment to demand and increase the fast response and flexible supply capabilities of small and medium-sized enterprises.
The concept of shared manufacturing was first proposed by Ellen Brandt [2], Richard et al. [3]. They provided a shared manufacturing solution to assess the consolidation and reconfiguration of multiple industrial operations. Rozman et al. [4] presented a scalable framework for blockchain-based shared manufacturing that preserved the transparency and immutability characteristics of transaction records. Yan et al. [5] gave a comprehensive review of the operational optimization, supply-demand matching, and scheduling models in shared manufacturing. Yu et al. [6] investigated the concept of shared manufacturing and service operations. Manufacturing resources are provided by multiple enterprises located at different locations in the shared environment. During the process of production scheduling, it is not only necessary to consider the manufacturing capacity but also the connection between transportation and production caused by the difference in their spatial locations. As a result, for manufacturing resource sharing, collaborative optimization of production and transportation processes is a pressing issue that must be addressed.
As the sharing economy and manufacturing have become more integrated, many scholars have studied production scheduling problems under the sharing of manufacturing resources. Jiang et al. [7] investigated the issue of shared factories within the context of the sharing economy. Boysen et al. [8] investigated the matching of supply and demand in a shared environment by taking machines as shared resources and processing jobs as shared demand. Zheng et al. [9] aimed at the coordinated scheduling problem of production and two-stage transportation and took the total order completion time as the objective. The advantages and disadvantages of shared processing mode and traditional processing mode are compared based on scheduling rules such as First Come First Served (FCFS). Diaba et al. [10] investigated the complexity of the parallel execution of non-renewable resources under resource-sharing conditions and provided theoretical support. Wei et al. [11] studied two-machine hybrid flow-shop scheduling problems in shared manufacturing with fixed processing sequences. Li et al. [12] investigated the factors that influence the rental and sale of idle equipment, as well as the various benefits of sharing in the shared manufacturing mode. Liu et al. [13] investigated the parallel processing of multi-manufacturing tasks in the cloud manufacturing environment and developed a multi-task scheduling model with the objective of completion time and resource utilization. Xu et al. [14] investigated the online scheduling decision problem in a shared manufacturing environment. They developed an online scheduling strategy to minimize total completion time and total leasing cost when the manufacturer had two parallel machines. Wang et al. [15] developed the sharing resource allocation model from the perspective of independent decision-making of resource providers, taking into account the credit of shared resource providers. Liu et al. [16] created a shared resource allocation model based on the Gale–Shapley algorithm for supply and demand fluctuations. Ji et al. [17] considered parallel-machine scheduling problems in shared manufacturing, where each job had a machine set to which it could be assigned for processing. Zhang et al. [18] proposed a hybrid sensing-based approach to perform the monitoring and maintenance of the shared manufacturing resources. Marin et al. [19] proposed a decentralized coordination approach based on the spillover effect for multi-robot production planning in openly shared factories.
Although many scholars have studied the production scheduling model or resource allocation model under manufacturing resource sharing, few have considered the coordinated scheduling of parallel machine production and transportation. Most problem-solving methods are rule-based, with a focus on theoretical analysis and influencing factor analysis. It cannot effectively coordinate the allocation of multiple tasks and resources.
Because the demand in the sharing mode frequently comes from multiple self-interested individuals, it has obvious advantages to study the production scheduling problem based on a non-cooperative game. Koutsoupias et al. [20] combined non-cooperative game with scheduling, built a scheduling game model, adopted Nash equilibrium to describe the outcomes of multiple self-interested tasks competing for machine resources, and conducted the Price of Anarchy (POA) analysis. Wang et al. [21] adopted a scheduling game to study the matching degree of supply and demand among sharing parties as measured by POA for a single shared resource. Wei et al. [22] took the job of the selfish player in the game and investigated the POA of the selfish scheduling problem based on Weighted Shortest Processing Time (WSPT) rules. Xu et al. [23], and Qi et al. [24] developed an evolutionary game model for manufacturing resource sharing and collaboration, revealing the evolutionary relationship between resource owners and demanders. Furthermore, corresponding research in the field of scheduling in the environment of the single machine [25] and parallel machines [26] has been carried out based on the non-cooperative game model. The scheduling based on the non-cooperative game fully considers the problem of individual self-interest, which is beneficial to the advancement of research on production scheduling in the resource-sharing mode. However, the majority of current studies are based on rules to investigate the coordination mechanism and then perform POA analysis. Few of them consider the interdependence of production and transportation and develop algorithms to achieve Nash equilibrium.
As a result, this paper investigates the non-cooperative game of coordinated scheduling of parallel machine production and transportation in shared manufacturing from three perspectives.
(1) An unrelated parallel machine production scheduling model considering pre-production transportation is established to target machine resources that can perform the same type of processing tasks on the shared manufacturing platform. The model takes into account different machine positions as well as performance differences, processing time, and job transportation time.
(2) Aiming at the characteristics of the coordinated scheduling problem of parallel machine production and transportation in shared manufacturing, a non-cooperative game model considering the competition and self-interest behavior of orders (jobs) from different customers for machine resources is constructed. The job is the player in the non-cooperative game model, the processing machine and processing position are the strategies, and the opposite number of the completion time of the job is the payoff for each customer.
(3) A Nash equilibrium solution algorithm based on the genetic algorithm (NE-GA) is designed to find the Nash equilibrium of the scheduling scheme to address the problem that the Nash equilibrium of multiple game players is difficult to solve. The fitness function is designed according to the Nash equilibrium definition, and to ensure the feasibility of the chromosome, the coding scheme and genetic operators are designed according to the game strategy.
The remainder of this paper is organized as follows. Section 2 develops a non-cooperative game model to handle the coordinated scheduling problem of production and transportation in shared manufacturing. Section 3 designs a Nash equilibrium solution algorithm based on the genetic algorithm. Section 4 describes the simulation experiment and analysis. Section 5 summarizes the conclusions.
2 Problem Description and Non-Cooperative Game Model
Multiple machines from different manufacturers are at different locations in a shared manufacturing environment and can receive orders from different customers or upstream enterprises to provide processing services. The order (processing job) must first be transported to the machine, and the scheduling production of the manufacturer is determined by the number of orders received.
Assume that there are m machines on the shared platform, which are distributed among manufacturers in various locations. The set of machines is M = {1, 2, …, m}. There are n customer sets V = {V1, V2, …, Vn} in various locations, and orders from these n customers are denoted by job set J = {1, 2, …, n}, i.e., job j is from customer Vj. The time required to transport job j to machine i is denoted by the tij, i = 1, 2, …, m, j = 1, 2, …, n. Job j can be processed on any machine, but the processing speed of each machine varies. The processing time of job j on machine i is pij, indicating that the machine environment can be thought of as unrelated parallel machine, denoted by Rm.
Define the span time of one job as the time between the job leaving the customer and the completion of processing, including transport time, waiting time, and processing time. Because the problem addressed in this paper is pre-production transportation, the span time of job j is equivalent to the completion time of job Cj,j = 1, 2, …, n. Each customer reduces the time it takes to complete a job by competing for processing positions on different machines. The overall objective function of the system is to minimize the makespan.
The problem is expressed as a three-field representation α|β|γ, where α denotes the machine environment, β denotes the utility function of job j, and γ denotes the objective function [27]. The utility of jobs is referred to the customer wants to maximize their payoff. Because the objective of each job is to minimize its completion time, the utility ut of job j is –Cj, denoted Cmax = max{Cj, j = 1, 2, …, n }. The problem studied in this paper can be expressed as Rm|ut = –Cj |Cmax.
The problem under consideration is consistent with the following assumptions:
(1) All jobs have arrived at time zero and can be transported.
(2) The machine is available at time zero.
(3) All machines can process jobs continuously, with no setup time or transfer time.
(4) The processing of each job will not be interrupted once it begins.
(5) Each machine can process only one job at a time.
2.2 Development of A Non-Cooperative Game Model
In the previous problem, each customer wanted his job completed as soon as possible, and multiple players were aiming for their interests. For this problem, a non-cooperative game model with n players is established. The model can be described in Eq. (1).
where I represent players in the game. In this problem, n jobs are mapped as players in a game. The jobs choose the machine and the processing position. S represents the strategy of players, S = {s1, s2, …, sn}, sj represents the strategy of the jth player. U represents the payoff of players, U = {u1, u2, …, un}, uj represents the payoff of the jth player under strategy S. The framework of game model is shown in Fig. 1.
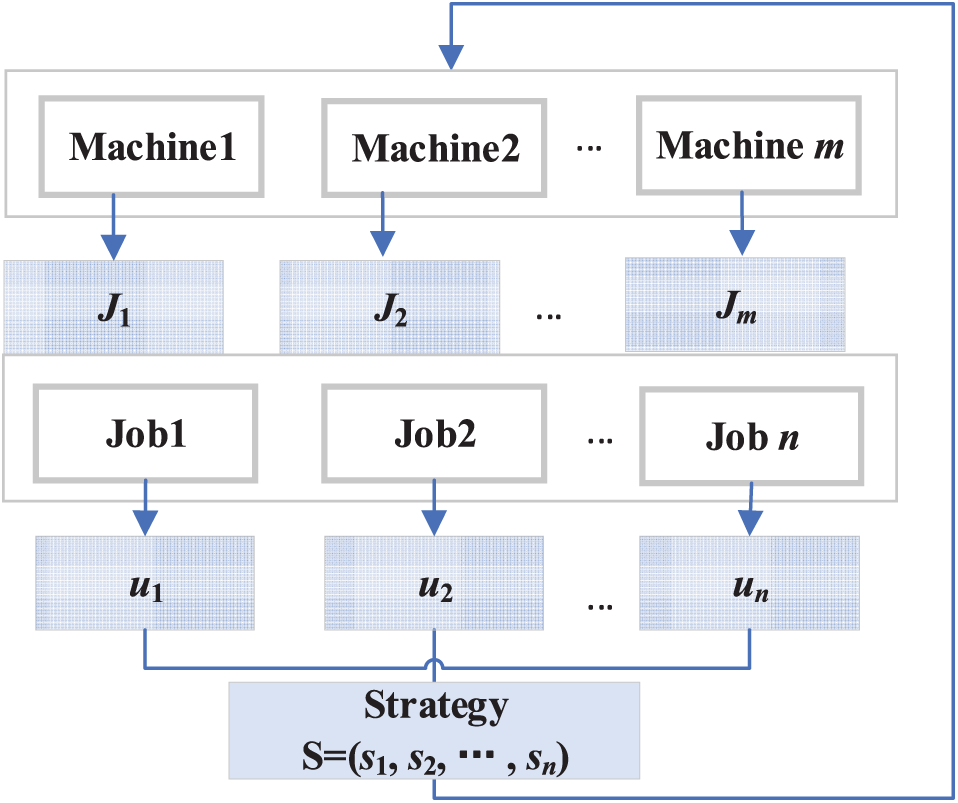
Figure 1: A game model framework for coordinated scheduling of parallel machine production and transportation in shared manufacturing
In Fig. 1, the job must first select various machines. The job set Ji to be processed is formed in front of each machine. Set |Ji| = mi, that is, the number of jobs processed on machine i is chosen as mi. The job on each machine then chooses the processing position. The selected machine and the processing position of each job comprise the job strategy, and the strategy of all jobs comprises the complete strategy, which corresponds to a feasible solution to the problem. The strategies and payoffs are discussed further below.
A strategy is a collection of actions or decisions that a player can implement. The strategy for n jobs in this problem is S = {s1, s2, …, sn}. Each job must make two decisions: the first involves selecting the machine from a pool of m options, and the second involves selecting the processing sequence of the machine from a pool of n options. The strategy sj for job j is described in Eq. (2).
where
The strategy set consists of all possible strategies, where (mn)n is the total number of possible strategies. Of course, not all strategies are effective. When the following events occur, the strategy S is invalid.
(1) Processing position conflict: Because each processing sequence on each machine is unique, this strategy is invalid when two jobs have chosen to be processed in the same position on the same machine. That is, in strategy S, if
(2) Discontinuity in processing: The processing sequence on each machine should be continuous. However, the scheduling discontinuity on the same machine may occur in the previously considered strategy, making it invalid.
For example, three jobs from three customers need to be processed on two unrelated parallel machine on the shared platform. If the repetition strategy is ignored, each player has a choice of two machines, three processing sequences on each machine, and six different strategies, for a total of 63 = 216 different strategies, some of which are ineffective. For instance, if S = {(1,2), (2,1), (1,2)} s1 = s3 = (1,2), that strategy is invalid. There are
During the game, each player acts according to its own strategy in order to obtain payoffs and expect the best payoffs for itself. In this paper, each job is played to reduce its makespan. As a result, the opposite number of the completion time of each job is taken as the payoff function of each customer, i.e, uj = −Cj.
The completion time Cj of job j includes the transportation time tij, the waiting time wj after transportation arrives, and the job processing time pij, as shown in Eq. (3).
The waiting time of Job j is related to the state of the machine when the job arrives. If the machine is idle when the job arrives and there is no job waiting to be processed before it, the waiting time is 0. The job completion time Cj equal to the sum of the transportation and job processing times, so Cj = tij + pij. If the machine is busy when the job arrives, or if another job is waiting to be processed before it, the completion time of the job Cj is the sum of the completion time of the previous job processed by the machine and the processing time of the job. Assume that job l is the last job processed by the machine. At this point, job l could be the job being processed by the machine when job j arrives, or it could be the job that arrived before job l and is waiting for processing. In short, the strategy of job l is
If job j is the first to arrive at machine i, then l = 0, C0 = 0.
Individual jobs can have a negative influence on one another. Processing on the same machine to reduce their own completion time may cause other jobs to take longer to complete. As a result, we must find an equilibrium point of interest for all jobs. The production scheduling problem with transportation under equipment sharing is transformed into a Nash equilibrium solution for relevant constraints based on the non-cooperative game model established above.
When there is a strategy
where s–j is the set of all players' strategies except player j,
In the non-cooperative game model established in this paper, there are n customers involved in the game, and each customer can choose a limited number of strategies, which is a finite game. According to “Nash Theorem”, Nash equilibrium exists in the game model developed in this paper.
For example, there are two unrelated parallel machines on the shared platform, and two jobs must be processed. The transport time tij of job j to machine i are: t11 = 3, t12 = 2, t21 = 3, t22 = 4, the processing time pij of job j on machine i are: p11 = 5, p12 = 8, p21 = 7, p22 = 5. The alternative strategies for jobs 1 and 2 are: (1,1), (1,2), (2,1), (2,2). The payoff matrix can then be written as A.
where the rows of A represent the strategy chosen by job 1, and the columns represent the strategy chosen by job 2. The payoffs obtained when the two jobs choose the corresponding strategy are represented by the elements in the matrix. For example, (15,10) indicates that when job 1 chooses strategy (1,2) and job 2 chooses strategy (1,1), the payoff obtained by job 1 is 15, and the payoff obtained by job 2 is 10. “
Adopting the streak plate method, the Nash equilibrium solution of this example can be derived as S = {(1,1), (2,1) } and S = {(2,1), (1,1) }, the corresponding payoff is (8,9), (10,10). It is clear that neither job 1 nor job 2 can change their strategies on their own to get a better payoff.
3 Nash Equilibrium Solution Algorithm Based on the Genetic Algorithm
As the number of jobs and machines rises, the strategy space of the established game model expands exponentially, making it harder to achieve Nash equilibrium by adopting traditional approaches. The genetic algorithm can find an approximate optimal solution without being influenced or limited by the deduction condition or function continuity. As a result, this paper designs the Nash equilibrium solution algorithm based on the genetic algorithm (NE-GA) to seek the approximate Nash equilibrium of the established game model based on the characteristics of the constructed non-cooperative game model and the definition of Nash equilibrium.
3.1 Design of Coding and Chromosome
The coding of genetic algorithms is the process of describing feasible scheduling solutions as “chromosomes” of genetic algorithms. The “chromosome” contains information about feasible scheduling solutions, i.e., the action strategies of each player in the game model. Integer coding is used for the production and transportation coordination scheduling problem of parallel machine under manufacturing resource sharing. Each chromosome contains n gene loci, which correspond to the strategy of n jobs, the chromosome length is 2n. Each gene locus has two components: a machine number and a position number. So the strategies of the game model correspond to the chromosomes one by one.
For example, three unrelated parallel machines are at different locations on the shared manufacturing platform to provide processing and manufacturing services, and there are six jobs to be processed from six customers. A chromosome of the problem is shown in Fig. 2.
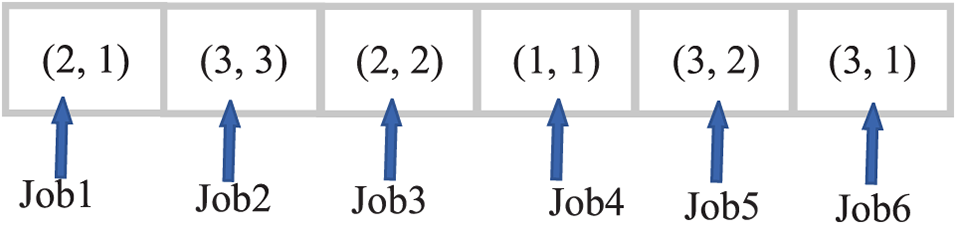
Figure 2: Example of a chromosome
The chromosome in Fig. 2, denoted as {(2,1), (3,3), (2,2), (1,1), (3,2), (3,1)}, is made up of six gene loci, each of which represents the strategy of the corresponding job. For example, the first gene locus (2,1) indicates that job 1 has been selected to be processed at the first position on machine 2.
To ensure that the corresponding strategy of chromosomes is feasible, the generation process of chromosomes is designed as follows.
Step 1: Generate m positive integers at random mi (i = 1, 2,⋯, m), and m1 + m2 + ⋯ mm = n, where mi represents the number of jobs assigned to the ith machine.
Step 2: The gene locus is generated sequentially based on the m positive integers generated in Step 1. In other words, if the number of jobs processed on machine i is mi, the gene locus (i, 1), (i, 2), …, (i, mi) are generated in a sequential.
Step 3: By sequencing the corresponding gene loci of m positive integers, we get the sequence ((1, 1), (1, 2), …, (1, m1), (2, 1), (2, 2), …, (2, m2), …, (m, 1), (m, 2), …, (1, mm)).
Step 4: By randomly shuffling the sequence generated in step 3 of the gene locus, chromosomes are obtained.
The chromosomes generated by the method described above can ensure that all of the chromosomes generated correspond to feasible strategies.
3.2 Design of Fitness Function
The key to a genetic algorithm is the fitness function. The ability to adopt a genetic algorithm to achieve Nash equilibrium is primarily due to the design of the fitness function. To ensure that the solution of the algorithm is approximate Nash equilibrium, the fitness function is designed according to the non-cooperative game model of production and transportation coordination scheduling under manufacturing resource sharing and the definition of Nash equilibrium.
Since the payoff of each job defines the negative value of its completion time, each job competes with others for a better processing position to minimize its completion time. According to the definition of Nash equilibrium, Nash equilibrium is reached when each job cannot increase its payoff by changing its strategy. As a result, by minimizing the completion time of each job in the scheduling scheme, the objective of payoff equilibrium is reached, and the fitness function is guaranteed to be positive. The fitness function is defined as Eqs. (6) and (7).
where
When Eq. (6) meets Eq. (8), there is a small difference between the payoff of each job and the optimal value in the last iteration, indicating that the algorithm has found the Nash equilibrium.
where εj is the threshold value for determining the conditions for solving Nash equilibrium points. To simplify the problem, we can take ε1 = ε2 = ⋯ = εn = ε and get Eq. (9).
3.3 Design of Genetic Operators
The roulette choice operator is employed. Because the fitness value defined in this paper is the smaller the better, Eq. (9) is used to convert the fitness value before performing the roulette wheel selection operation:
The difference in fitness gq between the chromosome with the largest converted fitness value and each chromosome is then calculated:
To increase the likelihood of selecting a chromosome with a good fitness function, the exponential function is used to widen the gap between the fitness of each chromosome and the maximum fitness value:
Adopting a single point crossing. First, two parental chromosomes, P1 and P2, were chosen. As crossing points, integers between 1 and n are generated at random, and the substrings preceding the crossing points are exchanged to generate offspring chromosomes O1 and O2. The crossing process is shown in Fig. 3.
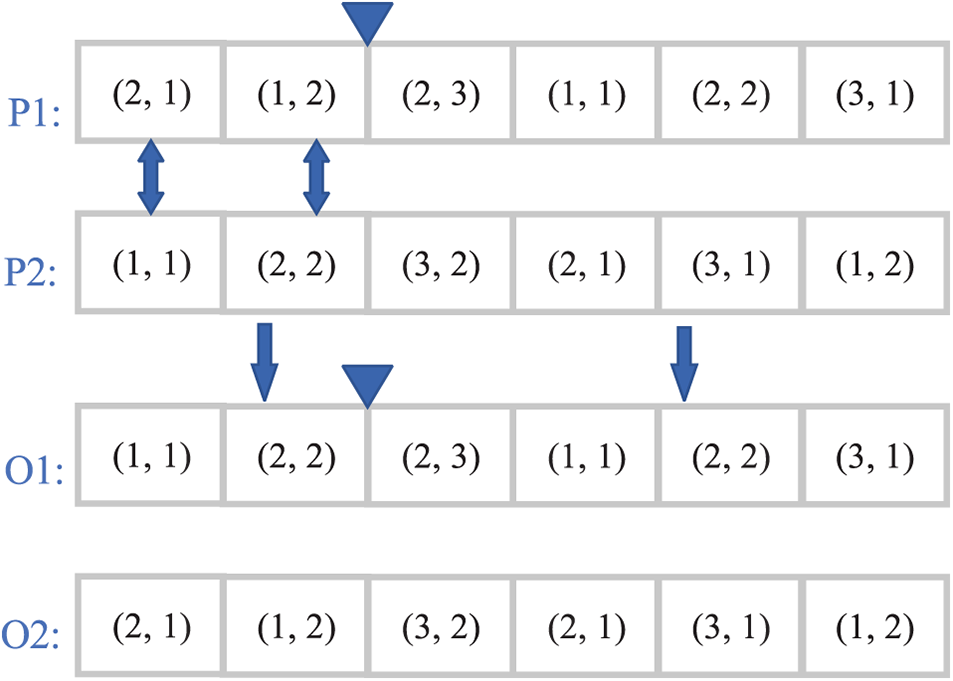
Figure 3: Single-point crossing process
A single-point crossing can produce invalid chromosomes. As shown in Fig. 3, when job 1 and job 4 of O1 select the same position on the same machine. So chromosomes produced by a single crossover must be processed further. First, the jobs processed on the same machine are counted according to the offspring chromosome, and then the jobs processed on the same machine are sorted according to the original processing position of the machine. If two processing positions are identical, the jobwith the smaller serial number is ranked first.
For example, in Fig. 3, there are job 1 and job 4 on machine 1 for the offspring chromosome O1. On machine 1, there are job 1 and job 4. Reorder by job serial number. The processing position of job 1 is 1, and the processing position of job 4 is 2. On machine 2, there are job 2, job 3, and job 5. The processing positions are 2, 3, and 2, and the reordering positions are 1, 3, and 2. Job 6 is located on machine 3, and the processing position is 1. The effective offspring chromosome after processing is shown in Fig. 4.
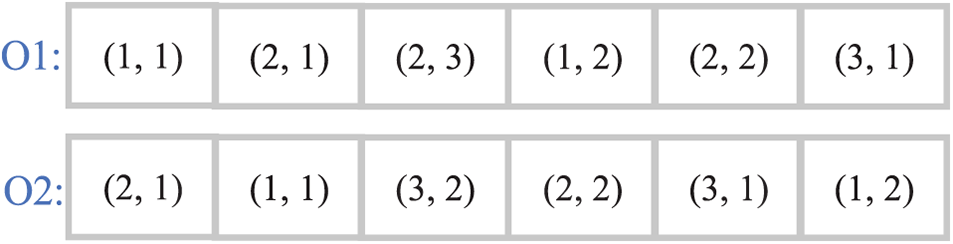
Figure 4: Effective offspring chromosomes
To generate new genes, adopt the single point mutation operator. First, as a mutation locus, an integer between 1 and n is generated at random, and then this gene locus is replaced by a randomly generated gene. Of course, such a mutation operation may result in invalid chromosomes that must be processed further. If the mutation locus stays unchanged when it conflicts with other loci, the other loci are processed in the same manner as in the crossover operation described in Section 3.3.2 to produce effective chromosomes. The mutation operation process is shown in Fig. 5.
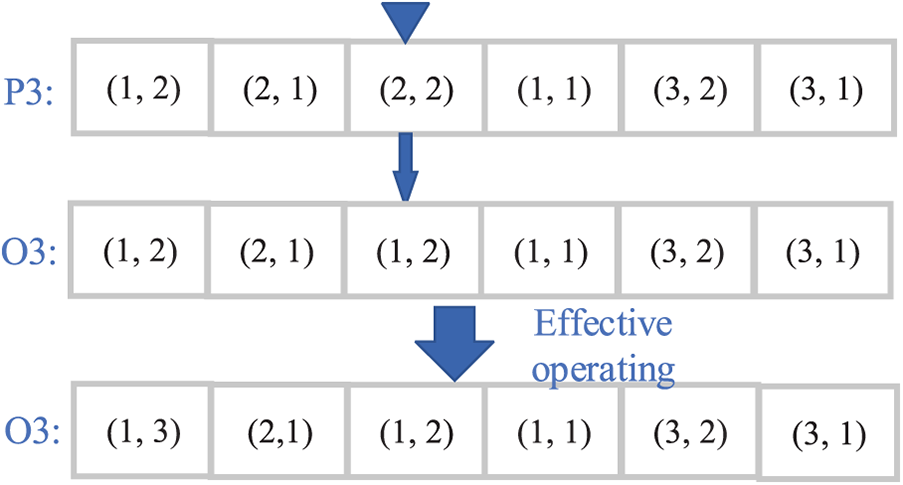
Figure 5: Single-point mutation process
The Nash equilibrium solution algorithm based on the genetic algorithm (NE-GA) is designed in this paper, and the algorithm steps are as follows. The algorithm flow diagram is shown in Fig. 6.
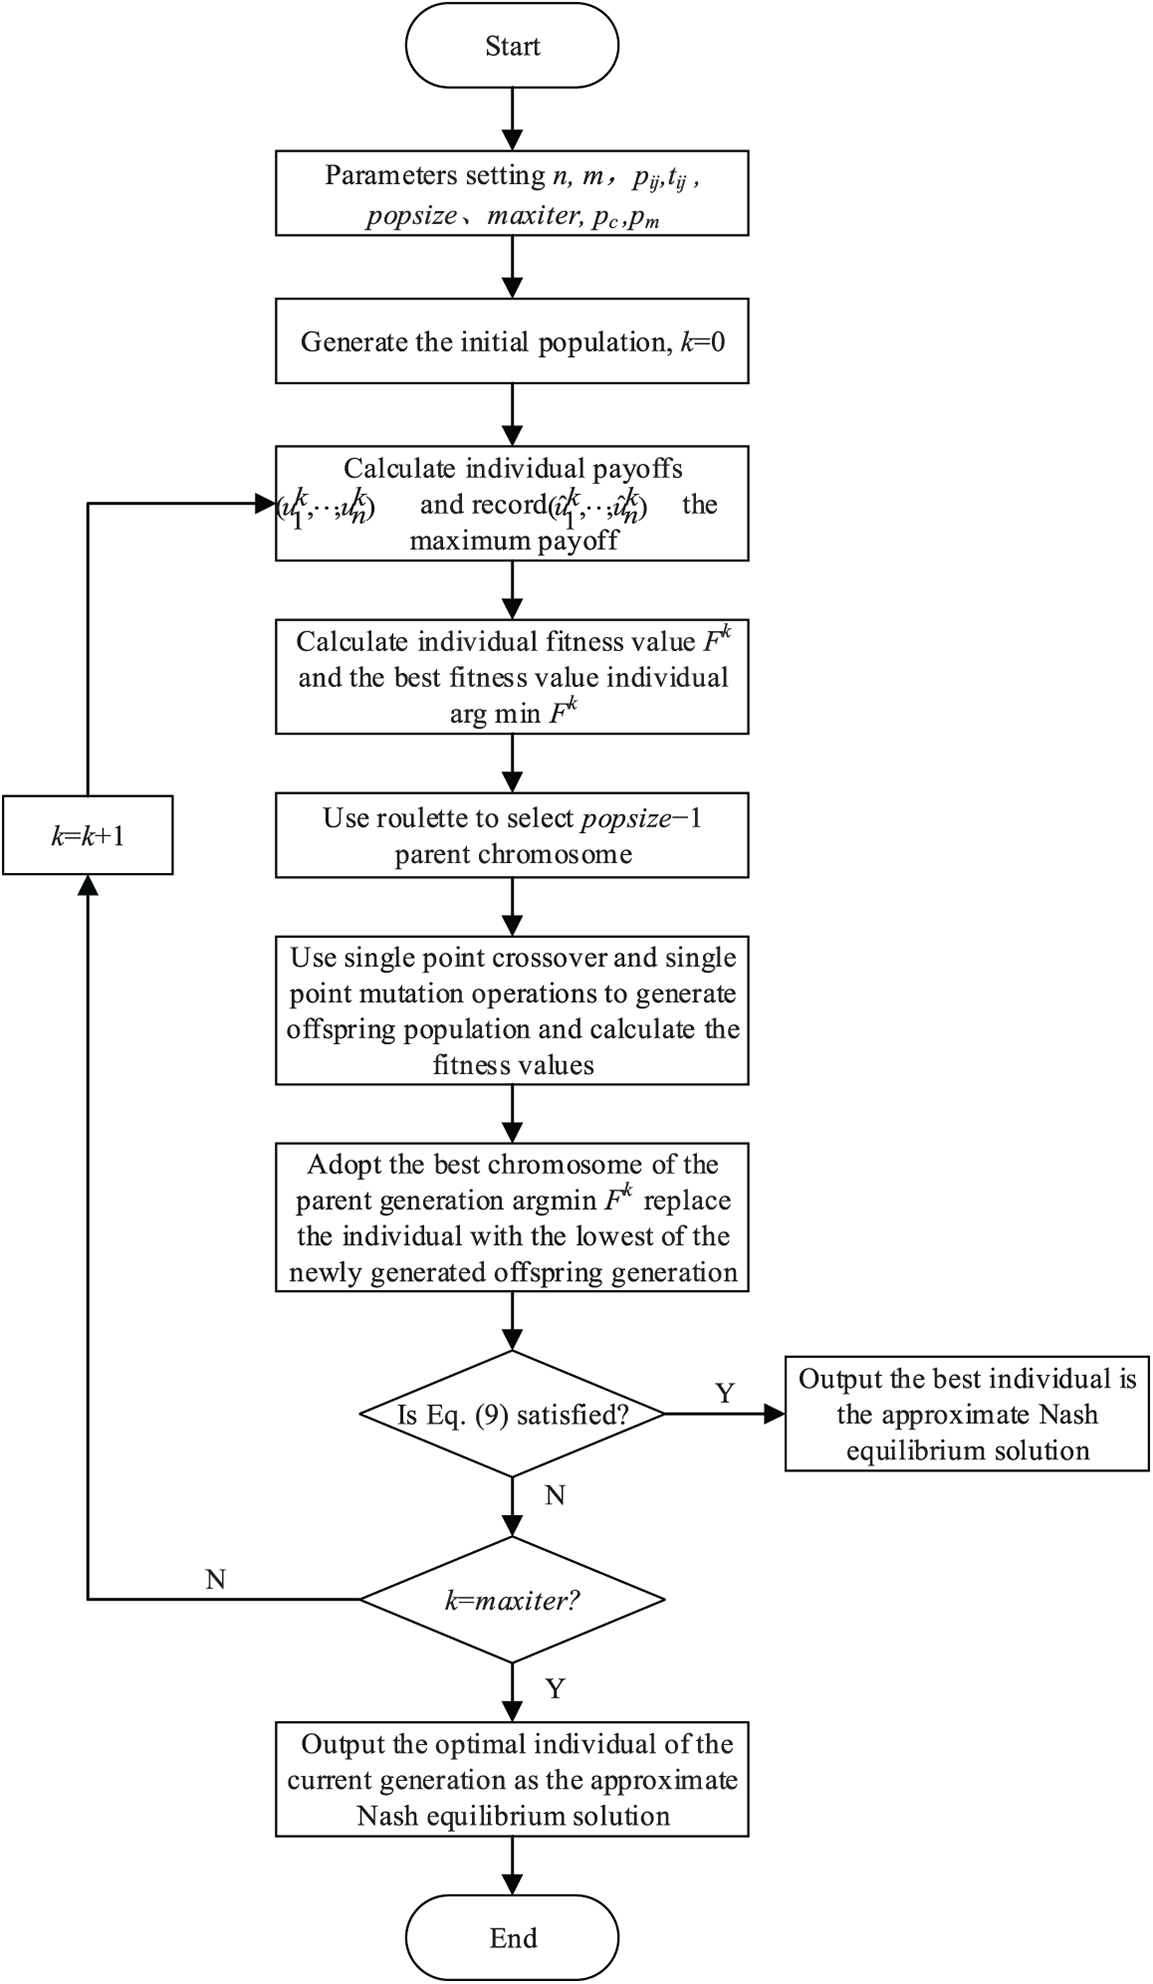
Figure 6: Flowchart of Nash equilibrium solution algorithm based on genetic algorithm
Step 1: Initialization, input job number (n), machine number (m), job processing time (pij), job transport time (tij). Set size of the population (popsize), maximum generations (maxiter), mutation probabilities (pm), crossover probabilities (pc).
Step 2: Initialize the population and set k = 0.
Step 3: Update the population:
Step 3.1: Calculate the payoff of each individual
Step 3.2: Calculate the fitness value of each individual
Step 3.3: Choose a popsize−1 parent chromosome to be cross-mutated in the kth generation population using roulette.
Step 3.4: Use the single point crossover and single point mutation operations to generate an offspring population and calculate the fitness of each individual.
Step 3.5: Generate a new generation population by adopting the best chromosome of the parent generation arg
Step 4: Is Eq. (9) satisfied? If yes, output the best individual is the approximate Nash equilibrium solution. Otherwise, go to Step 5.
Step 5: Is k = maxiter? If yes, output the optimal individual of the current generation as the approximate Nash equilibrium solution. Else, go to step 3 and enter the next iteration.
4 Simulation Experiment and Analysis
The following simulation analysis examples are aimed at verifying the effectiveness of the proposed scheduling game model and the designed NE-GA algorithm. To compile the algorithm, the Pycharm-2017.3.4 compiler and Python-3.7 interpreter are used. Experiments are performed on a computer equipped with an Intel(R) Core(TM) i3-4170 CPU @ 3.70 GHz and 8 GB of RAM.
4.1 Experimental Data and Parameter Selection
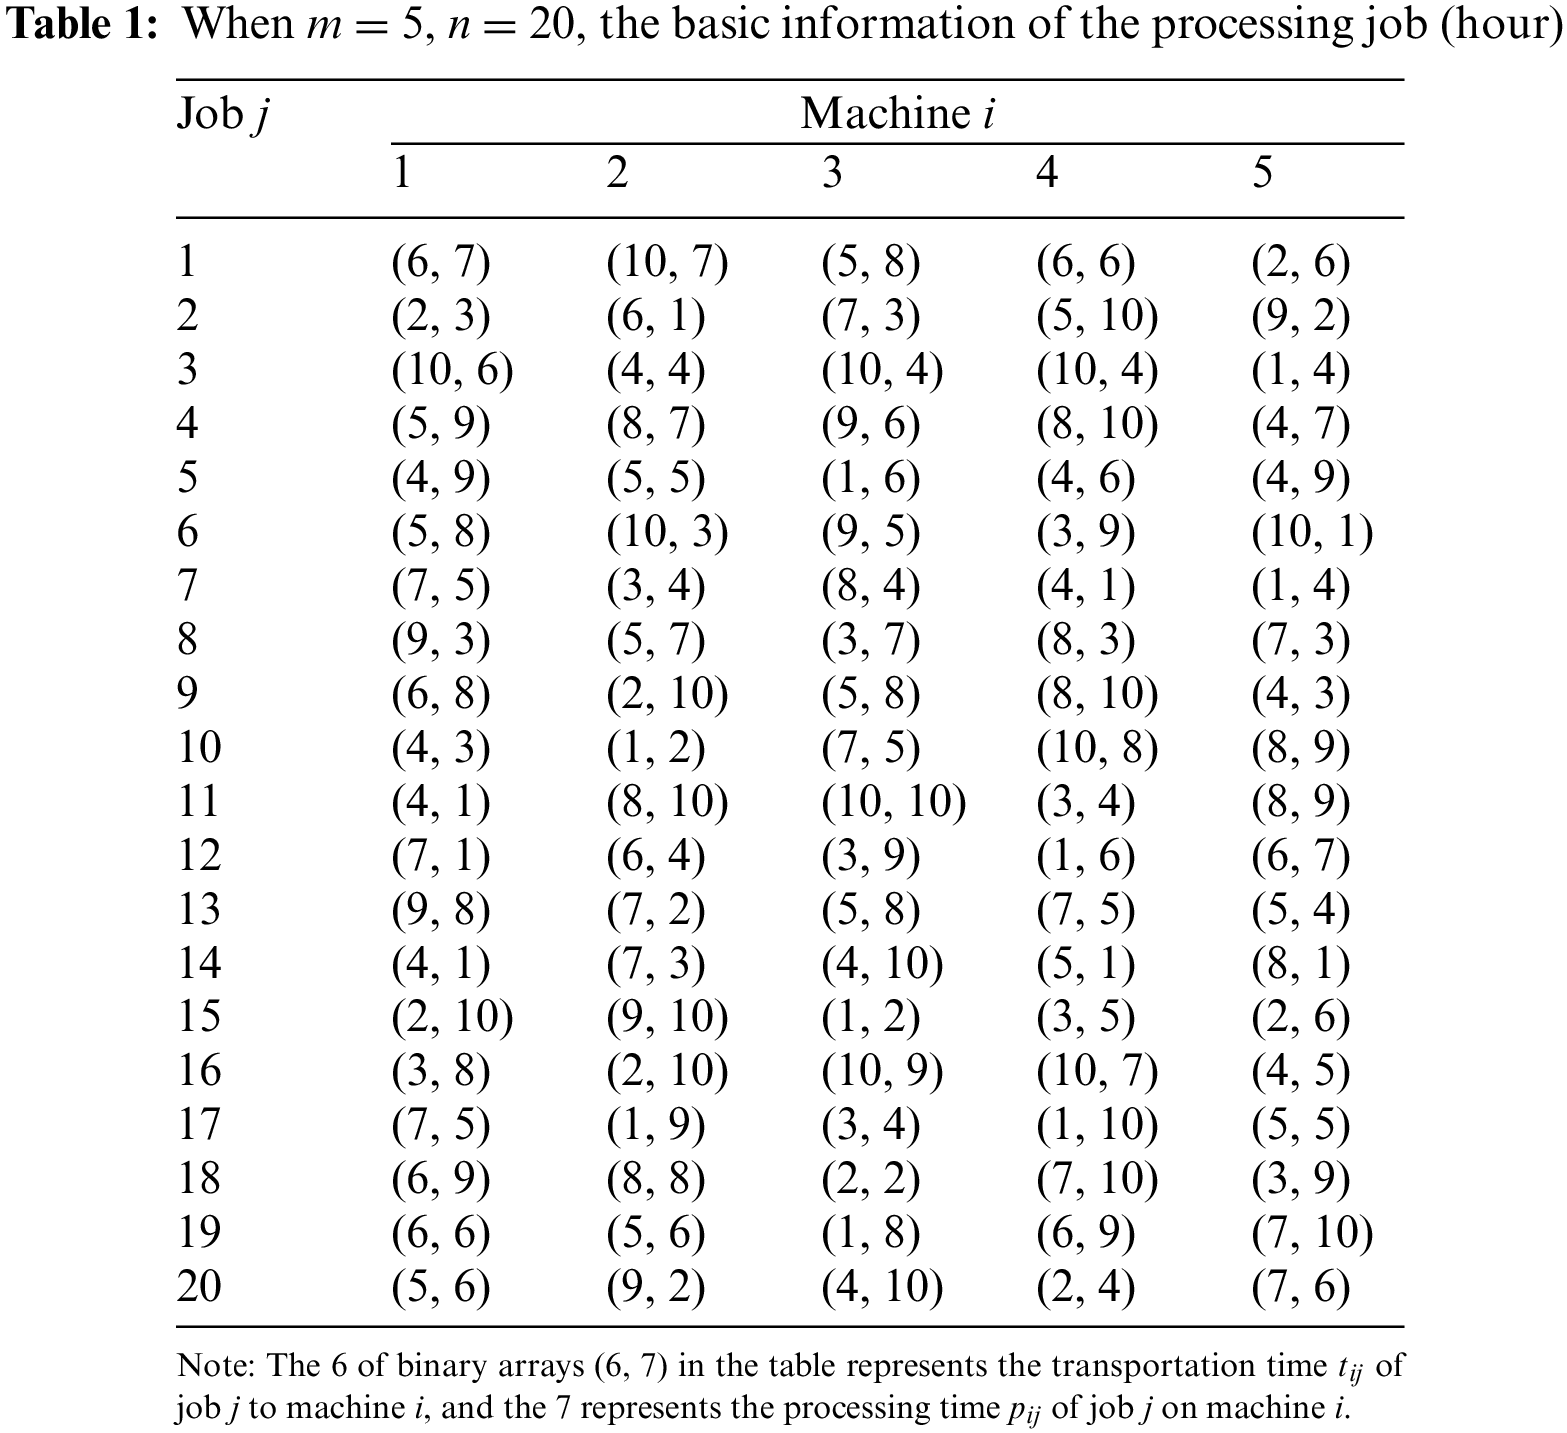
Assume that the shared manufacturing platform has 5 machines available for shared production, each of which is located in a different factory, and that 20 jobs from 20 customers are to be processed on these shared machines. Both the processing time pij and the transportation time tij are generated at random from the interval [1,10], and the unit of both is hours. Table 1 displays a collection of experimental data.
The following orthogonal experiments are designed to determine the parameter values of the algorithm. The population sizes (popsize) were set at 30, 50, and 100, with mutation probabilities (pm) of 0.1, 0.2, and 0.3, respectively. Table 2 shows the calculation results under different parameters. The maximum number of iterations (maxiter) is the number of iterations when Nash equilibrium is reached, that is, when Eq. (9) is satisfied. The maximum number of iterations is set to 1000 if the algorithm fails to satisfy Eq. (9). Simultaneously, the makespan Cmax is listed for comparing calculation results.
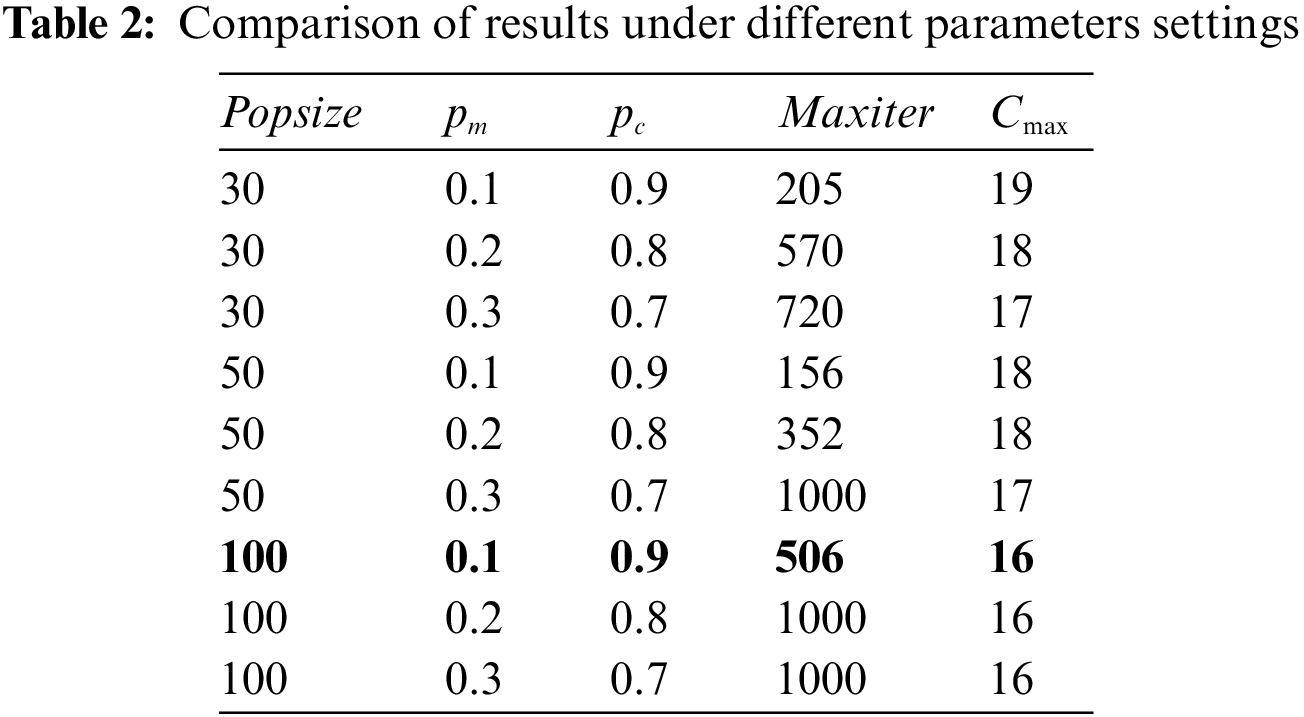
As shown in Table 2, the smaller the population size, the fewer iterations it takes to reach Nash equilibrium, but it is easy to fall into local optima at this time, resulting in no better solution. If the mutation probability is too high, and the crossover probability is too low, the algorithm will approximate a random search, making Nash equilibrium difficult to achieve. When the population size is 100 and the mutation probability is 0.1, a better convergence rate and a better solution can be guaranteed. As a result, the population size is set to 100, the mutation probability is set to 0.1, the crossover probability is set to 0.9, the maximum generation is set to 1000, and ε is set to 1.
4.2 Experimental Results and Analysis
Fig. 7 shows the iterative convergence graph of the best fitness value and the makespan Cmax when the algorithm iterates 1000 times under the data in Table 1. It can be seen that when the number of iterations is close to 400, the fitness value and Cmax tend to converge steadily.
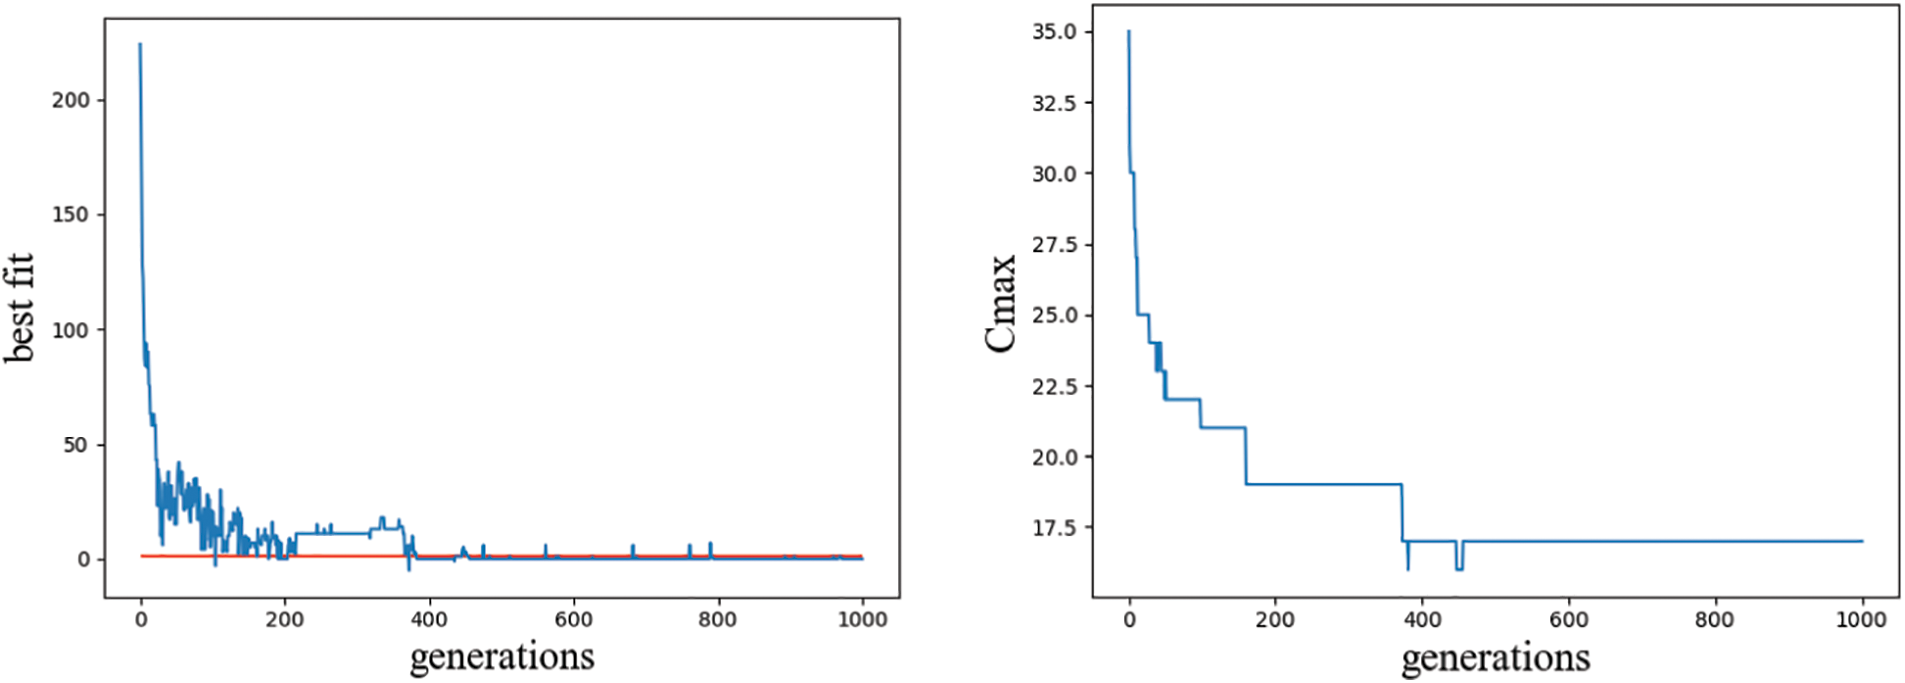
Figure 7: Convergence graph of the best fitness value and Cmax
The Gantt charts of the best individuals when the algorithm runs the first, 100th, and 400th generations are shown in Fig. 8. It can be seen that the machine load is not balanced in the first generation. Except for machine 1, the rest of the machines have more idle time. The jobs at the back of the queue have a better chance of completing the machining early without interfering with the other jobs. There is a big gap between the scheme and Nash equilibrium, far worse than the 100th and 400th generations. The machine load becomes more and more balanced as the iteration progresses, and the makespan becomes smaller and smaller, with the 400th generation significantly better than the 100th generation. It is difficult to unilaterally advance a job in the 400th generation without affecting the others.
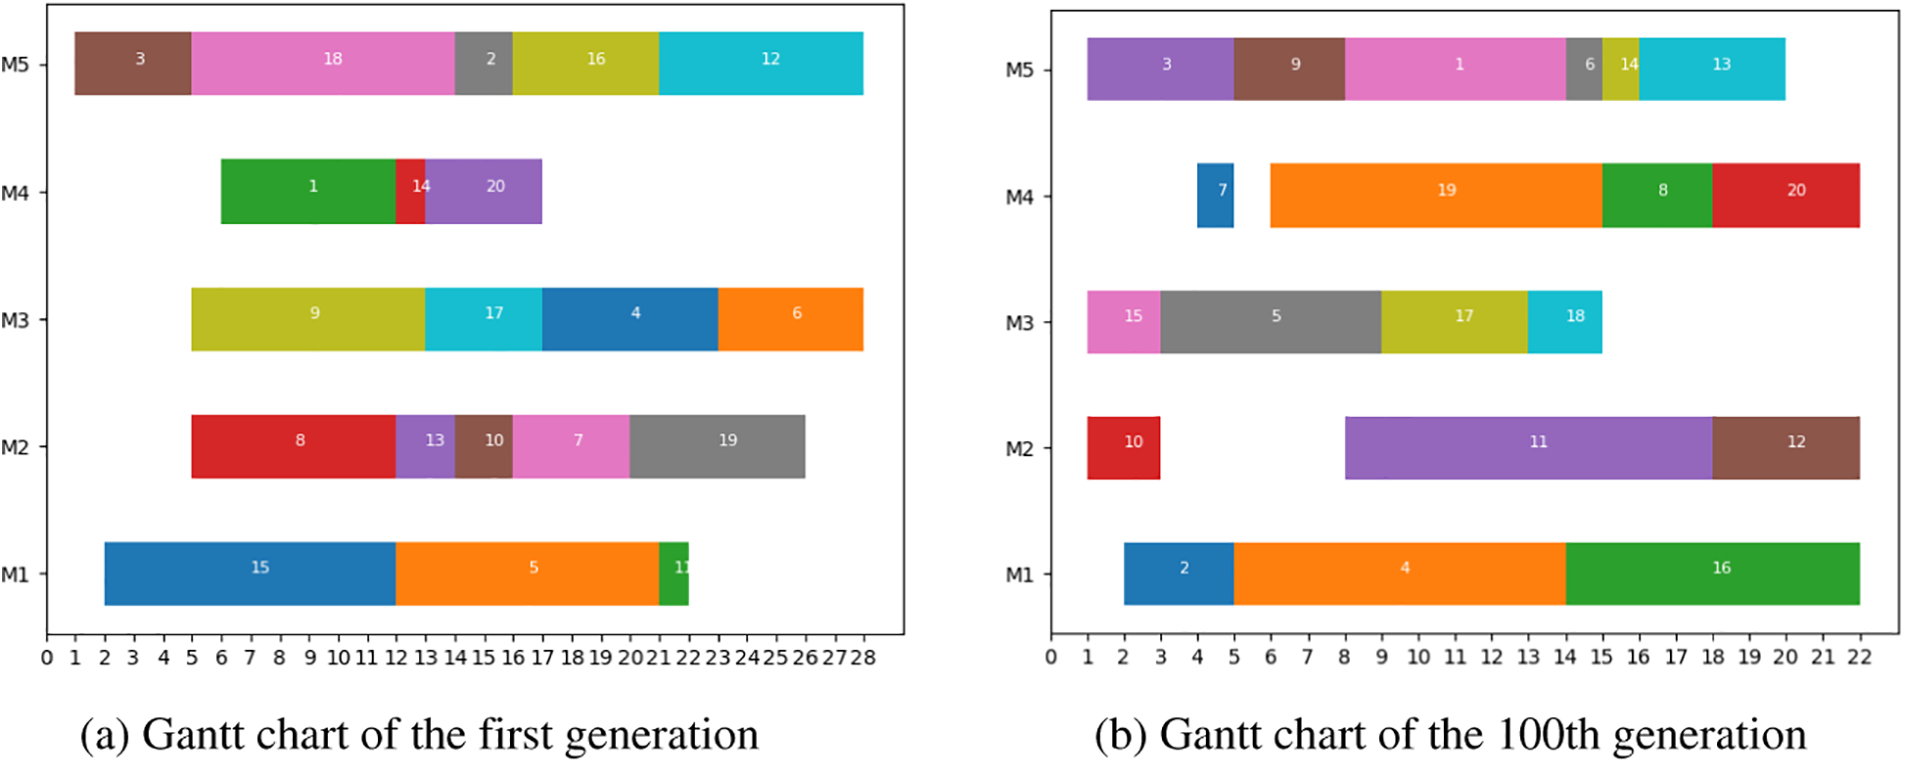
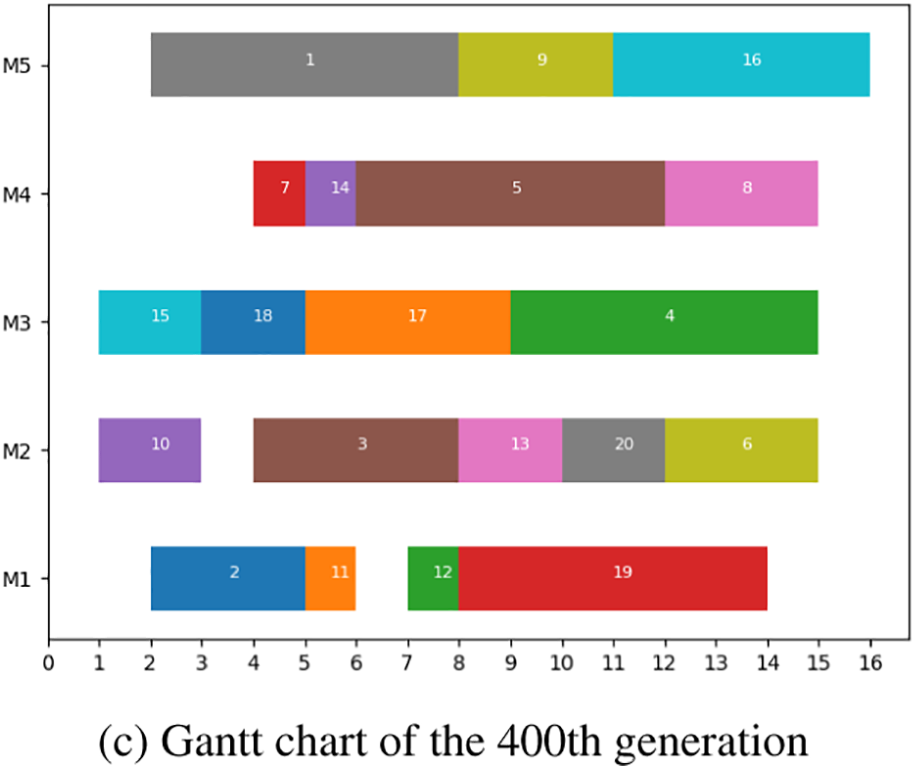
Figure 8: Iterative Gantt chart of NE-GA
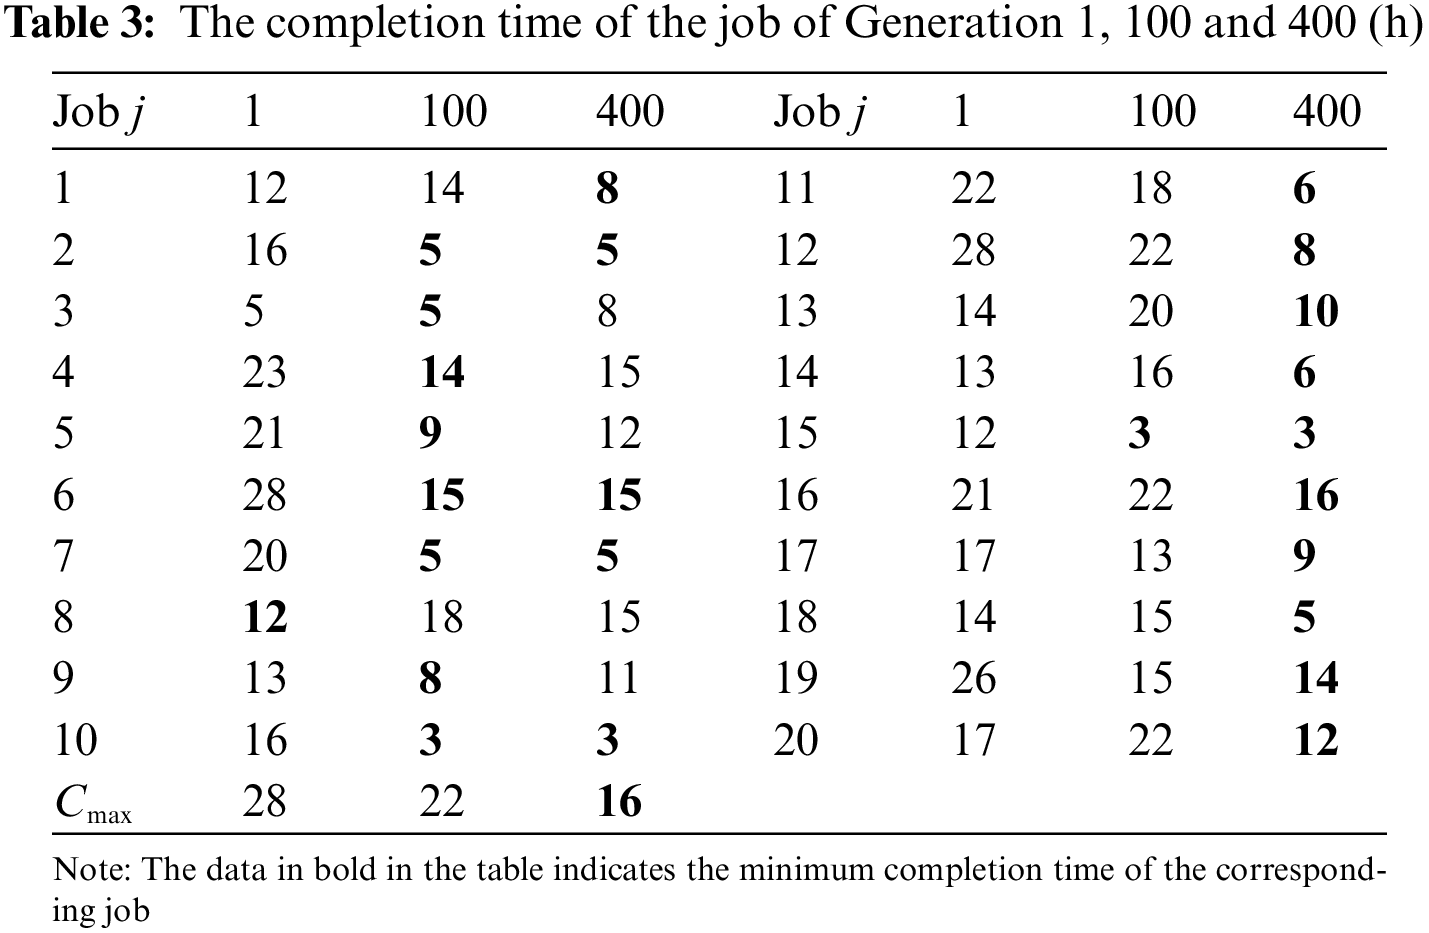
Table 3 compares the completion times of Generation 1, Generation 100, and Generation 400. As the iteration progresses, the completion time of each job gradually decreases. In the first generation, compared to the 100th and 400th generations, the completion time of 19 jobs has decreased. The completion time of 15 of the 20 jobs in the 400th generation reaching approximate Nash equilibrium is the shortest, with only 5 jobs having an increase in completion time. The payoff of each job reaches a relative equilibrium state. Fig. 8 shows that at the 400th generation, it is difficult to unilaterally reduce the completion time of a job without increasing the completion time of other jobs, which is consistent with the concept of Nash equilibrium. Furthermore, the last row of Table 3 compares the makespan of jobs, and it can be seen that the 400th generation is also the shortest.
To demonstrate the effectiveness of the designed algorithm, the NE-GA algorithm is compared to the heuristic algorithms: First Come First Served (FCFS), Shortest Processing Time First (SPT), Longest Processing Time First (LPT), and the intelligent optimization algorithms: the simulated annealing algorithm (SA) and the particle swarm optimization algorithm (PSO) at different sizes of experiments. The Gantt chart of these algorithms when m = 5 and n = 20 is shown in Fig. 9. It is clear that NE-GA outperforms in terms of job completion time, overall makespan, and machine utilization rate.
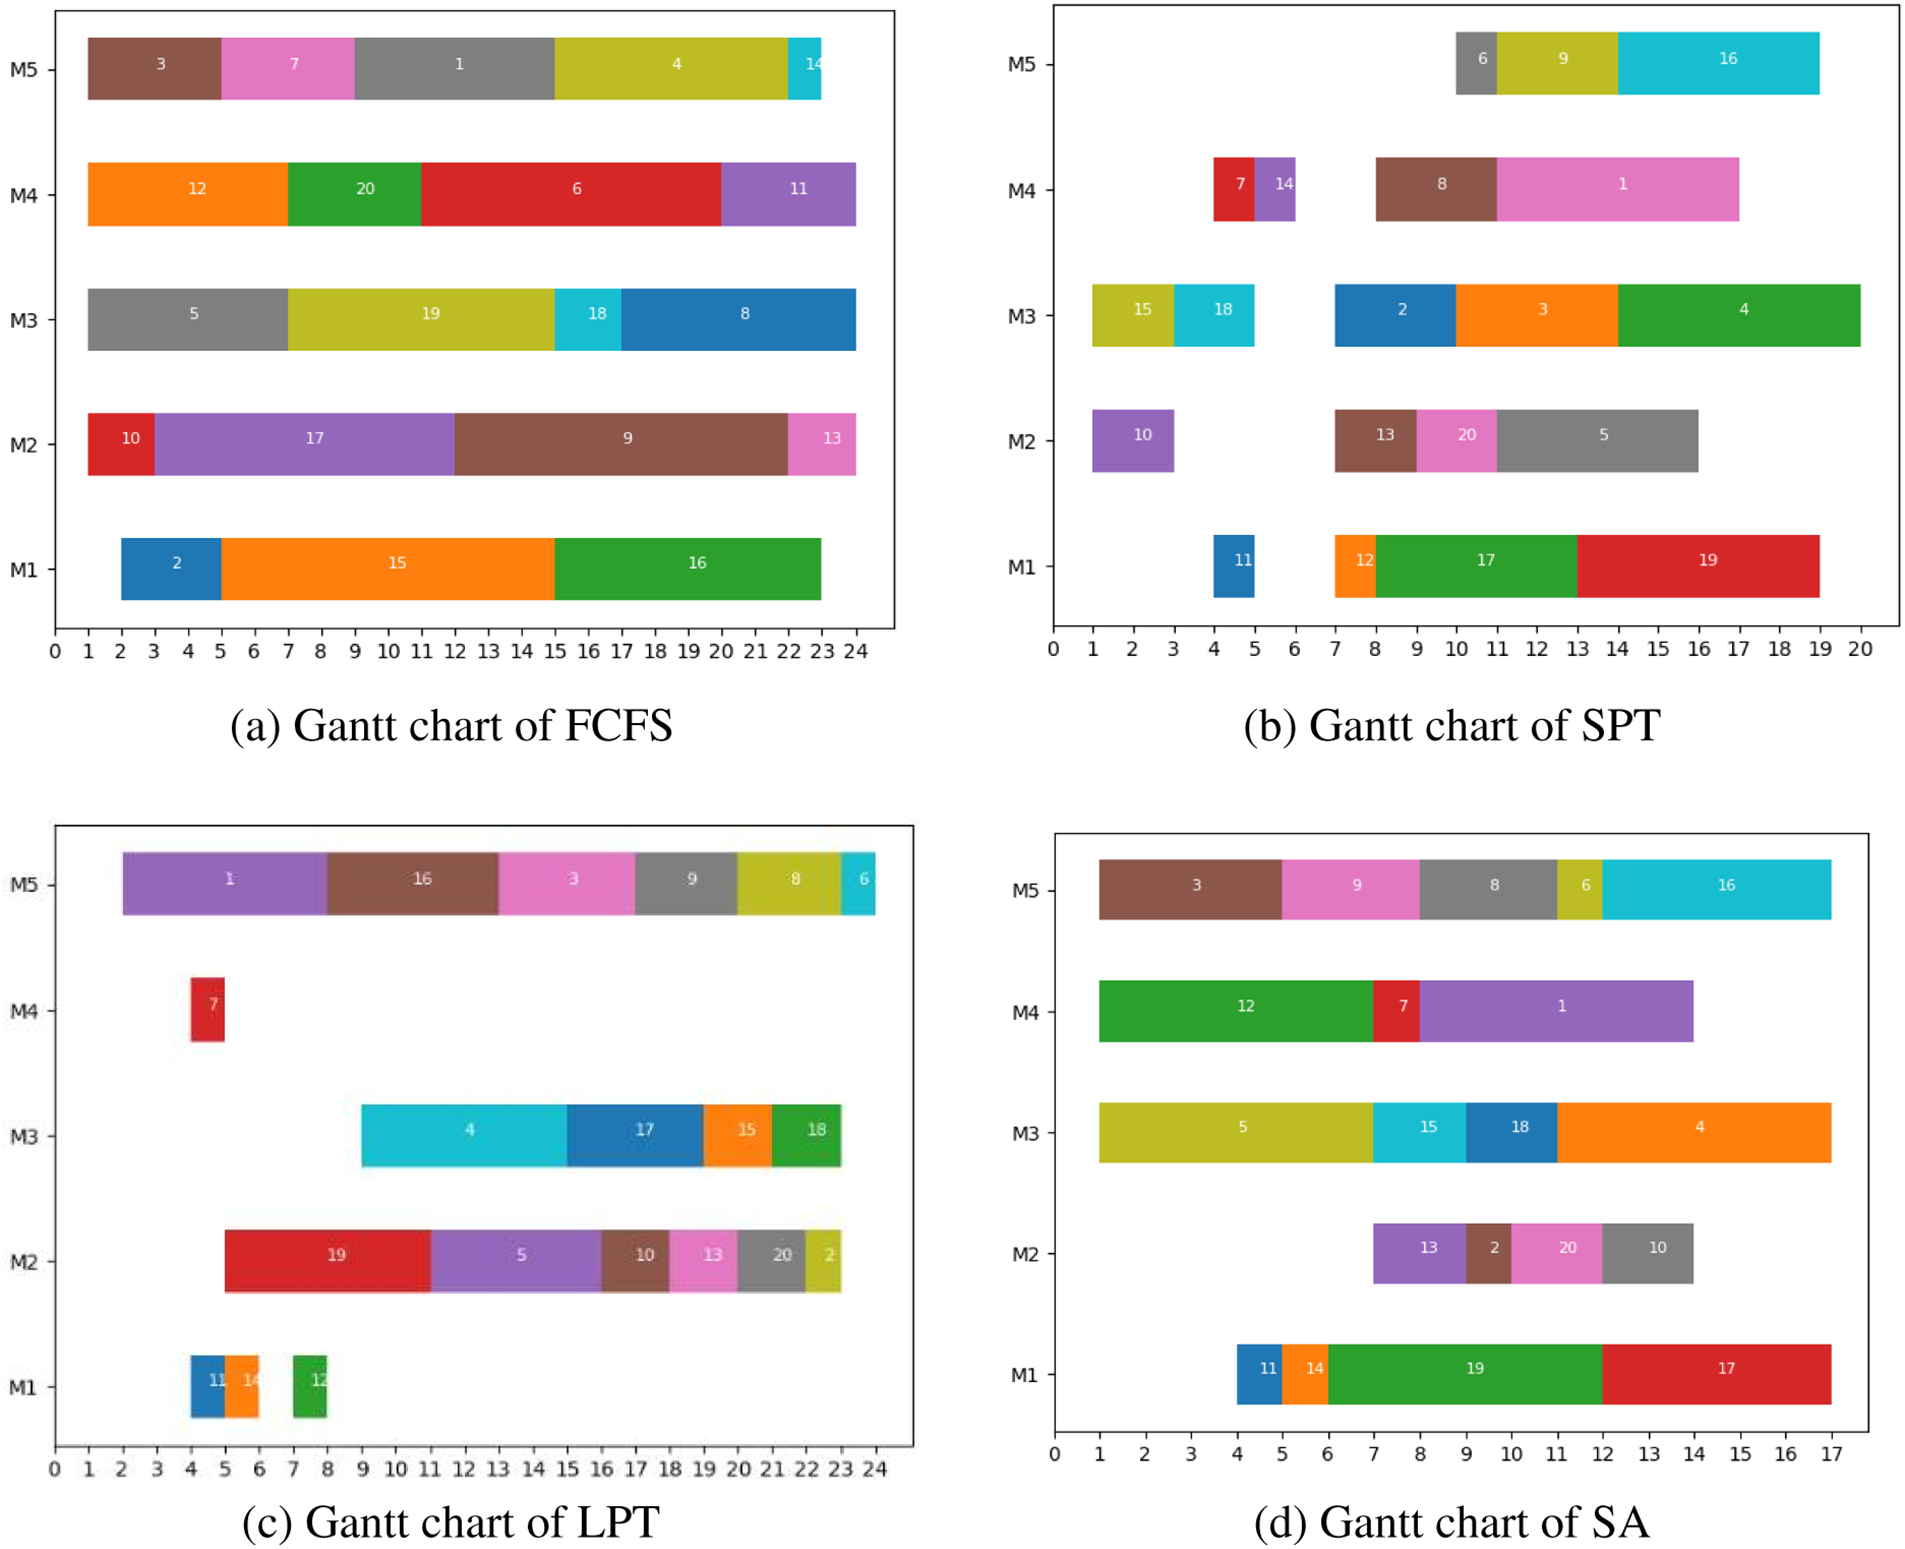
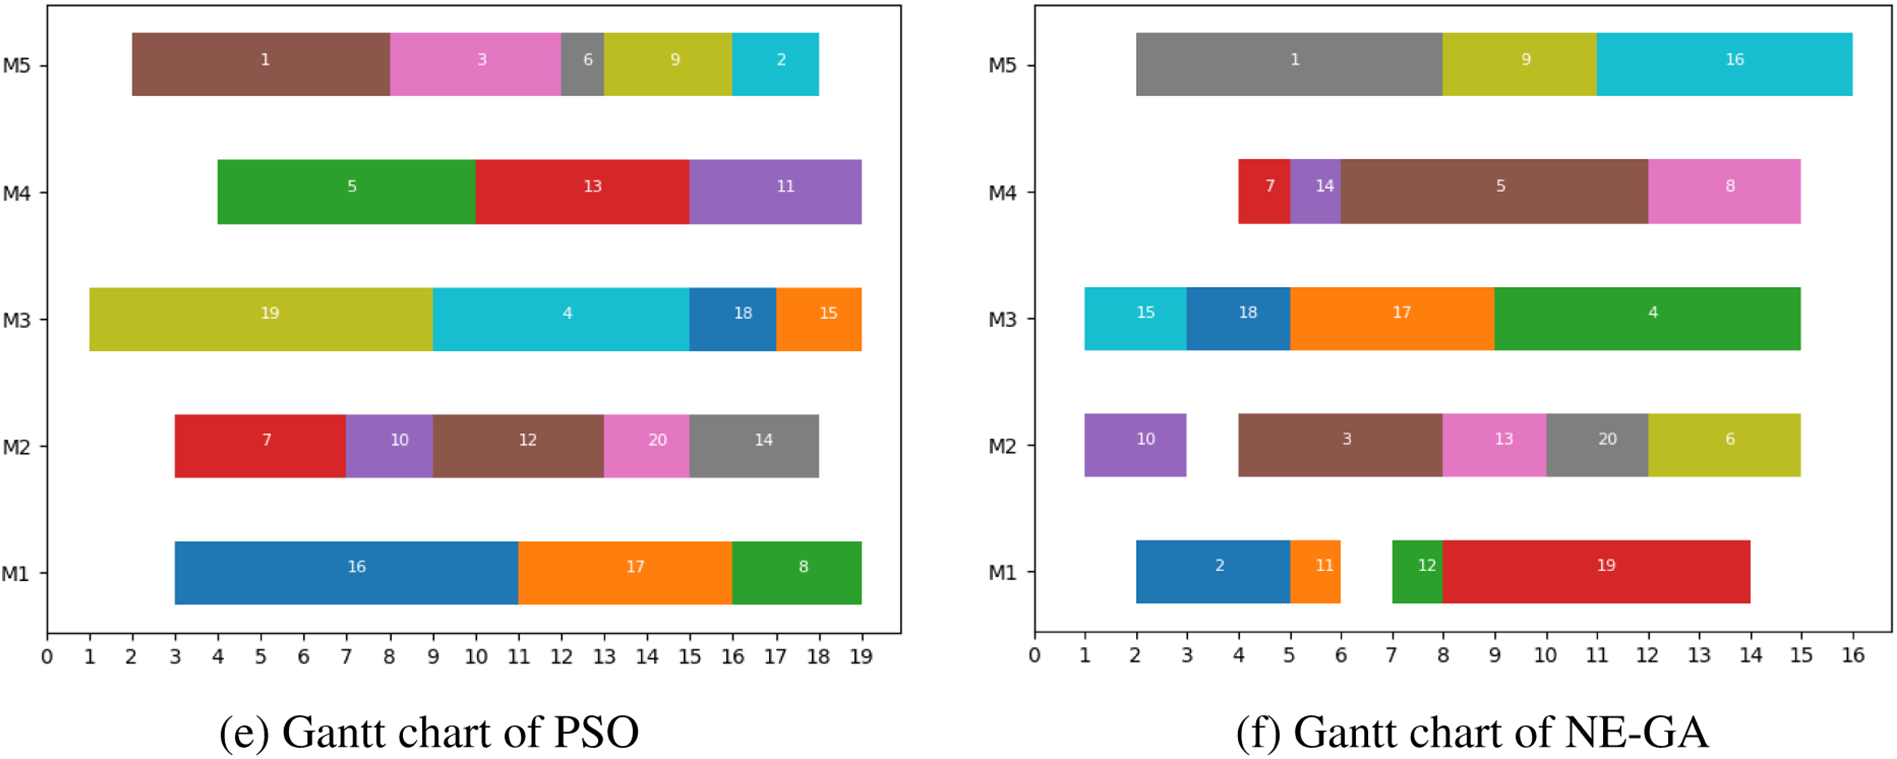
Figure 9: Comparison of Gantt chart
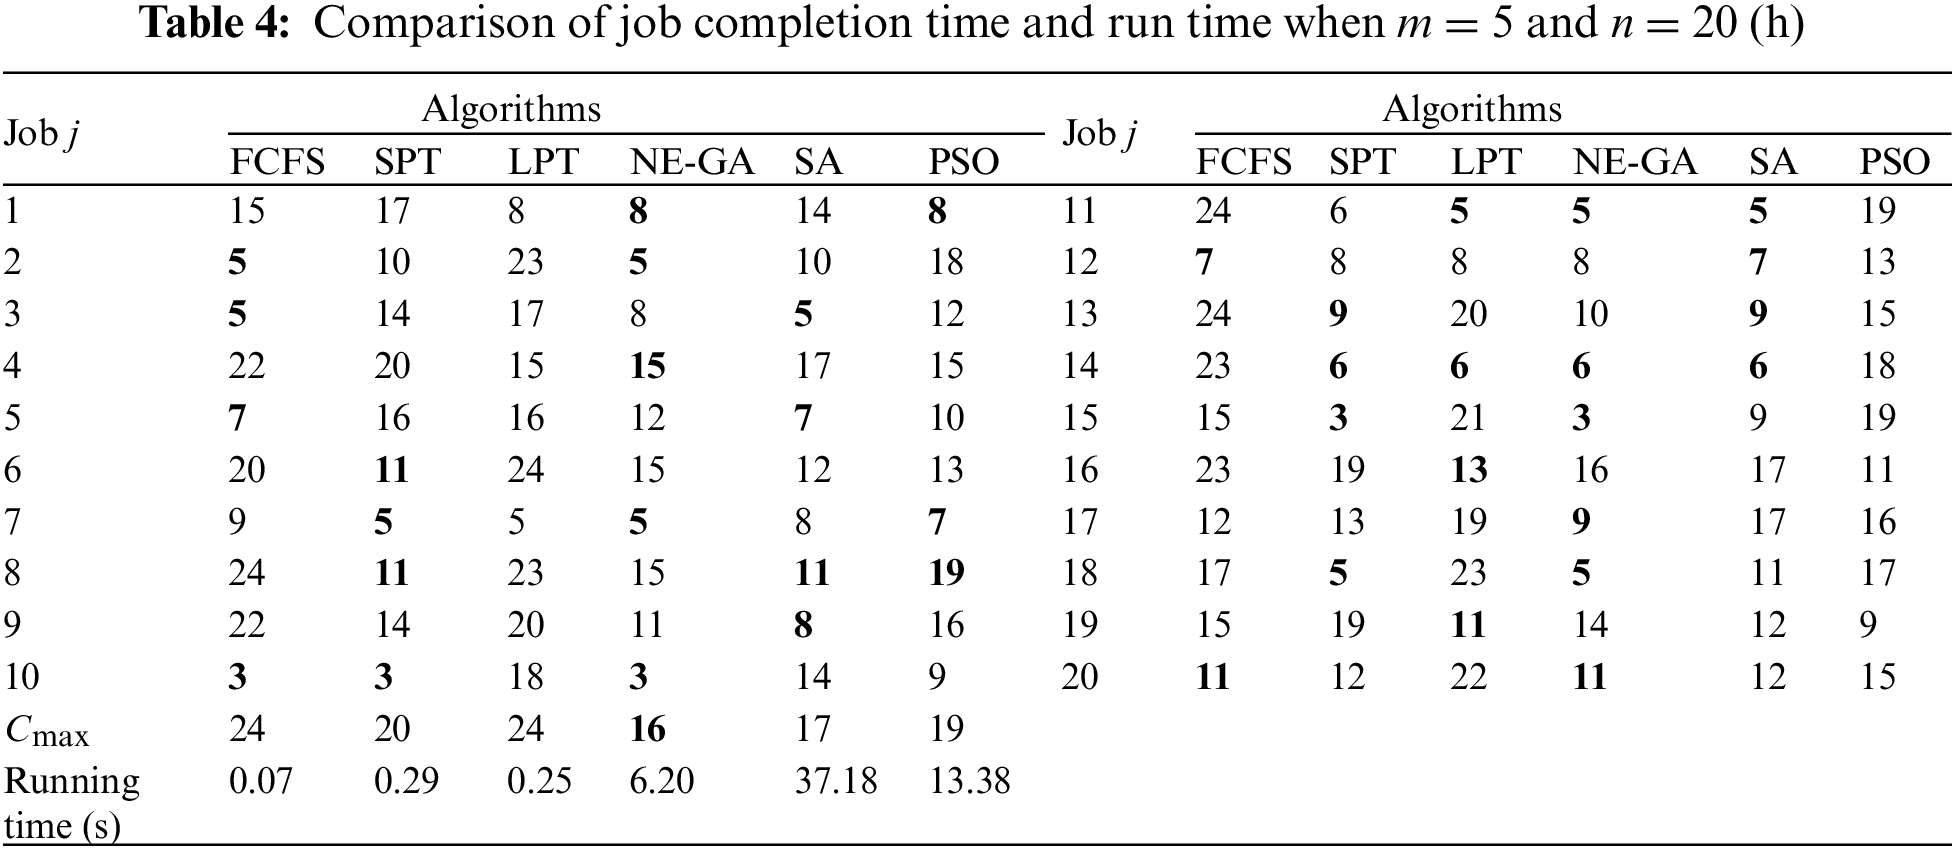
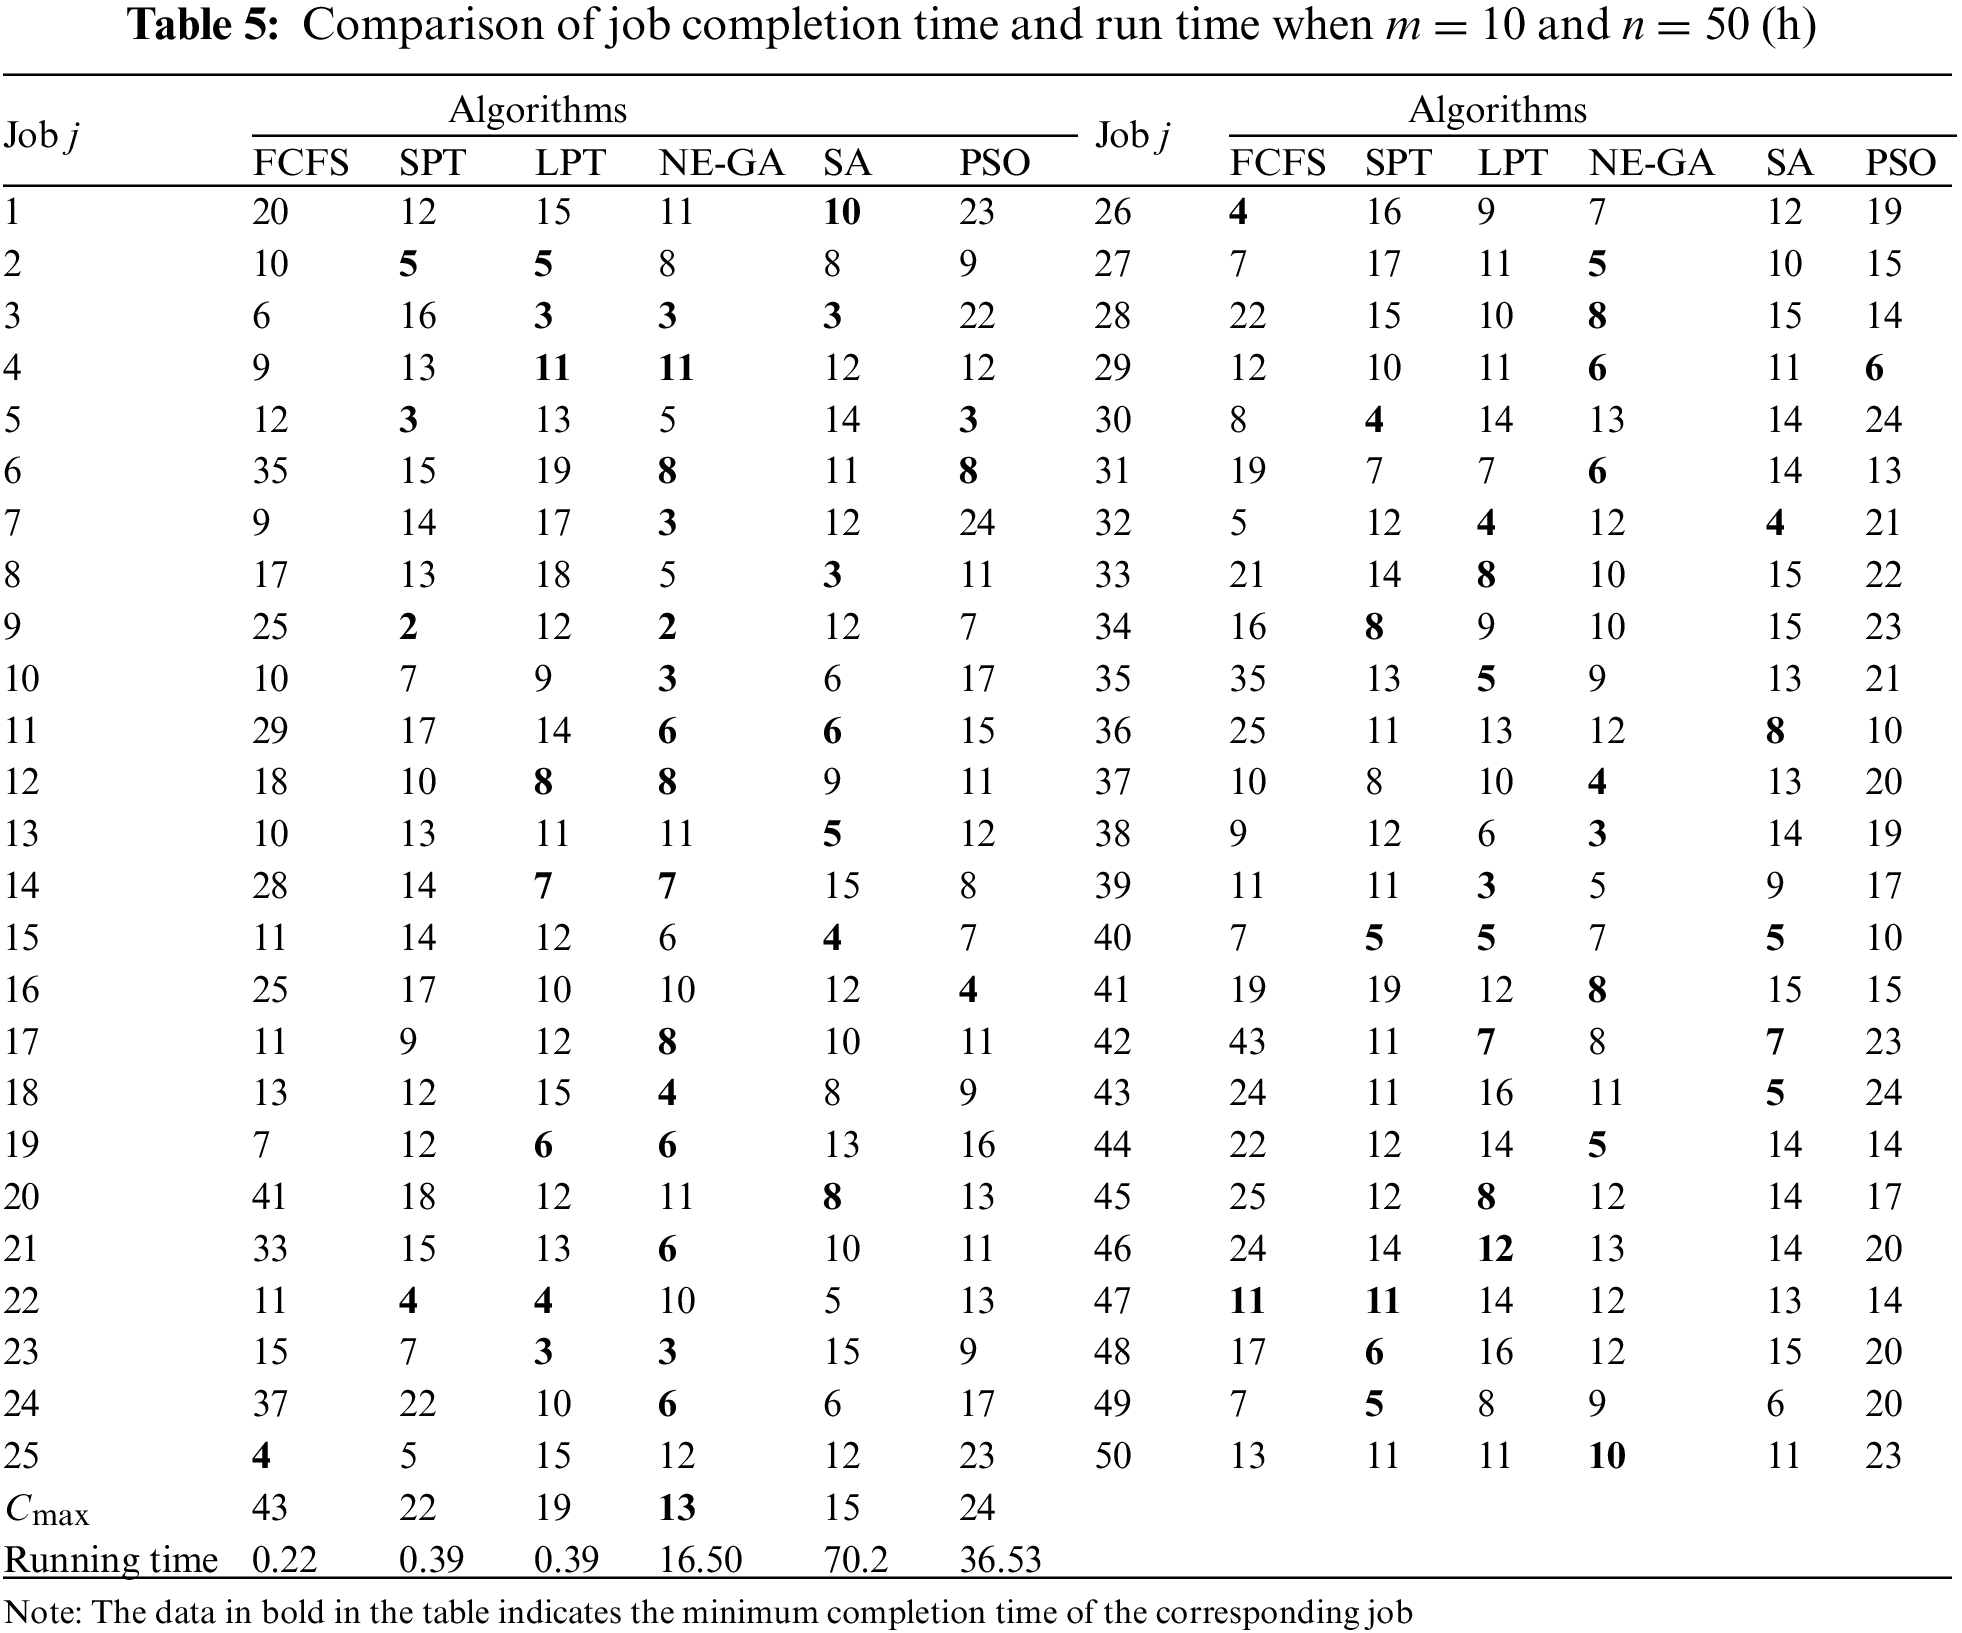
Tables 4 and 5 compare the job completion time and run time of these algorithms at m = 5, n = 20 and m = 10, n = 50 at the two experimental sizes. It can be seen that the completion time of each job under the NE-GA algorithm is mostly the shortest among the six algorithms at different experimental sizes, and the makespan Cmax of the NE-GA algorithm is also the shortest among the six algorithms. Although SA and PSO are superior to the three heuristic algorithms (FCFS, SPT, and LPT), the completion time of each job and makespan are still worse than those of NE-GA. When m = 5, n = 20, 12 of the 20 jobs obtained by NE-GA have the minimum completion time. Compared with FCFS and PSO, the makespan of NE-GA is reduced by 33.3% and 15.8%, respectively. In terms of the running time, the three heuristic algorithms are the fastest; they can get the result within 1 s, but their solving performance is poor. Although the running speed of NE-GA is slower than the heuristic algorithms, it is better than that of SA and PSO, which can get the result within several seconds and meet the real-time requirements.
In this paper, we have investigated the coordinated scheduling problem of parallel machine production and transportation in shared manufacturing. A non-cooperative game model was established when jobs from different customers competed for the shared machines at different locations, and the jobs took their respective completion times as payoff. The fitness function was constructed based on the definition of Nash equilibrium, and the Nash equilibrium solution algorithm based on the genetic algorithm (NE-GA) was designed to find the Nash equilibrium point of the game model. The proposed model and algorithm were simulated, analyzed with several scheduling examples of different sizes, and compared with the heuristic algorithms (FCFS, SPT, and LPT) and other intelligent optimization algorithms (SA and PSO). The results showed that the method performed well in terms of completion time and makespan for each job and that it balanced the payoffs for multiple customers.
In the future, the coordinated scheduling problem of parallel machine production and transportation can be studied, considering the transportation capacity limitation in the shared manufacturing environment. In addition, the theoretical convergence analysis of the proposed algorithm is also future work.
Acknowledgement: The authors wish to acknowledge the contribution of Liaoning Key Lab of Equipment Manufacturing Engineering Management, Liaoning Research Base of Equipment Manufacturing Development, Liaoning Key Research Base of Humanities and Social Sciences: Research Center of Micro-management Theory of SUT.
Funding Statement: This work was supported in part by the Project of Liaoning BaiQianWan Talents Program under Grand No. 2021921089, the Science Research Foundation of Educational Department of Liaoning Province under Grand No. LJKQZ2021057 and WJGD2020001, the Key Program of Social Science Planning Foundation of Liaoning Province under Grant L21AGL017.
Conflicts of Interest: The authors declare that they have no conflicts of interest to report regarding the present study.
References
1. J. B. He, J. Zhang and X. J. Gu, “Research on sharing manufacturing in Chinese manufacturing industry,” The International Journal of Advanced Manufacturing Technology, vol. 104, no. 1, pp. 463–476, 2019. [Google Scholar]
2. E. Brandt, “A vision for shared manufacturing,” Mechanical Engineering, vol. 112, pp. 52–55, 1990. [Google Scholar]
3. E. B. Richard, D. Fred, J. H. Cody, E. S. Gary, J. S. Edward et al., “A group technology model to assess consolidation and reconfiguration of multiple industrial operations—a shared manufacturing solution,” International Journal of Computer Integrated Manufacturing, vol. 6, no. 5, pp. 311–322, 1993. [Google Scholar]
4. N. Rozman, J. Diaci and M. Corn, “Scalable framework for blockchain-based shared manufacturing,” Robotics and Computer-Integrated Manufacturing, vol. 71, no. 1, pp. 102139, 2021. [Google Scholar]
5. P. Y. Yan, L. Yang and A. D. Che, “Review of supply-demand matching and scheduling in shared manufacturing,” Systems Engineering Theory & Practice, vol. 42, no. 3, pp. 811–832, 2022. [Google Scholar]
6. C. Y. Yu, X. Xu, S. Q. Yu, A. Q. Sang, C. Yang et al., “Shared manufacturing in the sharing economy: Concept, definition and service operations,” Computers & Industrial Engineering, vol. 146, no. II, pp. 106602, 2020. [Google Scholar]
7. P. Y. Jiang and P. L. Li, “Shared factory: A new production node for social manufacturing in the context of sharing economy,” Proceedings of the Institution of Mechanical Engineers Part B: Journal of Engineering Manufacture, vol. 234, no. 1–2, pp. 285–294, 2020. [Google Scholar]
8. N. Boysen, D. Briskorn and S. Schwerdfeger, “Matching supply and demand in a sharing economy: Classification, computational complexity, and application,” European Journal of Operational Research, vol. 278, no. 2, pp. 578–595, 2019. [Google Scholar]
9. F. F. Zheng, K. Y. Jin, Q. R. Song and M. Liu, “Scheduling strategy for processing resource sharing considering two-stage transportation,” Journal of Donghua University (Natural Science), vol. 48, no. 3, pp. 114–120, 2022. [Google Scholar]
10. A. Diabat, A. Dolgui, W. Janiak and M. Y. Kovalyov, “Three parallel task assignment problems with shared resources,” IISE Transactions, vol. 52, no. 4, pp. 478–485, 2019. [Google Scholar]
11. Q. Wei and Y. Wu, “Two-machine hybrid flow-shop problems in shared manufacturing,” Computer Modeling in Engineering & Sciences, vol. 131, no. 2, pp. 1125–1146, 2022. [Google Scholar]
12. K. Li, W. Xiao and X. X. Zhu, “Pricing strategies for sharing manufacturing model based on cloud platform,” Control and Decision, vol. 37, no. 4, pp. 1056–1066, 2022. [Google Scholar]
13. Y. K. Liu, X. Xu, L. Zhang, L. Wang and R. Y. Zhong, “Workload-based multi-task scheduling in cloud manufacturing,” Robotics and Computer Integrated Manufacturing, vol. 45, no. 1, pp. 3–20, 2017. [Google Scholar]
14. Y. F. Xu, R. T. Zhi, P. F. Zhen and M. Liu, “Online strategy and competitive analysis of production order scheduling problem with rental cost of shared machines,” Chinese Journal of Management Science, in press, 2022. [Google Scholar]
15. G. Wang, G. Zhang, X. Guo and Y. F. Zhang, “Digital twin-driven service model and optimal allocation of manufacturing resources in shared manufacturing,” Journal of Manufacturing Systems, vol. 59, pp. 165–179, 2021. [Google Scholar]
16. Y. K. Liu, L. Zhang, F. Tao and L. Wang, “Resource service sharing in cloud manufacturing based on the Gale-Shapley algorithm: Advantages and challenge,” International Journal of Computer Integrated Manufacturing, vol. 30, no. 4–5, pp. 420–432, 2017. [Google Scholar]
17. M. Ji, X. Ye, F. Qian, T. C. E. Cheng and Y. W. Jiang, “Parallel-machine scheduling in shared manufacturing,” Journal of Industrial and Management Optimization, vol. 18, no. 1, pp. 681–691, 2022. [Google Scholar]
18. G. Zhang, C. H. Chen, B. F. Liu, X. Y. Li and Z. X. Wang, “Hybrid sensing-based approach for the monitoring and maintenance of shared manufacturing resources,” International Journal of Production Research, in press, 2022. https://doi.org/10.1080/00207543.2021.2013564 [Google Scholar] [CrossRef]
19. L. Marin, F. Alberto and O. Eva, “Spillover algorithm: A decentralised coordination approach for multi-robot production planning in open shared factories,” Robotics and Computer-Integrated Manufacturing, vol. 70, no. 1, pp. 102110, 2021. [Google Scholar]
20. E. Koutsoupias and C. Papadimitriou, “Worst-case equilibria,” Computer Science Review, vol. 3, no. 2, pp. 65–69, 2009. [Google Scholar]
21. C. J. Wang and Q. Wu, “The supply-demand matching efficiency of single resource based on sequencing game in sharing economy,” Industrial Engineering and Management, vol. 26, no. 1, pp. 165–173, 2021. [Google Scholar]
22. Q. Wei and T. Y. Jiang, “Price of anarchy of a scheduling game with hybrid coordination mechanisms,” Applied Mathematics A Journal of Chinese Universities, vol. 32, no. 4, pp. 473–486, 2017. [Google Scholar]
23. C. A. Xu and F. Li, “Game model analysis of symmetrical enterprise’s manufacturing resources sharing under environment of clouding manufacturing,” Application Research of Computers, vol. 36, no. 11, pp. 1–10, 2018. [Google Scholar]
24. E. S. Qi, T. B. Li and L. Liu, “The evolutionary game analysis of the sharing of manufacturing resource in the environment of cloud manufacturing,” Operations Research and Management Science, vol. 26, no. 2, pp. 25–34, 2017. [Google Scholar]
25. C. J. Wang and Y. G. Xi, “Modeling and analysis of single machine scheduling based on non-cooperative game theory,” Acta Automatics Sinica, vol. 31, no. 4, pp. 516–522, 2005. [Google Scholar]
26. Q. Q. Nong, S. J. Guo and L. H. Miao, “The shortest first coordination mechanism for a scheduling game with parallel-batching machines,” Journal of the Operations Research Society of China, vol. 4, no. 4, pp. 517–527, 2016. [Google Scholar]
27. M. L. Pinedo, Scheduling: Theory, Algorithms and Systems, 4th ed., USA: Springer, 2012. [Google Scholar]
Cite This Article
 Copyright © 2023 The Author(s). Published by Tech Science Press.
This work is licensed under a Creative Commons Attribution 4.0 International License , which permits unrestricted use, distribution, and reproduction in any medium, provided the original work is properly cited.
 Downloads
 Citation Tools