
 Submit a Paper
 Propose a Special lssue
 Open Access
ARTICLE

A Computer Vision-Based System for Metal Sheet Pick Counting
School of Manufacturing Systems and Mechanical Engineering, Sirindhorn International Institute of Technology, Thammasat University, 12120, Pathum Thani, Thailand
* Corresponding Author: Warut Pannakkong. Email:
Computers, Materials & Continua 2023, 75(2), 3643-3656. https://doi.org/10.32604/cmc.2023.037507
Received 06 November 2022; Accepted 30 January 2023; Issue published 31 March 2023
 View Full Text
 Download PDF
Abstract
Inventory counting is crucial to manufacturing industries in terms of inventory management, production, and procurement planning. Many companies currently require workers to manually count and track the status of materials, which are repetitive and non-value-added activities but incur significant costs to the companies as well as mental fatigue to the employees. This research aims to develop a computer vision system that can automate the material counting activity without applying any marker on the material. The type of material of interest is metal sheet, whose shape is simple, a large rectangular shape, yet difficult to detect. The use of computer vision technology can reduce the costs incurred from the loss of high-value materials, eliminate repetitive work requirements for skilled labor, and reduce human error. A computer vision system is proposed and tested on a metal sheet picking process for multiple metal sheet stacks in the storage area by using one video camera. Our results show that the proposed computer vision system can count the metal sheet picks under a real situation with a precision of 97.83% and a recall of 100%.Keywords
Companies in the manufacturing sector deal with inventories daily. Inventory in the companies directly affects the business’s cost and ability to meet demand [1]. Failing to monitor the companies’ inventory can lead to excessive or insufficient inventory and pilferage. Excessive inventory can lead to a high inventory holding cost and insufficient inventory risks product shortage costs and can damage customers’ satisfaction. Uncertain inventory levels affect production and procurement planning, resulting in inefficient production and excessive inventory as the company keeps spare resources in case of shortages. To combat the risk of uncertain inventory levels, an accurate material counting process is required. Accurate material counting can reduce inventory costs, material loss, and pilferage. Companies with a large number of laborers are susceptive to pilferage. Workers may exploit the lack of inventory monitoring of the company to steal material from the warehouses or production facilities. This can incur incessant costs to the company and the incurred cost can be significant if the pilfered items are high in value. Effects from pilferage can be reduced drastically by having an accurate material counting system that deters workers from stealing. In addition, a reliable inventory monitoring system ensures that the amounts of materials shown in the financial statements are accurate. This is crucial for companies that require audits to ensure compliance with accounting standards and government agencies.
Material counting is one of the main components of the inventory management system, therefore it requires accurate recording to keep track of the materials inventory. Traditional material counting systems of typical factories rely on employees to count raw materials, Work-in-process, and finished goods periodically, e.g., at least once a year (end of a calendar year), every six months, three months, or every month. This is usually done manually by an operator with a pen and paper and then inputting the records into a computer. The counting and monitoring of materials are repetitive activities, which naturally create stress and boredom for employees and can lead to counting errors resulting from human errors. The activities are ineffective use of human resources that do not add value to the production. The accuracy of the counting process relies on the scrupulousness of the workers. When materials are lost for unidentified reasons, the production cost is negatively affected. Modern technologies used to aid in material counting include Radio Frequency Identification (RFID), barcode systems, and sensors. However, these technologies are intrusive to the workers and machines. On the other hand, cameras do not interfere with the daily operations of the workers and machines. More data in the form of visual images can be recorded by the cameras that can also be used by the analysts to check for any irregular activities in the storage areas.
This study proposes an automatic material counting system using computer vision (CV) to decrease the chance of human errors and thus reduce inventory holding and improve production planning accuracy. The system focuses on computer vision technology that can analyze images from video cameras, which is currently a relatively cheap technology. The cameras are installed at the workstation in the production process. The system reduces repetitive work for high-quality workers and allows the organization’s human resources to focus more on value-added activities for the organization. The significant contributions of this study are as follows:
1) The proposed CV system can detect metal sheet picks and automatically records the pick information into a data file.
2) The proposed CV system is able to distinguish the storage area that is being picked from.
3) The proposed CV system demonstrates the benefits of using CV in industrial applications and a framework in applying CV in the industries.
With the advancement of communications and computation technology, electronic devices are better at interacting with other devices, thus leading to more use of modern smart technology, artificial intelligence, and internet of things (IoT) devices in the manufacturing sector [2]. The implementations of these modern technologies in manufacturing companies are the core components of the Industry 4.0 concept. Data is collected from various sources such as sensors, cameras, industrial machines, smart devices, social media, and business transactions. A large number of available data (big data) accelerated artificial intelligence development such as computer vision algorithms that allow computers to detect objects with higher speed and accuracy. But due to a large amount of data and a variety of data formats, it is difficult for humans to manually analyze them. This has resulted in the acceleration of the development of Artificial Intelligence (AI) technology to support such analytics that can analyze big data quickly and extract knowledge that is otherwise difficult for humans to do so. Many studies demonstrate the implementation of AI in the manufacturing industry. For example, Shao et al. [3] developed a time series classification model based on a convolutional neural network for fault detection and product identification from sensors in the process of building a smart factory.
Computer vision technology is a branch of artificial intelligence that trains computers to understand and respond to information in a visual form such as digital image data from cameras. The strength of computer vision technology is its flexibility over sensors because camera images or videos can be analyzed for a variety of purposes such as material counting, material quality checking, people counting, and face detection. Most sensors are designed for specific applications, therefore require complicated processes of integration with other devices to work in a specific application system. Cameras are mostly already installed in the work area and require very little setup compared to sensors. A camera is installed independently from other devices in the production line, unlike a sensor which is a part of the production system and is more complicated to work with and can affect other devices in the same production system. Most sensors used for material counting provide binary data (i.e., count or no count). But if the recorded data from the sensors do not match the amount of material in the facility, the analyst is unable to find the root cause of the discrepancy. A camera can capture the videos for the analyst to check for any abnormalities that may have caused the discrepancy. There are various computer vision models used for specific tasks, the most popular task being object detection. Liu et al. [4] propose a Holistically-Nested edge detection and adaptive Canny fusion model to detect objects. As the computation power of modern computers increases, computer vision models implementing deep learning are becoming more popular. Balarammurthy et al. [5] developed a deep learning-based object detection model to detect pedestrians.
Many industries have leveraged computer vision to improve operations, improve the consumer experience, reduce costs, and increase safety. Kakani et al. [6] explore use cases of computer vision in helping farmers in the agricultural industry. Taheri-Garavand et al. [7] survey computer vision methods that facilitate food grading and quality inspection in the food processing industry. Galata et al. [8] discuss the effective application of computer vision in the pharmaceutical industry. Martinez et al. [9] review the latest developments in computer vision applications in the construction industry. Computer vision technology can also be used to detect defective goods or products in real time. As each product is produced off the production line, a computer processes the images and detects abnormal patterns in each product. This capability can be achieved even with very small materials [10]. In addition, Li et al. [11] use computer vision to detect anomalies such as stains and scratches on mobile phone screens. Ji et al. [12] proposed a method of using computer vision technology to time study by testing it in a simulated manufacturing environment. A common process in most industries that can benefit greatly from applying computer vision is the counting process. Many researchers have applied computer vision in counting objects in various industries. Lins et al. [13] develop a software to automate the counting and classification of aphids to evaluate and predict crop damage from the insects. Franca Albuquerque et al. [14] and Duan et al. [15] utilize computer vision to count fishes and fish eggs, respectively. Yang et al. [16] develop a computer vision-based counting model for steel pipes in the construction industry using YOLOv3 object detection model. Massarelli et al. [17] develop a computer vision system to count and classify microplastics. Using computer vision for the counting process in the industries has been gaining popularity in recent years and our study aims to contribute to the research field by demonstrating a computer vision-based counting system for a metal sheet picking process.
The proposed computer vision system in this study monitors certain conditions so that the computer vision system can perform detection. This section describes the framework of the computer vision system and the detail of the proposed system.
3.1 Framework of the Proposed Counting System
A computer vision model is developed to automatically count the number of workpieces from a video. The framework is based on a Manufacturing-oriented CV system by Zhou et al. [18] as illustrated in Fig. 1. A camera captures a series of images (video) of the storage areas and sends them to a computer to process the images with the proposed CV algorithms. The CV algorithms used in this study are object detection, glare detection, and optical character recognition algorithms. Each of the CV algorithms is explained in the following sections. Outputs from the CV algorithms are then used by the proposed counting system to determine if a workpiece movement has been detected and the counting system automatically updates the records of the number of workpieces. These two steps are collectively referred to as the CV system and are the extension of the aforementioned Manufacturing-oriented CV system framework. The recorded number of workpieces is then sent to the production planning and inventory control department for further planning and analysis. With accurate information on the inventory levels, planners can perform more accurate production planning and optimization.
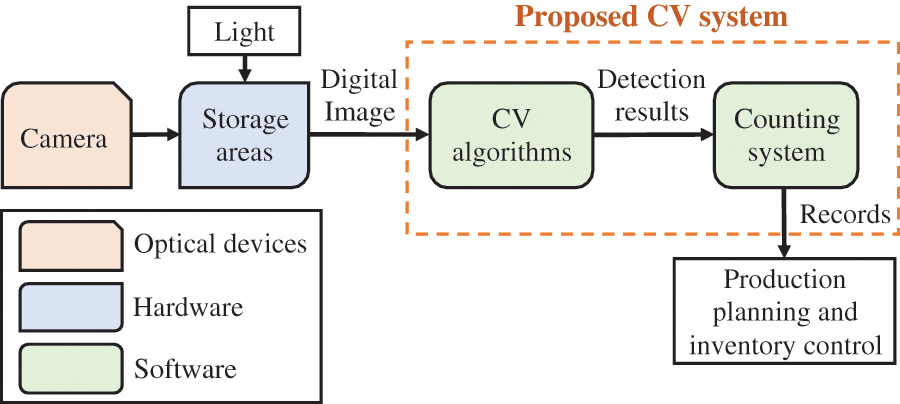
Figure 1: Computer vision system framework of the proposed CV system for counting
Equipment used in this study includes an optical device, i.e., a surveillance camera, and a computer. In general, a camera with higher specifications can capture more pixels in a frame, and therefore, provides more information to the CV system. However, the camera cost is higher and high-resolution videos require more computational power. The camera must be set up in a position that can capture the target storage areas and their surroundings. It is recommended that the operation is recorded from the top view so that the camera can capture most of the relevant motions and objects. If one camera cannot capture all the motions and objects related to the operation, additional camera(s) may be needed. This study tests the proposed CV system with only one surveillance camera as it can adequately capture all relevant information about the target storage areas. Specification of the computer required depends on the type of machine learning tools that are implemented. For example, an object detection model generally requires high computational power. If the CV system uses an object detection model, a computer with a graphics processing unit (GPU) may be needed to process the video [19]. A computer with higher specifications can process videos faster, and potentially in real time. The CV system takes digital images captured through the sensing module as inputs and gives detected features and descriptions of the images as outputs. CV algorithms that can be applied in the proposed CV system are feature detection, recognition, segmentation, and 3-D modeling. Detection results of these CV algorithms are then processed by the counting system that automatically updates the records of the number of materials based on pre-defined conditions. The flowchart of the proposed CV system is shown in Fig. 7 at the end of the methodology section.
The storage area used to demonstrate the proposed CV system is a metal sheet picking area at a commercial refrigerator manufacturer. The video recording process follows the Personal Data Protection Act B.E. 2019 of Thailand. There is no sensitive personal data from individuals included in the analysis. The steps of the metal sheet picking process are shown in Fig. 2. The metal sheet picking process consists of the following steps:
1. Two operators walk to the metal sheet storage area with a cart.
2. The operators pick up the sheet from the storage area.
3. The operators place the sheet onto the cart.
4. The operators leave the storage area with the cart.
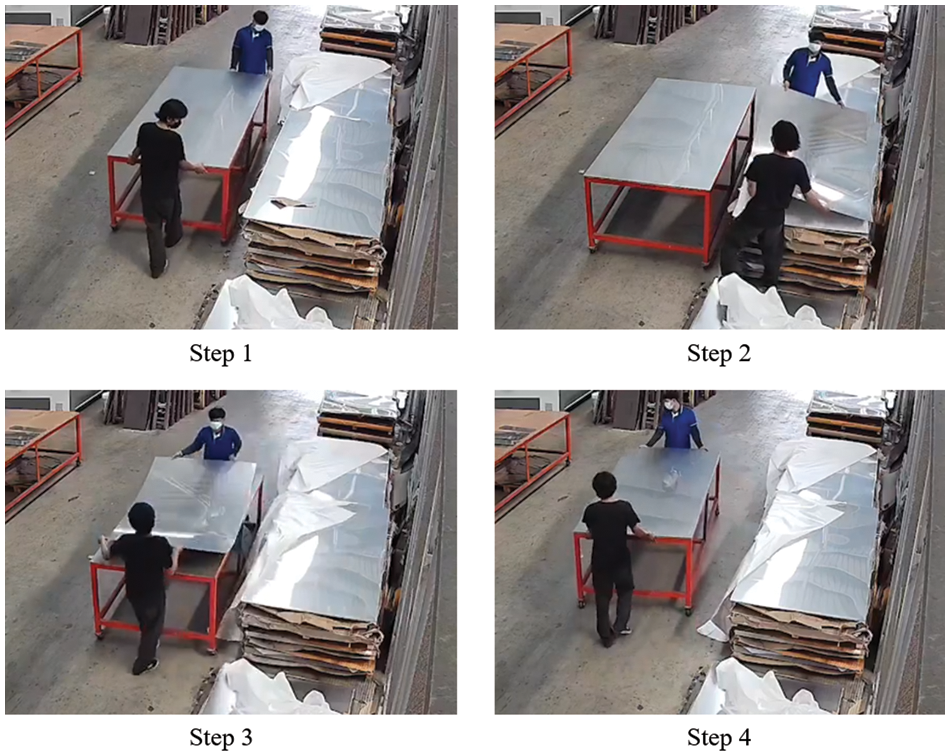
Figure 2: The steps in the metal sheet picking operation
The metal sheets are lifted and placed on a cart one sheet at a time from the storage area. That is, steps 2 and 3 are repeated as many times as the number of metal sheet picks. The condition to detect metal sheet picking must be clearly defined in the developed computer vision model. Therefore, the condition for when the metal sheet pick is detected and counted is based on the condition in step 3, when the operators place the metal sheet onto the cart. Once a pick is detected, the model detects that a metal sheet has been moved from the storage area.
The first step is to define the storage areas. Polygons are drawn by the OpenCV library [20] so that the location where the metal sheet is picked can be known. OpenCV is a popular open-source computer vision software library that is easy to use and has a huge community of developers. Many research papers have used OpenCV to perform image processing in their works [21–24] and, therefore, also used in this study. This step is manually performed by the CV system developer only one time. A periodic check might be required in the case that the camera might have been slightly moved. There are four storage areas defined in this study, as shown in Fig. 3.
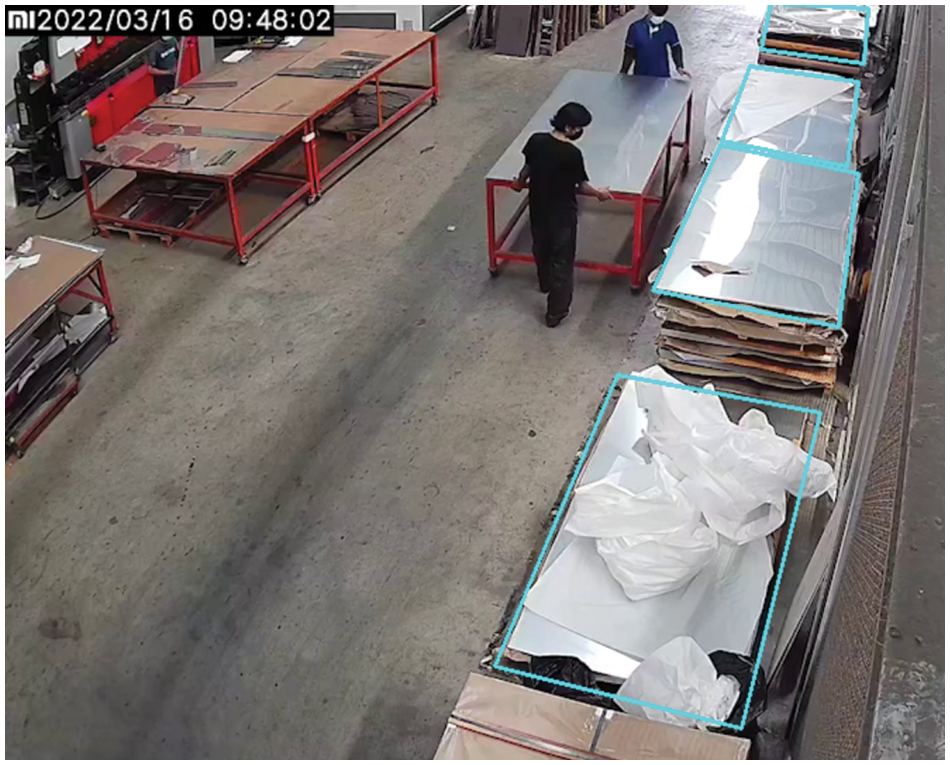
Figure 3: The metal sheet storage areas defined by the CV system developer
A pick can occur only if a cart has been detected and parked beside one of the storage areas. Therefore, a cart detection model is needed. We collected video feeds from the surveillance camera and randomly selected 100 frames for the cart detection model. All the images are annotated via the labelImg graphical image annotation tool [25]. 80 images were set aside for training and the remaining 20 for validation.
The developed cart detection model uses the TensorFlow framework [26] that features the transfer learning approach [27]. We fine-tuned a Single Shot Detector (SSD) model with MobileNetV2 as the backbone [28]. We trained the model using TensorFlow Object Detection API. We used 320 × 320 size input for our model and trained the model for 5,000 iterations. The optimizer used in the model training is a Gradient Descent with Momentum optimizer. The parameters were configured to learning rate lr = 0.08 with decay factor ρ = 0.997. These parameters are recommended by the TensorFlow Object Detection API and, therefore, used during the training on the customized dataset. After training, the final results achieved were mean Average Precision (????????????)@.50 Intersect over Union (IOU) = 0.95 and ????????????@0.75 IOU = 0.80.
Once a cart has been detected, the algorithm checks if the cart is parked. The cart detection model outputs the coordinates of the bounding box around the cart. The center of the bounding box can then simply be calculated. A set of 50 center points from 50 latest frames is stored and the average values of x and y coordinates are calculated. The next 50 frames are then stored in a new set and the average values of x and y coordinates are calculated in the same manner. The average coordinates are then compared with the previous set using the Euclidean distance formula as shown in Eq. (1). Other types of distance calculation methods such as cosine similarity [29] can be used but, in this case, the magnitude of the vectors and angle between the vectors are inconsequential. Only the length of the line between the center of the cart and the storage areas are relevant in this case and, therefore, the Euclidean distance is appropriate.
where
If the distance is lower than a threshold, then the algorithm classifies that the cart has stopped moving and is now parked. The suitable threshold value and the number of frames in a set will depend on several factors, such as video resolution, the distance between the cart and the camera, and the video’s framerate. A larger number of frames in a set and threshold value will make the system more robust to small movement of the cart, but too high values can result in the system classifying that the cart never parks. On the contrary, too small values can result in the system classifying that the cart always parks. Testing is, therefore, required to find the suitable threshold value and number of frames per set. Once the cart is parked, the distance between the center of the cart’s bounding box and all the storage area polygons is calculated. The storage area that has the shortest distance from the cart is classified as the storage area being picked. A demonstration of this concept is shown in Fig. 4. The area with an orange center is the closest to the cart’s center, therefore, it is classified as the area currently picked from.
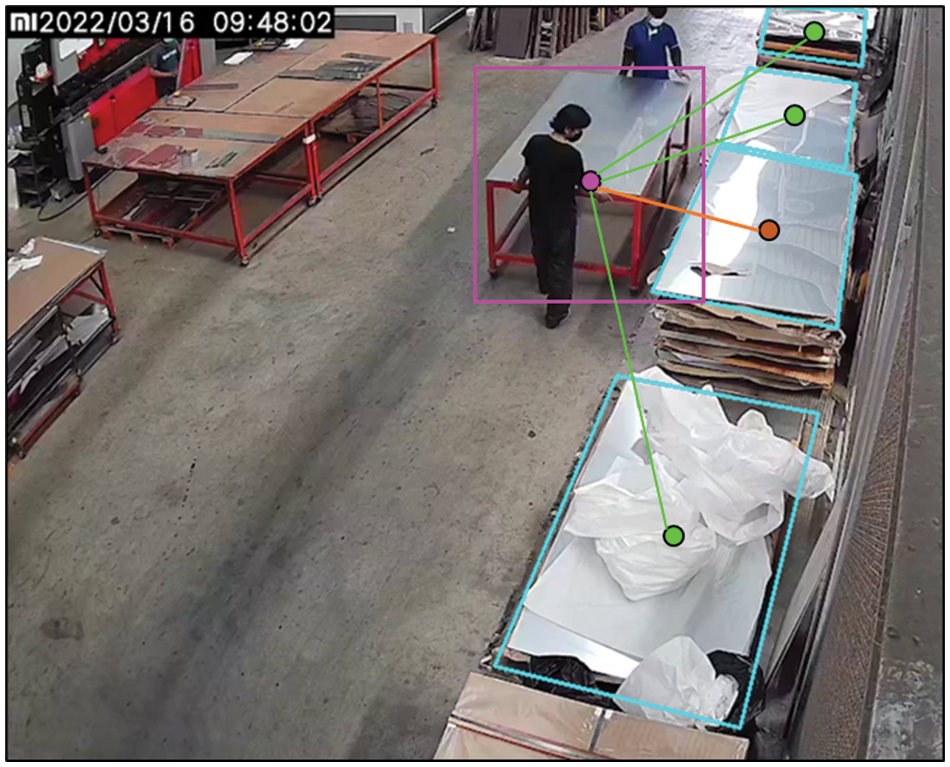
Figure 4: Demonstration of cart detection and finding the storage area being picked from
Metal sheets are difficult to detect by standard object detection algorithms, especially when the sheets are far away from the camera. The color of a metal sheet is almost identical to the sheets underneath it, therefore it difficult to detect a metal sheet’s movement using a standard object detection algorithm. We propose an algorithm that classifies a pick when glares are detected. The algorithm monitors the surface of the cart when the cart has been classified as being parked. When a pick occurs, the picked metal sheet would reflect bright light from its surface and causes glares when it is carried onto the cart. Therefore, pixel values on the cart surface become more intensified during the pick. A thresholding operation from the OpenCV library is used to detect an object based on the range of pixel values in the Hue Saturation Value (HSV) color space [30]. Different range values are tested and the values that best represent the glares are used in the system. For other applications, the range values may be different and must be tested to find the appropriate values that yield satisfactory results. The range values used in this study are:
Lower H = 0° Higher H = 360°
Lower S = 0 Higher S = 0.14
Lower V = 0.98 Higher V = 1.00
Once the area of the cart’s surface has been processed by the thresholding operation, the pixels that fall into the specified ranges are counted (see Fig. 5). If the number of pixels counted exceeds a certain threshold, the system classifies that the metal sheet has been picked as a glare has been detected. The suitable pixel count threshold depends on various factors, such as video resolution, the distance between the cart and camera, and lighting around the storage area. In this study, the pixel count threshold of 200 pixels is used. For other applications, the pixel count threshold value may be different and must be tested to find the appropriate values that yield satisfactory results.
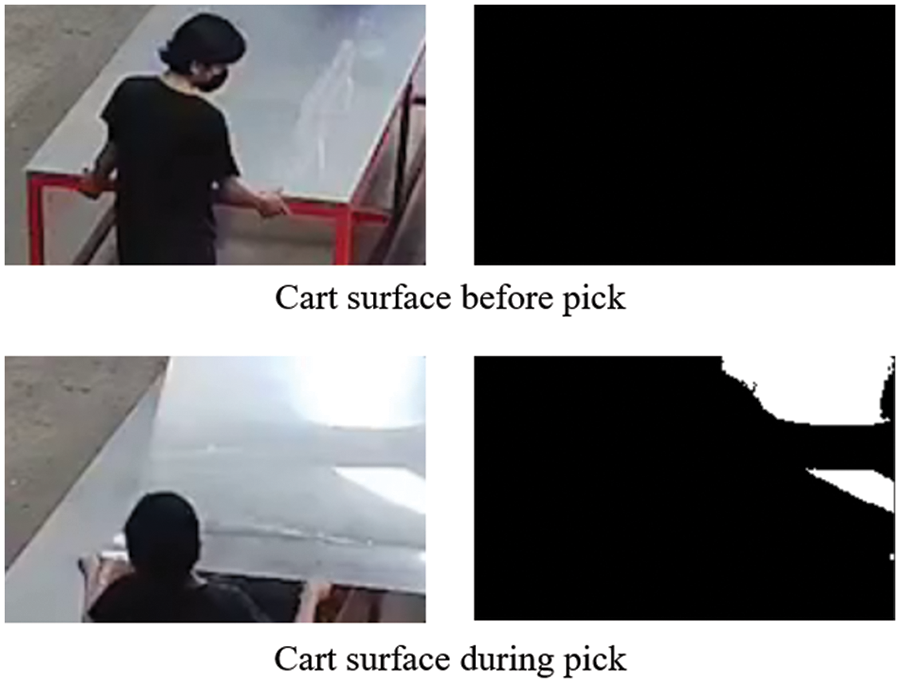
Figure 5: Pixels with their values within the defined range are activated and shown in white color
Once the system detects a pick, the date and time of the pick are recorded. The system uses Optical character recognition (OCR) to read the time stamp on the video frame received from the camera to find the date and time when the pick occurred (see Fig. 6). We use a Python package called EasyOCR. The model in the package is based on the study of Shi et al. [31]. The date and time from the OCR model are recorded into a .csv data file along with the information of the storage area that is picked from. The date and time of the picks can be used for various purposes such as for accounting purpose, loss tracking, and production analysis. The date information of the picks can be used to update the number of inventories in the company’s financial statement of the corresponding month. If a material loss has been observed, the time and date information of the picks can be used to help analysts track the loss and identify the people responsible for the material handling. The date and time of the picks can also be used by production planners to identify the traffic of the production floor and plan picking schedules that can streamline the production processes.
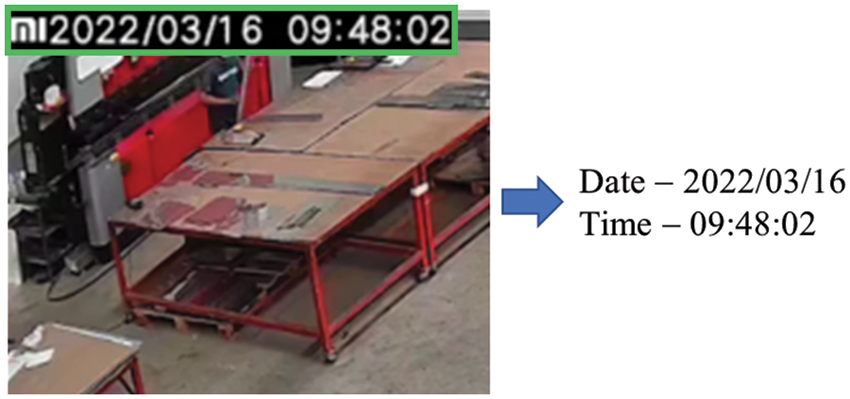
Figure 6: EasyOCR reads the time stamp from the video and converts them to digital text
A comprehensive flowchart of the proposed CV system is summarized in Fig. 7. The system retrieves each frame f from the video and the cart detection model checks if a cart is present and in a parking status. If the cart is parked, the system classifies the storage area is currently being picked from. Then, a glare detection model checks if glare is present on the surface of the cart. If glare is present, the system infers that a pick occurs and records the date, time, and storage area that the metal sheet is picked from into a .csv file. The whole process is repeated for each frame in the video until all frames are processed.
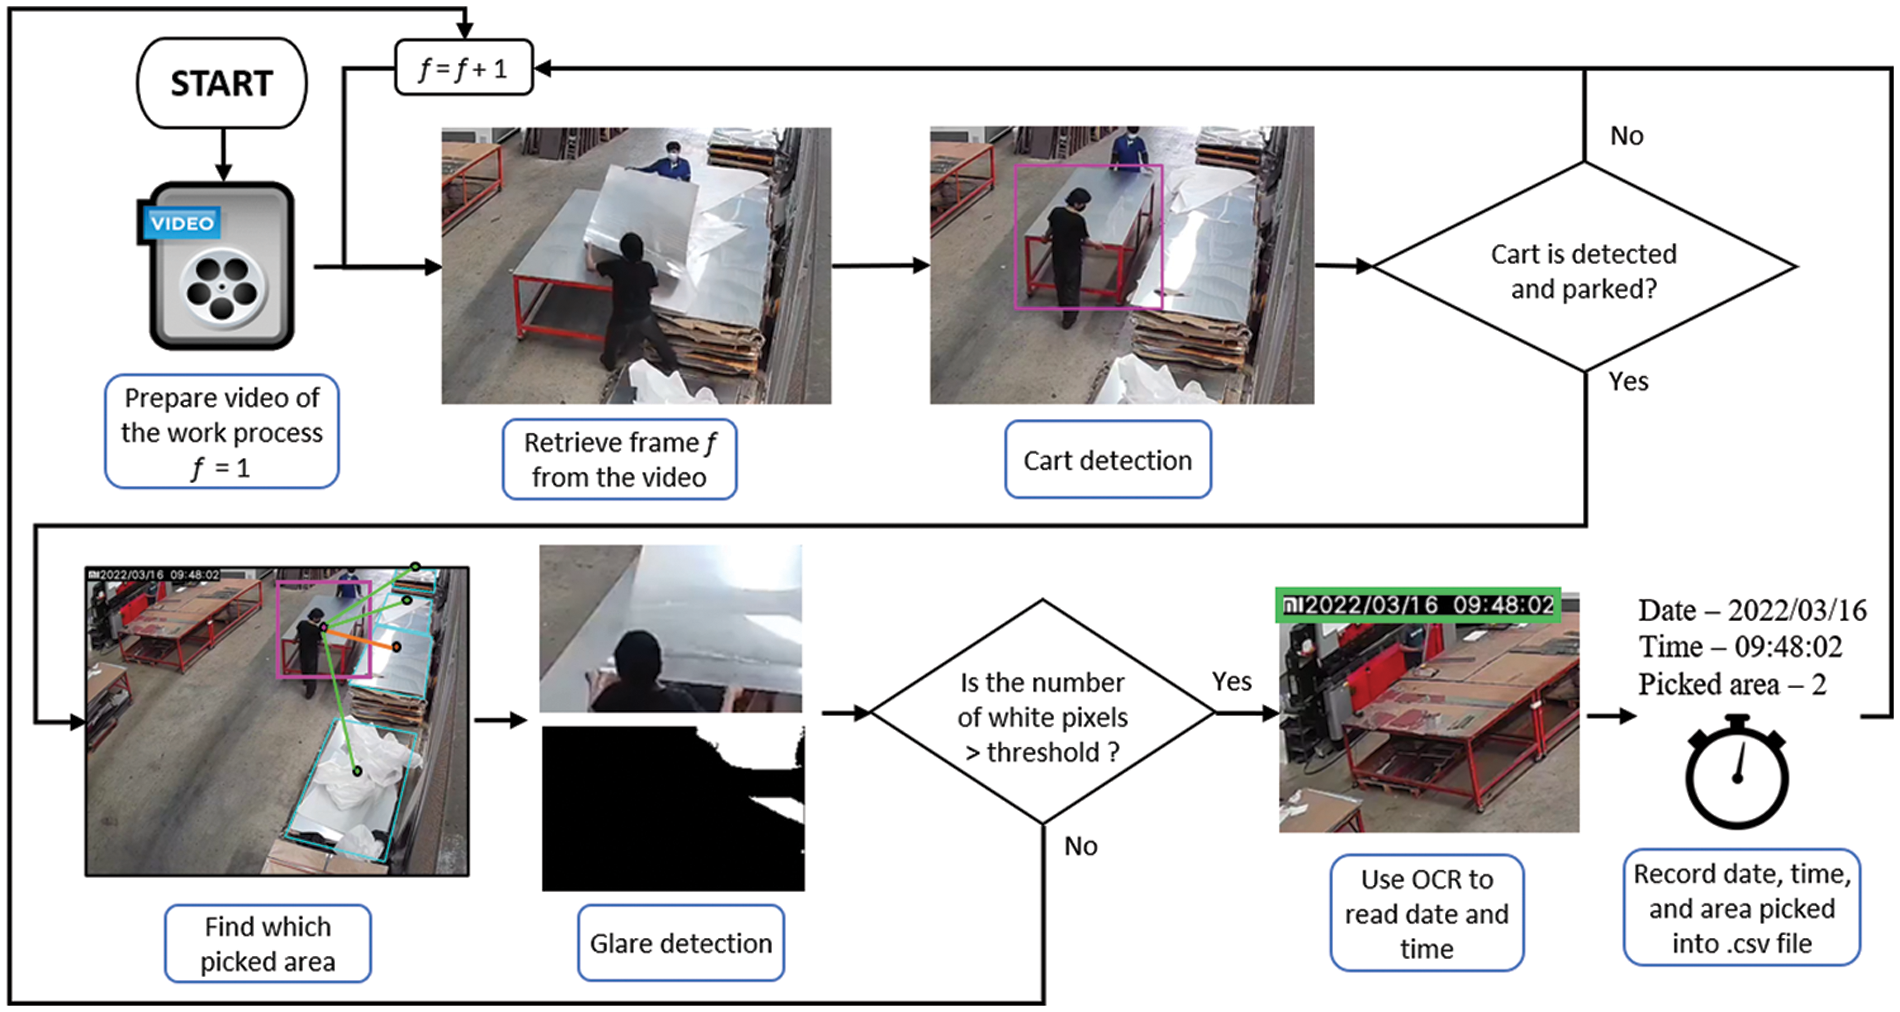
Figure 7: Flowchart of the proposed CV system
The video of the metal sheet picking process is analyzed by the proposed CV system on an Intel Core i7-9700K 3.60 GHz personal computer with 16 GB of RAM and NVIDIA GeForce RTX 2060 SUPER 8 GB GPU. The total video length is 168 h (seven days) and the total computational time is about 112 h (2/3 of the video length).
Two types of outputs are generated from the analysis. The first output is the same as the input video with additional information obtained from the proposed CV system annotated in the video frames. The annotations display the following information: A Boolean value indicating whether the detected cart is parked, the storage area of the metal sheet currently being picked, and the total number of picks in each storage area. Although the annotations are only the display of the output (i.e., not a part of the model’s analysis), the annotations can help with the result verification and debugging process. The annotation can help a human analyst to evaluate whether the proposed CV system is working properly (Fig. 8).

Figure 8: A sample frame of the video output from the model
The second output is .csv data file that contains the date and time when the pick occurred along with the storage area number that the metal sheet is picked from. The .csv data file is automatically generated by the CV system, which makes the process of counting metal sheet picks more convenient and removes the risk of human errors from manual counting and data entry by the analyst. A summary of the output .csv file is shown in Table 1.
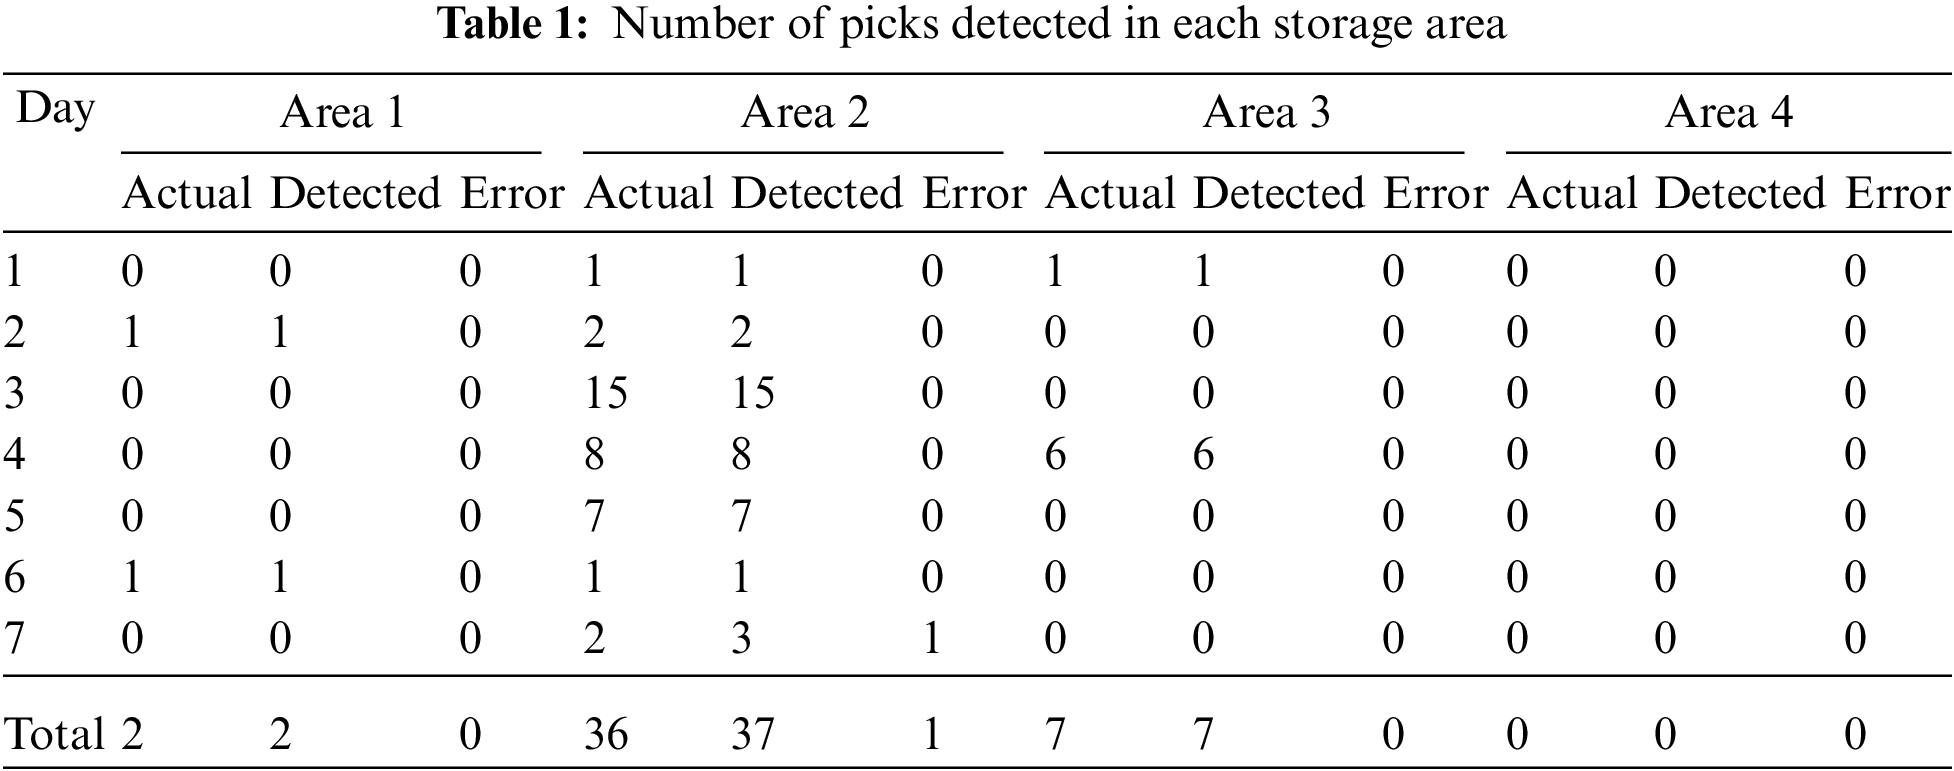
The proposed CV system can simultaneously monitor the picking process in multiple areas with different picking patterns. Area 1 has intermittent picking with one sheet per pick. Area 2 has daily picking. Area 3 has intermittent picking with different volumes. A pick from storage area 4 has not been detected, since the whole cart cannot be seen in the frames during the pick. Another camera may be needed to detect a pick from the storage area 4.
The video contains 45 picks in total from seven different working days. The proposed CV system successfully detected and recorded all of the 45 picks. However, there is a false detection in Area 2 on Day 7. The actual number of picks that occur in Area 2 on Day 7 is 2 picks but 3 picks are recorded because the workers do not follow the standard working procedure as they flip the metal sheet during the pick. This creates a glare on the cart surface that is detected by the pick detection model and recorded. This is an unusual situation that can be solved by emphasizing the standard work procedure as the policy that workers must follow. The results are presented in a confusion matrix shown in Fig. 9. The precision is 97.83% and the recall is 100%.
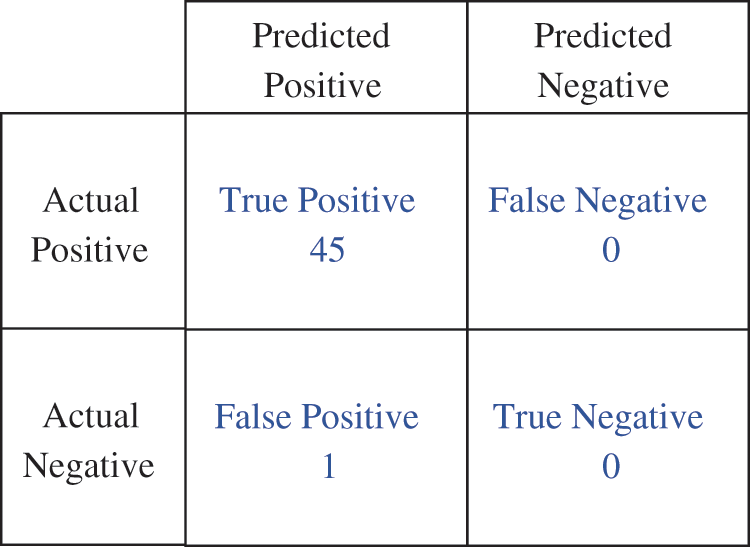
Figure 9: Confusion matrix of the results from the CV system
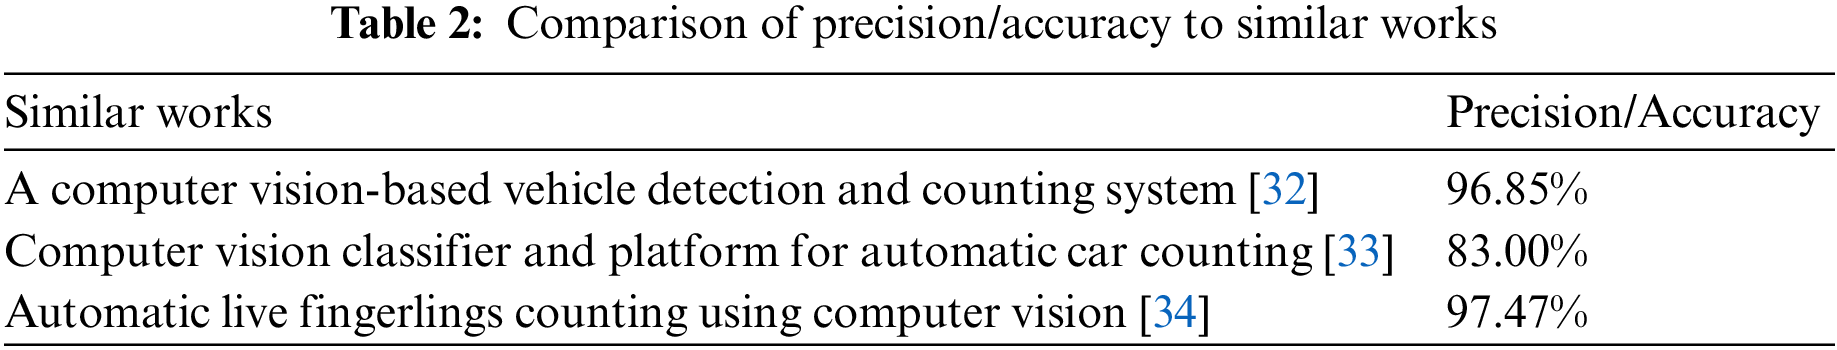
The accuracy of the work cannot be directly compared to other works as there are currently no works or algorithms that can perform metal sheet pick counting. Table 2 shows the comparison of our result to similar applications that utilize computer vision in the counting processes. The precision of our work is 97.83%, which is relatively high compared to similar applications in the field.
In summary, based on the computational time, the system is capable of real time classification and counting as the computational time is approximately 2/3 of the total video length. Since the computational time required to process the video is shorter than the length of the video, processing in real time can be performed. A video feed from the camera has been livestreamed to the computer via the Real Time Streaming Protocol (RTSP) to test the real time processing performance of the proposed CV system. The computer was able to perform the metal sheet pick detection in real time. The accuracy of the proposed CV system in the experiment is very promising as it can detect all picks that present during the seven working days.
Computer vision can potentially help transform manual operations in manufacturing industries. A framework of computer vision-based system that classifies or detects material movement without applying any marker on the material for a counting purpose is proposed in this paper. The use case to demonstrate the system’s capability is the metal sheet picking process for multiple metal sheet stacks in the storage area by using one video camera. Testing results indicate that the proposed CV system can accurately detect all picks based on glare detection from the cart surface and automatically records the storage area where the metal sheet was picked from along with the date and time when the pick occurred. This allows human analysts to focus on other non-tedious tasks and eliminates possible human errors from manually counting and recording the picks. The accurate counting result improves the inventory management system of the company. The inventories required in the company and the cost of material loss from pilferage can be reduced with the improved accuracy of the inventory management system. The inventory control department can use the data file (i.e., .csv file of outputs) generated from the proposed CV system to investigate the status of inventories that have been lost, misplaced, or unaccounted for. The metal sheet picking data generated from the proposed system can be further analyzed and presented to the production planning department in the form of a dashboard to show current inventory levels or integrated with a warehouse management system to automatically update inventory levels in the manufacturing facility. This concept can also be applied to other manufacturing processes sharing the similar type of raw material.
Nevertheless, there are some limitations to this study. The picks in the videos are done in an environment with an abundance of lighting. However, as the pick detections are based on the presence of glares on the metal sheets, different lighting or nighttime conditions may affect the performance of the system. Hence, additional testing may be needed. Additional lighting in the storage area can be installed to provide consistent lighting at all times so that the glares’ intensity is consistent and reduces the chance of pick misclassification. Alternative pick detection method such as detecting the pick based on a specific object detected on the cart’s surface can be explored and compared to the glare detection method. Furthermore, in case that there is no standard working procedure for picking process, some operators may often perform unusual picking movements or poses that can cause false detections. This issue should also be addressed in the future study. In this case study, sensitivity test of the CV system has not been performed. However, in other cases where the changes in camera angle is likely, the impact to the system’s performance when the change happens should be addressed. Markers can be present in the storage areas for the cameras to automatically perform calibration to match the viewing angle similar to how the system has been trained with. Sensitivity test can be discussed in the future work.
Acknowledgement: The authors would like to thank Patana Intercool Co., Ltd. for allowing the research team to conduct the experiments in the company’s production facility.
Funding Statement: This work was jointly supported by the Excellent Research Graduate Scholarship–EreG Scholarship Program Under the Memorandum of Understanding between Thammasat University and National Science and Technology Development Agency (NSTDA), Thailand [No. MOU-CO-2562-8675], and the Center of Excellence in Logistics and Supply Chain System Engineering and Technology (COE LogEn), Sirindhorn International Institute of Technology (SIIT), Thammasat University, Thailand.
Conflicts of Interest: The authors declare that they have no conflicts of interest to report regarding the present study.
References
1. S. Axs
2. A. B. Fakhri, S. L. Mohammed, I. Khan, A. S. Sadiq, B. Alkazemi et al., “Industry 4.0: Architecture and equipment revolution,” Computers, Materials and Continua, vol. 66, no. 2, pp. 1175–1194, 2020. [Google Scholar]
3. X. Shao, C. S. Kim and D. G. Kim, “Accurate multi-scale feature fusion CNN for time series classification in smart factory,” Computers, Materials and Continua, vol. 65, no. 1, pp. 543–561, 2020. [Google Scholar]
4. Y. Liu, Z. Jin and Z. Liu, “An image edge detection algorithm based on genetic fuzzy,” in Proc. of Int. Conf. Sensing, Diagnostics, Prognostics, and Control, SDPC 2017, Shanghai, China, pp. 787–791, 2017. [Google Scholar]
5. C. Balarammurthy, M. F. Hashmi, G. Muhammad and S. A. Alqahtani, “YOLOv2PD: An efficient pedestrian detection algorithm using improved YOLOv2 model,” Computers, Materials and Continua, vol. 69, no. 3, pp. 3015–3031, 2021. [Google Scholar]
6. V. Kakani, V. H. Nguyen, B. P. Kumar, H. Kim and V. R. Pasupuleti, “A critical review on computer vision and artificial intelligence in food industry,” Journal of Agriculture and Food Research, vol. 2, no. 100033, pp. 1–12, 2020. [Google Scholar]
7. A. Taheri-Garavand, S. Fatahi, M. Omid and Y. Makino, “Meat quality evaluation based on computer vision technique: A review,” Meat Science, vol. 156, no. 1–3, pp. 183–195, 2019. [Google Scholar] [PubMed]
8. D. L. Galata, L. A. Meszaros, N. Kallai-Szabo, E. Szabo, H. Pataki et al., “Applications of machine vision in pharmaceutical technology: A review,” European Journal of Pharmaceutical Sciences, vol. 159, no. 105717, pp. 1–24, 2021. [Google Scholar]
9. P. Martinez, M. Al-Hussein and R. Ahmad, “A scientometric analysis and critical review of computer vision applications for construction,” Automation in Construction, vol. 107, no. 102947, pp. 1–17, 2019. [Google Scholar]
10. L. Malburg, M. P. Rieder, R. Seiger, P. Klein and R. Bergmann, “Object detection for smart factory processes by machine learning,” Procedia Computer Science, vol. 184, no. 2019, pp. 581–588, 2021. [Google Scholar]
11. C. Li, X. Zhang, Y. Huang, C. Tang and S. Fatikow, “A novel algorithm for defect extraction and classification of mobile phone screen based on machine vision,” Computer & Industrial Engineering, vol. 146, no. 106530, pp. 1–14, 2020. [Google Scholar]
12. J. Ji, W. Pannakkong and J. Buddhakulsomsiri, “A computer vision-based model for automatic motion time study,” Computers, Materials and Continua, vol. 73, no. 2, pp. 3557–3574, 2022. [Google Scholar]
13. E. A. Lins, J. P. M. Rodriguez, S. I. Scoloski, J. Pivato, M. B. Lima et al., “A method for counting and classifying aphids using computer vision,” Computers and Electronics in Agriculture, vol. 169, no. 105200, pp. 1–14, 2020. [Google Scholar]
14. P. L. Franca Albuquerque, V. Garcia, A. da Silva Oliveira, T. Lewandowski, C. Detweiler et al., “Automatic live fingerlings counting using computer vision,” Computers and Electronics in Agriculture, vol. 167, no. 105015, pp. 1–9, 2019. [Google Scholar]
15. Y. Duan, L. H. Stien, A. Thorsen, O. Karlsen, N. Sandlund et al., “An automatic counting system for transparent pelagic fish eggs based on computer vision,” Aquacultural Engineering, vol. 67, no. 22, pp. 8–13, 2015. [Google Scholar]
16. L. Yang and C. Jun, “Computer vision-based counting model for dense steel pipe on construction sites,” Journal of Construction Engineering and Management, vol. 148, no. 1, pp. 4021178, 2022. [Google Scholar]
17. C. Massarelli, C. Campanale and V. F. Uricchio, “A handy open-source application based on computer vision and machine learning algorithms to count and classify microplastics,” Water, vol. 13, no. 15, pp. 2104, 2021. [Google Scholar]
18. L. Zhou, L. Zhang and N. Konz, “Computer vision techniques in manufacturing,” IEEE Transactions on Systems, Man, and Cybernetics: Systems, vol. 1, pp. 1–13, 2022. [Google Scholar]
19. Y. E. Wang, G. Y. Wei and D. Brooks, “Benchmarking TPU, GPU, and CPU platforms for deep learning,” 2019. [Online]. Available: http://arxiv.org/abs/1907.10701 [Google Scholar]
20. G. Bradski, “The OpenCV library,” Dr Dobb’s Journal of Software Tools, vol. 25, pp. 22–25, 2000. [Google Scholar]
21. P. Nagrath, R. Jain, A. Madan, R. Arora, P. Kataria et al., “SSDMNV2: A real time DNN-based face mask detection system using single shot multibox detector and MobileNetV2,” Sustainable Cities and Society, vol. 66, no. 102692, pp. 1–11, 2021. [Google Scholar]
22. S. Sivkov, L. Novikov, G. Romanova, A. Romanova, D. Vaganov et al., “The algorithm development for operation of a computer vision system via the OpenCV library,” Procedia Computer Science, vol. 169, pp. 662–667, 2020. [Google Scholar]
23. Z. Zhu and Y. Cheng, “Application of attitude tracking algorithm for face recognition based on OpenCV in the intelligent door lock,” Computer Communications, vol. 154, no. 5, pp. 390–397, 2020. [Google Scholar]
24. S. Sandhya, A. Balasundaram and A. Shaik, “Deep learning based face detection and identification of criminal suspects,” Computers, Materials and Continua, vol. 74, no. 2, pp. 2331–2343, 2023. [Google Scholar]
25. T. Lin, “LabelImg,” 2015. [Online]. Available: https://github.com/tzutalin/labelImg [Google Scholar]
26. M. Abadi, A. Agarwal, P. Barham, E. Brevdo, Z. Chen et al., “TensorFlow: Large-scale machine learning on heterogeneous distributed systems,” 2016. [Online]. Available: http://arxiv.org/abs/1603.04467 [Google Scholar]
27. S. J. Pan and Q. Yang, “A survey on transfer learning,” IEEE Transactions on Knowledge and Data Engineering, vol. 22, no. 10, pp. 1345–1359, 2010. [Google Scholar]
28. Y. C. Chiu, C. Y. Tsai, M. D. Ruan, G. Y. Shen and T. T. Lee, “Mobilenet-SSDv2: An improved object detection model for embedded systems,” in Proc. of 2020 Int. Conf. on System Science and Engineering (ICSSE), Kagawa, Japan, pp. 1–5, 2020. [Google Scholar]
29. P. Xia, L. Zhang and F. Li, “Learning similarity with cosine similarity ensemble,” Information Sciences, vol. 307, no. 2, pp. 39–52, 2015. [Google Scholar]
30. D. Li, “HSV color space,” in Encyclopedia of Microfluidics and Nanofluidics. Boston, MA: Springer, pp. 793, 2008. [Google Scholar]
31. B. Shi, X. Bai and C. Yao, “An end-to-end trainable neural network for image-based sequence recognition and its application to scene text recognition,” IEEE Transactions on Pattern Analysis and Machine Intelligence, vol. 39, no. 11, pp. 2298–2304, 2017. [Google Scholar] [PubMed]
32. N. Seenouvong, U. Watchareeruetai, C. Nuthong, K. Khongsomboon and N. Ohnishi, “A computer vision based vehicle detection and counting system,” in Proc. of 2016 8th Int. Conf. on Knowledge and Smart Technology (KST), Chonburi, Thailand, pp. 224–227, 2016. [Google Scholar]
33. F. T. Espinoza, B. G. Gabriel and M. J. Barros, “Computer vision classifier and platform for automatic counting: More than cars,” in Proc. of 2017 IEEE Second Ecuador Technical Chapters Meeting (ETCM), Salinas, Ecuador, pp. 1–6, 2017. [Google Scholar]
34. P. L. F. Albuquerque, V. Garcia, A. S. Oliveira, T. Lewandowski, C. Detweiler et al., “Automatic live fingerlings counting using computer vision,” Computers and Electronics in Agriculture, vol. 167, no. 105015, pp. 1–9, 2019. [Google Scholar]
Cite This Article
 Copyright © 2023 The Author(s). Published by Tech Science Press.
This work is licensed under a Creative Commons Attribution 4.0 International License , which permits unrestricted use, distribution, and reproduction in any medium, provided the original work is properly cited.
 Downloads
 Citation Tools