
 Submit a Paper
 Propose a Special lssue
 Open Access
ARTICLE

A Survey on Stock Market Manipulation Detectors Using Artificial Intelligence
1 Department of Electrical, Electronic and Systems Engineering, Universiti Kebangsaan Malaysia, Bangi, 43600, Malaysia
2 Faculty of Management, Virtual University of Pakistan, 54000, Lahore, Punjab, Pakistan
3 Department of Finance, Faculty of Business and Economics, Universiti Malaya, 50603, Kuala Lumpur, Malaysia
4 Center of Sustainable and Inclusive Development, Universiti Kebangsaan Malaysia, 43600, Selangor, Malaysia
* Corresponding Author: Mohd Asyraf Zulkifley. Email:
Computers, Materials & Continua 2023, 75(2), 4395-4418. https://doi.org/10.32604/cmc.2023.036094
Received 16 September 2022; Accepted 30 December 2022; Issue published 31 March 2023
 View Full Text
 Download PDF
Abstract
A well-managed financial market of stocks, commodities, derivatives, and bonds is crucial to a country’s economic growth. It provides confidence to investors, which encourages the inflow of cash to ensure good market liquidity. However, there will always be a group of traders that aims to manipulate market pricing to negatively influence stock values in their favor. These illegal trading activities are surely prohibited according to the rules and regulations of every country’s stock market. It is the role of regulators to detect and prevent any manipulation cases in order to provide a trading platform that is fair and efficient. However, the complexity of manipulation cases has increased significantly, coupled with high trading volumes, which makes the manual observations of such cases by human operators no longer feasible. As a result, many intelligent systems have been developed by researchers all over the world to automatically detect various types of manipulation cases. Therefore, this review paper aims to comprehensively discuss the state-of-the-art methods that have been developed to detect and recognize stock market manipulation cases. It also provides a concise definition of manipulation taxonomy, including manipulation types and categories, as well as some of the output of early experimental research. In summary, this paper provides a thorough review of the automated methods for detecting stock market manipulation cases.Keywords
A well-regulated financial market is an important foundation for any country that wishes to have a thriving economy. It facilitates effective flows of investments in various forms, including equities, currency exchanges, and bonds between potential sellers and buyers [1]. Some of the roles played by the financial market are to provide liquidity to assets, direct savings to more productive uses, and reduce the cost of transactions. In general, financial markets can be classified into primary and secondary markets [2]. The first category is the market in which securities are created, while the second category is the market in which securities are traded. There are a several types of financial markets, but among them, the stock market is considered the most important market that reflects the health of a country’s economy. Put simply, the stock market is a marketplace in which investors can sell and buy the shares of publicly listed companies and other securities. Even in a small country like Malaysia, there are almost 1000 listed companies on the Bursa Malaysia exchange, which processes millions of transactions every year [3]. Due to the large trading volume, all the buying and selling activities of shares must be regulated to facilitate fair transactions.
A fair stock exchange is very important in order to attract foreign investment that will energize a local economy [4,5]. Apart from that, a fair stock exchange will also ensure the sustainability of the marketplace in which traders will keep buying and selling company shares. It is also the reason the stock exchange of any country embroiled in war will not command the trust of foreign investors. Therefore, it is the role of regulators to come out with a set of rules and impose them effectively so that all transactions are valid and fair. However, there will always be a certain group of traders, who will try to artificially inflate or deflate a stock price for their benefit [6]. These rogue traders aim to disrupt the efficiency of the marketplace by manipulating the fairness of stock prices. These manipulation activities can be executed by a single investor or a group of investors in a collusion scheme. In general, temporary distortions of a stock price will bring profit to manipulators, as they will sell the shares at a relatively higher price or buy shares at a relatively lower price than the fair value. A good systematic review of stock market manipulation can be found in [7], whereby our paper focuses more on the methods and algorithms that are divided into conventional machine learning and deep learning approaches.
In the digital era of stock trading, the size of trading volume per day can exceed more than 1 million transactions, particularly for large stock exchanges such as New York Stock Exchange, London Stock Exchange, and Shanghai Stock Exchange [8]. Therefore, regulators need to be prepared to monitor these transactions effectively and efficiently to spot any irregularities or anomalies that may be caused by manipulation activities. However, due to the large number of transactions, it is not effective to use human operators to skim through all the transactions manually. It is not an effective solution, whereby humans are prone to fatigue when dealing with repetitive tasks, especially in the case of long working hours [9]. Apart from that, the efficiency will also be low and hence motivates the regulators to adopt automation processes. In the early days, multivariate statistical analysis and conventional machine learning methods were used to identify manipulation patterns. Normally, these approaches use a shallow machine learning procedure, in which much of the process requires good pre-processing and feature selection methods [10]. In these crucial steps, a cleaned set of inputs is passed through a popular machine learning classifier or clustering method, depending on the final decision-making task. Apart from that, if the input feature size is too large, it needs to be trimmed through dimensionality reduction methods. In general, detectors that are based on artificial intelligence (AI), specifically deep learning technology have surpassed the average human capability in many fields, including disaster prediction [11], intelligent disease diagnosis systems [12], agriculture yield estimation [13], security alert system [14] and many more. Usually, the deep learning approach, which has gained more traction recently, involves a deeper and more complex network devised to extract the manipulation patterns. This approach usually employs an end-to-end procedure, in which feature selection and decision-making components are linked together, and trained to obtain the optimal set of parameters [15]. A large set of input features is also possible, as such the network performance will typically improve if more training data is supplied. This advancement has also been motivated by the adoption of graphics processing units that enable parallel computation to be performed effectively in processing deep networks.
This review paper is organized into six sections that start with a brief introductory section. Section 2 then provides brief taxonomy of the manipulation cases, followed by Sections 3 and 4 that discuss in detail the previous works on intelligent stock market manipulation detectors using supervised and unsupervised conventional machine learning approaches, respectively. Section 5 discusses the state-of-the-art deep learning approach that mainly applied a recurrent-based network to identify the manipulation cases. Finally, a concise summary of the review findings and a few future work suggestions are provided in the last section. The general flow of this paper is shown in Fig. 1.
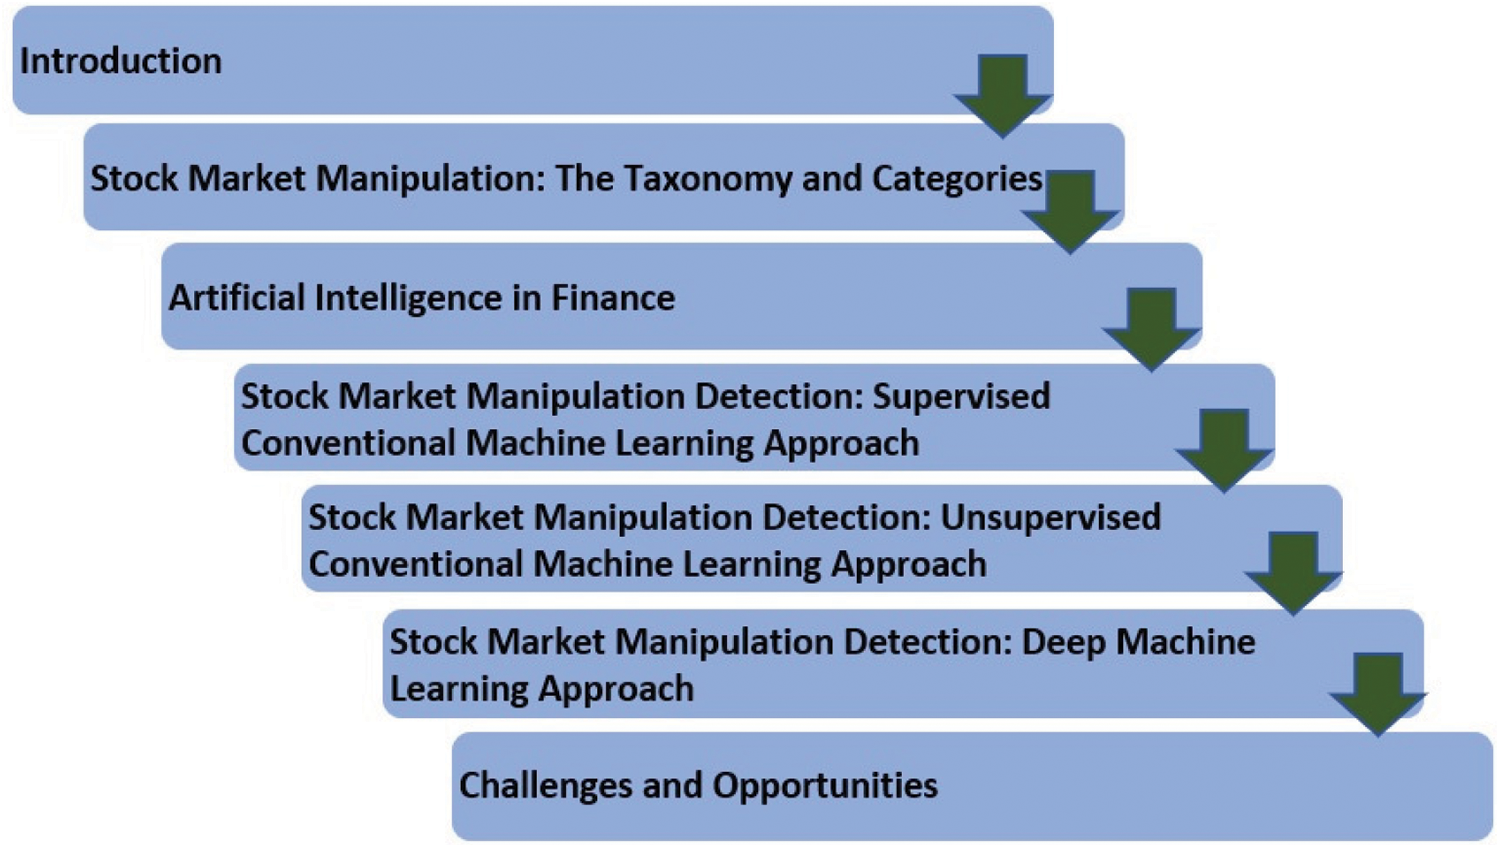
Figure 1: The overall paper structure
2 Stock Market Manipulation: The Taxonomy and Categories
In general, stock market manipulation is defined as an illegal practice that attempts to raise or lower stock prices by masking it as an active trade [16,17]. Nevertheless, there is no universally accepted definition of stock market manipulation due to the unclear legal meanings and inconsistent terms that are used in economics and finance literature. For example, Goldwasser [18] stated that the US Securities and Exchange Act 1934, the Australian Corporations Law, and the European Union (EU) Market Abuse Regulation (MAR) generally forbid market manipulation by providing numerous provisions to prevent it. However, these regulations failed to clearly describe stock market manipulation. He further argued that the role of determining the true definition of manipulation cases has largely shifted towards the definition of a country’s court, which is based on the nature of each case. As per the statutory law of the U.S, it is illegal to sell or purchase stocks via a deceptive or manipulative contrivance or tool.
The Australian statutory law (Corporations Act 2011-Sect 1041A) on the other hand, forbids transactions that include or possibly include the impact of producing fake security prices. Whereas the statutory law of the EU (Regulation [EU] No 596/2014 on market abuse) defines market manipulation as “Entering into a transaction or behavior that gives or is likely to give false or misleading signals as to the supply of/demand for/price of a financial instrument; secures or is likely to secure the price of a financial instrument at an abnormal or artificial level”. In Malaysia, stock market manipulation is defined under Section 176 of the Capital Markets and Services Act (CMSA) 2007 as “the act of transacting in the securities of a company that will have or is likely to have the effect of raising or lowering or maintaining the price of the company’s securities on a stock market, with the intention of inducing other persons to purchase or subscribe for the company’s securities”.
Since statute laws do not consistently describe stock market manipulation, it is also essential to investigate the definition contained in economics and laws literature. By departing from conventional legal interpretations, Fischel et al. [19] claimed that stock market manipulation is an ambiguous term that shapes the foundation of criminal proceedings. They indicated that the absence of an objective definition of manipulation suggests that it can only be described as a deceptive effort to change the prices of stocks. Therefore, they stated that trading should never be forbidden as manipulative; instead, only fictitious trading such as trades where the seller and buyer are the same person, and therefore, dispersing misleading information should be treated as fraudulent. Their rationale was that: 1) it is unlikely that a strictly trade-based manipulation case would succeed and 2) rules prohibiting manipulation may deter legitimate trading.
Contrary to Fischel et al. [19], Thel [20] claimed that it is easy to perform manipulation cases. According to him, any transaction that is carried out with the intention of decreasing or increasing a security’s price can be defined as manipulation. This assumes that manipulators may sometimes control prices through trading and thereby earn profits through pre-existing price-dependent contracts and by forcing other stock market players to execute exchanges at the manipulated market price. Another study by Jarrow [21] defines manipulation as a trading technique that produces real positive wealth at a zero level of risk. Cherian et al. [22], on the other hand, describe manipulation as someone trading in such a way that affects a stock price to their benefit. From a different perspective, Kyle et al. [23] suggested that trading methods can only be categorized as unlawful market manipulations if they impair market efficiency by reducing liquidity and diminishing price accuracies. According to them, a trading technique is not explicitly harmful to society until both requirements are met; thus, it must not be forbidden.
While exploring stock market manipulation in both developed and emerging stock markets, Baker et al. [24] explained that stock market manipulation involves various aspects, such as trading frequency, trading volume, order size, and stock price fraction magnitude. Their argument is further supported by Fox et al. [25] who categorized stock market manipulation into two broad categories: open market or misstatement manipulations. Open market manipulation occurs via fictitious trading, while misstatement manipulation is an information-based manipulation whereby a trader creates a materially false statement to push down a stock price. Both types of manipulations can drive the average sale price to exceed the average purchase price.
Based on the above discussion, this review proposes that the most comprehensive definition of stock market manipulation, covering all of its aspects, is based on the definition of Allen et al. [26]. They divided stock price manipulations into three broad categories namely 1) action-based, 2) information-based and 3) trade-based manipulations, which will be discussed in detail in the following subsections. According to them, action-based manipulation is a situation in which the deliberate action of any party in a stock market affects the value of stocks. Information-based manipulation, on the other hand, involves the spread of rumors or false information in a market to manipulate stock prices. Finally, trade-based or trading-induced manipulation involves artificial increments or decrements in stock prices through fictitious trading by stock market intermediaries. Fig. 2 shows the main categories of stock market manipulation, especially for trade-based schemes.
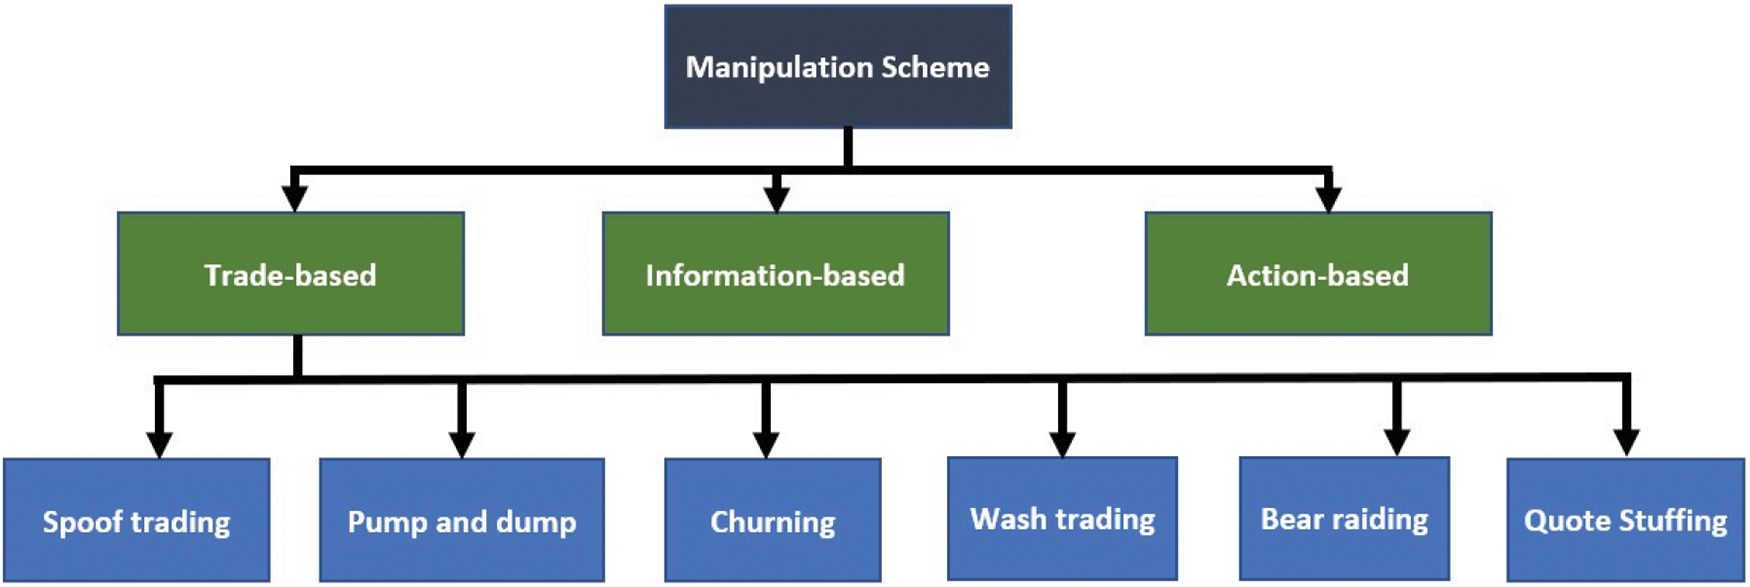
Figure 2: The main categories of stock market manipulation schemes
2.1 Action-based Manipulation Scheme
Action-based manipulation occurs when someone acts or takes any action with the intention of influencing the movement of stock prices. For example, a company’s director may close a company branch to drive down the stock price. Although action-based manipulation has not been explicitly examined in the prior literature, it can also be treated as a form of information-based manipulation if the manipulator’s actions produce a fake impression, which is identical to fake information. Therefore, many of the results surrounding information-based manipulations are also applicable to action-based manipulations.
2.2 Information-based Manipulation Scheme
As discussed earlier, information-based manipulation refers to any type of manipulation through the spreading of deceitful information or statements with the intention of manipulating stock prices. Many studies have explored this type of manipulation. For example, Vila [27] employed game theory to create a simple case in which manipulators short-sell a stock by releasing false and harmful stock-related information and then recovered their position when the price was low. Similarly, Bagnoli et al. [28] examined a framework in which manipulators announced a fake takeover bid to push up a stock price. The effectiveness of both strategies depends on the integrity of the information disseminated by manipulators. If market participants recognize fake information in repeated trials of such games, then the manipulators will soon be debunked, and their manipulation technique will no longer be lucrative.
To address the credibility issue in recurring games, Benabou et al. [29] and Bommel [30] proposed a framework that incorporates inaccurate information to impact a share price. In Benabou et al. model [29], noisy insider information limits the capacity of investors to confirm the validity of available information. Thus, manipulators, such as company executives with insider information, stock analysts, or journalists may influence a market price over a prolonged span of time without sacrificing credibility by combining true facts with false information in a piece of evidence that they issue. From a different perspective, Bommel [30] developed a framework in which informed investors regulate stock prices by disseminating inaccurate rumors. Rumors are insightful in an equilibrium state; thus, leading rational profit-maximizing players to trade based on them. Since rumors are unreliable, stock markets sometimes overshoot, which enables informed manipulators to make gains not only from their own superior information but also by trading based on the overshoot prices of the market. Likewise, Eren et al. [31] applied Bommel’s framework to demonstrate that a hype-and-dump form of exploitation enhances market trading volume and depth but reduces the efficiency of markets.
2.3 Trade-based Manipulation Scheme
Trade-based or trading-induced manipulation is another type of manipulation that is more difficult to detect, and it is the focus of this review. Trade-based manipulation involves an artificial increment or decrement of stock prices through fictitious trading by traders or stock market intermediaries [32]. The most popular form of this manipulation scheme is “pump & dump” which is mainly prevalent in emerging stock markets. In a pump & dump manipulation scheme, manipulators take a long position in stocks, inflate stock prices by increasing the liquidity of traded stocks, and finally reverse their position at an inflated price to gain huge profits. The pumping period of stocks can take a few hours to many years, during which several manipulators can adopt additional techniques, such as wash sales and pooling of stocks [33].
Another form of trade-induced manipulation is dump-and-pump, also known as “bear raids”. This involves manipulators selling or short-selling stocks and driving prices downward by forcing others to sell and finally cover their positions again at depressed prices. A common characteristic of pump & dump manipulation is that manipulators profit directly from market manipulation by exploiting investors who purchase stocks at higher prices and later sell them at reduced prices. Market manipulation is a worldwide phenomenon incurred in both developed as well as developing markets. Aggarwal et al. [34] examined the pump & dump cases of manipulation collected from the US Securities and Exchange Commission (SEC) litigation releases using daily data. They highlighted 142 cases of manipulation and acquired the data of 51 manipulation cases over the period from 1990 to 2001. From their observations, the minimum manipulation duration is 2 days, the median duration is 202 days, and the maximum duration is 373 days, showing the varying characteristics of pump & dump manipulations. They reported that stock prices generally rise during the manipulation period and decrease during the post-manipulation period, which also increases stock price volatility. Their sample manipulation cases involved mostly illiquid stocks, while most of the manipulations were conducted by informed insider traders such as substantial shareholders, management, and brokers or market-makers.
Comerton-Forde et al. [35] conducted a study based on a sample of 184 cases of closing stock price manipulation that were highlighted by the SEC over the period between 1997 and 2009. Based on their sample, the manipulation was mainly conducted by brokers, a company’s top management, substantial shareholders, and fund managers. They revealed that cases of closing stock price manipulations were primarily linked to large hikes in day-end profits, large trading volumes, wider spreads, and subsequent reversals of returns. On the basis of these results, they built a closing stock price manipulation index that can examine manipulations in multiple markets at various times of interest for which prosecution data is not available.
Leuz et al. [36] examined 421 cases of the pump & dump manipulations over the period 2002 to 2015 and provided evidence on the participation rate, size of investment, average losses, and characteristics of those who took part in these schemes. Their results suggest that the participation of individual investors is quite common in these manipulation schemes, which involve an average loss of about 30% for such investors. Moreover, the study highlighted several categories of investors who intentionally take part in these manipulation schemes based on their superior information. The existing literature also shows that emerging markets are particularly vulnerable to manipulative tactics. There is an abundance of manipulation cases in Asian stock markets. The pump & dump strategy is considered a common manipulation tactic in the Indian stock market. But, the absence of a strong regulatory framework in such markets indicates that most of these manipulative tactics are hard to capture, and thus, there is relatively limited empirical evidence about them. The impact of pump & dump manipulations has been captured in rare empirical research by Bommel [30]. They revealed that in the Pakistani stock market, when brokers traded on their own behalf, they collected about 50% to 90% higher earnings compared to retail investors. They further asserted that brokers had achieved these higher earning differentials through “pump & dump” manipulative schemes.
Huang et al. [37] observed that due to insufficient regulation, ineffective monitoring, and institutional flaws, the Taiwanese equity market was plagued by market manipulation, insider trading, IPO fraud, and other stock irregularities. This paved the way for the trading of power money (trust money) and attracted prospective criminals, who then defrauded most retail investors. In a similar vein, Wirama et al. [38] examined incidents of market manipulation in the Indonesian stock market. They revealed that traders purposefully spread rumors about the market to draw in customers. Market makers can affect stock prices by posting unfounded information if they have more cash and greater access to media and information. Initially, the rumors create significant anomalous returns for the manipulators, but over time, the effectiveness of manipulation falls. Similarly, Kan [39] highlighted numerous incidents of stock market manipulation in the Malaysian equity market and narrated the salient features of these manipulations. The study analyzed 33 cases of stock market manipulations between 2005 and 2015 and concluded that these manipulations were mainly conducted by those in privileged positions with easy access to information. Moreover, greed, dishonesty, self-interest, and ethical failure were found to be the prominent reasons for stock market manipulations. Overall, price manipulation by several stock market intermediaries is detrimental to the increase in market capitalization as individual investors are reluctant to invest in these markets.
2.4 Early Experimental Researches on Stock Market Manipulation
Through an unconventional field experiment, Hanson et al. [40] carried out a seminal laboratory experiment on stock price manipulations. It involved twelve investors who transacted cash and stock in a digital limit orders stock exchange. Half of the investors were offered cash rewards during the manipulation experiment to influence stock prices during trading. Their key result suggests that the manipulators were unable to distort price accuracy, as their actions were counteracted by other traders. In an identical experimental market study, Comerton-Forde et al. [41] demonstrated that if investors are granted rewards to manipulate closing prices, both the liquidity and price accuracy of a market will be affected. These findings indicate that incentives are low likelihood key determinants in instigating manipulated trading.
It is important to investigate how market manipulation affects liquidity and market efficiency. While numerous prior studies have investigated prosecuted manipulation instances to evaluate the ex-post impact of market manipulation, the findings conclude that it is hard and challenging to predict the likelihood of someone manipulating a stock market. Will the likelihood or possibility of manipulation deter the participation of investors in stock markets, thus making a market less efficient and less liquid? Or does a stock market become efficient due to investors becoming better informed? The challenge arises from the absence of a counterfactual manipulation-free market in the real world to serve as the comparison standard. Many of the drawbacks of empirical approaches can be solved by experimental research because an experimenter can monitor and regulate information, as well as reward and punish fundamental asset values. At the same time, an experimenter is also able to resolve the problems created by the inadequate rate of manipulation detection and identification. In this case, the key advantage of this opportunity is the ability to design the experimental environment in a reasonably realistic manner such that the findings are scientifically relevant and provide real markets with meaningful insights. Despite this, experimental research is more successful compared to empirical research, but it is underutilized in enhancing knowledge about market manipulation.
In summary, the concept of market manipulation encompasses a wide range of frequently varying tactics that typically include the intention of producing a false appearance of a security’s price or trading operation. As technology becomes more advanced, experimental research to detect manipulation cases can now utilize more advanced techniques such as complex data analytic methods [42,43]. However, advanced data analytics and artificial intelligence-based strategies for trading behavior analysis have not yet been extensively reviewed. Therefore, this review will fill the gap in the literature and attempt to analyze the state-of-the-art techniques for detecting manipulation cases through conventional and deep machine learning approaches. Fig. 3 shows the standard algorithm workflow for both conventional machine learning and deep learning approaches.
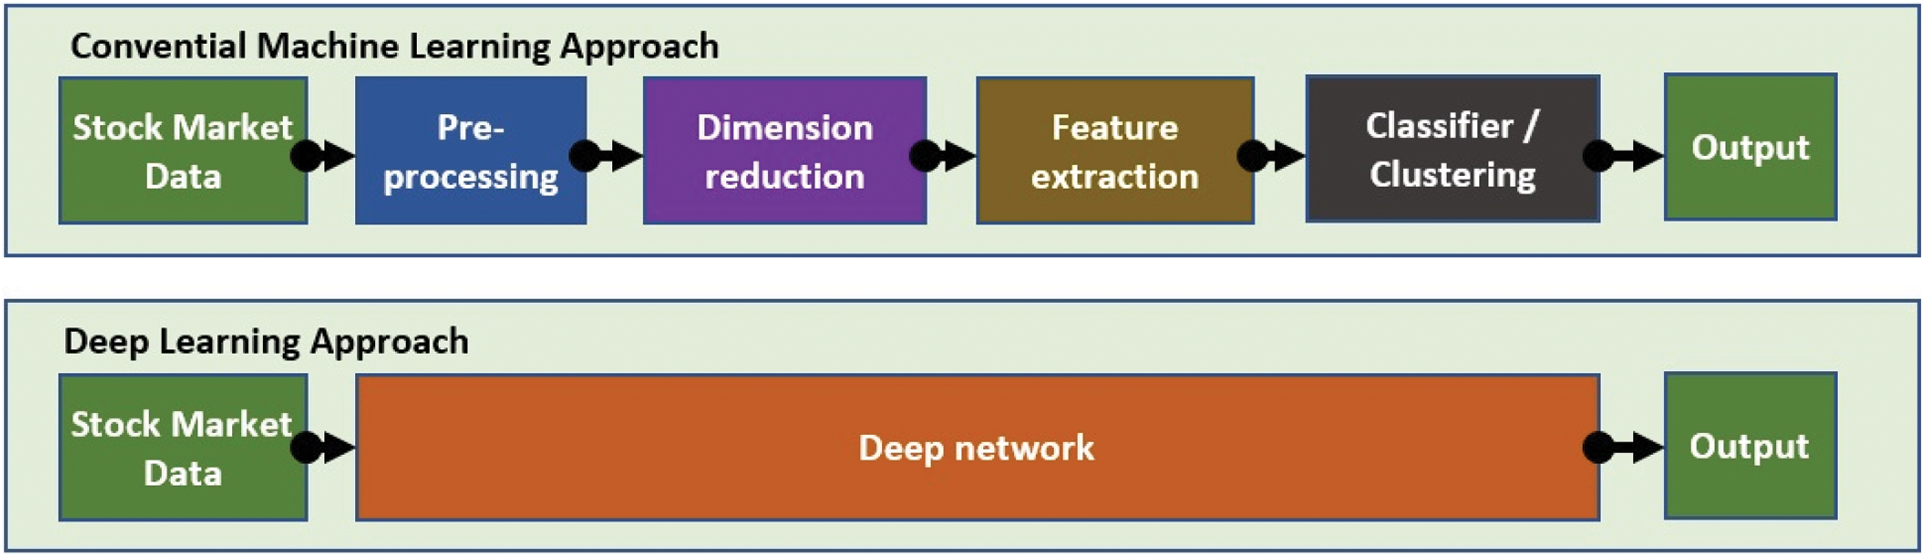
Figure 3: The standard algorithm workflow for both conventional and deep learning approaches
3 Artificial Intelligence in Finance
Many financial firms with more than 5000 employees have implemented basic AI, mainly to predict revenues and detect anomalous transactions [44]. Some of the financial sectors such as online banking, market analysis, property management, corporate finance, and insurance have used advanced AI in managing their operations. In [45], Rong et al. analyzed product reviews on an e-commerce platform using sentiment analysis. The authors used the reviewed texts as input features, which were then converted into word vectors before passing them to a compact CNN model. The model consisted of one convolutional layer and three fully connected layers. A flatten operator was used to map 2-dimensional feature maps into 1-dimensional feature vectors for classification purposes. Using a similar CNN model, Zhu et al. [46] analyzed consumer credit scores for the Chinese financial market. The time-series input was transformed into a 2-dimensional matrix, which will be the input to two convolutional layers networks. The classification layers derived flattened vector input from the convolutional layers, which are embedded with DropOut units to reduce the likelihood of overfitting. Muranda et al. [47] faced a challenge in balancing the amount of data among the classes for their fraudulent insurance claim detector. They aimed to detect fraudulent claims, which in general have a low likelihood of occurring, and hence, they need to augment the training data to better fit the proposed model. They implemented two approaches of over-sampling, which are synthetic minority oversampling and adaptive synthetic techniques. They found out that the proposed sampling methods managed to train the neural network model with 100% accuracy. Generative adversarial network (GAN) was also used in financial-based prediction, especially for forecasting the price. The research by Hsieh et al. [48] stated that they used long short-term memory (LSTM), arranged in GAN format to predict the sale of houses in the USA. They used basic house information that includes floor areas, number of rooms, age of the house, and localization as the input to single- and two-layer LSTM networks.
Rather than using house specifications as the only input, the work in [49] utilized additional text descriptions of the houses to predict the best rental price. They explored the basic unit of LSTM, bi-directional LSTM, and self-attention network in processing all input data. The house location is clustered first to group them into general classes, which will be combined with the text-based descriptors to determine the optimal rental price. A gated recurrent unit (GRU) was also used to map the time-series patterns for the finance applications, instead of LSTM. In [50], GRU becomes the backbone used to optimize the policy for financial portfolio management. The stacked GRU was modeled using deep reinforcement learning by providing a set of rewards and punishments that optimized the proposed portfolio goals. The network policy was trained based on Q-learning, which produced good results for both dynamic and policy gradient techniques. Apart from that, deep reinforcement learning was also applied to commodity and foreign exchange markets. Usha et al. [51] implemented the model for forecasting the price of gold, silver, and oil, as well as predicting the exchange rate for US dollars. The model depends only on price and date information to perform short-term forecasting, as more information is required for long-term forecasting. The agents were trained for 800 epochs with a windowing size of 10 overlapping sets of data using a low learning rate value of 0.001. The work in [52] also discussed exchange rate prediction using the LSTM network to model the input-output relationship rather than reinforcement learning. They used a more comprehensive set of input features that include exchange date, time, open, close, volume, low and high prices. The proposed model of two LSTM stacks with two fully connected layers produced better forecasting results compared to the conventional approaches of autoregressive with moving average and support vector regressors. Therefore, AI has been successfully used in many applications of intelligent finance systems.
4 Stock Market Manipulation Detection: Supervised Conventional Machine Learning Approach
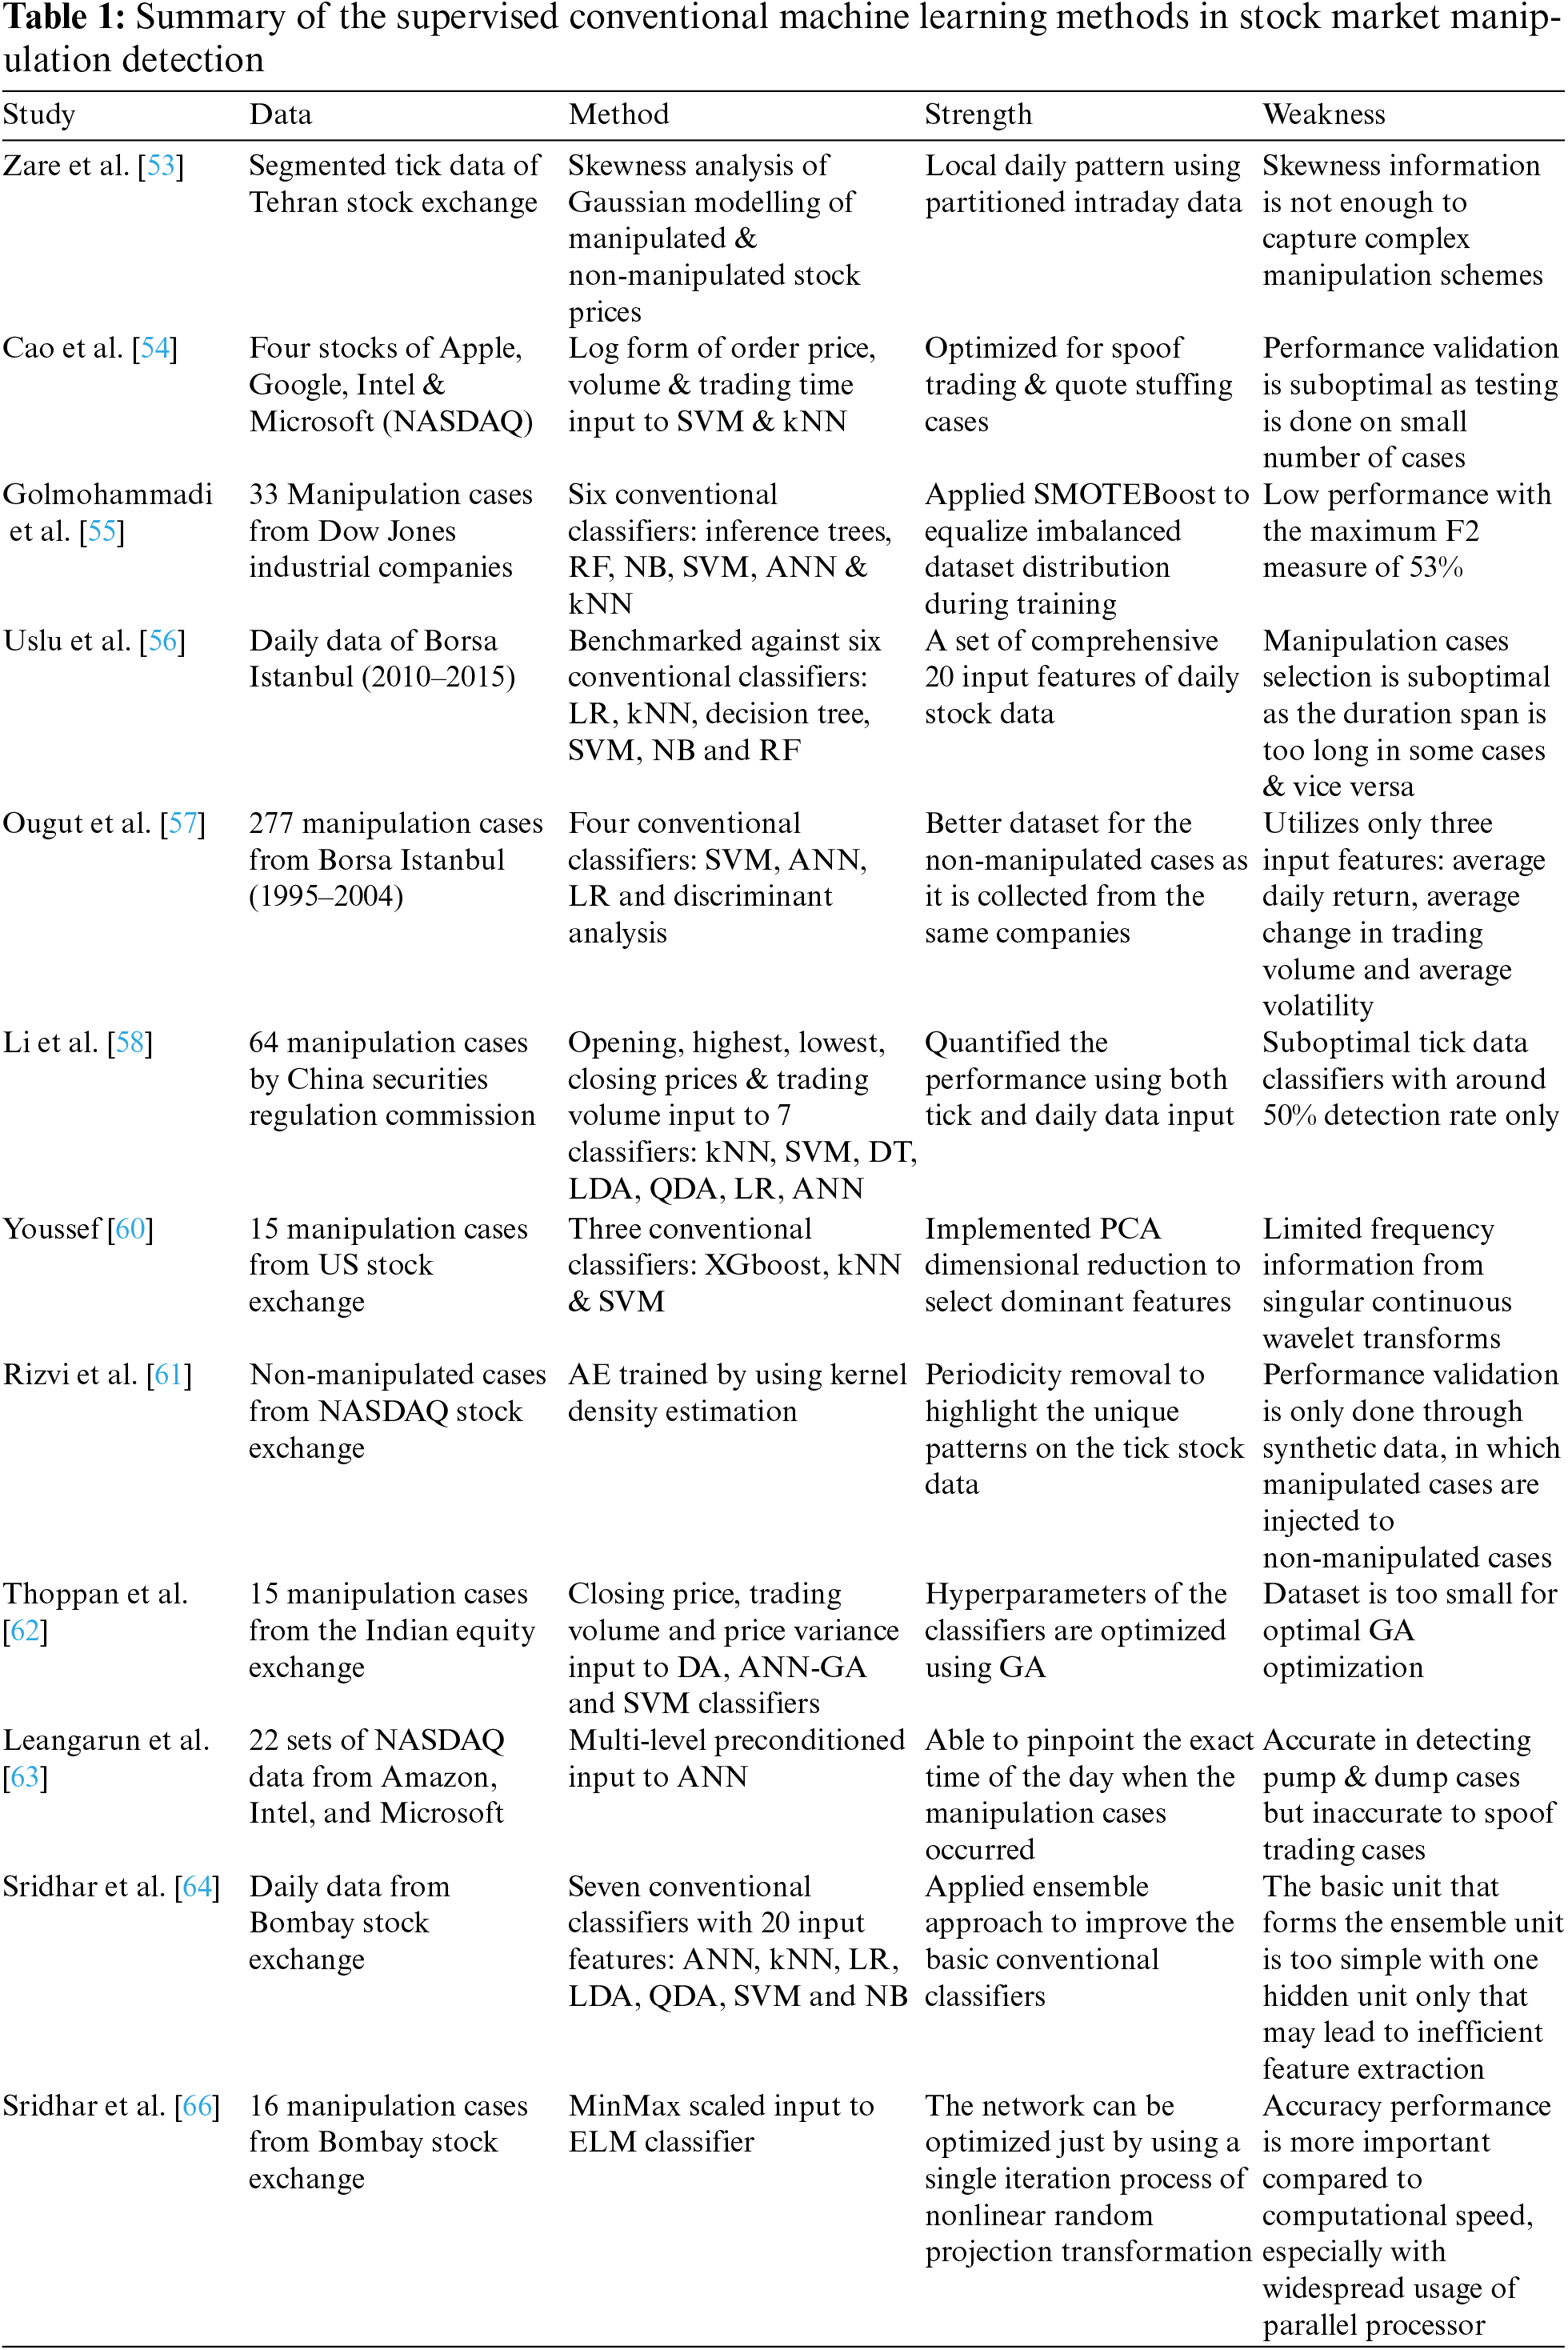
One of the basic methods of modeling manipulation cases is by deriving multivariate statistical representations to model the incidence. Zare et al. [53] developed two modeling schemes to analyze the possibility of manipulated and non-manipulated stock prices. They used tick stock data that were divided into six sections per day from the Tehran Stock Exchange. The models were applied to each section and hence, a maximum of six detection points were sampled per day. The methods produced two resultant output graphs representing sellers’ and buyers’ behaviors. Each of the seller’s and buyer’s outputs contained three classes of information, which were then modeled using the Gaussian distribution. The two graphs were compared, and the skewness feature was used to determine the possibility of manipulated cases. The respective mean and variance for each Gaussian distribution were statistically derived from the training data. Their results show that the skewness of manipulated cases is generally higher compared to non-manipulated cases. Rather than using simple statistical modeling, most of the existing methods devised to detect manipulation cases use a machine learning approach, whereby the modeling parameters are optimally trained to represent the respective class. In [54], the authors analyzed manipulation cases that involve four popular stocks on the NASDAQ Stock Market: Apple, Google, Intel, and Microsoft. They devised two machine learning methods, support vector machine (SVM) and k-nearest Neighbour (kNN) to identify trade-based manipulation cases due to spoof trading and quote stuffing. They selected three inputs; order price, volume, and trading time, which were then transformed into logarithmic representation. The transformation allowed the features to obtain well-spaced input to better represent manipulation cases. Based on their results, the manipulated cases tend to show outlier features, which is more obvious if logarithmic representation is used. Synthesized manipulation cases were also augmented during the training process to balance the number of cases between normal and manipulated cases.
A set of more comprehensive machine learning methods were explored in [55] by comparing six classifiers that included conditional inference trees, random forest (RF), naive Bayes (NB), SVM, artificial neural networks (ANN), and kNN. They discussed four types of market anomalies, which are high-yield investment fraud, broker embezzlement, late-day trading, and market manipulation. They also increased the number of manipulated cases of Dow Jones Industrial companies to 33 cases from 2003. They also improved the logarithmic representation by introducing an additional log ratio input of stock prices. Finally, they applied a more advanced oversampling method using SMOTEBoost to create synthetic data based on clustered information. The generated samples balanced out the minority class, which applies to all tested methods. The best method according to their findings was NB with an F2 Score of 53% using tick stock data price. One of the crucial steps in machine learning is feature reduction, whereby a smaller representative set of features can better represent the manipulation cases rather than the whole input features. The primary reason for this improvement can be attributed to noise removal from certain features, that can make it more difficult to identify manipulation cases.
Similar to previous findings, Uslu et al. [56] found that NB also produced the best manipulation detection performance. Even though they used a slightly smaller number of cases with only 22 manipulation incidences, they used a more comprehensive set of inputs with 20 features, including price volatility, transaction volume of increasing price, and number of active buying transactions. Daily data from 2010 to 2015, which has been verified by the Capital Market Board of Turkey, were extracted from Borsa Istanbul. The results proved that NB produced better accuracy, precision, and specificity compared to the second-best classifier, SVM. Contrary to these findings, the work in [57] found out that SVM produced the best detection rate, which was tested using Borsa Istanbul data. However, the number of input features was much less with only three types of information, which are average daily return, average change in trading volume, and average volatility. The authors proposed a unique data division between normal and manipulation cases, whereby the normal data were also taken from the same company but extracted before and after the manipulation period. Usually, other researchers have typically used different company stock data to represent normal cases to avoid interfering patterns that may affect the learning process of the classifier. Only the days that have been confirmed as manipulation cases are flagged as high, while the rest are flagged as low. They reported that SVM with RBF kernel produced the best detection performance based on 277 manipulation cases from 1995 to 2004 compared to ANN, LR, and discriminant analysis classifiers.
Apart from NB and SVM, the researchers in [58] and [59] found that the kNN classifier produced the best detection rate. This is in line with the use of different stock data and input features to the classifier that has resulted in different performance findings. The work in [58] used 64 manipulation cases, confirmed by the China Securities Regulatory Commission to build their intelligent detection system. They analyzed daily and tick data, but they found that tick data were too random and concluded that daily data were the more suitable input features. The features used were opening price, highest price, lowest price, closing price, and trading volume, which resulted in 99% accuracy. In addition to the kNN classifier, they analyzed six other classifiers, which are SVM, decision tree (DT), linear discriminant analysis (LDA), quadratic discriminant analysis (QDA), LR, and ANN classifiers, whereby LR produced the lowest accuracy at 89%. On the other hand, if tick data were used as the input, the classification performance was only around 50%, which is similar to random guess performance. The same findings were concluded in [59], which reported that the kNN classifier produced the best detection rate when the system was tested on Moscow Exchange data. They also argued that pump & dump is the earliest form of manipulation type, whereby pinging and spoof trading are the more recent schemes. They also divided the evolution of manipulation methods into three phases, which are modeling based on raw data, multivariate statistical analysis, and machine learning. Even though the paper was published in 2018, they excluded recent research trend based on deep learning, which has proven to better capture complex relationships in manipulation patterns. Another critical weakness of their method is the use of only two types of input features, which are 1) changes in daily trading volume and 2) the ratio of opening to closing price to train their kNN classifier, which is not informative for detecting more advanced manipulation schemes.
The research conducted in [60] used principal component analysis (PCA) to select the dominant input features to identify manipulation cases. The tick data of the bid and ask prices of 15 manipulation cases were extracted from the US Stock Exchange, and used as the training data to develop the optimized classifier. Rather than using raw data in the temporal space, the data were converted into frequency representation using a continuous wavelet transform. A total of seven transformed high-frequency data was capped, and became the input to the classifier. PCA was then applied to reduce the features by selecting between the top-1 and top-5 features. They utilized three classifiers, which are XGboost, kNN, and SVM to experiment on three input configurations; 1) raw temporal input, 2) frequency input and 3) frequency with PCA reduction. The best overall performance was obtained by using a kNN classifier with frequency input features that were selected by using the PCA method. Rizvi et al. [61] then applied the same early setup used in the previous work, but with a minor modification of periodicity removal to highlight unique patterns on the tick stock data. However, they used full synthetic data to validate the proposed method, in which the manipulation cases were artificially injected into the normal data taken from the NASDAQ Stock Exchange Market. The synthetic data were generated to mimic two types of manipulation types, which are spoof trading and pump & dump schemes. As a set of full fake data was used, the results do not reflect the real performance of the tested classifiers. They also introduced an autoencoder (AE) network, trained by using kernel density estimation to prove that their methods worked better than the standard kNN, SVM, K-means, and PCA-based clustering classifiers. A slight difference can also be observed in the frequency transformation method used in their study, whereby they used the discrete version of the wavelet transform, but retained the same feature reduction strategy.
Apart from US-based stock exchange analysis, India-based data have also been analyzed in several studies. It is worth noting that stock market regulations between countries are different, with different sets of rules and standards, even though the same manipulation scheme is referred to, which makes training a machine learning model using composite data from various countries less feasible. In [62], Thoppan developed an optimized standard machine learning classifier to detect manipulation cases using daily stock data. Three input features were selected that include closing price, trading volume, and interday price variance, which were optimized for discriminant analysis (DA), ANN-genetic algorithm (ANN-GA), and SVM classifiers. The hyperparameters for the ANN were optimized using GA, while the optimal kernel for SVM was based on the radial basis function (RBF). The data comprised relatively low manipulation cases from 2003 until 2009 with only 15 cases taken from the Indian Equity Exchange that had been confirmed by the Securities and Exchange Board of India. Their findings show that the best classifier was SVM with a 93% true positive detection, followed by DA with 81% and ANN-GA with 80%. The research in [63] also found a similar performance level for the ANN classifier with 88% accuracy in detecting manipulation cases. However, the authors argued that good detection performance can only be achieved for pump & dump manipulation schemes, while the detection rate for spoof trading manipulation schemes is very poor. This is because the pattern for pump & dump schemes can be easily captured due to sudden trading volume fluctuations, which are not clearly visible in spoof trading cases.
Another research by Sridhar et al. [64] introduced an ensemble approach to further improve the detection rate. The previously discussed methods did not apply any ensemble method that is known to be able to improve classification performance, but at the expense of computational time. The increment in computational burden comes from the need to optimize and execute more than one inference process. Nevertheless, they proved that an ensemble of five ANN works better compared to the standard kNN, linear regression (LR), LDA, QDA, SVM, and NB classifiers. They tested their findings using daily stock data from the Bombay Stock Exchange, which has been verified as manipulated stock cases by the Securities and Exchange Board of India. The three manipulation types that were of interest in their research were price manipulation, volume manipulation, and trade reversal. Since their method required a different selection of input for each model, the original set of features that was chosen was relatively large with 20 features that included the spread of close-open price, lowest price, closing price, and total turnover. By using a data division of (60:15:25) between (training:validation:testing), the ensemble ANN produced 96% accuracy, followed by kNN, which is the second best classifier with only 88% accuracy. The same ensemble approach was used in [65], in which multiple models were designed for each manipulation case. Some of the models were dedicated to different tasks, including price change, bilateral trade, and trade basket ratio, which were then combined to produce anomaly detection to sift out the early candidates for manipulation cases. They used the Tehran Stock Exchange data from 2012 to 2017 that had been confirmed by the Securities and Exchange Organization of Iran as the manipulated cases. Similar to the previous findings, the pump & dump tactic was one of the simplest manipulation schemes, whereby intraday data alone is enough to automatically detect the incidence. Each of the models was combined using uniform weights through a logistic regression method.
Normally, training a conventional machine learning classifier requires an iterative update of the parameters. The length of the training process depends heavily on the starting point during the initialization stage, whether it is close to the optimal points or not, which may result in a short or long training period, respectively. Therefore, Sridhar et al. [66] explored the use of an extreme learning machine approach in designing their manipulation detector. Basically, the basis of the network was similar to a one-hidden-layer ANN architecture, but the parameters were optimized in a single step using nonlinear random projection transformation rather than an iterative process. To verify their proposed method, the authors extracted 16 manipulation cases of volume and price manipulation schemes from the Bombay Stock Exchange. The same input features used in [64] were applied but with the addition of MinMax scaling with different dataset divisions of (70:30) between the (training:testing) data. The resultant true positive rate detections were more than 0.8 for both cases, but the training period was much shorter compared to the standard ANN classifier.
Apart from a standard classification approach to detect manipulation cases, a non-supervised machine learning technique has also been used to create an artificial intelligence bot (AI-Bot) to perform manipulative trading schemes [67]. An AI-Bot was trained to produce an optimal investment strategy, with the baseline to represent the trading dynamic. This AI-Bot was based on a genetic algorithm that utilized 10000 simulation agents to produce the optimal trading strategy. Interestingly, the authors concluded that the AI-Bot suggested that the optimal scheme should be constructed using a manipulative strategy, which indirectly can be used to detect this illegal activity. They simulated eleven synthetic test cases, and most of them produced certain manipulative-based strategies to produce an optimal return on investment. However, the dynamic nature of stock markets makes this strategy questionable since traders continuously adapt to new rules and regulations, which are frequently updated by regulators when a loophole is found. Apart from that, another AI-Bot, known as Bot2Stock was developed to inject malware programs into potential victims to execute manipulative trades [68]. The rogue traders’ modus operandi is to hack the victim’s email or brokerage account and then, deliver a short trade attack that lasts less than a minute. Normally, the victims do not immediately realize that these intelligent agents have attempted manipulative trades because of the short period attacks. The authors revealed that Bot2Stock yielded a return of investment of 2.8% using 1000 simulation agents just by using the pump & dump manipulation strategy. Furthermore, each of the agents was not required to be aware of other agents’ activities, making them independent of each other and reducing the risk of collusion detection. The authors also highlighted that their research aimed to raise awareness on the importance of sound cybersecurity systems with two main suggestions: two-factor authentication and a better alert trigger mechanism. Table 1 summarizes the supervised conventional machine learning methods used in stock market manipulation detection.
5 Stock Market Manipulation Detection: Unsupervised Conventional Machine Learning Approach
Contrary to the supervised method, which aims to classify whether a trading activity is a manipulated case or not, the unsupervised method aims to detect manipulation cases through a clustering approach. No ground truth labeling is provided during the training phase, and any detected anomalous trading activity is considered as a potential manipulation case. Therefore, normal cases are clustered as one group, and any large deviation from this group is treated as the manipulated case. In [69], the researchers collected daily stock data from the Australian Stock Exchange (2009–2013) to test 11 clustering methods to identify manipulation cases. They used a set of five input features, including closing price, transaction volume, transaction total worth, lowest price, and highest price, which is the same input set for all tested clustering methods. They found that 25% of the data fell under the anomaly group, whereby the best-reported methods according to the precision and F1-Score metrics were the local outlier factor (LOF) and clustering-based multivariate Gaussian outlier score (CMGOS) methods. However, the third best clustering method, which is connectivity-based outlier factor (COF) technique reported a less than 0.2 F1-Score, which was far less than the two best methods. The large performance gap between the clustering methods may have been caused by unoptimized training procedures that led to suboptimal parameter settings being used during the testing phase. For a binary classification problem, the formula for F1-Score is shown below, whereby Tp is the true positive, Fp is the false positive and Fn is the false negative.
Another method proposed in [70] used contextual anomaly detection to identify the possibility of manipulation cases in stock trading activities. Two contexts were considered either to find the similarity to the neighborhood data or to find the similarity of the time series pattern to the rest of the historical data. Stock prices were organized in the form of a sliding window, whereby the centroid of the windowing data was used to group them into the two contexts. A simple threshold method was then used to determine the most similar pattern whether they fell under a normal or anomalous group. Their findings show that the proposed method performed significantly better with a 0.3 recall rate, compared to the benchmark methods of kNN and random walk clustering methods that produced less than 0.1 recall rates. Since the anomalous behavior of these two stock exchanges is relatively different due to different regulations, making it hard to train a model using a combined dataset of stock exchanges. However, Al-Thani et al. [71] used both US and Qatar stock exchange data to train a nonsupervised manipulation case detector. They argued that, as manipulation schemes keep continuously evolving, the ground truth label cannot be provided for most cases, particularly for new manipulation schemes. Therefore, the unsupervised method was chosen to detect anomaly cases regardless of the type of manipulation scheme. Stock prices were smoothed using a moving average to reduce fluctuation noise. The same contextual anomaly detector as proposed in the previous work was used to group the data points. Besides that, correlation measure was also applied to find similar patterns among companies in the same sectors, which is useful in determining the normal group.
Instead of using a simple correlation measure to relate the manipulation activities of various companies, the work in [72] detected collusion among traders in order to manipulate a stock price. This type of manipulation scheme is harder to detect as the system needs to identify the trader’s group first before any of their trading activities can be scrutinized. Therefore, an unsupervised clustering method has been used to group the traders as there is no ground truth can be inferred accurately for this case. By default, a group of traders working together will surely push up the numbers of trading order or volume compared to the normal pattern. Yet, it is hard to distinguish between the real pattern and the manipulated pattern because there will always be many traders who buy and sell stocks by following the mass trend. Hence, the collusion incidence needs to be identified first, before the group trading activity can be clustered together. Due to the difficulty in obtaining the ground truth, simulated data was used to verify the proposed method. They proposed two-stage methods, which are to cluster the traders first before the activities were clustered. To find possible relations between the traders, graph mining through spectral clustering was used to find the traders’ groups. Once the group has been identified, the LOF clustering method was used to detect anomaly cases by capping a distance threshold between stock data points and the normal group of data. It is also important to note that stock prices can be easily misled by the execution of collective activities by various traders, whereby it will be considered a normal occurrence if only a single trader’s point of view is considered.
6 Stock Market Manipulation Detection: Deep Machine Learning Approach
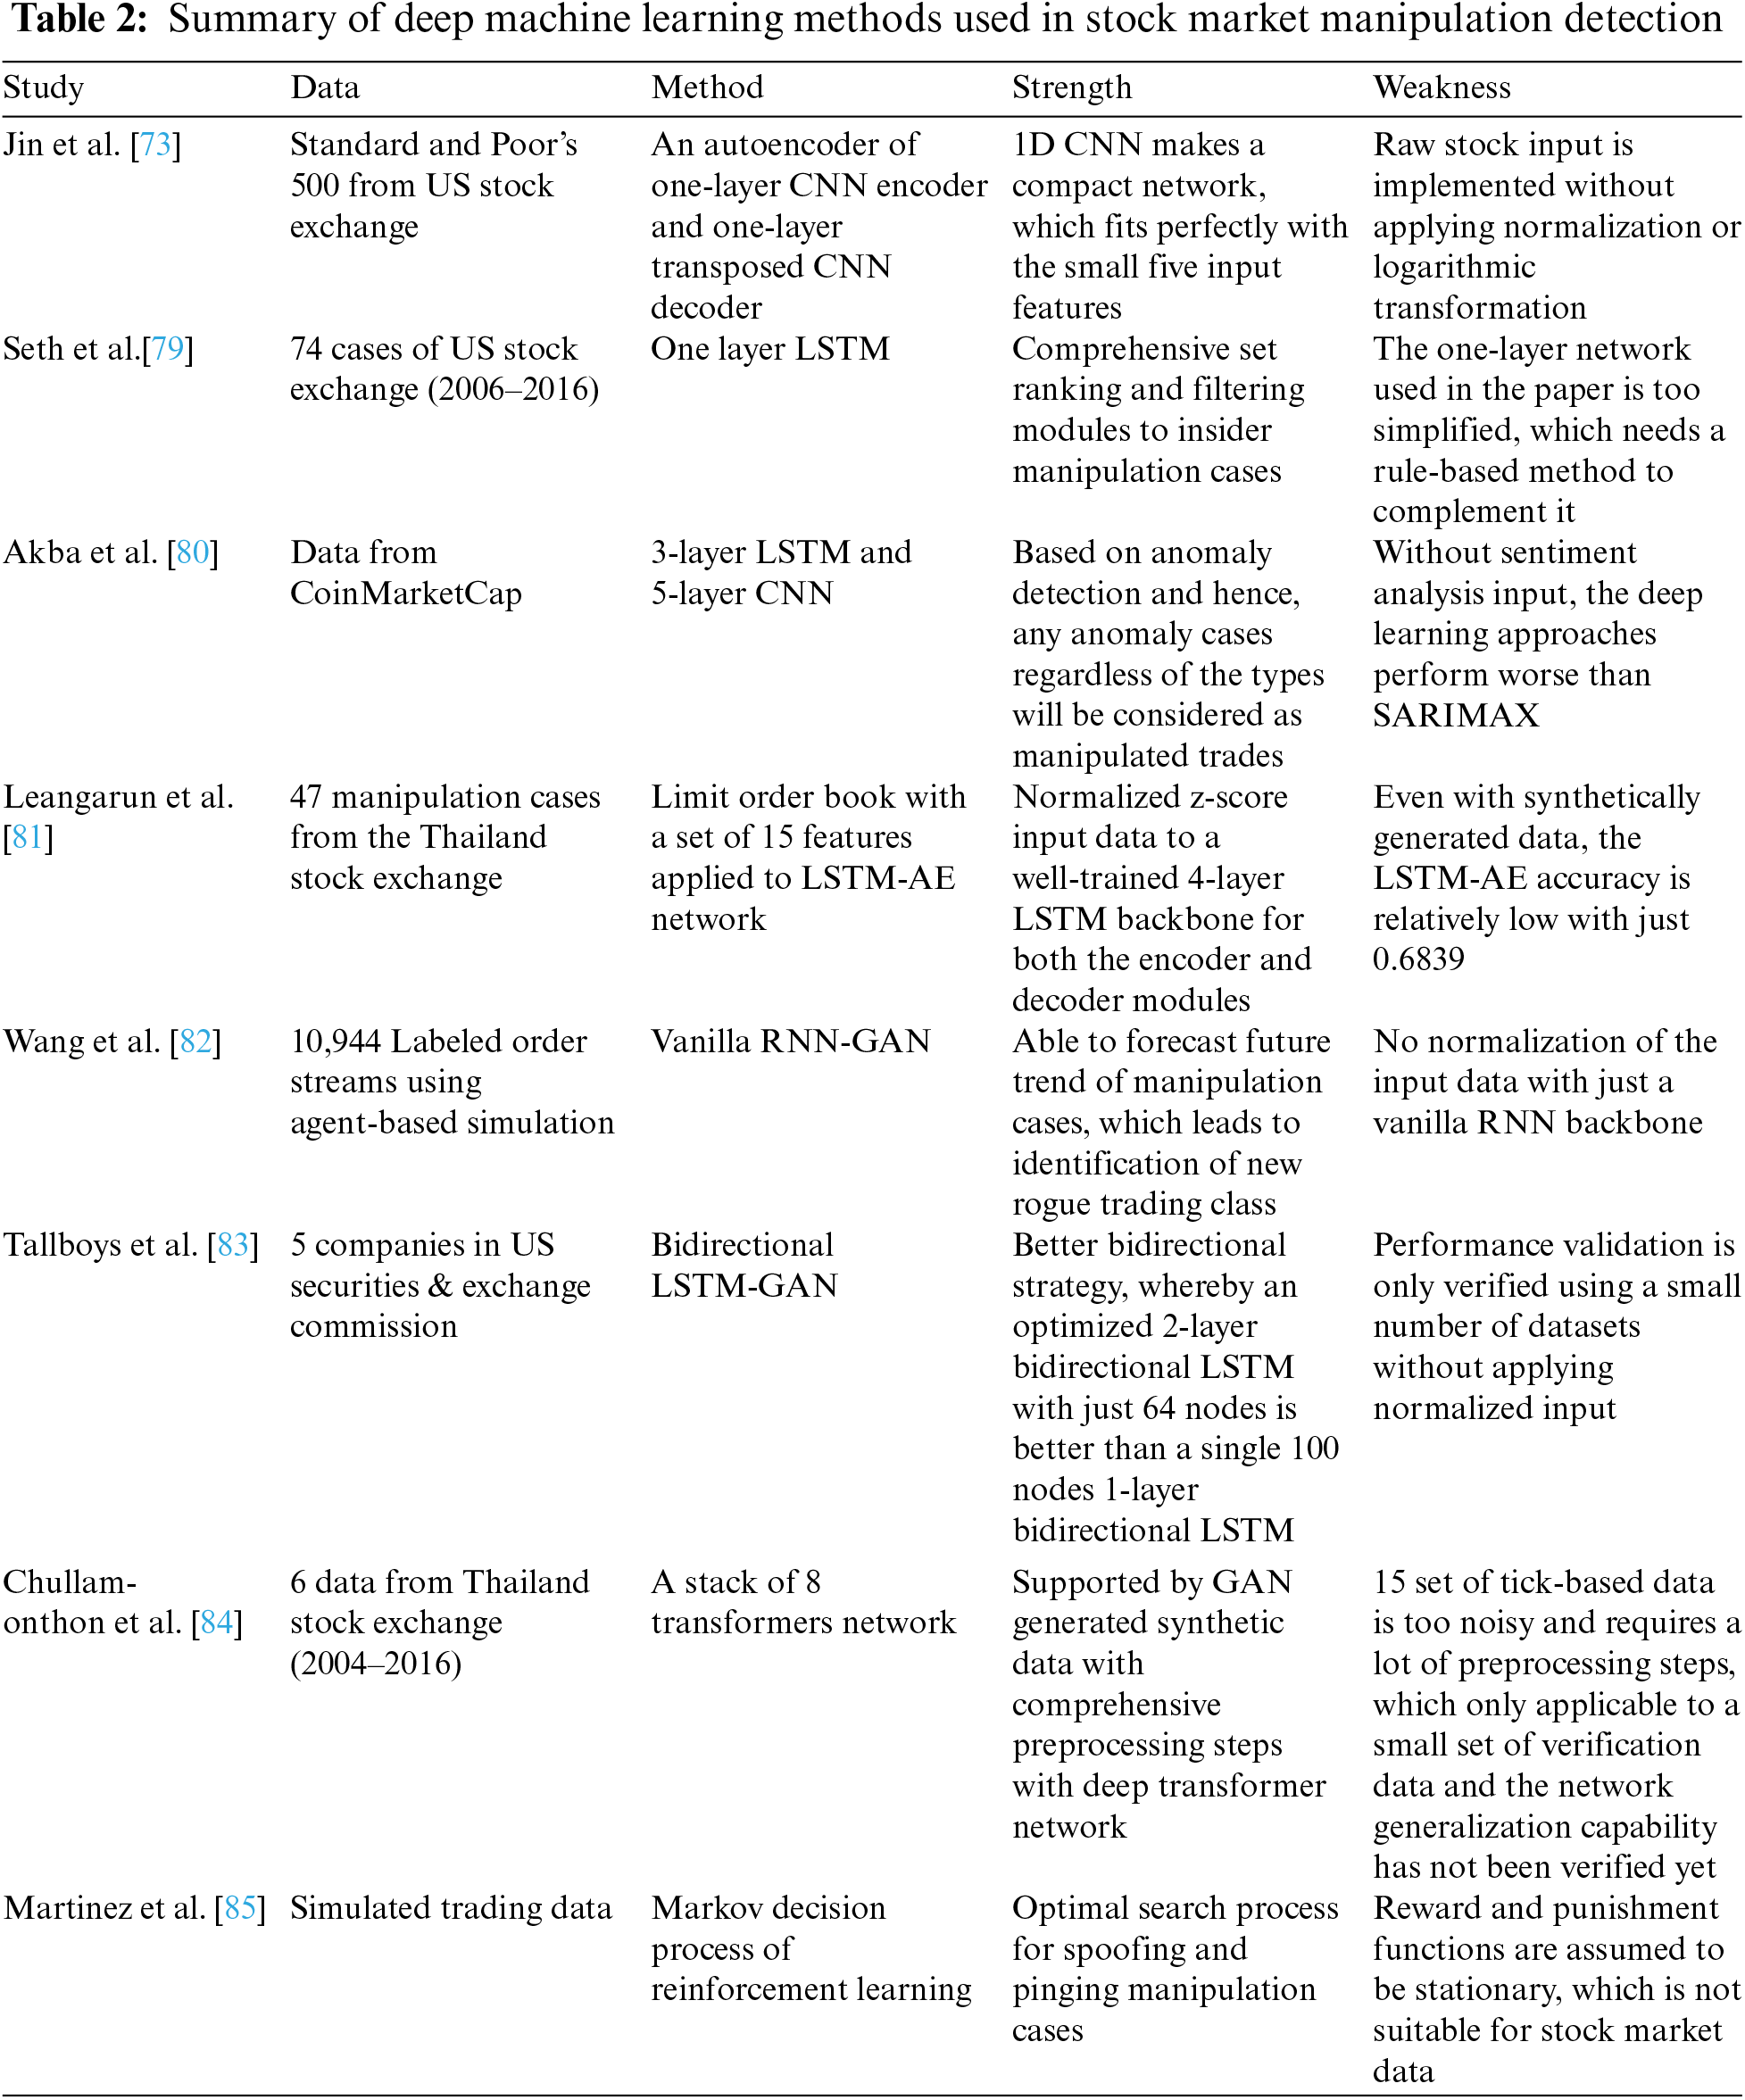
The primary factors that distinguish the deep machine learning approach from the conventional machine learning approach are the depth and complexity of a network. Hence, a deep network, which is normally deeper, allows it to map complex relationships between input and output. Moreover, it is usually packaged as end-to-end networks that cover both feature extraction and decision-making modules. Consequently, the deep machine learning approach also needs a good computational platform, which is usually in the form of parallel processing that is frequently realized through a graphic processing unit. One of the most basic deep machine learning architectures is a 1-dimensional convolutional neural network (CNN), which was used in [73] to detect stock manipulation cases. An autoencoder with one layer encoder and one layer decoder was devised to detect non-linear patterns, whereas normal patterns are usually linear in nature. Data from Standard and Poor’s 500 from the US stock market were used to verify the proposed architecture, and the results were benchmarked with three conventional approaches, kNN, SVM with Gaussian kernel, and isolated forest classifiers. Five input features from daily stock data were used as the input to the autoencoder, including closing price, opening price, highest price, lowest price, and stock volatility. No normalization or logarithmic representation was applied, as they affect the training process due to different price baselines among the various stocks. However, even without applying any preprocessing steps, the findings proved that an autoencoder still produces the best detection rate compared to the other conventional classifiers. Generally, CNN is more popular in extracting spatial features as implemented in biomedical imaging [74], video surveillance [75], self-driving cars [76] and intelligent agricultural systems [77]. On the other hand, a recurrent neural network (RNN) is designed to better extract the temporal relationship between the input and output, making it more suitable for stock market analysis. In [78], Sridhar and Mootha went a step further by introducing an ensemble of classifiers using an RNN as the base. They tested their proposed ensemble classifier by using daily stock data from the Bombay Stock Exchange. The RNNs were tasked with extracting the features, which were then passed to a dense connection to produce the right class prediction, either a normal or manipulated case.
However, the most used deep architecture for detecting manipulation cases in stock markets is the more advanced variant of vanilla RNN, which is the long short-term memory (LSTM) networks. This architecture allows a network to capture both the long- and short-term relationships between input and output. The short-term relationships are stored using four-gate schemes that allow a network to capture any short-period manipulation scheme. The research in [79] used the simplest form of LSTM, which is just one layer to extract long and short-term dependencies to identify manipulated cases. They dedicated the network to a single type of manipulation case, an insider trading scheme. The daily stock data from 2006 to 2016 were taken from the US stock exchange with a total of 74 manipulation cases. By using a window size equivalent to 10, the proposed LSTM-based classifier produced a detection accuracy of 84%.
In [80], a deeper LSTM network was utilized to identify manipulation cases in cryptocurrency exchanges. The network was tested on data from CoinMarketCap, which happened to hide the identity of the owners. In addition to historical stock price information, blockchain information was also used to identify collusion possibilities among traders. The author tested two configurations of the manipulation detectors whether with or without the sentiment analysis module. Without the help of sentiment analysis information, their 3-layer LSTM did not perform really well compared to the seasonal auto regressive integrated moving average with exogenous factors (SARIMAX) classifier, which is a conventional machine learning method that was found to be effective in identifying manipulation cases. Then, the input of the sentiment analysis system was added to increase detection accuracy using various analyzers, including SVM, deep neural decision forest, RF, and 5-layer CNN classifiers. By using a 3-layer LSTM, Leangarun et al. [43] developed a generative adversarial network (GAN) to detect stock manipulation cases. The unique aspect of this adversarial approach was the two competing networks that aimed to detect and produce fake incidents, which refers to manipulation incidents in this case. The better a network in producing synthetic manipulation cases, the better it produces the ideal detector to identify manipulation cases. Both the generator and discriminator networks used 3-layer LSTM as the basis, and 47 manipulation cases from Thailand Stock Exchange were used as the training and testing data. Limit order book data were used as the input to the network, classified as level II information by the authors.
The authors then enhanced the design of their detector by introducing an improved version of the LSTM-GAN and a new LSTM-AE network [81]. The same limit order book data, containing a set of 15 features were used as the input to the network. All features were first normalized according to the z-score methodology. In the LSTM-AE, a 4-layer LSTM was used as the basis for the encoder and decoder modules. The number of hidden units for the encoder module is 64, 32, 16, and 8, while it is the opposite order for the decoder module, with 8, 16, 32, and 64 hidden units. For the LSTM-GAN, both the discriminator and generator modules were appended with two dense layers each. The authors took an extra precautionary step in selecting normal class stocks because some of them could have contained manipulated cases that had been miss identified by the regulators. Hence, only stocks that had been certified by the Good Corporate Governance list from 2004 until 2016 were used as the training and testing data. Besides that, the authors also ensured a balanced data representation from large, medium, and small-capital companies to capture unique patterns that could vary due to company size. Their results show that the LSTM-AE performed better than the LSTM-GAN in detecting manipulation cases with an accuracy of 0.6839 compared to 0.5640. The same findings were reported in [82], in which vanilla RNN was used to construct the GAN modules. However, the authors stressed that the proposed method was useful in identifying a potential future manipulation scheme through its unique generator module. The entire space of the latent variable can be explored to generate possible cases for future reference. It is worth highlighting that a GAN is normally optimized by using a contrastive or triplet loss function rather than a standard cross-entropy loss function.
In any RNN, the network flow can be unidirectional as such the features flow from the input to the output, or it can be bidirectional as such the flow can be both forward and backward between the two layers. Tallboys et al. [83] used a bidirectional LSTM to construct their LSTM-GAN architecture to detect stock manipulation cases. Data from five US companies were used to validate the proposed method, which has been vetted by US SEC as belonging to the manipulation cases. For the discriminator module, only a single bidirectional LSTM was used with 100 hidden units, while for the generator module, a 2-layer bidirectional LSTM was used in both the encoder and decoder parts of the networks with a total of 64 hidden units per layer. However, their results highlight that a standard 2-layer LSTM with a dense connection performed better in distinguishing normal cases from manipulated cases.
Another variant of the LSTM is the stacked self-attention network, also known as the transformer. This model was utilized in [84] to detect manipulation cases in the Thailand Stock Exchange. However synthetic manipulation cases were added to the data pool to enrich the training samples that were originally composed of six cases from 2004 to 2016. A pump & dump manipulation scheme was injected into the normal data, as it is the most commonly executed fraud strategy. A 60:20:20 data division scheme was used to arrange the dataset which comprised 15 tick data features. The best results were returned by a stack of eight transformers feature extractors with an average accuracy of 91%. The output features from the transformer were down-pooled by using a global pooling operator, which was then fed into the dense connections with a 40% dropout unit. Aside from RNN variants, reinforcement learning was optimized to detect manipulation cases [85]. The authors specifically designed the method for identifying manipulation cases caused by spoof and pinging trading. The learning process adopted the full and partial observability of the Markov decision process. Besides, the reward and punishment of the model were assumed to be stationary or independent of time. The model was trained with the objective of maximizing portfolio growth to mimic a manipulator’s underlying actions. This selection was made due to the contrast in portfolio growth patterns between an honest and a rogue trader. In general, the complexity of the base CNN model is higher compared to the base RNN model. Apart from that, model complexity will increase proportionally to the number of stacked networks for both CNN and RNN models. Furthermore, a gated recurrent unit is a more complex model compared to the LSTM, while LSTM is a more complex model compared to the vanilla RNN. On top of that, the complexity of the deep model will also increase if bidirectional network flow is implemented, instead of unidirectional flow. Table 2 summarizes the deep machine learning methods used in stock market manipulation detection.
7 Challenges and Opportunities
In conclusion, AI has been successfully applied to detect and identify manipulation cases in the stock market. Most approaches have utilized tick data in their experiments, rather than daily trading data. In general, the price pattern of tick data is more likely to be influenced by outliers compared to daily trading data. Apart from that, most of the existing methods were based on the traditional machine learning paradigm, which requires a model designer to select the optimal set of features as the input variables. SVM classifier is found the most popular method to detect manipulation cases, whether it has been used as the proposed method or for benchmarking purposes. Besides that, it is also interesting to note that several studies have reported that the simplest tested classifier produces the best detection rate. This finding may corroborate the low numbers of testing data in verifying algorithm performance. There are several challenges faced by researchers in producing a better-automated algorithm for stock market manipulation detection, including:
1. The rules and regulations for each country are different, and hence, the definition of stock manipulation has slight differences, especially in the thresholds used to define the manipulation schemes. Besides that, some countries are able to detect manipulation schemes in a shorter period compared to others, which makes some of the shorter-period manipulation activities left undetected.
2. There is no publicly available online dataset that can be used as the general benchmark since most researchers have used their own country’s stock data to verify their proposed methods. Apart from that, there is no standard database that lists down all the manipulation cases that are publicly accessible by the researchers.
3. Most of the normal cases that represent the non-manipulated cases were used without implementing stringent due diligence. There is a possibility of manipulated cases that have been labeled as non-manipulated cases due to miss detection of the incident. Contrary to that, some of the manipulated cases were sourced from a verified source, and this stringent approach should also be applied to the non-manipulated cases.
Besides that, there are several areas or opportunities in which current intelligent stock manipulation detection systems could be further improved:
1. Implement a deep learning analysis network that includes a dense feedforward model, which would be useful in cases of insufficient training data. A dense feedforward connection can map a more complex relationship between input and output to extract meaningful patterns of existing and new manipulation strategies. Two popular techniques can be explored using a skip connection, which is based on an addition operator, or using a dense feedforward connection, which is based on a concatenation operator.
2. Utilize an advanced attention mechanism to better extract complex patterns in stock historical data. The most popular variation in the attention mechanism is stacked self-attention, which is famously known as the transformer. This network is expected to allocate more weights to a certain part of the data to better extract manipulation patterns. In some cases, manipulation cases occur only for a short duration, while in others, they may occur over several days. Hence, by having a better-designed transformer network, these unique temporal patterns can be better captured to identify manipulation cases.
3. Use integrated stock data from multiple countries to enrich the training data. However, the selected countries must have similar regulation standards, whereby different countries have different sets of laws. Furthermore, loopholes in certain countries’ regulations may lead to some manipulation cases being undetected, which would lead to false pattern learning by intelligent systems. Therefore, careful vetting procedures must be implemented to reduce the possibility of a noisy integrated dataset.
Funding Statement: This work was supported in part by the RHB-UKM Endowment Fund through Dana Endowmen RHB-UKM under Grant RHB-UKM-2021-001, and in part by the Universiti Kebangsaan Malaysia through the Dana Padanan Kolaborasi under Grant DPK-2021-012.
Conflicts of Interest: The authors declare that they have no conflicts of interest to report regarding the present study.
References
1. N. James, M. Menzies and G. A. Gottwald, “On financial market correlation structures and diversification benefits across and within equity sectors,” Physica A: Statistical Mechanics and its Applications, vol. 604, no. 1, pp. 127682, 2022. [Google Scholar]
2. P. Bond, A. Edmans and I. Goldstein, “The real effects of financial markets,” Annual Review of Financial Economics, vol. 4, no. 1, pp. 339–360, 2012. [Google Scholar]
3. A. Omar and M. M. Jaffar, “Comparative analysis of Geometric Brownian motion model in forecasting FBMHS and FBMKLCI index in Bursa Malaysia,” in Proc. of IEEE Symp. on Business, Engineering and Industrial Applications, Langkawi, Malaysia, pp. 157–161, 2021. [Google Scholar]
4. H. B. Christensen and V. V. Nikolaev, “Does fair value accounting for non-financial assets pass the market test?,” Review of Accounting Studies, vol. 18, no. 3, pp. 734–775, 2013. [Google Scholar]
5. A. F. Munir, M. E. A. Sukor and S. S. Shaharuddin, “Adaptive market hypothesis and time-varying contrarian effect: Evidence from emerging stock markets of South Asia,” SAGE Open, vol. 12, no. 1, pp. 1–16, 2022. [Google Scholar]
6. O. Ouriemmi and B. Gerard, “Control dynamics in rogue trading: Sovereignty and exception-to-the-rule attitudes in the contemporary financial sphere,” Critical Perspectives on Accounting, pp. 102414, 2022. https://www.sciencedirect.com/science/article/abs/pii/S1045235421001337 [Google Scholar]
7. S. Khodabandehlou and S. A. H. Golpayegani, “Market manipulation detection: A systematic literature review,” Expert Systems with Applications, vol. 210, no. 3, pp. 118330, 2022. [Google Scholar]
8. C. M. Lee, M. J. Ready and P. J. Seguin, “Volume, volatility, and New York stock exchange trading halts,” The Journal of Finance, vol. 49, no. 1, pp. 183–214, 1994. [Google Scholar]
9. K. Sie-Min, M. A. Zulkifley and N. A. M. Kamari, “Optimal compact network for micro-expression analysis system,” Sensors, vol. 22, no. 11, pp. 4011, 2022. [Google Scholar] [PubMed]
10. T. Nasir, M. Asmaela, Q. Zeeshana and D. Solyalib, “Applications of machine learning to friction stir welding process optimization,” Jurnal Kejuruteraan, vol. 32, no. 1, pp. 171–186, 2020. [Google Scholar]
11. Y. J. Zheng, S. L. Yu, Q. Song, Y. J. Huang, W. G. Sheng et al., “Co-evolutionary fuzzy deep transfer learning for disaster relief demand forecasting,” IEEE Transactions on Emerging Topics in Computing, vol. 10, no. 3, pp. 1361–1373, 2021. [Google Scholar]
12. S. R. Abdani, M. A. Zulkifley, M. I. Shahrimin and N. H. Zulkifley, “Computer-assisted pterygium screening system: A review,” Diagnostics, vol. 12, no. 3, pp. 639, 2022. [Google Scholar] [PubMed]
13. A. Tripathi, R. K. Tiwari and S. P. Tiwari, “A deep learning multi-layer perceptron and remote sensing approach for soil health based crop yield estimation,” International Journal of Applied Earth Observation and Geoinformation, vol. 113, no. 1, pp. 102959, 2022. [Google Scholar]
14. M. S. Ansari, V. Bartos and B. Lee, “GRU-based deep learning approach for network intrusion alert prediction,” Future Generation Computer Systems, vol. 128, no. 4, pp. 235–247, 2022. [Google Scholar]
15. S. R. Abdani, M. A. Zulkifley and N. H. Zulkifley, “Optimized set of parallel atrous convolutions for ShuffleNet V2,” in Proc. of the 6th Int. Conf. on Electrical, Control and Computer Engineering, Gambang, Malaysia, pp. 785–794, 2022. [Google Scholar]
16. A. Riyanto and Z. Arifin, “Pump-dump manipulation analysis: The influence of market capitalization and its impact on stock price volatility at Indonesia stock exchange,” Review of Integrative Business and Economics Research, Society of Interdisciplinary Business Research, vol. 7, pp. 129–142, 2018. [Google Scholar]
17. T. Akram, S. A. RamaKrishnan and M. Naveed, “Assessing four decades of global research studies on stock market manipulations: A sceintometric analysis,” Journal of Financial Crime, vol. 28, no. 3, pp. 940–962, 2021. [Google Scholar]
18. V. Goldwasser, “History of the regulation of market manipulation and rationales for regulation,” in Stock Market Manipulation and Short Selling. New South Wales, Australia: Centre for corporate law and securities regulation and CCH Australia Limited, pp. 33–52, 1999. [Google Scholar]
19. D. R. Fischel and D. J. Ross, “Should the law prohibit “manipulation” in financial markets,” Harvard Law Review, vol. 105, no. 2, pp. 503–553, 1991. [Google Scholar]
20. S. Thel, “$850,000 in six minutes-the mechanics of securities manipulation,” Cornell Law Review, vol. 79, pp. 219–298, 1993. [Google Scholar]
21. R. A. Jarrow, “Market manipulation, bubbles, corners, and short squeezes,” Journal of Financial and Quantitative Analysis, vol. 27, no. 3, pp. 311–336, 1992. [Google Scholar]
22. J. A. Cherian and R. A. Jarrow, “Market manipulation,” Handbooks in Operations Research and Management Science, vol. 9, Nashville, Tennessee, USA: American Economic Association, pp. 611–630, 1995. [Google Scholar]
23. A. S. Kyle and S. Viswanathan, “How to define illegal price manipulation,” American Economic Review, vol. 98, no. 2, pp. 274–279, 2008. [Google Scholar]
24. H. K. Baker and H. Kiymaz, “Dark trading,” in Market Microstructure in Emerging and Developed Markets: Price Discovery, Information Flows, and Transaction Costs. New Jersey, USA: John Wiley and Sons, pp. 213–230, 2013. [Google Scholar]
25. M. B. Fox, L. R. Glosten and G. V. Rauterberg, “Stock market manipulation and its regulation,” Yale Journal on Regulation, vol. 35, no. 1, pp. 67–126, 2018. [Google Scholar]
26. F. Allen and D. Gale, “Stock-price manipulation,” The Review of Financial Studies, vol. 5, no. 3, pp. 503–529, 1992. [Google Scholar]
27. J. L. Vila, “Simple games of market manipulation,” Economics Letters, vol. 29, no. 1, pp. 21–26, 1989. [Google Scholar]
28. M. Bagnoli and B. L. Lipman, “Stock price manipulation through takeover bids,” The RAND Journal of Economics, vol. 27, no. 1, pp. 124–147, 1996. [Google Scholar]
29. R. Benabou and G. Laroque, “Using privileged information to manipulate markets: Insiders, gurus, and credibility,” The Quarterly Journal of Economics, vol. 107, no. 3, pp. 921–958, 1992. [Google Scholar]
30. J. V. Bommel, “Rumors,” The Journal of Finance, vol. 58, no. 4, pp. 1499–1520, 2003. [Google Scholar]
31. N. Eren and H. N. Ozsoylev, “Hype and dump manipulation,” in Proc. of the EFA, 2007 Ljubljana Meetings Paper, AFA 2008 New Orleans Meetings Paper, Ljubljana, Slovenia, pp. 1–43, 2006. [Google Scholar]
32. M. A. Zulkifley, M. E. A. Sukor, A. F. Munir and M. H. M. Shafiai, “Stock market manipulation detection using artificial intelligence: A concise review,” in Proc. of the Int. Conf. on Decision Aid Sciences and Application, Sakheer, Bahrain, pp. 165–169, 2021. [Google Scholar]
33. A. I. Khwaja and A. Mian, “Unchecked intermediaries: Price manipulation in an emerging stock market,” Journal of Financial Economics, vol. 78, no. 1, pp. 203–241, 2005. [Google Scholar]
34. R. K. Aggarwal and G. Wu, “Stock market manipulations,” The Journal of Business, vol. 79, no. 4, pp. 1915–1953, 2006. [Google Scholar]
35. C. Comerton-Forde and T. J. Putniņs, “Measuring closing price manipulation,” Journal of Financial Intermediation, vol. 20, no. 2, pp. 135–158, 2011. [Google Scholar]
36. C. Leuz, S. Meyer, M. Muhn, E. Soltes and A. Hackethal, “Who falls prey to the wolf of wall street? investor participation in market manipulation,” National Bureau of Economic Research, vol. 24083, pp. 1–60, 2017. [Google Scholar]
37. Y. C. Huang and Y. J. Cheng, “Stock manipulation and its effects: Pump and dump versus stabilization,” Review of Quantitative Finance and Accounting, vol. 44, no. 4, pp. 791–815, 2015. [Google Scholar]
38. D. G. Wirama, I. G. B. Wiksuana, M. S. Zuraidah and S. Kazemian, “Price manipulation by dissemination of rumors: Evidence from the Indonesian stock market,” International Journal of Economics and Financial Issues, vol. 7, no. 1, pp. 429–434, 2017. [Google Scholar]
39. Y. Y. Kan, “Capital market offenses in Malaysia,” Qualitative Research in Financial Markets, vol. 10, no. 2, pp. 171–188, 2018. [Google Scholar]
40. R. Hanson, R. Oprea and D. Porter, “Information aggregation and manipulation in an experimental market,” Journal of Economic Behavior & Organization, vol. 60, no. 4, pp. 449–459, 2006. [Google Scholar]
41. C. Comerton-Forde and T. J. Putniņs, “Pricing accuracy, liquidity and trader behavior with closing price manipulation,” Experimental Economics, vol. 14, no. 1, pp. 110–131, 2011. [Google Scholar]
42. J. Zhai, Y. Cao and X. Ding, “Data analytic approach for manipulation detection in stock market,” Review of Quantitative Finance and Accounting, vol. 50, no. 3, pp. 897–932, 2018. [Google Scholar]
43. T. Leangarun, P. Tangamchit and S. Thajchayapong, “Using generative adversarial networks for detecting stock price manipulation: The stock exchange of Thailand case study,” in Proc. of the IEEE Symp. Series on Computational Intelligence, Canberra, Australia, pp. 2162–2169, 2020. [Google Scholar]
44. A. Farooq and P. Chawla, “Review of data science and AI in finance,” in Proc. of the Int. Conf. on Computing Sciences, Phagwara, India, pp. 216–222, 2021. [Google Scholar]
45. L. Rong, Z. Weibai and H. Debo, “Sentiment analysis of ecommerce product review data based on deep learning,” in Proc. of the 4th Advanced Information Management, Communicates, Electronic and Automation Control Conf., Chongqing, China, vol. 4, pp. 65–68, 2021. [Google Scholar]
46. B. Zhu, W. Yang, H. Wang and Y. Yuan, “A hybrid deep learning model for consumer credit scoring,” in Proc. of the Int. Conf. on Artificial Intelligence and Big Data, Chengdu, China, pp. 205–208, 2018. [Google Scholar]
47. C. Muranda, A. Ali and T. Shongwe, “Deep learning method for detecting fraudulent motor insurance claims using unbalanced data,” in Proc. of the 62nd Int. Scientific Conf. on Information Technology and Management Science of Riga Technical University, Riga, Latvia, pp. 1–5, 2021. [Google Scholar]
48. C. Hsieh and T. C. Lin, “Housing price prediction by using generative adversarial networks,” in Proc. of the Int. Conf. on Technologies and Applications of Artificial Intelligence, Taichung, Taiwan, pp. 49–53, 2021. [Google Scholar]
49. L. Shen, Q. Liu, G. Chen and S. Ji, “Text-based price recommendation system for online rental houses,” Big Data Mining and Analytics, vol. 3, no. 2, pp. 143–152, 2020. [Google Scholar]
50. Y. J. Hu and S. J. Lin, “Deep reinforcement learning for optimizing finance portfolio management,” in Proc. of the Amity Int. Conf. on Artificial Intelligence, Dubai, United Arab Emirates, pp. 14–20, 2019. [Google Scholar]
51. B. A. Usha, T. N. Manjunath and T. Mudunuri, “Commodity and Forex trade automation using deep reinforcement learning,” in Proc. of the 1st Int. Conf. on Advanced Technologies in Intelligent Control, Environment, Computing and Communication Engineering, Bangalore, India, pp. 27–31, 2019. [Google Scholar]
52. A. Nemavhola, C. Chibaya and N. M. Ochara, “Application of the LSTM-deep neural networks-in forecasting foreign currency exchange rates,” in Proc. of the 3rd Int. Multidisciplinary Information Technology and Engineering Conf., Windhoek, Namibia, pp. 1–6, 2021. [Google Scholar]
53. M. Zare, A. O. Naghshineh, E. Salavati and A. Mohammadpour, “An agent-based model and detect price manipulation based on intraday transaction data with simulation,” Applied Economics, vol. 53, no. 43, pp. 4931–4949, 2021. [Google Scholar]
54. Y. Cao, Y. Li, S. Coleman, A. Belatreche and T. M. McGinnity, “Detecting price manipulation in the financial market,” in Proc. of the IEEE Conf. on Computational Intelligence for Financial Engineering & Economics, London, UK, pp. 77–84, 2014. [Google Scholar]
55. K. Golmohammadi, O. R. Zaiane and D. Díaz, “Detecting stock market manipulation using supervised learning algorithms,” in Proc. of the Int. Conf. on Data Science and Advanced Analytics, Shanghai, China, pp. 435–441, 2014. [Google Scholar]
56. N. C. Uslu and F. Akal, “A machine learning approach to detection of trade-based manipulations in Borsa Istanbul,” Computational Economics, vol. 60, no. 1, pp. 25–45, 2021. [Google Scholar]
57. H. Ogut, M. M. Doganay and R. Aktaş, “Detecting stock-price manipulation in an emerging market: The case of Turkey,” Expert Systems with Applications, vol. 36, no. 9, pp. 11944–11949, 2009. [Google Scholar]
58. A. Li, J. Wu and Z. Liu, “Market manipulation detection based on classification methods,” Procedia Computer Science, vol. 122, no. 3, pp. 788–795, 2017. [Google Scholar]
59. A. Zaborovskaya, V. Zaborovskiy and K. Pletnev, “Possibilities of preventing manipulative transactions on the stock market in the conditions of new industrialization,” in Proc. of the Int. Scientific Conf. on New Industrialization: Global, National, Regional Dimension, Ekaterinburg, Russia, pp. 154–160, 2018. [Google Scholar]
60. S. Youssef, “Stock market manipulation detection using continuous wavelet transform and machine learning classification,” Master Dissertation, American University in Cairo, Egypt, 2021. [Google Scholar]
61. B. Rizvi, A. Belatreche, A. Bouridane and K. Mistry, “Stock price manipulation detection based on autoencoder learning of stock trades affinity,” in Proc. of the Int. Joint Conf. on Neural Networks, Glasgow, UK, pp. 1–8, 2020. [Google Scholar]
62. J. J. Thoppan, “Competitive models to detect stock manipulation,” Communications of the IIMA, vol. 15, no. 2, pp. 1–17, 2017. [Google Scholar]
63. T. Leangarun, P. Tangamchit and S. Thajchayapong, “Stock price manipulation detection using a computational neural network model,” in Proc. of the Eighth Int. Conf. on Advanced Computational Intelligence, Chiang Mai, Thailand, pp. 337–341, 2016. [Google Scholar]
64. S. Sridhar, S. Mootha and S. Subramanian, “Detection of market manipulation using ensemble neural networks,” in Proc. of the Int. Conf. on Intelligent Systems and Computer Vision, Fez, Morocco, pp. 1–8, 2020. [Google Scholar]
65. A. B. Kasgari, M. T. Taghavifard and S. G. Kharazi, “Price manipulation fraud detection by intelligent visual fraud surveillance system,” in Proc. of the Int. Conf. on Control, Decision and Information Technologies, Paris, France, pp. 1646–1651, 2019. [Google Scholar]
66. S. Sridhar and S. Sanagavarapu, “ELM-AD: Extreme learning machine framework for price and volume anomaly detection in stock markets,” in Proc. of the Int. Conf. on Computing and Communications Applications and Technologies, Ipswich, UK, pp. 44–51, 2021. [Google Scholar]
67. T. Mizuta, “Can an AI perform market manipulation at its own discretion? A genetic algorithm learns in an artificial market simulation,” in Proc. of the IEEE Symp. Series on Computational Intelligence, Canberra, Australia, pp. 407–412, 2020. [Google Scholar]
68. C. Yagemann, S. P. Chung, E. Uzun, S. Ragam, B. Saltaformaggio et al., “On the feasibility of automating stock market manipulation,” in Proc. of the Annual Computer Security Applications Conf., New York, USA, pp. 277–290, 2020. [Google Scholar]
69. M. Ahmed, N. Choudhury and S. Uddin, “Anomaly detection on big data in financial markets,” in Proc. of the IEEE/ACM Int. Conf. on Advances in Social Networks Analysis and Mining, Sydney, Australia, pp. 998–1001, 2017. [Google Scholar]
70. K. Golmohammadi and O. R. Zaiane, “Time series contextual anomaly detection for detecting market manipulation in stock market,” in Proc. of the IEEE Int. Conf. on Data Science and Advanced Analytics, Paris, France, pp. 1–10, 2015. [Google Scholar]
71. H. Al-Thani, H. Hassen, S. Al-Maadced, N. Fetais and A. Jaoua, “Unsupervised technique for anomaly detection in Qatar stock market,” in Proc. of the Int. Conf. on Computer and Applications, Beirut, Lebanon, pp. 116–119, 2018. [Google Scholar]
72. R. N. Madurawe, B. I. Jayaweera, T. D. Jayawickrama, I. Perera and R. Withanawasam, “Collusion set detection within the stock market using graph clustering & anomaly detection,” in Proc. of the Moratuwa Engineering Research Conf., Moratuwa, Sri Lanka, pp. 450–455, 2021. [Google Scholar]
73. L. Jin, Z. Liu and Y. Tang, “Auto encoder based = abnormal fluctuations monitoring method,” in Proc. of the Int. Conf. on Big Data, Information and Computer Network, Sanya, China, pp. 768–777, 2022. [Google Scholar]
74. O. Ronneberger, P. Fischer and T. Brox, “U-net: Convolutional networks for biomedical image segmentation,” in Proc. of the Int. Conf. on Medical Image Computing and Computer-Assisted Intervention, Munich, Germany, pp. 234–241, 2015. [Google Scholar]
75. S. R. Abdani and M. A. Zulkifley, “Optimal input selection for single object tracking using rgb-thermal camera,” in Proc. of the IEEE 12th Symp. on Computer Applications & Industrial Electronics, Penang, Malaysia, pp. 283–287, 2022. [Google Scholar]
76. J. Ni, K. Shen, Y. Chen, W. Cao and X. S. Yang, “An improved deep network-based scene classification method for self-driving cars,” IEEE Transactions on Instrumentation and Measurement, vol. 71, pp. 1–14, 2022. [Google Scholar]
77. A. Kamilaris and F. X. Prenafeta-Boldu, “A review of the use of convolutional neural networks in agriculture,” The Journal of Agricultural Science, vol. 156, no. 3, pp. 312–322, 2018. [Google Scholar]
78. S. Sridhar and S. Mootha, “Stock market manipulation detection using feature modelling with hybrid recurrent neural networks,” International Journal of Networking and Virtual Organisations, vol. 26, no. 1–2, pp. 47–79, 2022. [Google Scholar]
79. T. Seth and V. Chaudhary, “A predictive analytics framework for insider trading events,” in Proc. of the IEEE Int. Conf. on Big Data, Atlanta, USA, pp. 218–225, 2020. [Google Scholar]
80. F. Akba, I. T. Medeni, M. S. Guzel and I. Askerzade, “Manipulator detection in cryptocurrency markets based on forecasting anomalies,” IEEE Access, vol. 9, pp. 108819–108831, 2021. [Google Scholar]
81. T. Leangarun, P. Tangamchit and S. Thajchayapong, “Stock price manipulation detection using deep unsupervised learning: The case of Thailand,” IEEE Access, vol. 9, pp. 106824–106838, 2021. [Google Scholar]
82. X. Wang and M. P. Wellman, “Market manipulation: An adversarial learning framework for detection and evasion,” in Proc. of the 29th Int. Joint Conf. on Artificial Intelligence, Yokohama, Japan, pp. 4626–4632, 2020. [Google Scholar]
83. J. Tallboys, Y. Zhu and S. Rajasegarar, “Identification of stock market manipulation with deep learning,” in Proc. of the Int. Conf. on Advanced Data Mining and Applications, Brisbane, Australia, pp. 408–420, 2022. [Google Scholar]
84. P. Chullamonthon and P. Tangamchit, “A transformer model for stock price manipulation detection in the stock exchange of Thailand,” in Proc. of the 19th Int. Conf. on Electrical Engineering/Electronics, Computer, Telecommunications and Information Technology, Prachuap Khiri Khan, Thailand, pp. 1–4, 2022. [Google Scholar]
85. E. M. Martínez, P. McBurney and M. J. Howard, “Learning unfair trading: A market manipulation analysis from the reinforcement learning perspective,” in Proc. of the IEEE Conf. on Evolving and Adaptive Intelligent Systems, Natal, Brazil, pp. 103–109, 2016. [Google Scholar]
Cite This Article
 Copyright © 2023 The Author(s). Published by Tech Science Press.
This work is licensed under a Creative Commons Attribution 4.0 International License , which permits unrestricted use, distribution, and reproduction in any medium, provided the original work is properly cited.
 Downloads
 Citation Tools