
 Submit a Paper
 Propose a Special lssue
 Open Access
ARTICLE

Clustering-Aided Supervised Malware Detection with Specialized Classifiers and Early Consensus
Information Security Engineering, Graduate School of Natural and Applied Sciences, Gazi University, Ankara, 06560, Turkey
* Corresponding Author: Murat Dener. Email:
Computers, Materials & Continua 2023, 75(1), 1235-1251. https://doi.org/10.32604/cmc.2023.036357
Received 27 September 2022; Accepted 30 November 2022; Issue published 06 February 2023
 View Full Text
 Download PDF
Abstract
One of the most common types of threats to the digital world is malicious software. It is of great importance to detect and prevent existing and new malware before it damages information assets. Machine learning approaches are used effectively for this purpose. In this study, we present a model in which supervised and unsupervised learning algorithms are used together. Clustering is used to enhance the prediction performance of the supervised classifiers. The aim of the proposed model is to make predictions in the shortest possible time with high accuracy and f1 score. In the first stage of the model, the data are clustered with the k-means algorithm. In the second stage, the prediction is made with the combination of the classifier with the best prediction performance for the related cluster. While choosing the best classifiers for the given clusters, triple combinations of ten machine learning algorithms (kernel support vector machine, k-nearest neighbor, naïve Bayes, decision tree, random forest, extra gradient boosting, categorical boosting, adaptive boosting, extra trees, and gradient boosting) are used. The selected triple classifier combination is positioned in two stages. The prediction time of the model is improved by positioning the classifier with the slowest prediction time in the second stage. The selected triple classifier combination is positioned in two tiers. The prediction time of the model is improved by positioning the classifier with the highest prediction time in the second tier. It is seen that clustering before classification improves prediction performance, which is presented using Blue Hexagon Open Dataset for Malware Analysis (BODMAS), Elastic Malware Benchmark for Empowering Researchers (EMBER) 2018 and Kaggle malware detection datasets. The model has 99.74% accuracy and 99.77% f1 score for the BODMAS dataset, 99.04% accuracy and 98.63% f1 score for the Kaggle malware detection dataset, and 96.77% accuracy and 96.77% f1 score for the EMBER 2018 dataset. In addition, the tiered positioning of classifiers shortened the average prediction time by 76.13% for the BODMAS dataset and 95.95% for the EMBER 2018 dataset. The proposed method’s prediction performance is better than the rest of the studies in the literature in which BODMAS and EMBER 2018 datasets are used.Keywords
In recent decades, the internet has changed human life by enabling easy access to knowledge, communication, and social interaction [1]. According to International Telecommunication Union’s estimates, the number of people using the internet increased from 1 to 4.9 billion between 2005 and 2021, and approximately 63% of the world population was using the internet in 2021 [2]. This dependence on technology and the rise in the usage of the internet makes information system assets crucial for both individuals and organizations. To protect an organization’s business, reputation, and value, securing information and information assets is of the utmost importance [3].
Malware is the code used for purposes such as disrupting a computer system, stealing, deleting, or encrypting sensitive data, or hacking, altering, or monitoring basic computing functions. There are many kinds of malware, such as viruses, worms, ransomware, and trojan horses, and attacks using such malware have increased significantly recently [4]. When the statistics of the detected malware over the years are examined, it is seen that the number of malware incidents detected in 2013 was 182 million, and this number increased to 1.312 billion by 2021 [5]. Malware is analyzed in two different ways; the process of analyzing a software program without running it is called static analysis, while analyzing the features that a program displays at runtime is called dynamic analysis [6].
At its worst, malware can cause devastating damage to information technology assets, users, cyber-physical systems, and, therefore, the physical world. To detect malware quickly, signature-based, behavior-based, and hybrid malware detection methods can be applied. Signature-based detection uses logic where the analyzed software features match an entry in a malware database [7]. This method cannot detect new or unknown types of malware [8]. Heuristic detection approaches, unlike signature-based detection approaches, can detect both new and variants of malware. On the other hand, by making false-positive detections, it may detect beneficial applications as harmful and be deceived by new avoidance techniques [9]. Although traditional malware detection approaches have been used in the past, machine learning algorithms that can combat the complexity and evolution of malware are now needed [10]. To detect new malware and implement faster malware detection, machine learning and artificial intelligence techniques must be used [1].
In this study, the aim is to present a detection model that performs fast malware detection with high accuracy and f1 score in cases where traditional malware detection methods are insufficient. Supervised and unsupervised learning algorithms are used together to develop the detection model. First, data preprocessing steps are applied, then binary classification is performed by supervised learning algorithms in accordance with the clustering process performed by the unsupervised learning algorithm. Accuracy and f1 scores obtained from different datasets are used to demonstrate the effectiveness of the proposed model.
Our contributions are:
• Combined use of supervised and unsupervised machine learning algorithms in malware detection
• Usage of different combinations of classifiers in different subsets created
• Training and usage of specialized classifiers that can provide better prediction performance in subsets of a dataset
• Decreasing the prediction time with an early consensus approach
The rest of the study is organized as follows: In chapter 2, related studies are examined; in chapter 3, machine learning algorithms, metrics, and datasets are explained; in chapter 4, the proposed detection method is presented; in chapter 5, the results obtained are presented and compared with the studies in the literature; in the last chapter, we perform an evaluation of the study.
In the study [11], a comparative analysis of low-dimensional features and tree-based multiple learning methods are made within the scope of malware detection. For low-dimensional features, 2-gram, 2-gramM, application programming interface–dynamic link library (API-DLL), API, and Windows Entropy Map (WEM) are used. It is seen that WEM features grant the best performance in malware detection among low-dimensional features. The malware detection model [12], which is developed specifically for the detection of malicious joint photographic experts group (JPEG) files, consists of two stages. In the first stage, features are extracted with the MalJPEG feature extractor, and in the second stage, the light gradient boosting method (LightGBM) algorithm is trained using the dataset. In the study [13], a behavior-based malware detection model is presented. The model consists of runtime feature capturing, feature extraction, feature processing, and classifier training stages. In the study [14], which aims to detect malware by using the static and dynamic features of the software, two methods are presented: One based on weighted voting and the other using stacking. The best results in the model are obtained with the weighted rank voting method according to class accuracies. In the study [15], a malware detection model using LightGBM with a special log loss function is presented. The accuracy performances of static methods were examined within the scope of malware detection. In the study [16], it is aimed to effectively detect malware that exploits zero-day vulnerabilities, and for this purpose, an ensemble learning model, in which bagging and boosting methods are used together, is presented.
In the study [17], it is aimed to improve the classification efficiency of malware for the Android operating system. In the presented model, the fuzzy c-means clustering algorithm and LightGBM classification algorithm are used together. In the study [18], a cluster-ensemble malware detection method for Android malware (CENDroid) model developed for the detection of Android malware using static features of the applications is presented. The model tries to reveal whether Android applications are malicious or beneficial by using clustering and ensemble learning together. The predictions made by the CENDroid method using the averaging, weighted average, and stacking methods are realized with higher accuracy, precision, and sensitivity than the predictions made with the base classifiers. In the study [19], it is aimed to detect malware and to reveal the family to which the detected malware belongs. Two different models are proposed to achieve this aim. In the first, a two-stage stacking method with a weighted average is used to predict whether a sample is malicious or not. In the second model, the sample’s feature size is decreased using t-distributed stochastic neighbor embedding (t-SNE), and a model that helps optimize the k-means algorithm’s cluster number is presented. In the study [20], a three-stage model is presented for the detection of Android malware. In the first phase of the model, there is an iterative clustering phase in each view of the training set to create an image-based clustering pattern. The second stage of the model is an information exchange stage performed to transfer each clustering pattern learned in one view to the previous views. In the last stage of the model, a stacking-based classification approach is used to learn the malware detection pattern, utilizing the clustering patterns introduced in the previous two stages.
In the study [21], a hybrid classification model using majority voting is presented. Single and hybrid performances of the classifiers are compared, and the classifier with better performance in terms of accuracy, f1 score, precision, and sensitivity metrics is considered successful. The BODMAS dataset is used in the study, and 375 of 2,381 features are selected using the random forest algorithm. In the study conducted within the scope of binary classification of malware [22], two different converter-based models are presented. The first performs a sequence-based classification using byte sequences extracted from binaries. The second model converts binary files to images and performs image-based classification. The malware in the BODMAS dataset are grouped according to the malware families, and a subset of BODMAS is created with the samples of the malware families that have more than 1,000 samples. The subset of the dataset is used in the study.
In the study [23], a new model is presented to train machine learning models more effectively and quickly. The use of the MalConv method, in combination with global channel gating, improves prediction performance while keeping prediction time at a reasonable level. In the study [24], a model based on the conversion of binary files to grayscale images is presented. In the study, with the EMBER dataset, the model using the grayscale image and convolutional neural networks (CNN) and random forest (RF) classifiers provides 88.04% accuracy and 89.14% f1 score. For the same dataset, prediction is performed with 94% accuracy and 93.4% f1 score after the dataset is converted to a red–green–blue toned image. In the study [25], the aim is to perform the static analysis and detection of malware effectively. To eliminate existing problems, a model is presented that extracts a feature set from a dataset and effectively classifies static portable executable (PE) files. The importance of feature extraction (rather than model creation) is emphasized, and it is stated that artificial neural networks fed with well-extracted features give better performance. Detection of malware with low false positive rates is of great importance for the protection of information system assets. In the study [26], research on the use of uncertainty in malware detection for various datasets, models, and feature types is presented. With the spread of intelligent polymorphic malware, it has become a necessity to develop systems for the effective detection and quarantine of malware. In the study [27], it is aimed to solve the malware detection problem by using static analysis and machine learning. In this context, a two-step model is presented. In the first step, a binary classification model is created using the gradient boosting classifier and EMBER 2018 dataset, and in the second step, a family classification model is created using the CNN algorithm and Virus Modified National Institute of Standards and Technology (Virus-MNIST) Dataset. Related works are presented in Table 1.
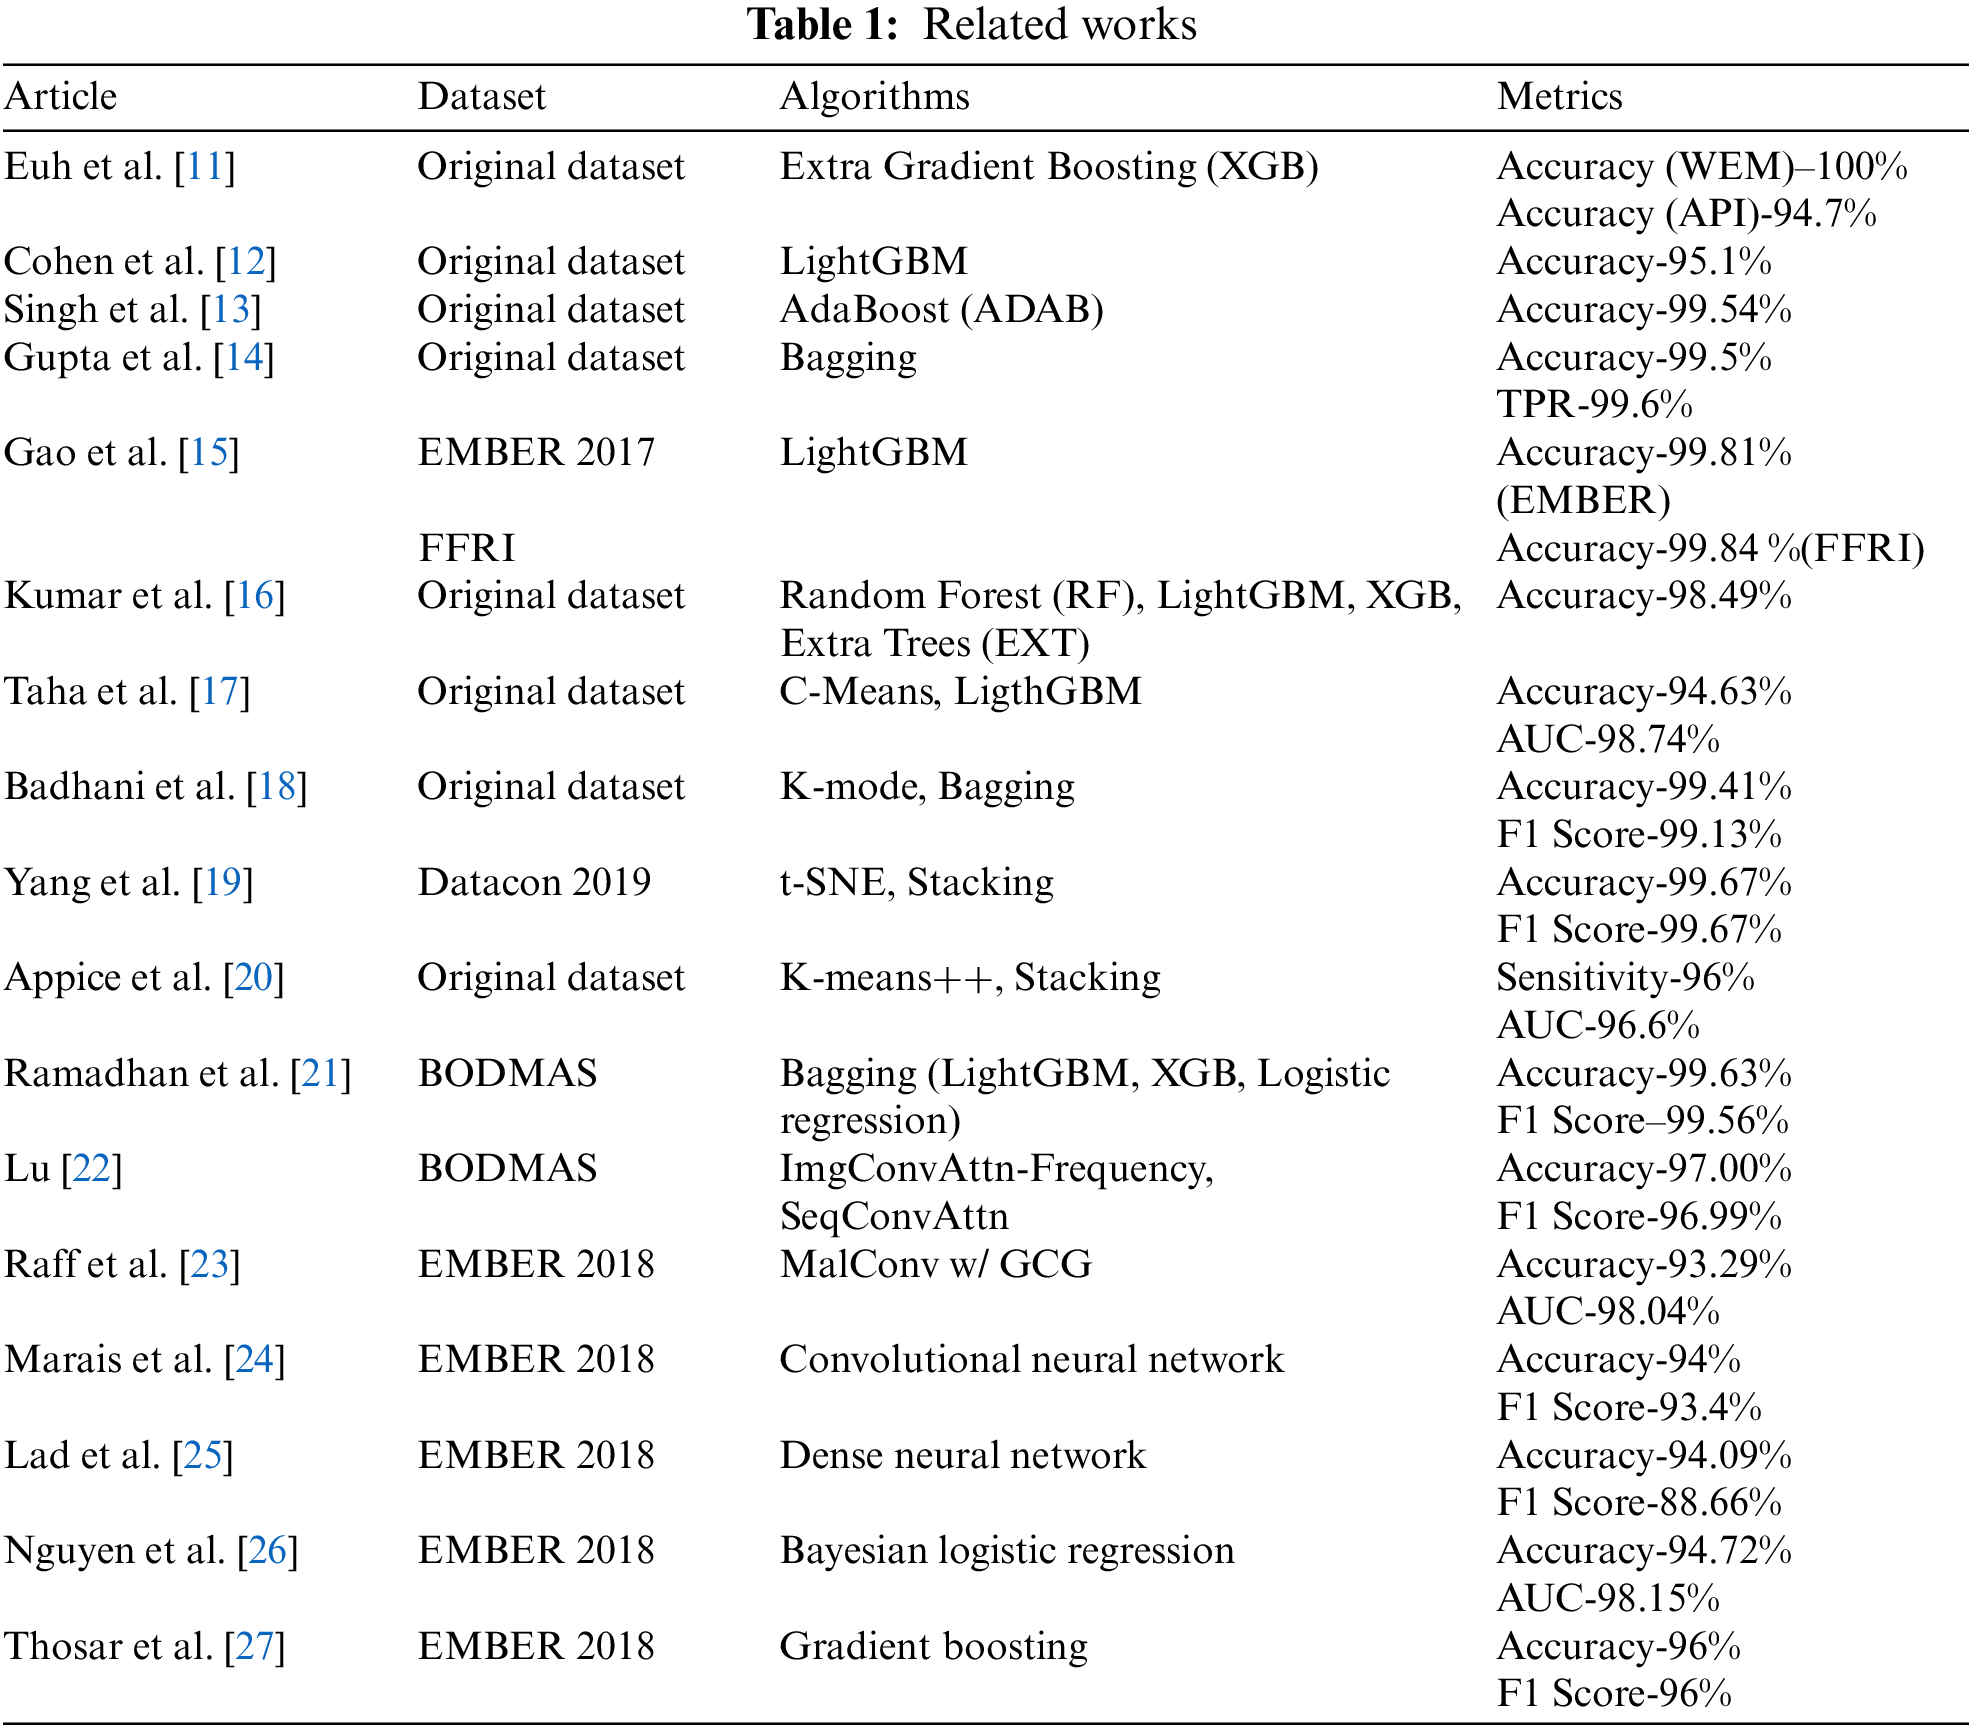
In the studies examined, it is seen that different datasets and different features of malicious software are used. In some of the studies, only binary classification is made, while in others, both binary classification and detection of malware families are carried out. It is seen that supervised and unsupervised learning algorithms are used in very few of the studies in the literature [17–20]. This study differs from the studies in the literature in terms of the combined use of supervised and unsupervised learning algorithms, the staged positioning of classifiers, the usage of classifier combinations, and specialized classifiers.
3 Algorithms and Metrics Used in The Study
During the development of the proposed detection model, supervised and unsupervised machine learning algorithms are used. The k-means algorithm is used for clustering to improve the prediction performance of supervised classifiers. Kernel support vector machine (KSVM), k-nearest neighbor (KNN), naive Bayes (NB), decision tree (DT), random forest (RF), adaptive boosting (ADAB), gradient boosting (GB), extra gradient boosting (XGB), categorical boosting (CATB), and extremely randomized trees (EXT) are used as classifiers.
Accuracy and f1 score metrics are used to select the best classifier combination in the model and compare its performance with existing models.
First, the Kaggle malware detection dataset [28] is used when developing the model. Since this dataset has just 56 features, the speed that is needed during the design phase of the model is provided. This dataset has a total of 216,352 samples (75,503 benign, 140,849 malicious). The BODMAS malware dataset [29] is based on the lack of time-stamped malware samples in the previous PE malware datasets and the lack of well-organized malware family information. This dataset is an up-to-date dataset with 2,381 features for each sample. The RF algorithm is used for feature selection and the 448 most important features are selected. The BODMAS dataset has 134,435 samples (77,142 benign, 57,293 malicious). The EMBER dataset [30] is obtained by using executable files located in or targeting the Windows operating systems. There are three different versions of the EMBER dataset, and this study uses the latest version, EMBER 2018. The RF algorithm is used for feature selection and 448 most important features are selected. The EMBER 2018 [31] dataset has 1,000,000 samples (400,000 benign, 400,000 malicious, 200,000 unlabeled).
In this part of the study, the proposed model and its stages are explained. The presented method consists of three stages: Data preprocessing and clustering, training and selection of classifiers, and model creation.
4.1 Data Preprocessing and Clustering
In the data preprocessing stage, the aim is to process the dataset effectively by the use of machine learning algorithms. This stage consists of “handling missing data,” “feature scaling,” “feature selection,” and “clustering.” Data preprocessing and clustering steps are presented in Fig. 1.
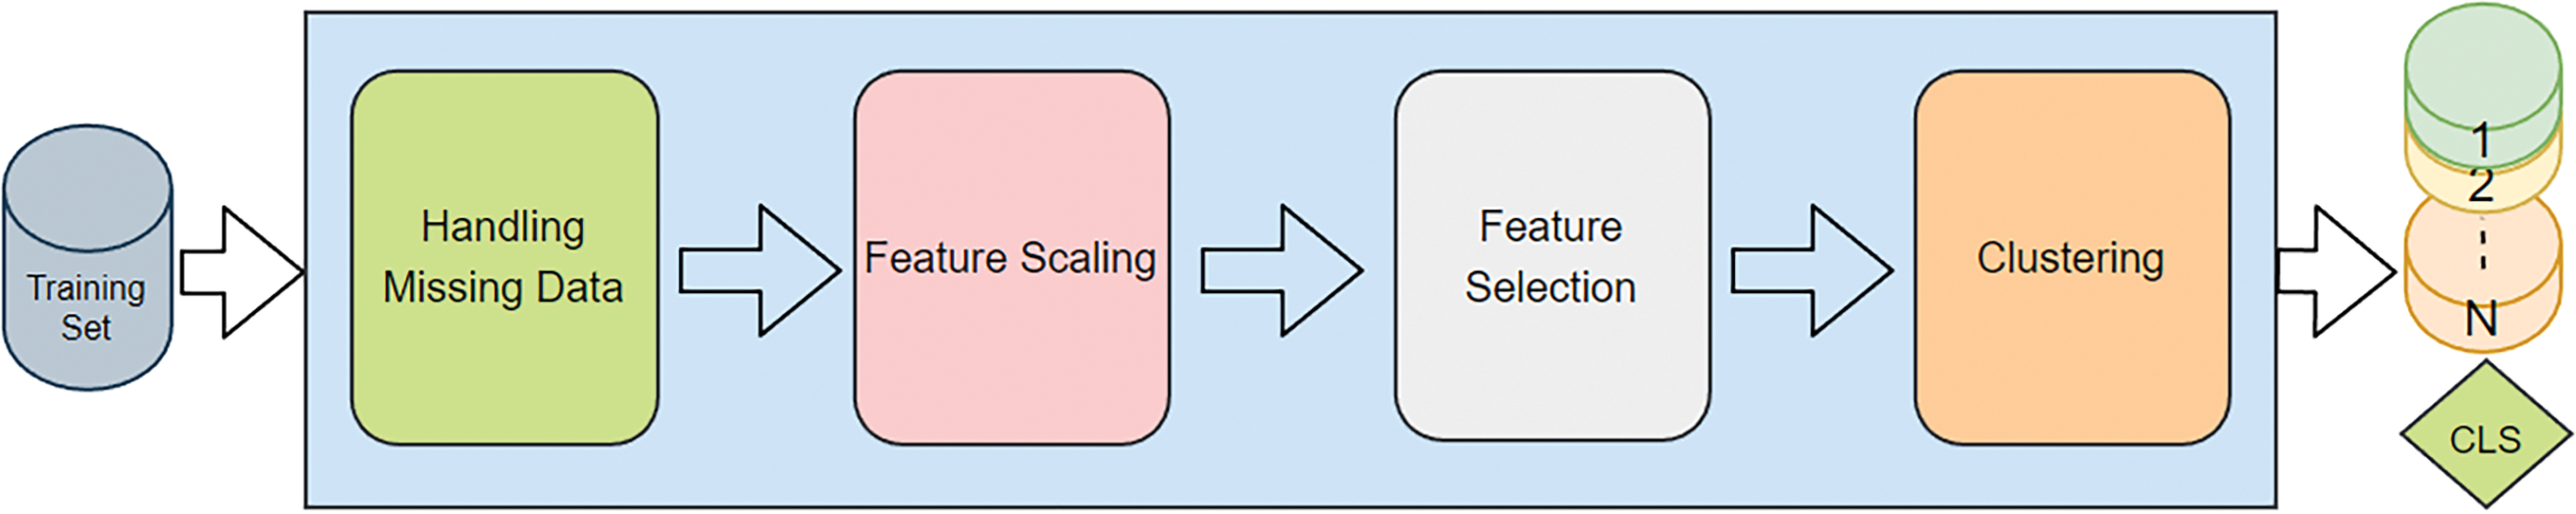
Figure 1: Data preprocessing and clustering
When performing feature extraction using a malware file, it is not possible to obtain all feature values for each malware variant. The management of the missing data is achieved using the “SimpleImputer” library by taking the average of the relevant column and assigning this to be the value of the missing data.
The purpose of feature scaling, also called normalization, is to ensure that the values in the raw data can be processed effectively by various machine learning algorithms. In this step, mean normalization and the “StandardScaler” library are used.
With the feature selection process, the aim is to reduce the additional workload that can be caused by features that are of little relevance in the prediction process of machine learning algorithms. Feature selection is performed using the RF algorithm for the BODMAS and EMBER 2018 datasets. In the first step, feature importance is calculated for all features in both datasets. In the second step, 448 features with the highest importance are determined among 2,381 features, columns with these features are drawn from the datasets, and new datasets to be processed by machine learning algorithms are created. No feature selection is applied for the Kaggle malware detection dataset, which has a total number of 56 features.
In this study, the aim is to increase the prediction performance of the detection approach by performing a clustering operation before the classification process. At this stage, the datasets are divided into clusters using the k-means algorithm. To present the proposed model effectively, the datasets used in this study are divided into three subsets.
4.2 Training and Selection of Classifiers
At this stage, machine learning algorithms are trained using both the entire and subsets of the training dataset. Then, the combination of three classifiers that provides the best prediction for each subset is determined. The steps for training the classifiers and determining the best classifier combination are presented in Fig. 2. The explanations of the sub-steps shown in Fig. 2 are presented below.
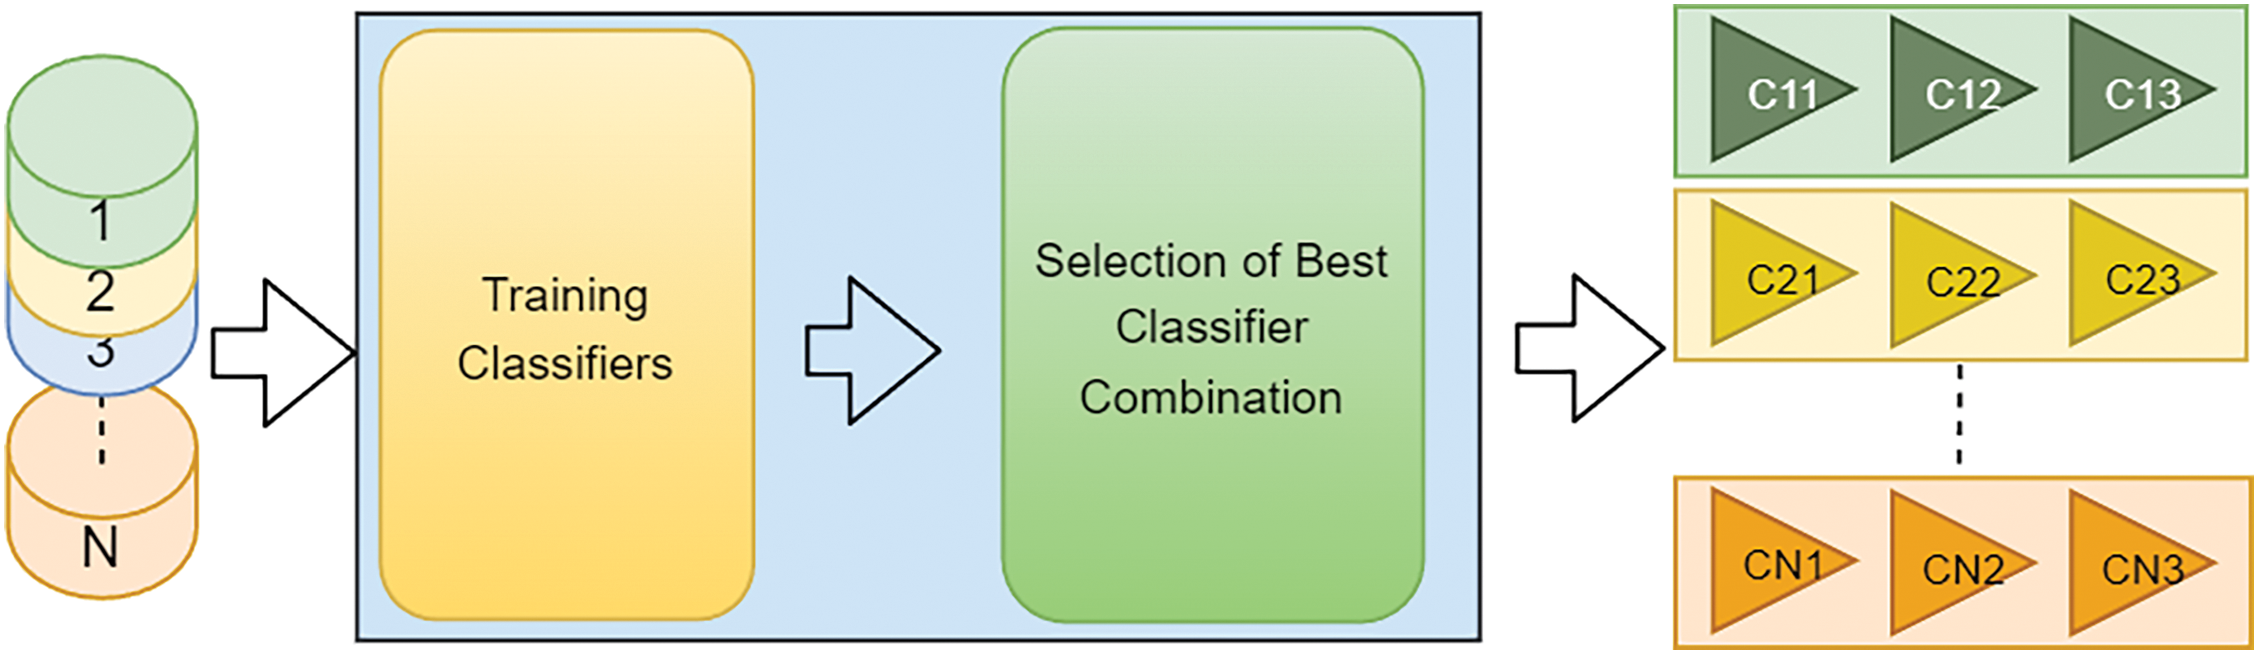
Figure 2: Training and selection of classifiers
At this stage, the classifiers are trained with the entire training dataset and its subsets obtained in the clustering step. The trained classification algorithms are KSVM, KNN, NB, DT, RF, XGB, CATB, ADAB, EXT, and GB. As a result of this step, four classifiers are obtained for each algorithm; one is trained with the whole training set and the others are trained with subsets. Classifiers trained with the whole training set are called general (g) classifiers, and those trained with subsets are called specialized (s) classifiers.
4.2.2 Selection of the Best Classifier Combinations
At this step, the prediction performances of each combination are calculated by taking the triple combination of general and specialized classifiers separately. For each combination, the average of the accuracy and f1 score is calculated to determine the classifier combination with the best performance. The relevant combination is accepted as the best classifier combination for the relevant cluster.
The outputs of the training and selection of classifiers stages are the classifier combinations that perform the best classification for both the whole dataset and the subsets. The notation “C11 C12 C13” in Fig. 2 represents the combination of classifiers that performs the best classification for cluster 1.
At this stage, the classifier with the slowest prediction time of each combination is also determined for the selected classifier combinations. The prediction time performance of the model is improved by using the slowest classifier in the second stage of classification.
After the data preprocessing and classifier selections are completed, a malware detection model is created by combining data preprocessing steps, clustering, and classification algorithms. The proposed model is presented in Fig. 3.
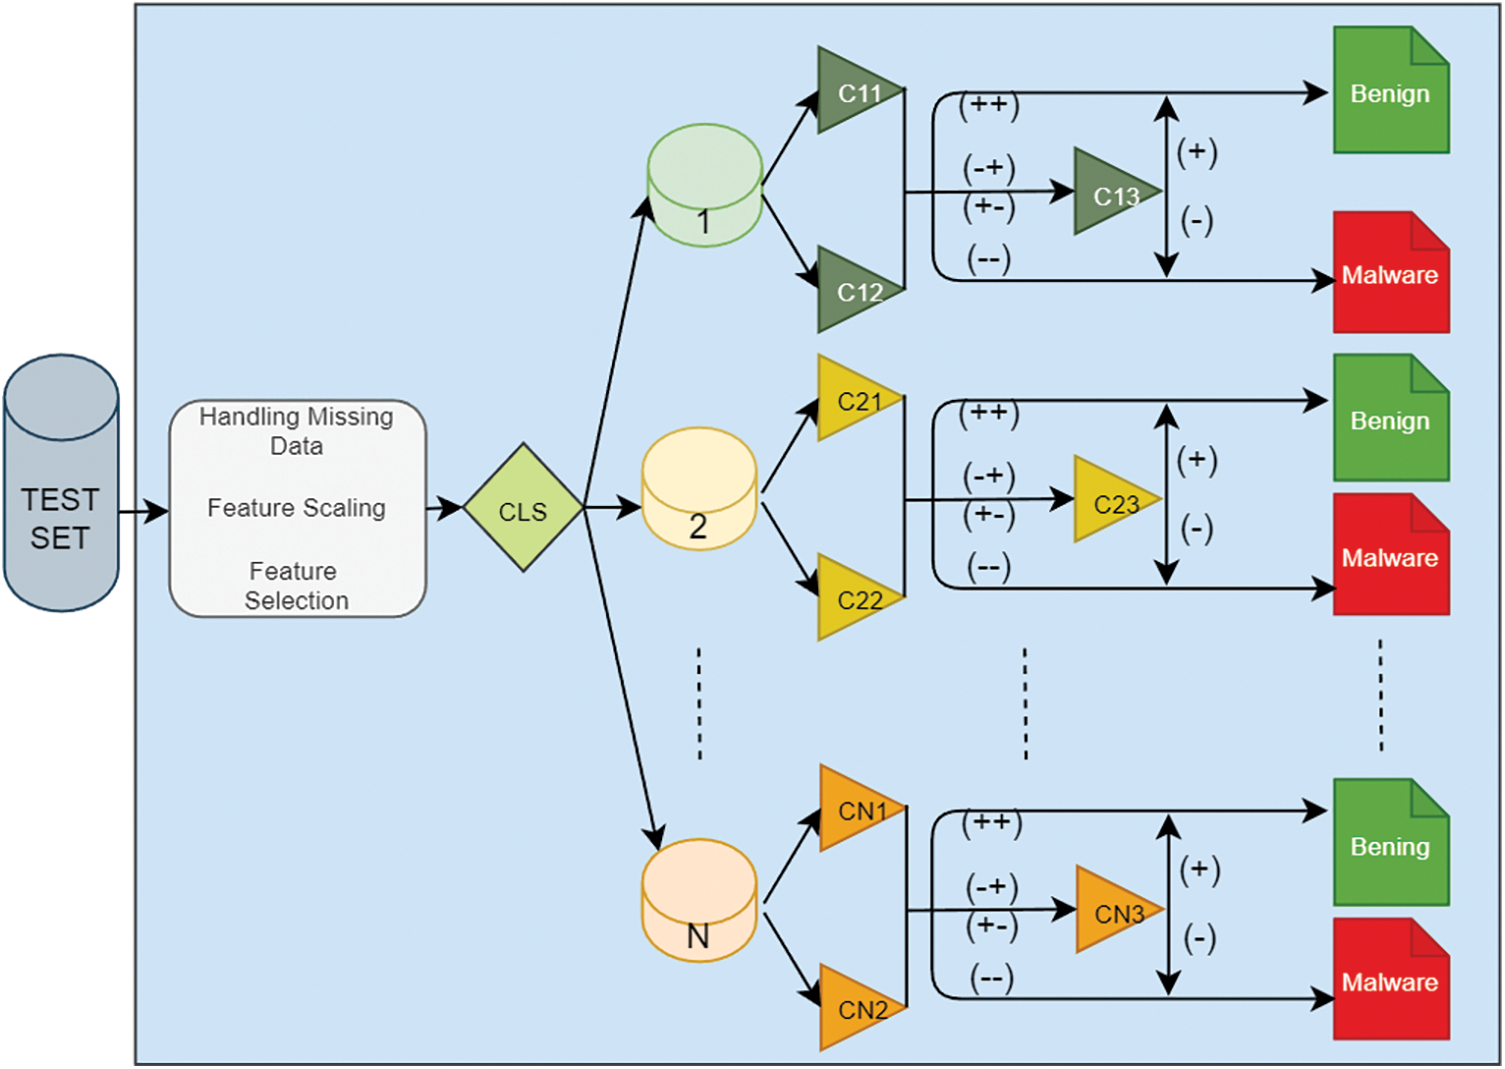
Figure 3: The proposed model
Classification of a sample by the proposed model shown in Fig. 3 is carried out in the following order. First, the sample is processed in the data preprocessing stage. Then the sample is clustered into one of the existing clusters (1, 2, …, N) by the k-means algorithm, which is trained using the training data. In the classification stage, three classifiers (CN1, CN2, CN3) for each subset are used that are determined beforehand. For example, if the sample is clustered in cluster 1, the relevant sample is classified by the C11-C12-C13 classifiers. In the first tier of the classification stage, there are CN1 and CN2 classifiers. In the case that CN1 and CN2 classifiers make the same prediction (benign/malware) on the sample, the sample is tagged with this class. At this stage, the prediction time of the model has improved due to the early consensus. If CN1 and CN2 cannot make a common prediction, then the classification is done by the CN3 classifier.
The study was carried out in Google Colaboratory [32], also known as Colab, which enables Python code to be run through a web browser and is widely used for machine learning, data analysis, and training purposes. Sci-kit Learn [33], PeFile [34], Numpy, Pandas, Time, Typing, Catboost, XGBoost, Drive, Files, CSV, Math, Sys, and Pickle libraries were used during the development of the model.
In this section, first the results obtained during the study are presented, and then the performance of the proposed model is compared with other studies in the literature. In Tables 2–4, the prediction performances for general and specialized classifiers are presented for each dataset used in this study. For each classification algorithm, four classifiers (one general and three specialized) are trained. The values in the row of general classifiers are the performance values of a single classifier. The values under the “Cluster-N” column in the specialized classifier row, with “N” being the cluster number, are the performance values of the classifier of the relevant classification algorithm trained with the subset belonging to the given column. The values under the “Overall” column represent the combined performance value of three specialized classifiers derived from the same algorithm or general classifier performance. The performance values obtained using the Kaggle malware detection dataset are presented in Table 2.
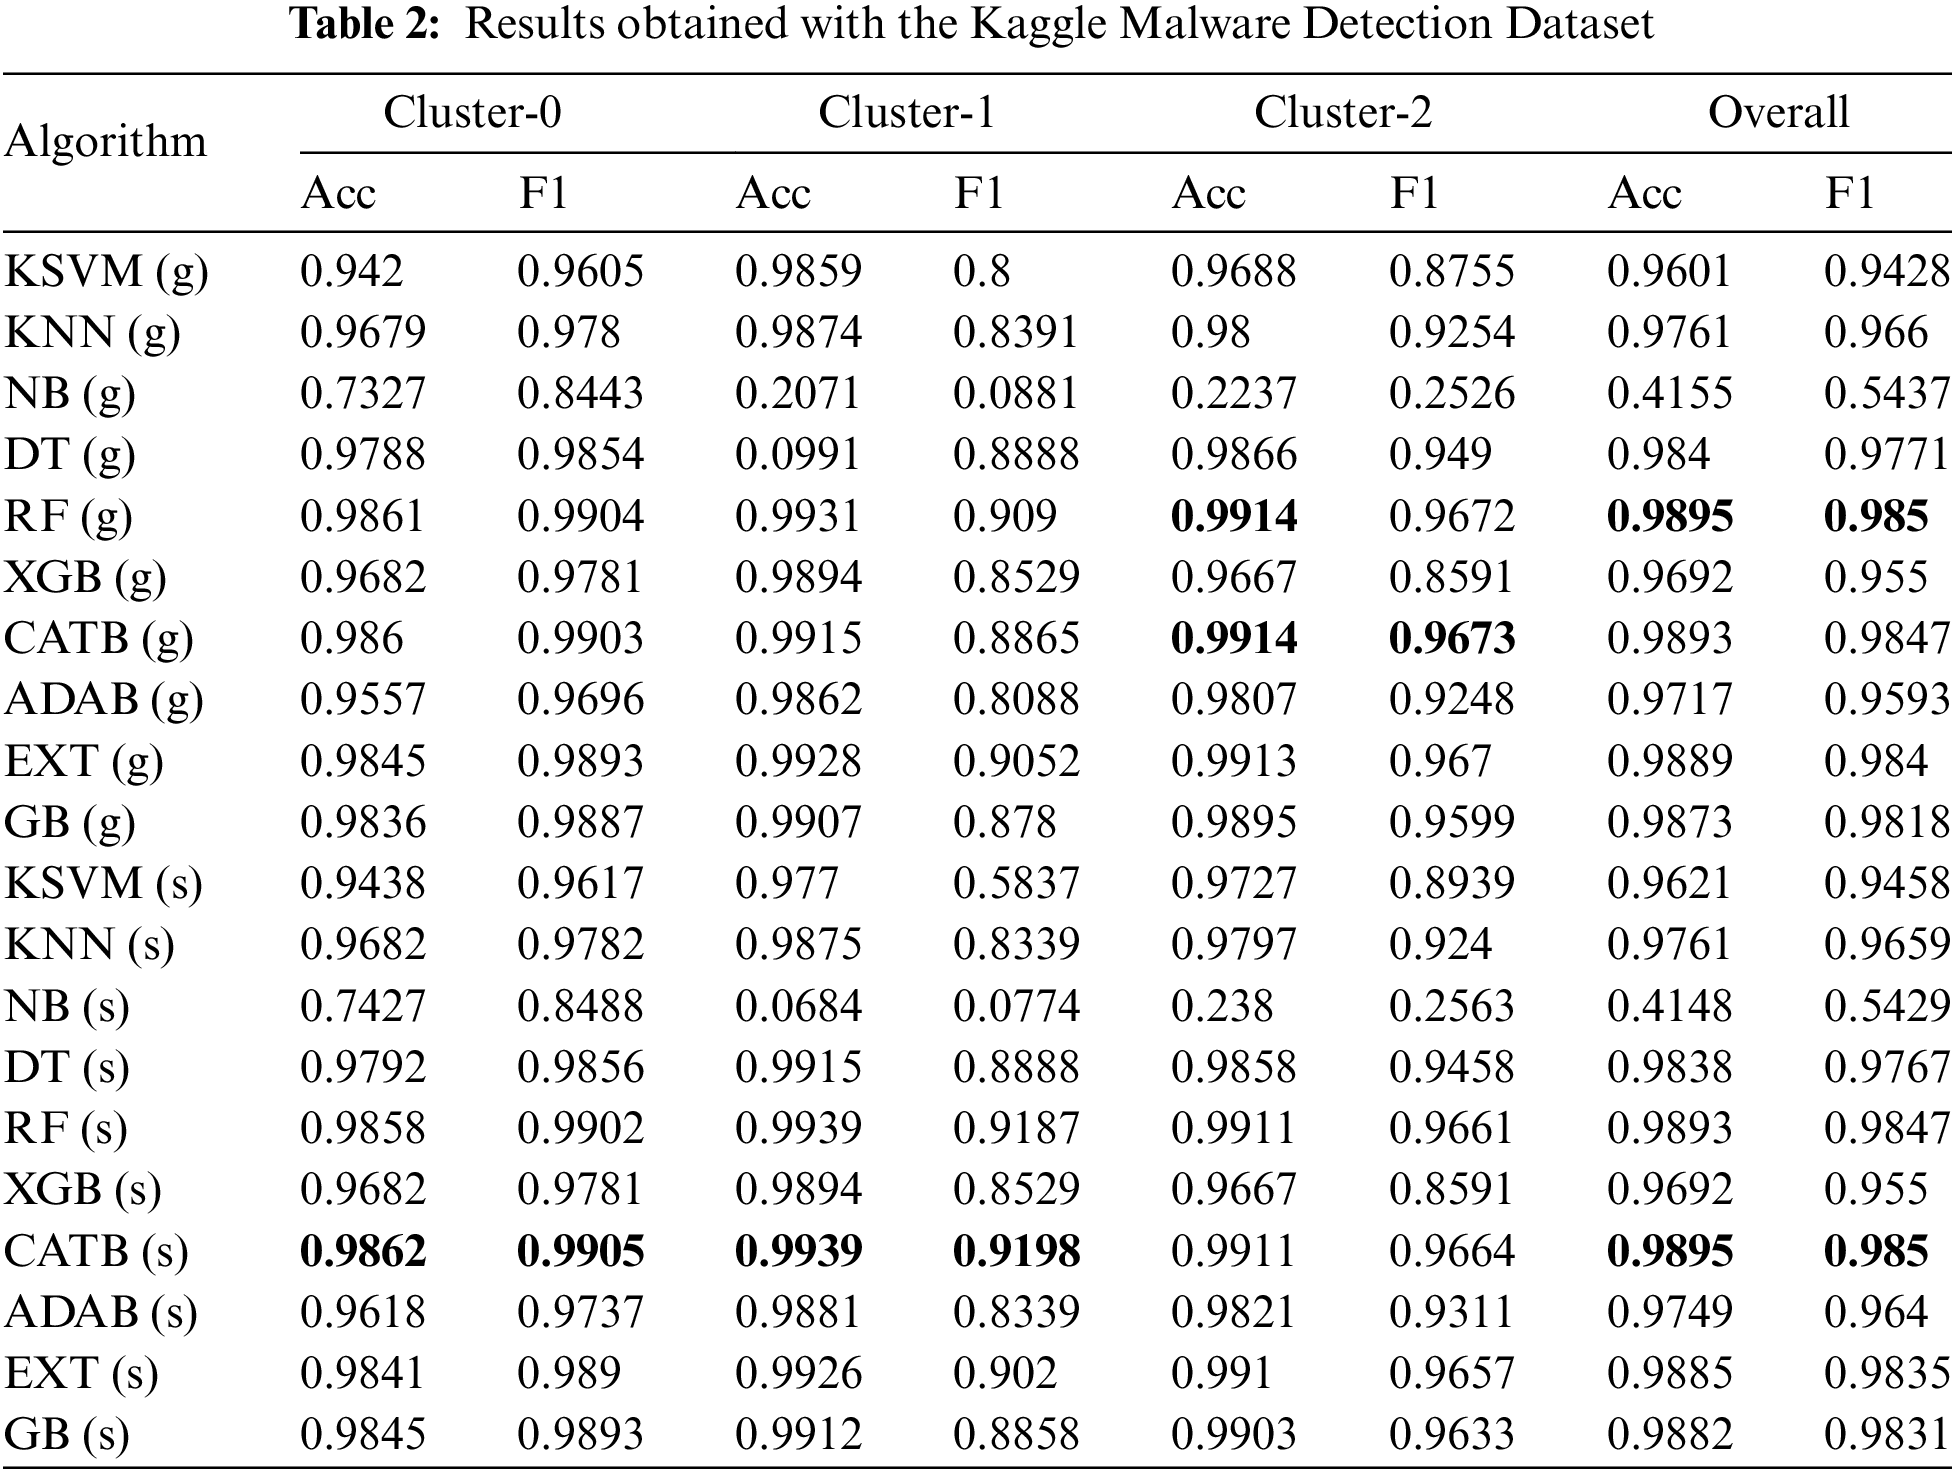
As presented in Table 2, when the prediction performances for general classifiers are examined, the best prediction is performed by the RF (g) classifier with 98.95% accuracy and 98.5% f1 score. The worst prediction is performed by the NB classifier, with an accuracy of 41.55% and an f1 score of 54.37%. When the performance of the specialized classifiers is examined, the best prediction for all three clusters is performed by the CATB (s) classifiers. With the CATB algorithm, 98.62% accuracy and 99.05% f1 score for cluster 0, 99.39% accuracy and 91.98% f1 score for cluster 1, 99.11% accuracy and 96.64% f1 score for cluster 2 are provided. When the combined prediction performance of the specialized classifiers for each cluster is evaluated, it is seen that the CATB classifiers perform the best prediction, with 98.95% accuracy and 98.5% f1 score. The combined prediction performance of the specialized CATB classifiers is higher than the prediction performance of the general CATB classifier. The combined performances of the specialized classifiers are compared with the general classifier performances. The most significant improvement occurred in the ADAB classifier. It is seen that the accuracy performance of the related classifier increased from 97.11% to 97.49%, and the f1 score increased from 95.93% to 96.4%. When the performances of the other classifiers are examined, a partial performance increase in the KSVM, KNN, and GB classifiers, and a limited decrease in the performance of the DT, RF, and EXT classifiers is observed. The performance values obtained for the BODMAS dataset are presented in Table 3.
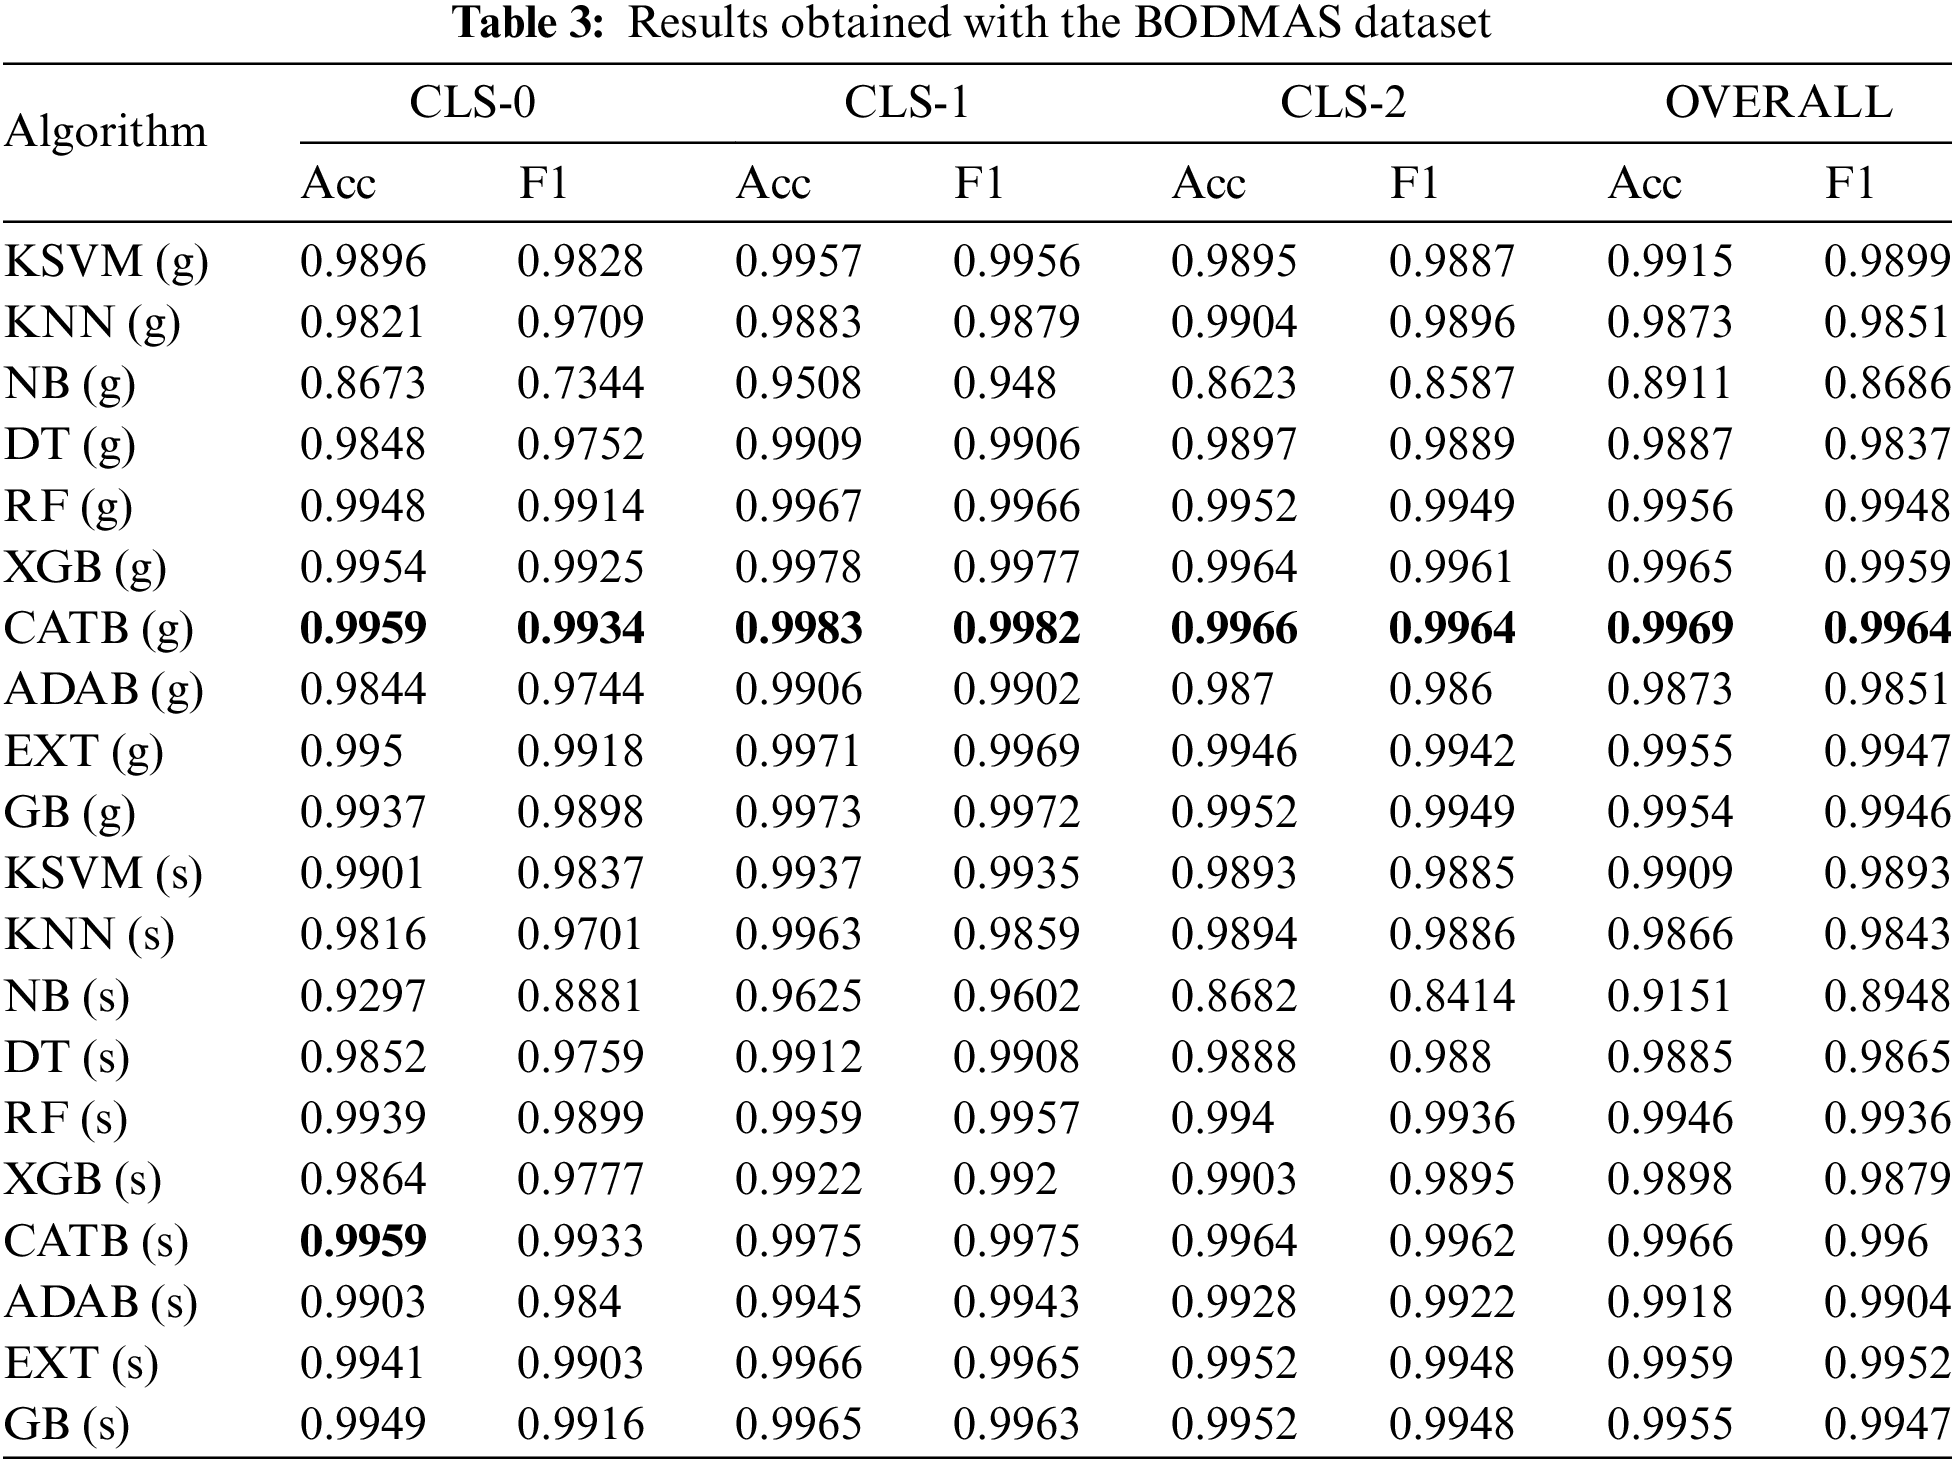
When the prediction performances for the general classifiers presented in Table 3. are examined, it is seen that the best prediction is performed by the CATB classifier, with 99.69% accuracy and 99.64% f1 score. The worst prediction is performed by the NB classifier, with 89.11% accuracy and 86.86% f1 score. When the specialized classifier performances are examined, it is seen that the best prediction for all three clusters is performed by the CATB (s) classifiers. With the CATB algorithm, 99.59% accuracy and 99.33% f1 score for cluster 0, 99.75% accuracy and 99.75% f1 score for cluster 1, 99.64% accuracy and 99.62% f1 score for cluster 2 are provided. When the combined prediction performance of the specialized classifiers for each cluster is evaluated, it is seen that the CATB classifiers perform the best prediction, with 99.66% accuracy and 99.6% f1 score. However, the combined performance of the specialized classifiers is lower than that of the general CATB classifier. The combined performances of the specialized classifiers are compared with the general classifier performances. The most significant improvement is in the NB classifier. The accuracy performance of the relevant classifier increases from 89.11% to 91.51%, and the f1 score from 86.86% to 89.48%. Another algorithm with a significant increase is the ADAB algorithm, whose accuracy performance increases from 98.73% to 99.18%, and the f1 score increases from 98.51% to 99.04%. The XGB algorithm is the only algorithm whose prediction performance drops significantly with the specialized classification approach. The accuracy performance of the XGB algorithm decreases from 99.65% to 98.98%, and the f1 score decreases from 99.59% to 98.79%. The performance values obtained using the EMBER 2018 Data Set are presented in Table 4.
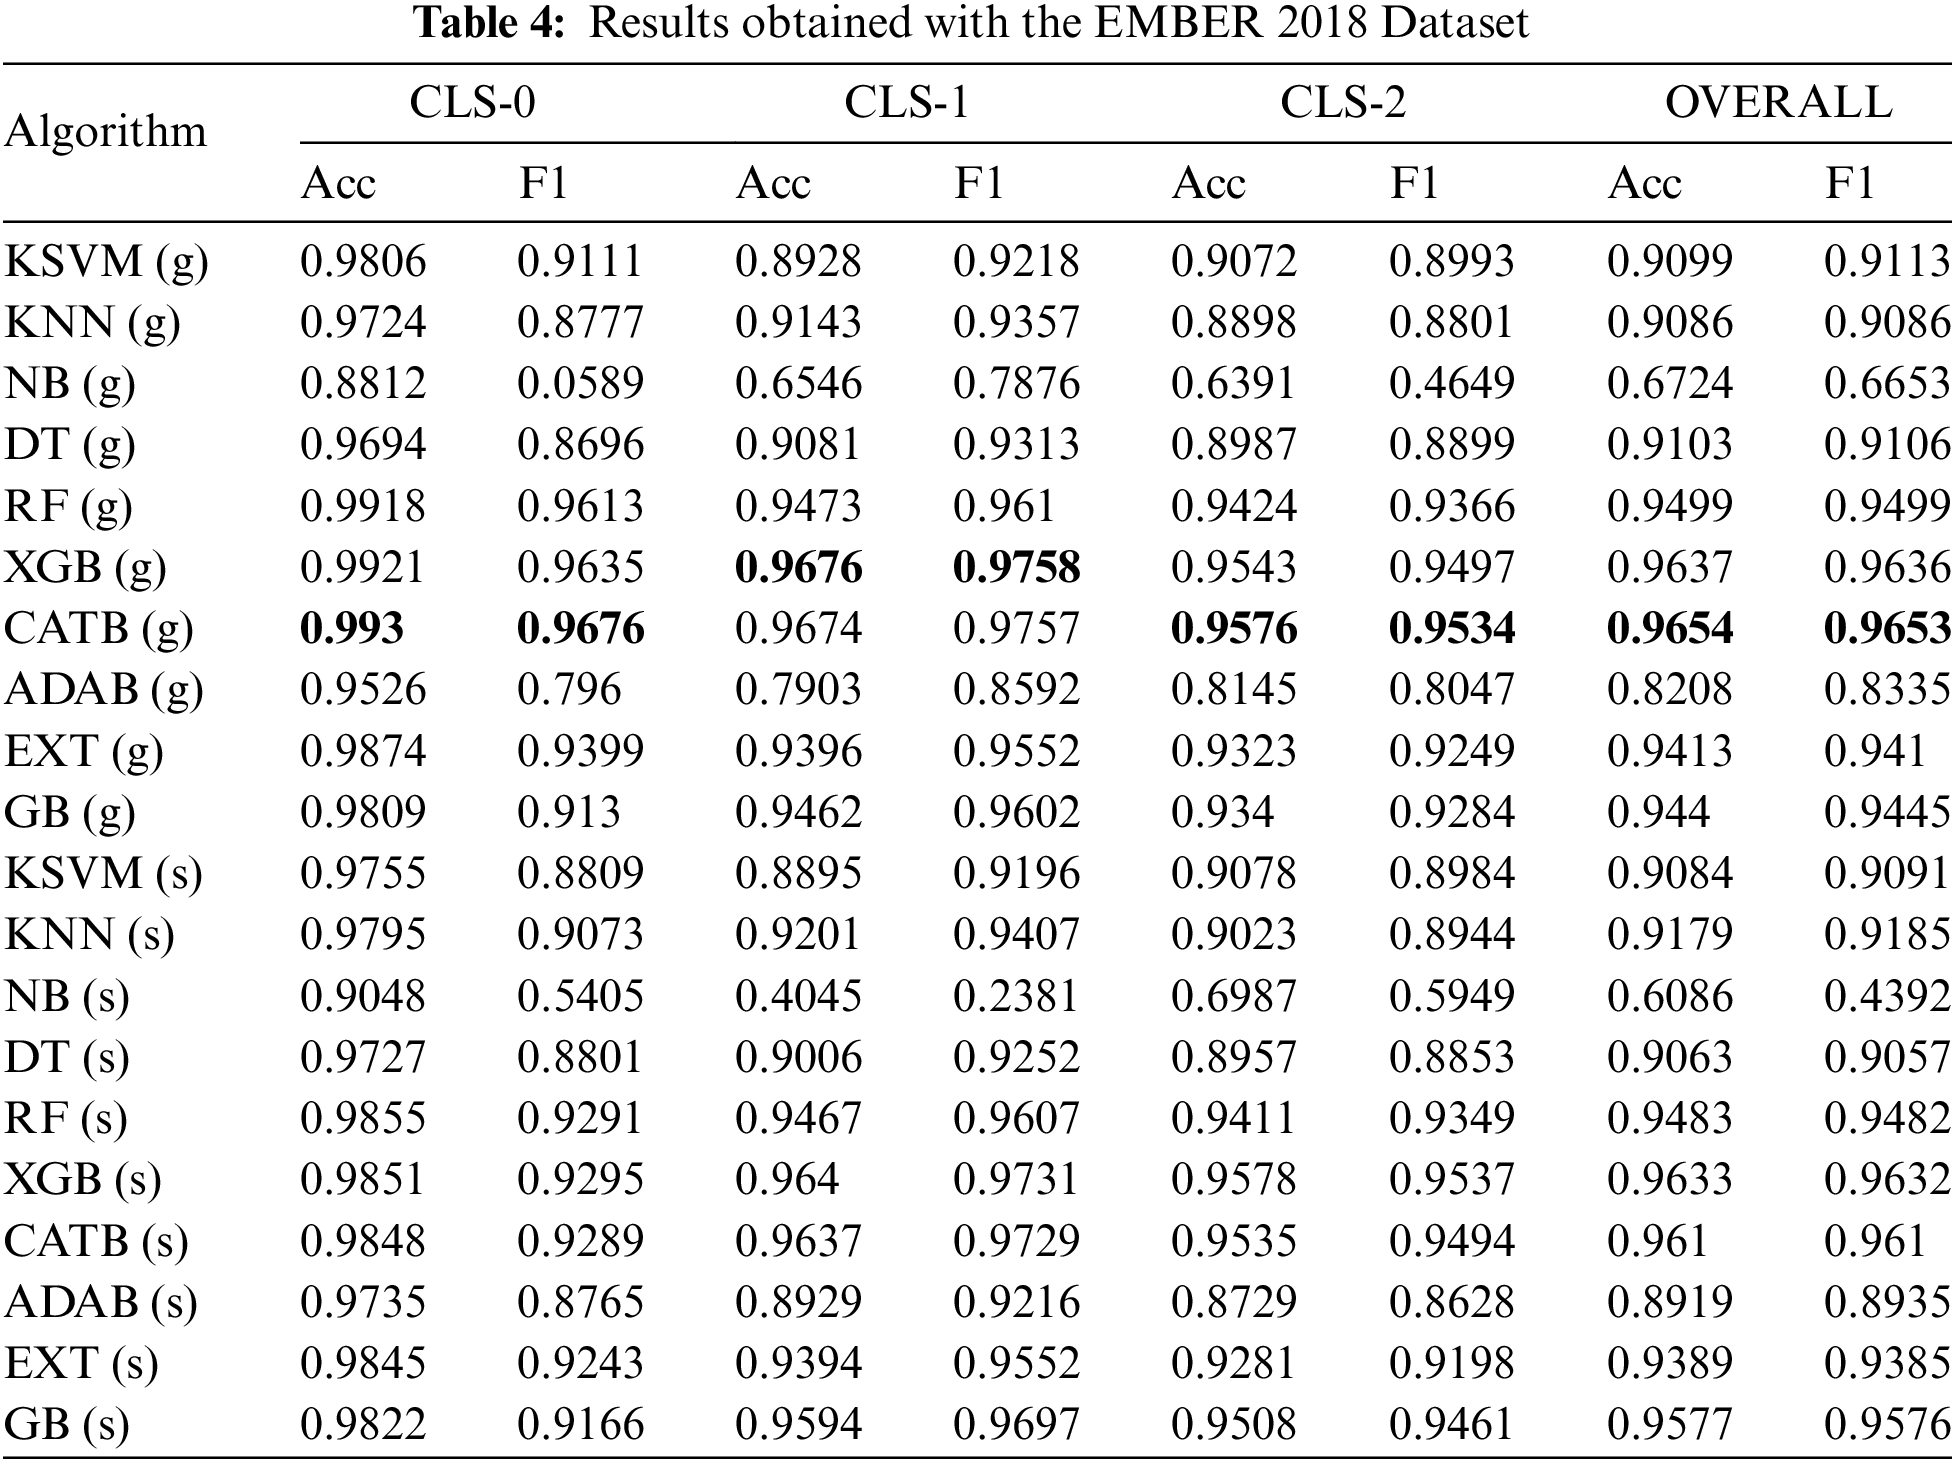
When the prediction performances for the general classifiers presented in Table 4 are examined, it is seen that the best prediction is performed by the CATB classifier, with 96.54% accuracy and 96.53% f1 score. The worst prediction is performed by the NB classifier, with an accuracy of 67.24% and an f1 score of 66.53%. When the prediction performances for specialized classifiers are examined for cluster 0, the RF algorithm provides the best prediction performance, with 98.55% accuracy, and the XGB algorithm, with a 92.95% f1 score. The XGB algorithm performs the best prediction, with 96.40% accuracy and 97.31% f1 score for cluster 1, 95.78% accuracy, and 95.38% f1 score for cluster 2. When the combined prediction performance of the specialized classifiers for each cluster is evaluated, it is seen that the XGB classifiers perform the best prediction, with 96.33% accuracy and 96.32% f1 score. The combined performances of the specialized classifiers are compared with the general classifier performances. Significant improvement is seen in the ADAB and GB classifiers with the use of specialized classifiers. Accuracy for ADAB increases from 82.08% to 89.19%, and the f1 score increases from 83.35% to 89.35%. Accuracy for GB increases from 94.40% to 95.77%, and f1 score increases from 94.45% to 95.76%. The most significant performance decrease is observed in NB, where the accuracy decreases from 67.24% to 60.86%, and the f1 score decreases from 66.53% to 43.92%.
At the stage of creating the model, it is necessary to obtain the best classifier combination of classifiers for each subset of the dataset. While determining the classifier combination that makes the best prediction for each subset, the prediction performance for each combination is obtained by taking triple combinations of the ten classification algorithms used. By taking the arithmetic average of the accuracy and f1 score, the combination with the highest value is selected as the classifier for the relevant subset. In cases where there is equality in the prediction performance of the classifier combinations, the combination with the shortest prediction time is selected as the classifier of the relevant cluster. The best classifier combinations for the datasets used in this study and the subsets of each dataset are presented in Table 5.
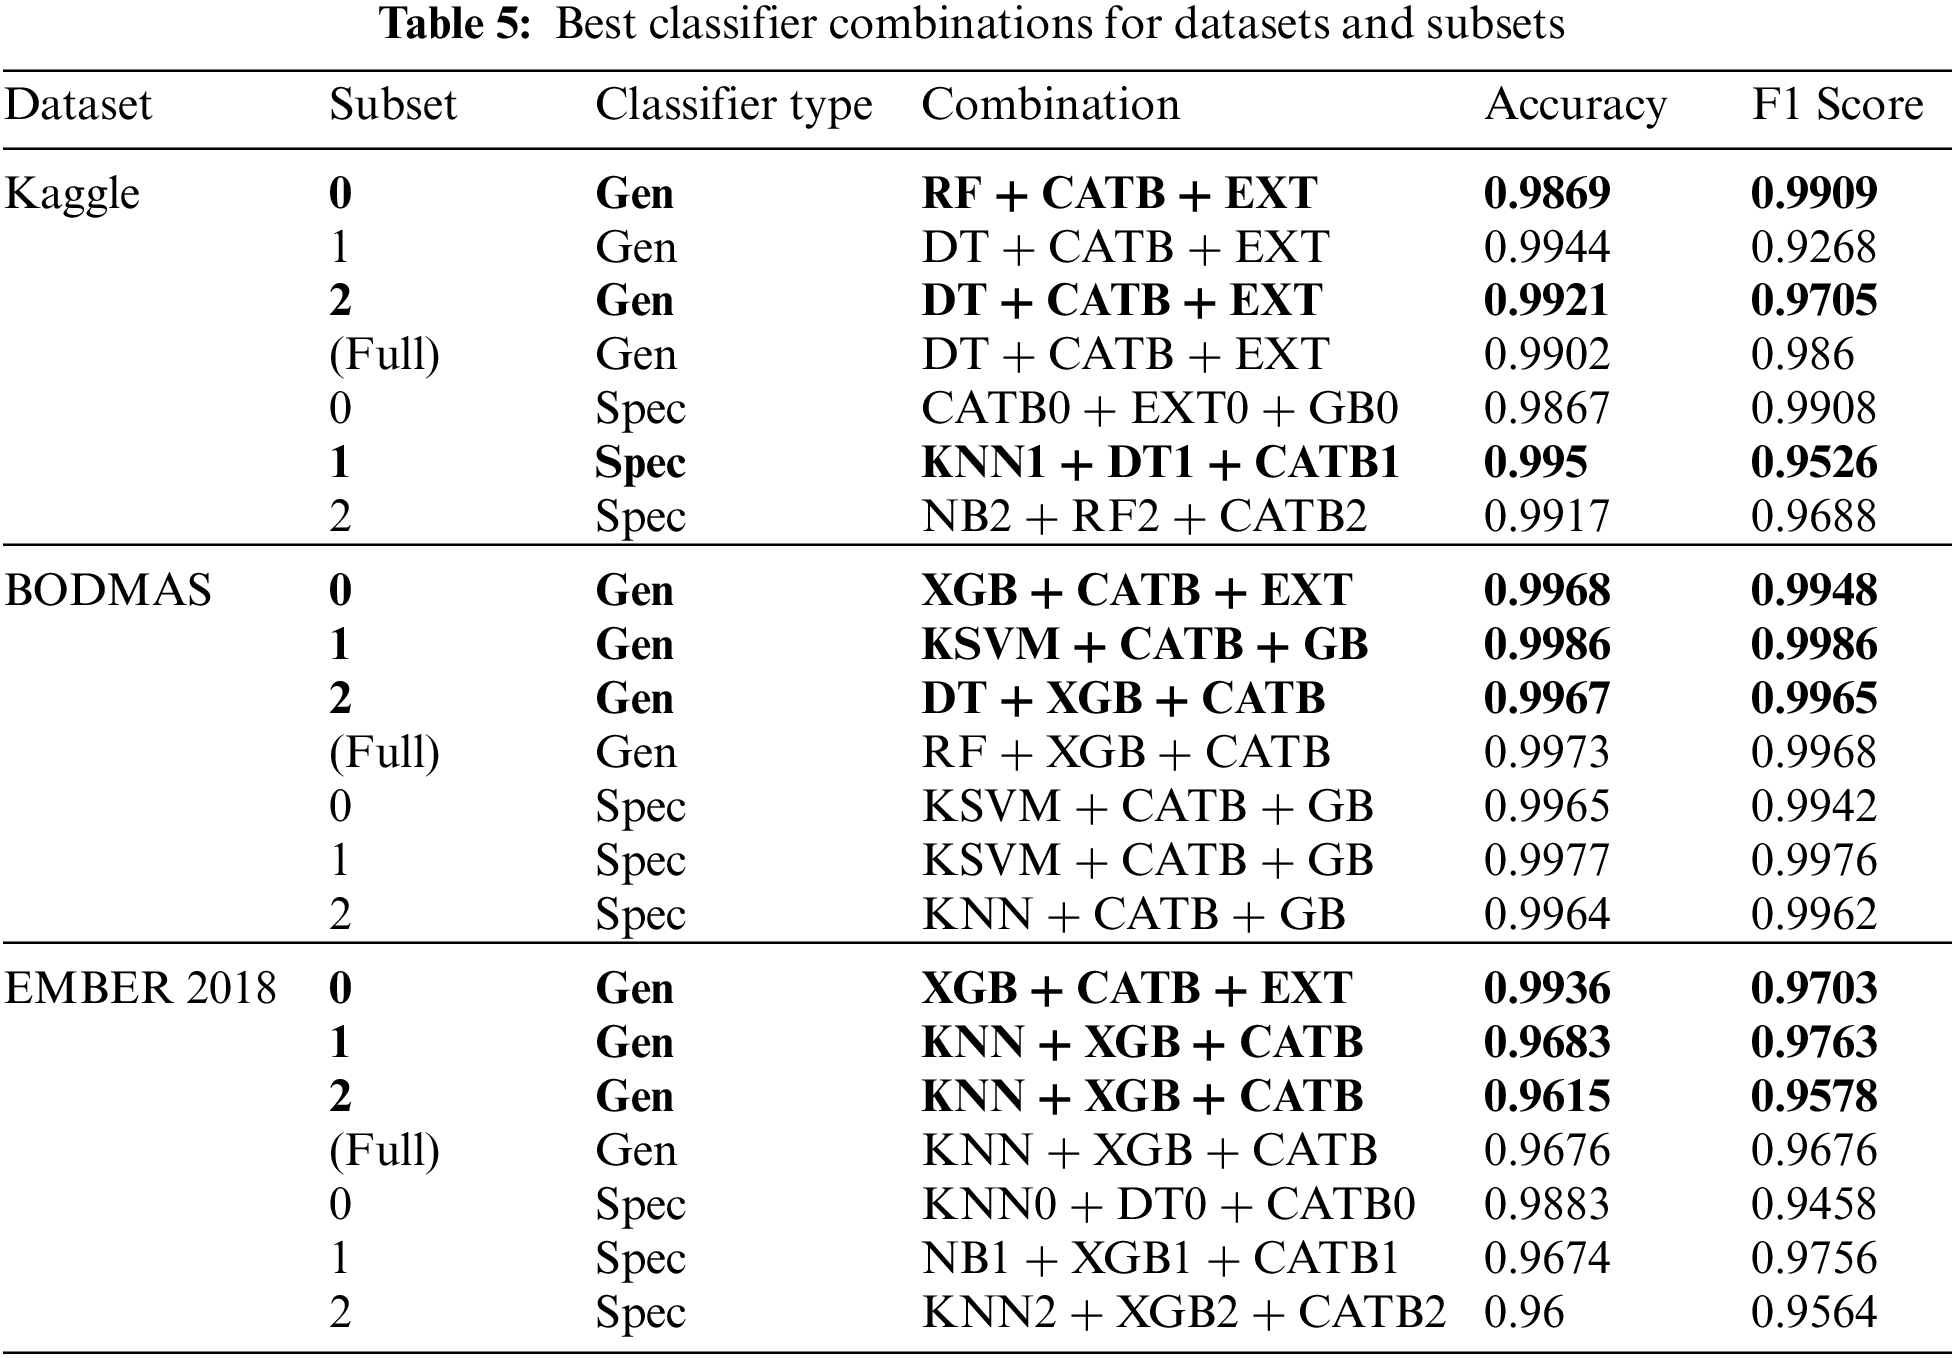
When the results obtained by using the Kaggle malware detection dataset presented in Table 5 are examined, the highest prediction performances were found to be “RF-CATB-EXT” for cluster 0, “KNN1-DT1-CATB1” for cluster 1, and “DT-CATB-EXT” for cluster 2. For the BODMAS dataset, the highest prediction performances are provided by the classifier combinations “XGB-CATB-EXT” for cluster 0, “KSVM-CATB-GB” for cluster 1, and “DT-XGB-CATB” for cluster 2. The best prediction performance for the EMBER 2018 dataset is provided by the combinations of “XGB-CATB-EXT” for cluster 0, “KNN-XGB-CATB” for cluster 1, and “KNN-RF-CATB” for cluster 2.
When the values obtained with the proposed model presented in Fig. 4 are examined, it is seen that the results exhibit higher prediction performance than the prediction performance of both base classifiers and general classifier combinations for all three datasets.
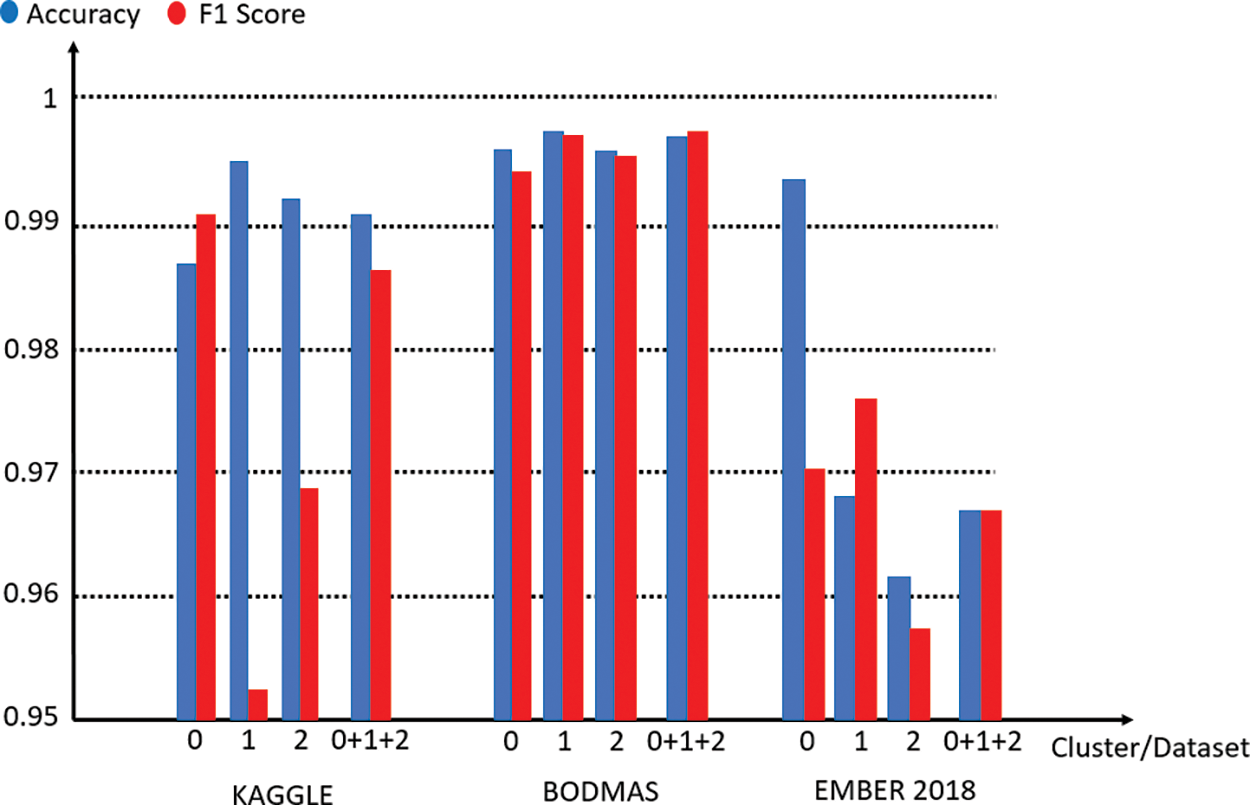
Figure 4: Performance of proposed method for each dataset
One of the aims of the study is to make malware classification faster. For this purpose, triple classifier combinations are positioned in two tiers. Faster classifiers are positioned in the first tier and slower classifiers are positioned in the second tier. The prediction time performance per sample is presented in Fig. 5.
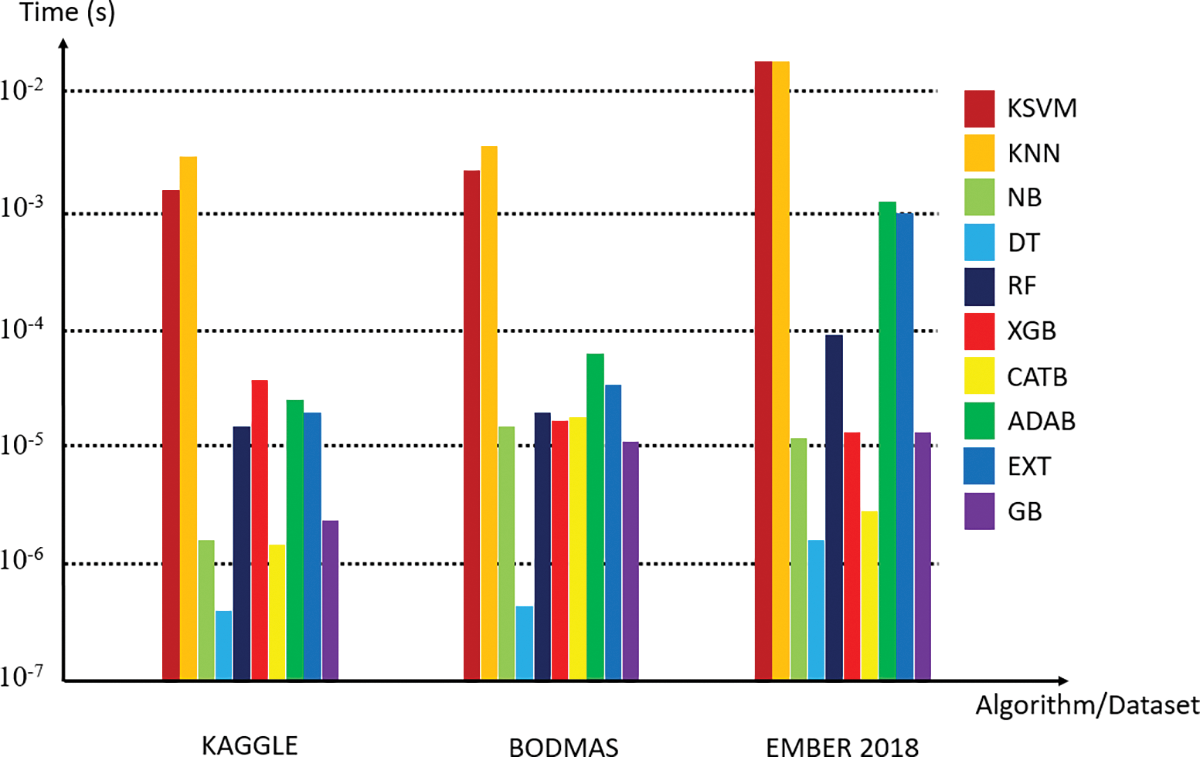
Figure 5: Prediction times per sample for each classifier
Prediction times per sample are given for the classifiers in Fig. 5, and the prediction performance values are taken as the basis in the tiered positioning of the selected classifier combinations.
For each dataset and its subsets, data on how many predictions are made at each tier and how much the tiered positioning approach shortens the prediction time are presented in Table 6.
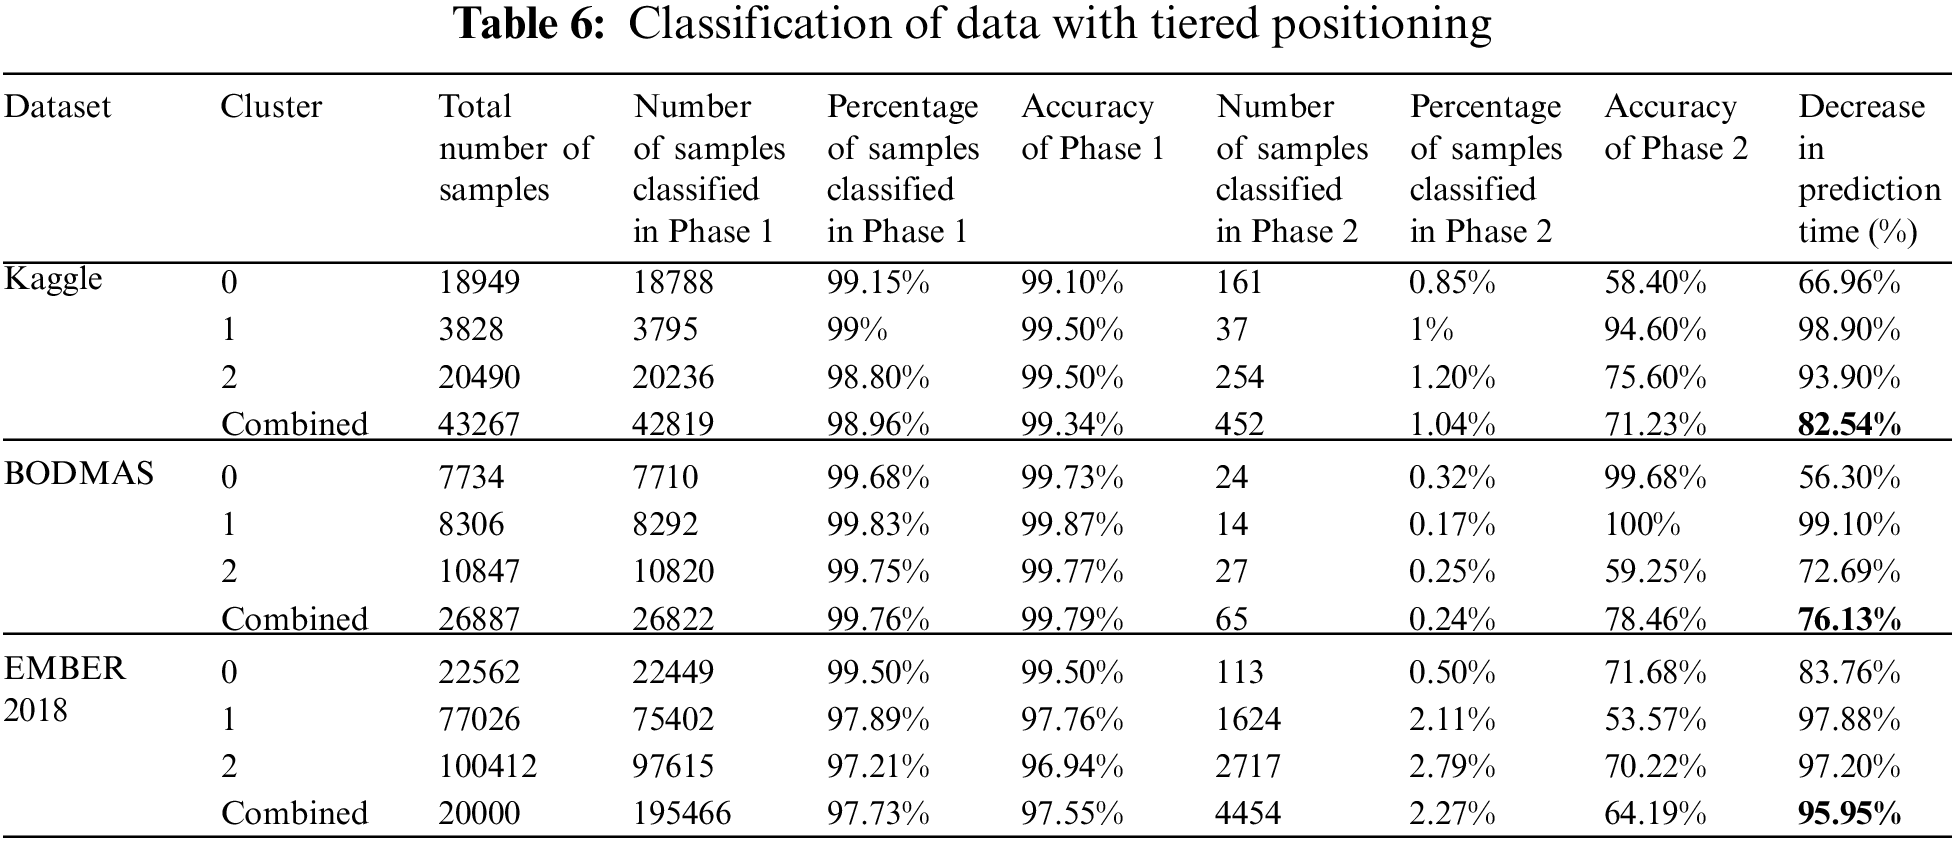
When the data presented in Table 6 are examined, it is seen that 98.96% of the samples for the Kaggle malware detection dataset are predicted in the first tier and the tiered positioning approach provides an 82.54% reduction in the prediction time. 99.76% of the samples belonging to the BODMAS dataset are classified in the first tier, and a 72.69% reduction in prediction time is observed. When the values of the EMBER dataset are examined, it is seen that 97.73% of the samples are classified in the first tier and a 95.95% reduction in the prediction time is achieved. A comparison of the proposed method with other studies in the literature is presented in Table 7.
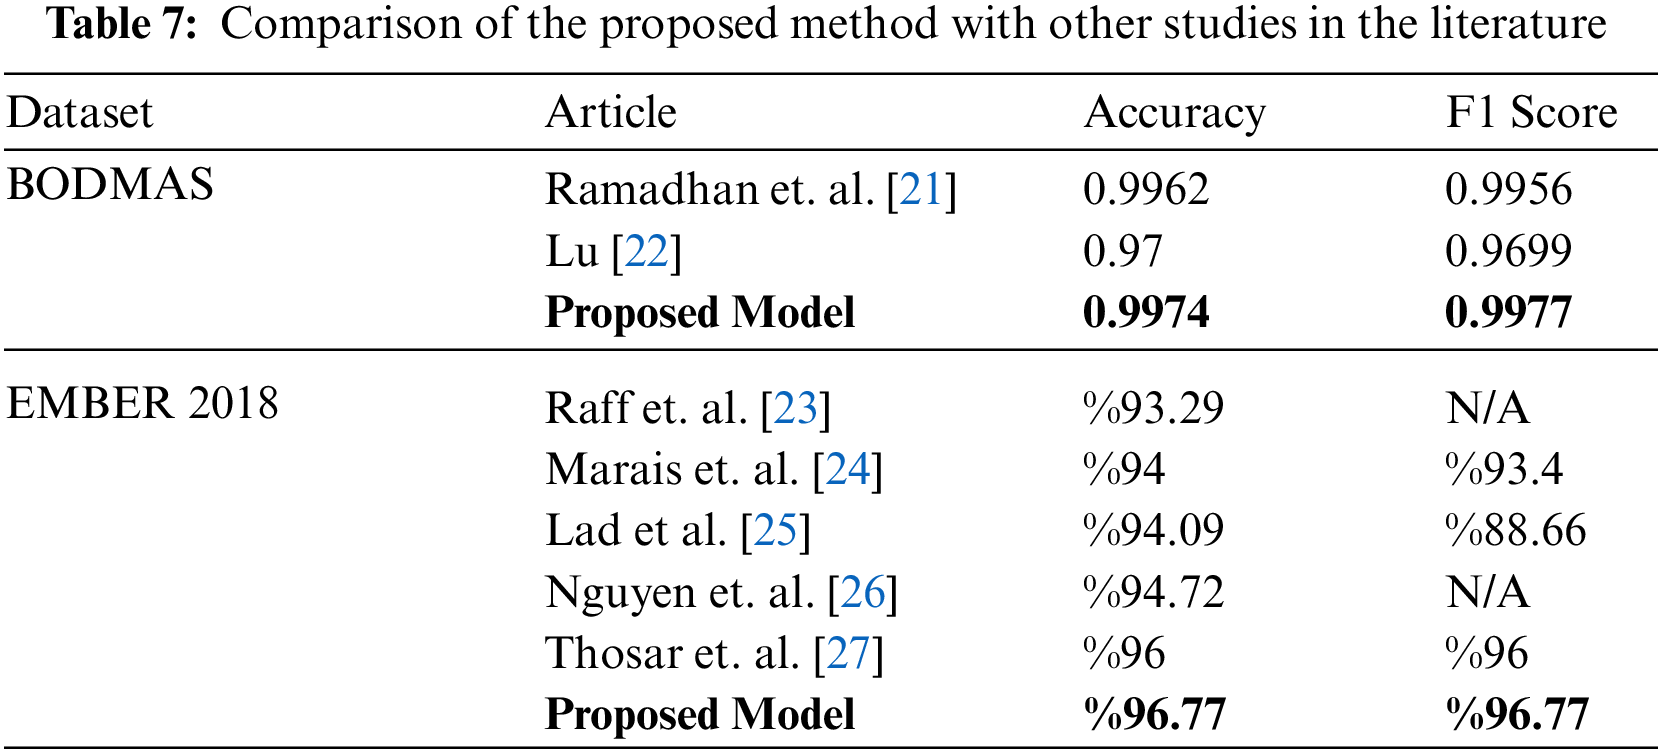
When Table 7 is examined, it is seen that the proposed method has better detection performance than other studies [21,22] performed using the BODMAS dataset. The proposed method’s accuracy is 99.77% and f1 score is 99.77%, which outperforms the following study’s [21] accuracy (99.62%) and f1 score (99.56%). It is also seen that the proposed method has better detection performance than other studies [23–27] performed using the EMBER 2018 dataset. The proposed method’s accuracy is 96.77% and f1 score is 96.77%, which outperforms the following study’s [27] accuracy (96%) and f1 score (96%). Since there is no scientific article found that uses the Kaggle malware detection dataset, it is not included in Table 7.
In this study, the aim was to detect malware quickly with high accuracy and f1 score. In the proposed method, the k-means algorithm is used as an unsupervised learning algorithm, and KSVM, KNN, NB, DT, RF, XGB, CATB, ADAB, EXT, and GB are used as classification algorithms. The Kaggle malware detection dataset, BODMAS dataset, and EMBER 2018 dataset are used to demonstrate the effectiveness of the presented detection approach. To reduce the prediction time of the model, the classifiers are positioned in two tiers. As a result of tiered positioning, it is seen that the prediction time is reduced by up to 95.95%.
It is seen that the specialized classifiers approach used in the model causes a considerable increase and decrease in the prediction performance of some algorithms. The most remarkable effects of specialized classifiers are observed in the EMBER 2018 dataset. Among the classification algorithms used, the greatest improvement is seen in ADAB, with a 7.11% increase in accuracy and a 6% increase in f1 score, when compared to the general ADAB classifier. The performance of the proposed model was compared with other studies [21–27] using the BODMAS and EMBER 2018 datasets, and it is seen that the proposed model provides the best prediction performance for both datasets.
The scope of future studies is as follows: Revealing the effects of clustering algorithms such as DB Scan, Birch, spectral clustering, and hierarchical clustering on the prediction performance of classification algorithms; using clustering algorithms as classifiers for clusters consisting of the same type of samples; and evaluating and improving prediction performance of the classifier positioned in the second tier in the model with novel approaches.
Funding Statement: The authors received no specific funding for this study.
Conflicts of Interest: The authors declare that they have no conflicts of interest to report regarding the present study.
References
1. M. N. Alenazi, H. Alabdulrazzaq, A. A. Alshaher and M. M. Alkharang, “Evolution of malware threats and techniques: A review,” International Journal of Communication Networks and Information Security, vol. 12, no. 3, pp. 326–337, 2020. [Google Scholar]
2. Individuals Using Internet. 2022. [Online]. Available: https://www.itu.int/en/ITU-D/Statistics/Pages/stat/default.aspx. [Google Scholar]
3. S. AlGhamdi, K. T. Win and E. Vlahu-Gjorgievska, “Information security governance challenges and critical success factors: Systematic review,” Computers and Security, vol. 99, no. 4, pp. 1–39, 2020. [Google Scholar]
4. R. Komatwar and M. Kokare, “A survey on malware detection and classification,” Journal of Applied Security Research, vol. 16, no. 3, pp. 390–420, 2021. [Google Scholar]
5. AVTEST Malware Statistics. 2022. [Online]. Available: https://www.av-test.org/en/statistics/malware. [Google Scholar]
6. M. Egele, T. Scholte, E. Kırda and C. Kruegel, “A survey on automated dynamic malware-analysis techniques and tools,” ACM Computing Surveys, vol. 44, no. 2, pp. 1–42, 2012. [Google Scholar]
7. S. J. I. Ismail, Hendrawan and B. Rahardjo, “A survey on malware detection technology and future trends,” in Proc. of Int. Conf. on Telecommunication Systems, Services, and Applications, Bandung, Indonesia, pp. 220–225, 2020. [Google Scholar]
8. A. Souri and R. Hosseini, “A state-of-the-art survey of malware detection approaches using data mining techniques,” Human-Centric Computing and Information Sciences, vol. 8, no. 1, pp. 1–22, 2018. [Google Scholar]
9. Z. Bazrafshan, H. Hashemi, S. M. H. Fard and A. Hamzeh, “A survey on heuristic malware detection techniques,” in 5th Conf.on Information and Knowledge Technology, Shiraz, IRAN, pp. 113–120, 2013. [Google Scholar]
10. L. Singh and J. Singh, “A survey on machine learning-based malware detection in executable files,” Journal of System Architecture, vol. 112, no. 101861, pp. 1–24, 2021. [Google Scholar]
11. S. Euh, H. Lee, D. Kim and D. Hwang, “Comparative analysis of low-dimensional features and tree-based ensembles for malware detection systems,” IEEE Access, vol. 8, pp. 76796–76808, 2020. [Google Scholar]
12. A. Cohen, N. Nissim and Y. Elovici, “Maljpeg: machine learning based solution for the detection of malicious jpeg images,” IEEE Access, vol. 8, pp. 19997–20011, 2020. [Google Scholar]
13. J. Singh and J. Singh, “Detection of malicious software by analyzing the behavioral artifacts using machine learning algorithms,” Information and Software Technology, vol. 121, no. 106273, pp. 1–13, 2020. [Google Scholar]
14. D. Gupta and R. Rani, “Improving malware detection using big data and ensemble learning,” Computers and Electrical Engineering, vol. 86, no. 106729, pp. 1–17, 2020. [Google Scholar]
15. Y. Gao, H. Hasegawa, Y. Yamaguchi and H. Shimada, “Malware detection using lightgbm with a custom logistic loss function,” IEEE Access, vol. 10, pp. 47792–47804, 2022. [Google Scholar]
16. R. Kumar and G. Subbiah, “Zero-day malware detection and effective malware analysis using shapley ensemble boosting and bagging approach,” Sensors, vol. 22, no. 7, pp. 1–23, 2022. [Google Scholar]
17. A. A. Taha and S. J. Malebary, “Hybrid classification of android malware based on fuzzy clustering and gradient boosting machine,” Neural Computing and Applications, vol. 33, no. 12, pp. 6721–6732, 2021. [Google Scholar]
18. S. Badhani and S. K. Mutto, “Cendroid: A cluster-ensemble classifier for detecting malicious android applications,” Computer and Security, vol. 85, no. 3, pp. 25–40, 2019. [Google Scholar]
19. H. Yang, S. Li, X. Wu, H. Lu and H. Han, “A novel solutions for malicious code detection and family clustering based on machine learning,” IEEE Access, Special Section on Security and Privacy in Emerging Decentralized Communication Environments, vol. 7, pp. 148853–148860, 2019. [Google Scholar]
20. A. Appice, G. Andresini and D. Malerba, “Clustering-aided multi-view classification: A case study on android malware detection,” Journal of Intelligent Information Systems, vol. 55, no. 1, pp. 1–26, 2020. [Google Scholar]
21. F. H. Ramadhan, V. Suryani and S. Mandala, “Analysis study of malware classification portable executable using hybrid machine learning,” in Proc. of Int. Conf. on Intelligent Cybernetics Technology & Applications, Bandung, Indonesia, pp. 86–91, 2021. [Google Scholar]
22. Q. Lu, “An investigation on self-attentive models for malware classification,” M.S. theses, University of Alberta, Canada, 2021. [Google Scholar]
23. E. Raff, W. Fleshman, R. Zak, H. S. Anderson, B. Filar et al., “Classifying sequences of extreme length with constant memory applied to malware detection,” in Proc. of the AAAI Conf. on Artificial Intelligence, Virtual Conf., vol. 35, pp. 9386–9394, 2020. [Google Scholar]
24. B. Marais, T. Quertier and C. Chesneau, “Malware analysis with artificial intelligence and a particular attention on results interpretability,” in 18th Int. Conf. on Distributed Computing and Artificial Intelligence, Salamanca, Spain, pp. 43–55, 2021. [Google Scholar]
25. S. S. Lad and A. C. Adamuthe, “Improved deep learning model for static pe files malware detection and classification,” International Journal of Computer Network and Information Security, vol. 2, pp. 14–26, 2022. [Google Scholar]
26. A. T. Nguyen, E. Raff, C. Nicholas and J. Holt, “Leveraging uncertanity for improved static malware detection under extreme false positive constraints,” in Proc. of 1st Int. Workshop on Adaptive Cyber Defense, Montreal, Canada, pp. 1–12, 2021. [Google Scholar]
27. K. Thosar, P. Tiware and R. Jyothula, “Effective malware detection using gradient boosting and convolutional neural network,” in 2021 IEEE Bombay Section Signature Conf., Gwalior, India, pp. 1–4, 2021. [Google Scholar]
28. Kaggle Malware Detection Dataset. 2022. [Online]. Available: https://www.kaggle.com/c/malware-detection. [Google Scholar]
29. L. Yang, A. Ciptadi, I. Laziuk, A. Ahmadzadeh and G. Wang, “Bodmas: An open dataset for learning based temporal analysis of pe malware,” in Proc. of IEEE Security and Privacy Workshops (SPW), San Francisco, CA, USA, pp. 78–84, 2021. [Google Scholar]
30. H. A. Anderson and P. Roth, “Ember: An open dataset for training static pe malware machine learning models,” Arxiv, 1804.04637v2, pp. 1–8, 2018. [Google Scholar]
31. EMBER 2018v2 Dataset. 2022. [Online]. Available: https://github.com/elastic/EMBER. [Google Scholar]
32. Google Colaboratory. 2022. [Online]. Available: https://colab.research.google.com. [Google Scholar]
33. Scikit-Learn. 2022. [Online]. Available: https://scikit-learn.org/stable/. [Google Scholar]
34. PeFile Library. 2022. [Online]. Available: https://github.com/erocarrera/pefile. [Google Scholar]
Cite This Article
 Copyright © 2023 The Author(s). Published by Tech Science Press.
This work is licensed under a Creative Commons Attribution 4.0 International License , which permits unrestricted use, distribution, and reproduction in any medium, provided the original work is properly cited.
 Downloads
 Citation Tools