
 Submit a Paper
 Propose a Special lssue
 Open Access
ARTICLE

Received Power Based Unmanned Aerial Vehicles (UAVs) Jamming Detection and Nodes Classification Using Machine Learning
Department of Computer Engineering, College of Computer Engineering and Sciences, Prince Sattam bin Abdulaziz University, Al-Kharj, 11942, Saudi Arabia
* Corresponding Author: Waleed Aldosari. Email:
Computers, Materials & Continua 2023, 75(1), 1253-1269. https://doi.org/10.32604/cmc.2023.036111
Received 17 September 2022; Accepted 08 December 2022; Issue published 06 February 2023
 View Full Text
 Download PDF
Abstract
This paper presents a machine-learning method for detecting jamming UAVs and classifying nodes during jamming attacks on Wireless Sensor Networks (WSNs). Jamming is a type of Denial of Service (DoS) attack and intentional interference where a malicious node transmits a high-power signal to increase noise on the receiver side to disrupt the communication channel and reduce performance significantly. To defend and prevent such attacks, the first step is to detect them. The current detection approaches use centralized techniques to detect jamming, where each node collects information and forwards it to the base station. As a result, overhead and communication costs increased. In this work, we present a jamming attack and classify nodes into different categories based on their location to the jammer by employing a single node observer. As a result, we introduced a machine learning model that uses distance ratios and power received as features to detect such attacks. Furthermore, we considered several types of jammers transmitting at different power levels to evaluate the proposed metrics using MATLAB. With a detection accuracy of 99.7% for the k-nearest neighbors (KNN) algorithm and average testing accuracy of 99.9%, the presented solution is capable of efficiently and accurately detecting jamming attacks in wireless sensor networks.Keywords
Drone or UAV are aircraft controlled remotely without a human on board. Drones have developed from military operations to support the defense system, by employing modern and advanced technologies (i.e., hardware and software) and become a lower-cost system, with smaller devices, high mobility, and easier to control. UAVs developed for military and civil applications are invariably involved in increasing numbers of incidents [1–5]. Furthermore, UAVs can be classified into various categories according to different criteria such as size, functionality, and wing configuration [6–10]. For example, wing configurations include fixed and rotary wings. The fixed wing can load with a high payload and travel for long distances with maximum speed and is used in the aviation industry. In contrast, rotary wings are equipped with multiple small rotors and can hover vertically and keep stable while flying.
Wireless communication, in addition to the advancing technologies used in UAVs, is an essential component of cybersecurity and has drawn increasing attention in recent years. Because the UAV can hover over the target area and transmit signals at high power, it may affect the communication channels available to legitimate nodes. This is known as the jamming attack in wireless networks. Jamming is one of the worst attacks due to being easy to launch and hard to detect [11–13]. Wireless sensor networks consist of an enormous number of nodes. These nodes exchange their data with each other through multi-hop. Where each node transfers collected data to the next hop until it reaches the sink or destination node.
Security challenges in WSN include jamming attacks, where the jammer transmits a signal towards the target channel, intends to decrease the Signal-to-Noise Ratio (SNR); increases Bit Error Rate (BER), and decreases the Packet Delivery Ratio (PDR) which cause preventing the node from communicating with its neighbors [14,15]. Moreover, by emitting a signal with high power that is considered noise on the receiver side, nodes within the jamming area or near the noise source may not assign themselves to the available channel due to the jamming signal. In this case, the node will keep sensing to find an available channel until its energy depletes or eliminates the jammer from the networks. On the other side, when a node receives collected data from its neighbor during the jammer transmission will be considered to receive a large amount of noise [16,17].
Jamming or intentional interference is classified into several types based on its operation and functionality [18,19]. Furthermore, jamming is an operation in the frequency or time domain. In frequency domain jamming, the jammer adjusts its frequency to disrupt a target channel. When there is more than one channel or subchannels located for WSN nodes, The Frequency Hopping Spread Spectrum (FHSS) technique is used to improve network performance and increase security levels especially when the noise level increases in one subchannel [20]. FHSS is based on the divided channel into subchannels and located narrow band for each subchannel. To avoid jamming, nodes may hop from a targeted subchannel during jamming attacks. However, when a jammer operates in the frequency domain, it may detect a subchannel before emitting a jamming signal. In the time domain, the jammer is starting to transmit and switching to sleep mode at a random time. For example, a constant jammer will keep transmitting a signal at high power until its physically removed from the networks. For a random jammer, the enemy emits a jamming signal at a random time [21,22]. It switches between active and transmitting modes at various times. Barrage, single tone, and successive pulse are other types of jamming attacks and defined for military or electronic warfare purposes, with the same functionality and operation represented in academia [23,24].
In this paper, we proposed a machine learning model for jamming detection and node classification during jamming attacks based on the received signal strength, and distance ratio. By selecting the appropriate features, a machine learning-based model can achieve high detection and classification accuracy. In comparison to centralized jamming detection techniques, the proposed model offers the highest accuracy since it uses only one node and one neighbor to estimate received powers and distance ratios.
The paper is organized, as follows: following the introduction, the literature review describes in Section 2, the jamming attack model describes in Section 3, the proposed jamming detection metrics discusses in Section 4, and the simulation and results are provided in Section 5. Finally, a conclusion is given in section 6.
The detection of deliberate interference or denial of service attacks (i.e., jamming attacks) on WSNs has been proposed in several research papers. In this paper, we investigate how to detect jamming once it emits a malicious signal. We developed an algorithm that classifies nodes during jamming attacks based on machine learning. Multiple studies suggested different approaches to detect jamming based on various measurement metrics.
Detecting a jammer using Bad Packet Ratio (BPR), PDR, and Energy Consumption Amount (ECA), as well as enhancement methods, was reported in [25]. Detection begins by checking the level of PDR, BPR, and ECA; if the values are below the threshold, jamming is considered. Otherwise, no jamming occurs. It relies on the determination and measurement of threshold values to perform this method. The detection mechanism can produce inappropriate results if threshold samples are too sensitive or inaccurate. The second algorithm improves the first algorithm and avoids its disadvantages. When abnormal, neighbor nodes exchange query and reply packets to detect jamming. It not only relies on the relationship between sampled parameters and defined thresholds in a node but also inquiries about neighbor’s parameters to detect jamming.
In [26], the authors proposed a machine-learning model for detecting and classifying four types of jamming. A drone attack was detected using signal-to-noise ratio, energy threshold, signal power, noise power, and Orthogonal frequency Division Multiplexing (OFDM) features; the SNR and energy threshold were used to measure the performance of the networks once a jamming attack begins. In addition, OFDM was recorded by the drone’s Software Defined Radio (SDR) for extracted image features and the number of pixels pooled to reduce computation time. However, the proposed model requires collaboration between the UAV receiver and the data extraction module to extract real-time signal features and images.
In [27] WSN jamming was detected using Exponentially Weighted Moving Average (EWMA) and Packet Inter-Arrival (IAT) features. Stepwise and statistical methods are employed on the cluster head to implement the suggested technique. However, a high level of computation was required by the cluster head for the proposed method.
In [28], the authors propose a method for detecting different types of jamming based on various parameters, including Total Packet Dropped (PDPR), the total packet received, and the total SNR. The presented algorithm relies on a centralized approach whereby each legitimate node sends PDPR, RSS, and SNR to the base station. On the base station, the fuzzy system inference system computes a Jamming Index (JI) based on the Mamdani model, which determines whether or not a node is jammed based on the computed jamming index.
In [29] the authors describe malicious interference countermeasures as a multi-user intelligent game and proposed Game with Post-Decision State (GPDS) anti-jamming secure computing using time-varying channels in the Mobile Edge Computing (MEC) networks. The Nash equilibrium gives the potential optimal channel selection strategy of a deep reinforcement learning multi-user random game with a proposed post-decision state. After multiple steps of training, mobile users can learn the optimal channel-switching strategy.
As proposed in [30], To maximize the quality of the UAV network, include mutual interference among UAVs and external malicious jammers. Multi-Agent Layered Q-Learning (MALQL) is presented as a method to reduce dimensionality and analyze asymptotic convergence in the action space. The proposed algorithm outperforms traditional multi-agent Q learning techniques due to different jamming strategies.
The method of [31] uses deep reinforcement learning and feature engineering to defend jamming in wireless networks. Spectral differences between adjacent time slots provide information about interference patterns, based on the analysis of spectral differences between adjacent time slots. The reinforcement learning environment, including the state space and reward function, is improved through feature engineering, reducing computational complexity effectively by integrating Deep Q Networks (DQNs) and Recurrent Neural Networks (RNNs).
Existing techniques have some drawbacks, such as (i) higher computational complexity at the base station when using a statically applied technique, (ii) network flooding when node information is broadcast to sink nodes, and (iii) inaccurate estimation of measurement metrics due to jamming signals. Considerable types of investigation offered centric node approaches; this strategy required collecting data from jammed nodes and was highly sensitive to noise power (or SNR). As a result of the following, our contribution differs from the literature:
• There is no need to flood the networks or increase the communication overhead between legitimate nodes and base station.
• It uses distributed techniques for detecting jamming and classifying nodes based on the information received from the jammer and the estimated distance ratios.
• It can detect and classify nodes into jammed, unjammed, and edge nodes.
• There is a reduction in computational complexity due to no need for implementing additional hardware or estimating measurement metrics such as packet delivery ratio, total packet drops, energy consumption, the total packet sent, etc.
The jammer UAV (J) uses a high-power signal to target the physical layer of communication to reduce the SNR below the receiver threshold (
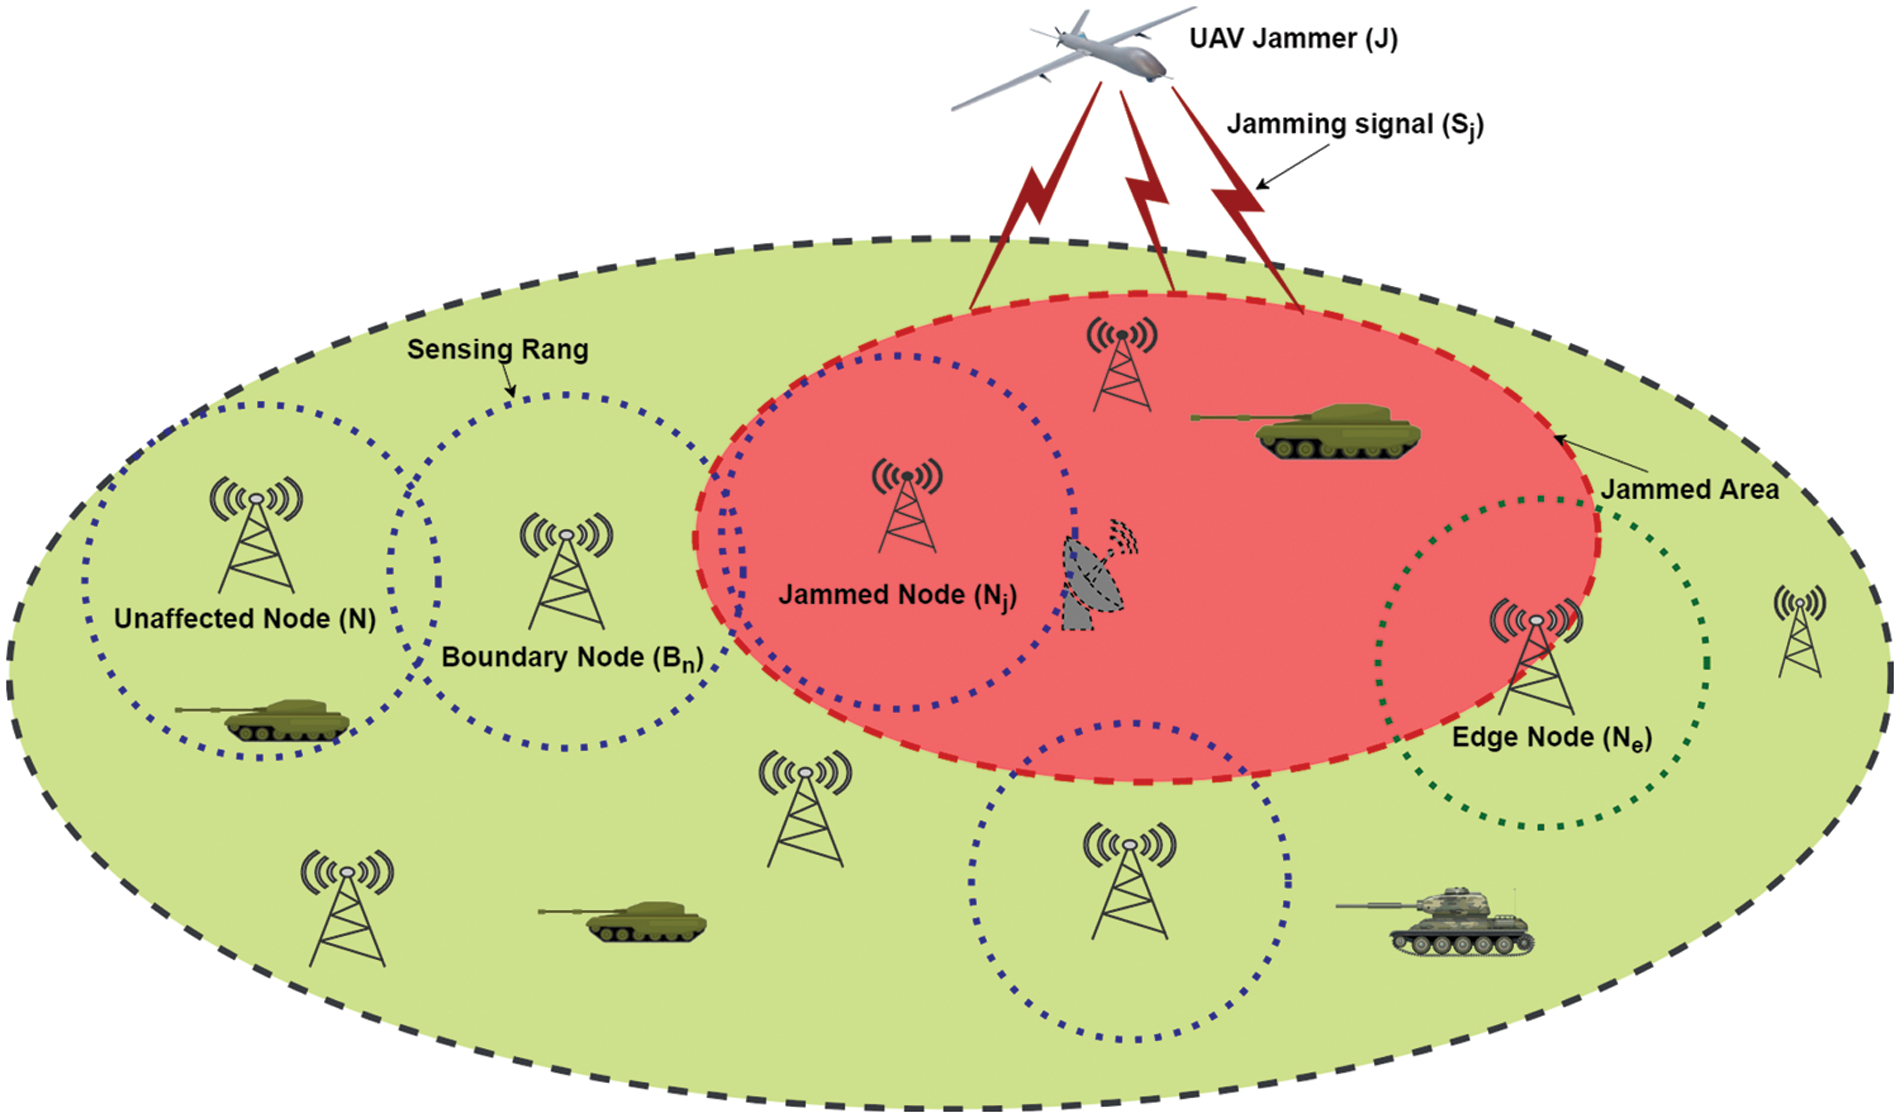
Figure 1: Jammer UAV targeted ground-based base stations, where green stations represent unaffected nodes and blue represent jammed nodes inside the red circle. The sensing range is depicted by blue dots and the jamming region by red dots
Where
where the jamming received power is depicted as
where
And
where the
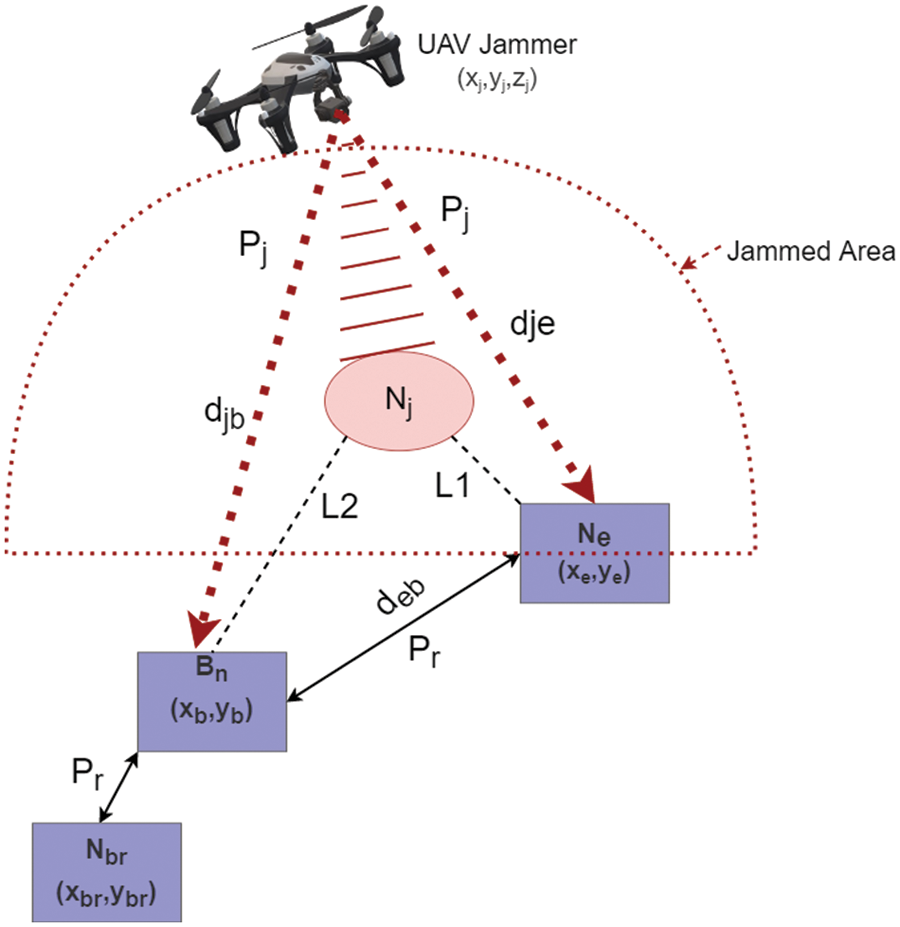
Figure 2: A representation of the link quality and JRSS as the jammer moves. The red dots indicate the jamming signal received by the base station. Solid black lines represent the power received by the boundary node from its neighbor, and the dots represent the connection between the nodes
4 Proposed Jamming Detection Metrics
Now, we present a distributed jamming detection technique. In this method, nodes estimate jamming detection metrics by collaborating with their neighbors. The only input required to be sent by the node’s neighbor is the received signal strength (RSS). To detect the presence of a jammer UAV, RSS, and distance ratios were selected. The RSS is the power received by the node and is described in Eq. (2). When the node received power from its neighbor during jamming transmitting its signal, the node considers receiving a large amount of noise. This indicates not only other nodes transmitting a packet at the same time but also jamming targets the node. Therefore, the SNR and distance ratios are used as the main factor to detect the presence of jammers and classify nodes. SNR is also known as signal-to-jammer power ratio (SJR) in the presence of a jammer and is calculated as the ratio of received power to total noise including the jamming power. Nodes may have different SNR values depending on the amount of noise received as presented in Eq. (5):
The distance ratio is based on the signal-to-noise ratio when the jamming signal affects boundary and edge nodes, which was introduced in [32]. As the jammer moves closer to a node, we observe that the SNR decreases to reach the system threshold value before becoming jammed. As a result, the SNR in the jamming region is approximately equal to the value of the system threshold. Alternatively, a jammed node means that SNR is below the threshold value when it receives a large amount of noise. Therefore, the distance ratio can be expressed as in Eq. (6):
where
Therefore, the SNR and the distance ratio at the edge node are represented in the following equations:
In this case,
where the estimated (μ) values vary depending on the node’s power received, total noise received, and the system threshold value. when the μ is equal to zero, the edge node location is where the jammer is located at the same position as the edge node. In this case, the
Furthermore, in the proposed jamming detection algorithm additional distance ratio metric was added to the dataset to classify nodes and analyze the dataset to increase the detection accuracy and differentiate between intentional and unintentional interference. Accordingly, the distance between a node and its neighbor is derived from the power received by the node, including the power of jamming. For each node, the original distance and the estimated distance between the boundary node and its neighbor are calculated to estimate the distance ratio (
And the estimated distance during jamming attacks becomes as in Eq. (14):
where
Since the node’s transmission power and distance between nodes are known, Eq. (2) can be used to calculate the original power without noise or jamming power. Additionally, each node must calculate the received power to estimate the SNR. Whenever there is no jamming power received, the total power is approximately equal to the power received by the node. In this case, the distance ratio (
5 Simulation and Performance Evaluation
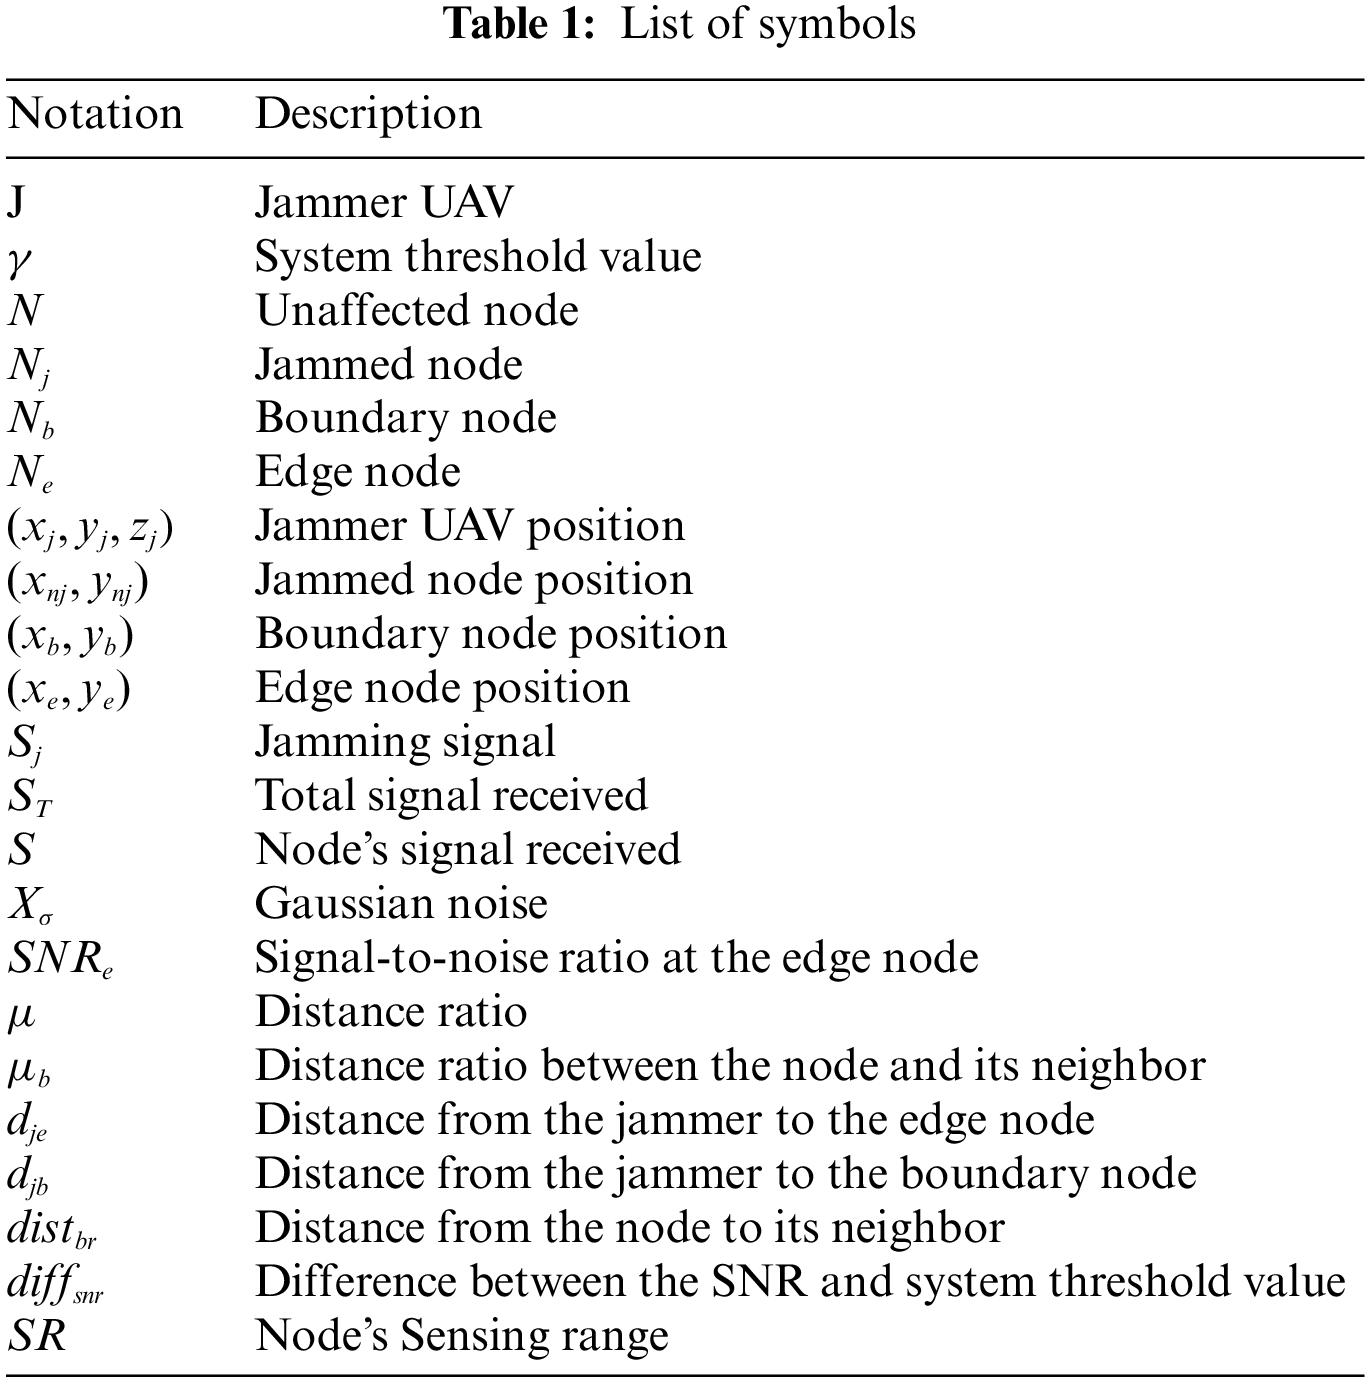
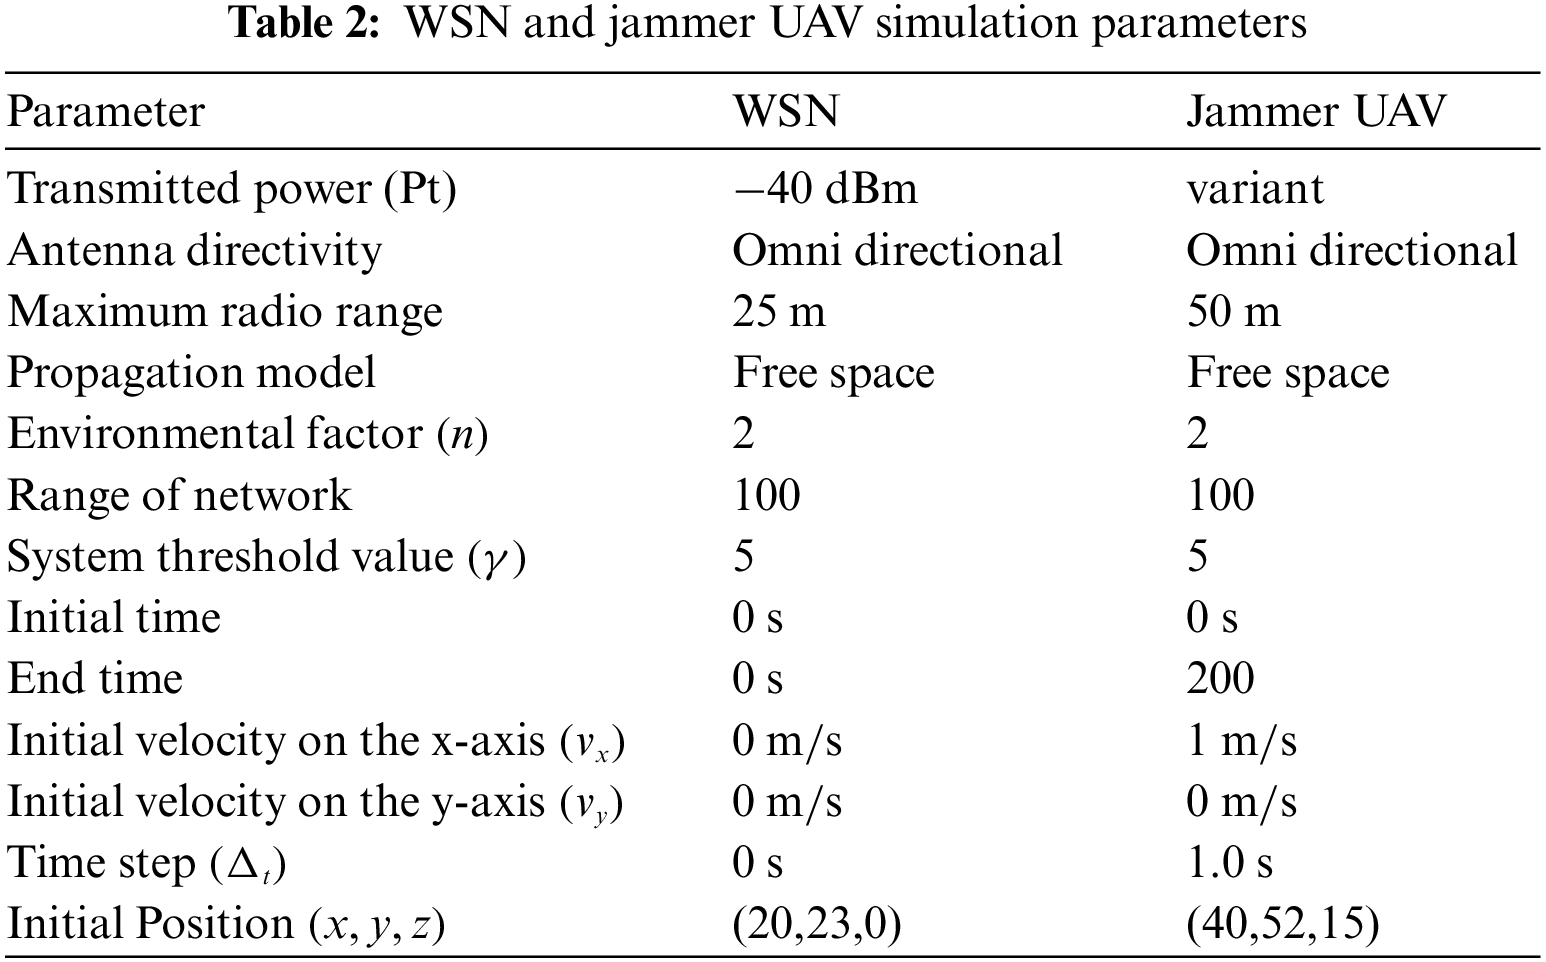
In this section, the machine learning model for jamming detection was evaluated using three different parameters as features with different scenarios. We considered the jammer UAV hovers over the target area in three-dimensional space
Figure 3: An illustration of a network deployment with a jammer hovering around the target area. (a) Based stations randomly distributed on the ground and the initial position of the UAV (45,30,20), (b) the locations of the node and its neighbor (35,20,0) and (25,25,0) respectively, and (c) the 2D representation
5.1 Jamming Detection Metrics with Different Jammer
To evaluate and compare the proposed detection method with different jammers and parameters, the MATLAB simulation tool is used, as shown in Table 3. Different types of jammers considered to evaluate the proposed jamming detection metrics include constant jammers with low power (CONL), constant jammers with high power (CONH), random jammers with low power (RANL), random jammers with high power (RANH), reactive jammers with low power (REAL), and reactive jammers with high power (REAH). Based on the power received by the boundary node at each time step, Fig. 4 depicts the detection metrics with different types of jammers. For a constant jammer with low power −27 dBm, the trajectory moves around the target area near the boundary node in 200 steps and transmits a continuous jamming signal. The jammer is at the closest point to the target node in steps 1 and 195, while it is at the maximum distance from the boundary node in step 90. In this case, the node is depicted as a jammed node. At time steps 10 and 160 the node becomes an edge node as shown in Fig. 4a. Different types of jammer and measurement metrics are shown in Figs. 4b–4d. In the same Figure, the relationship between distance ratios
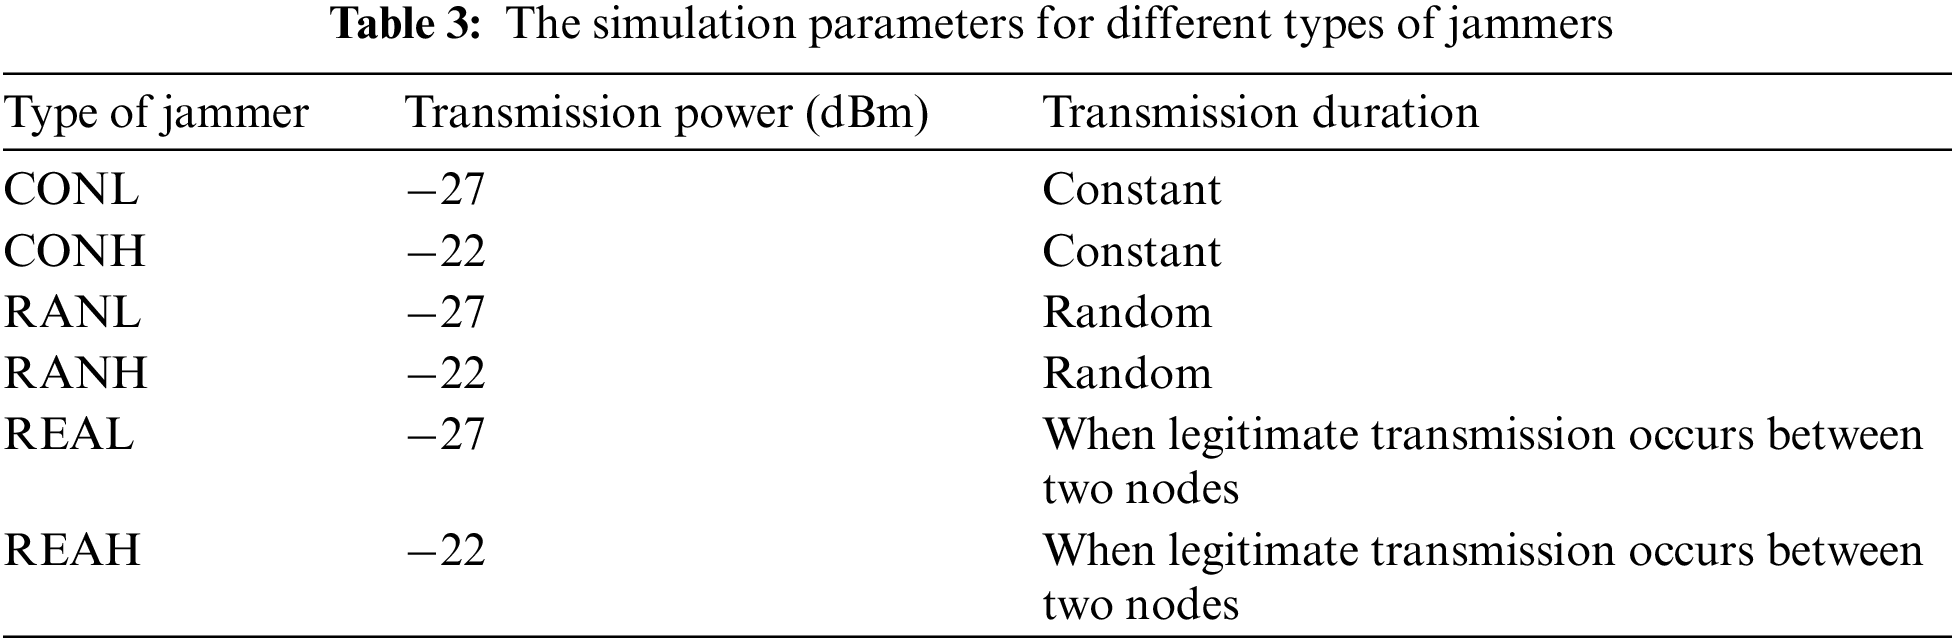
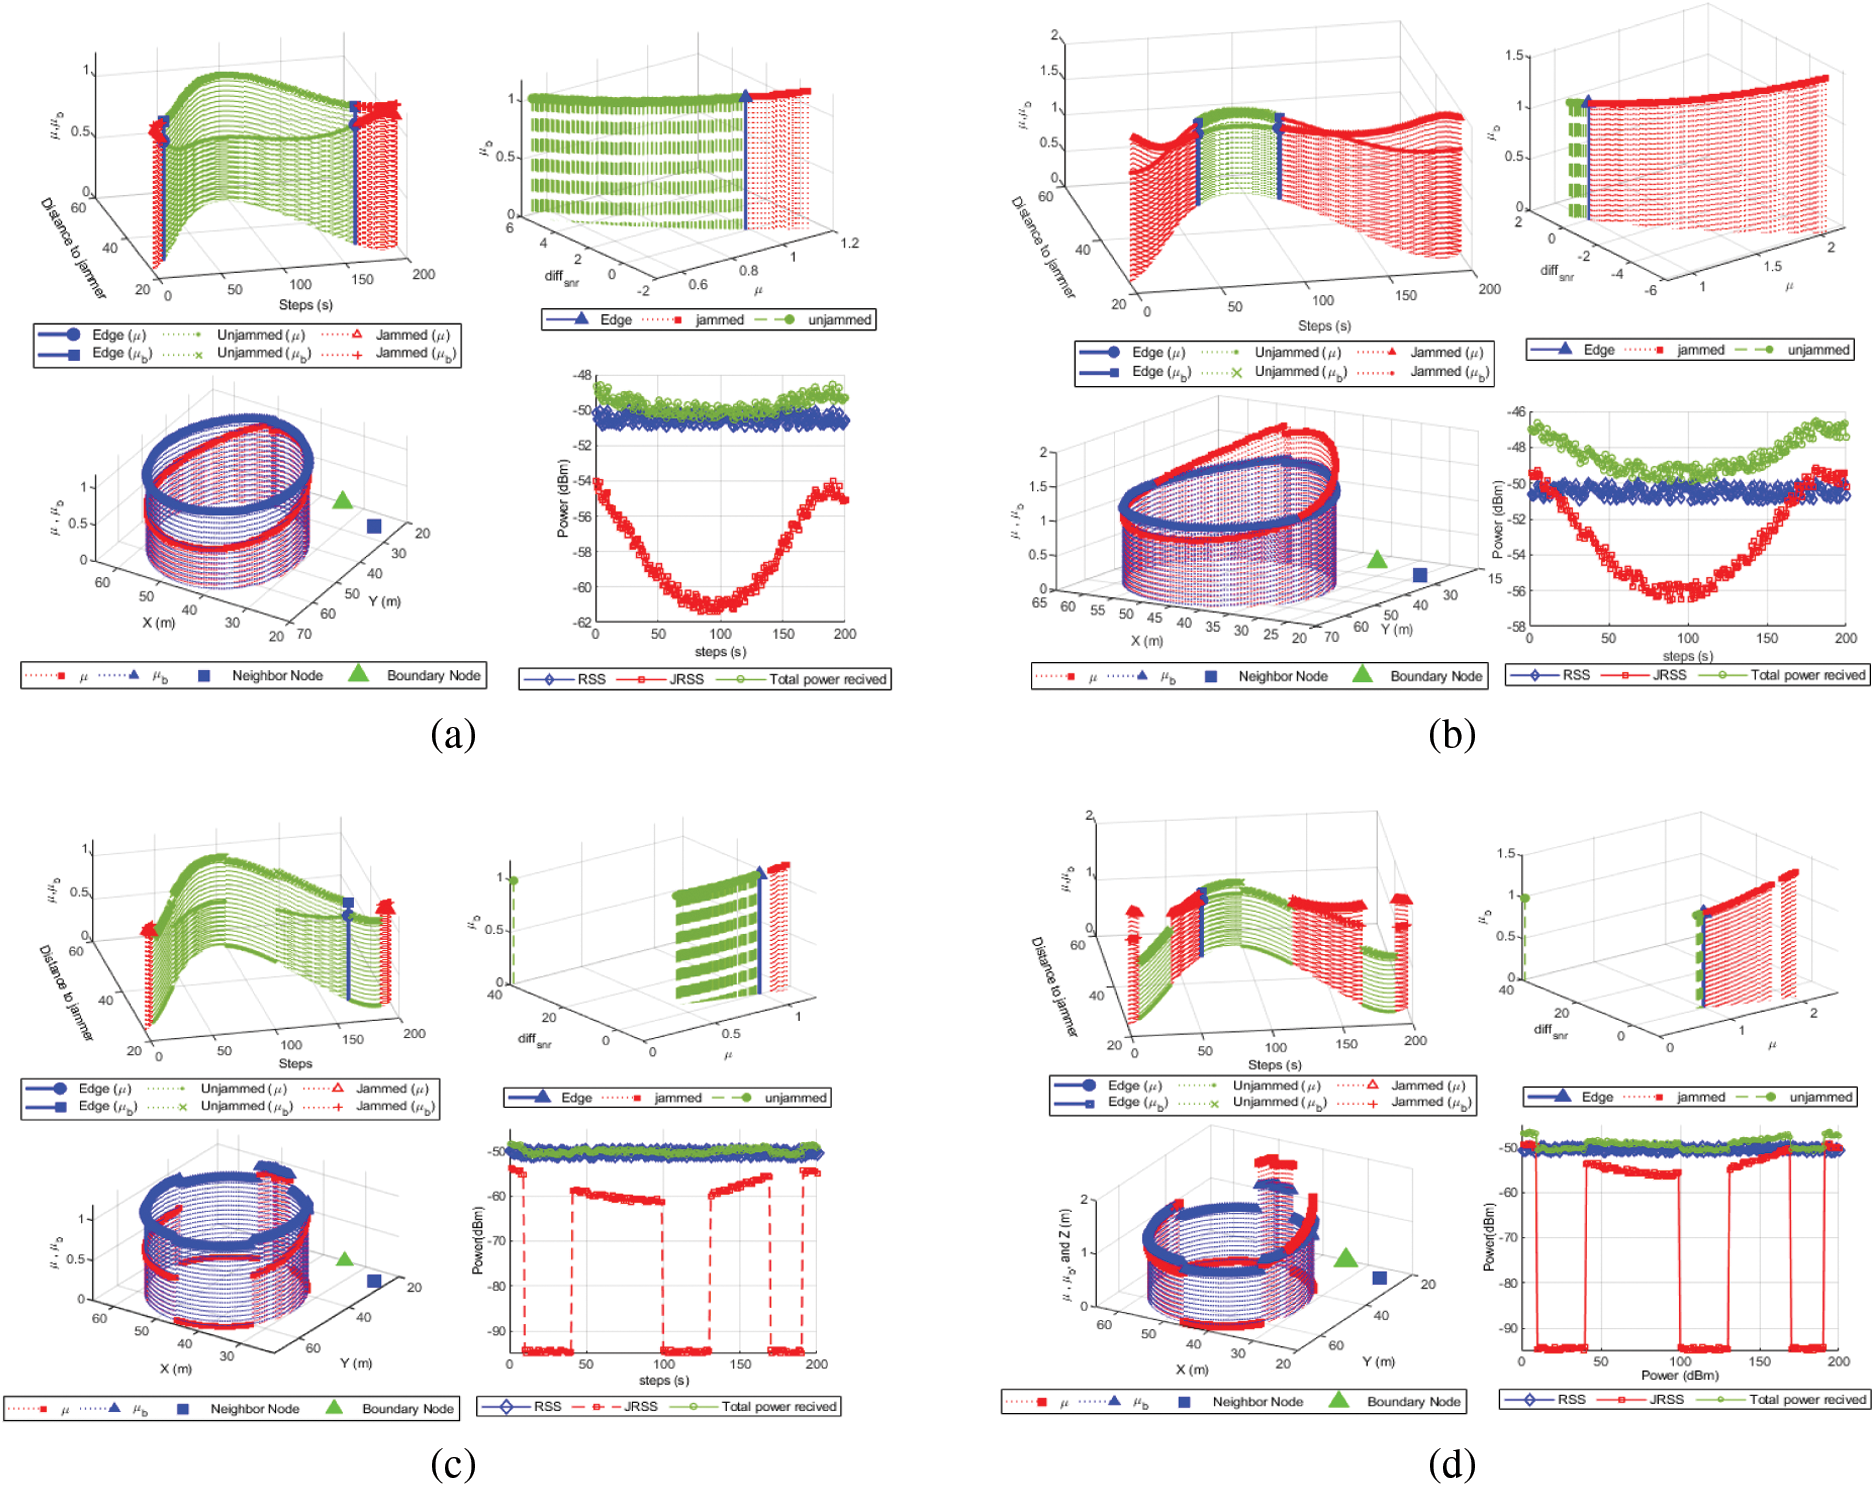
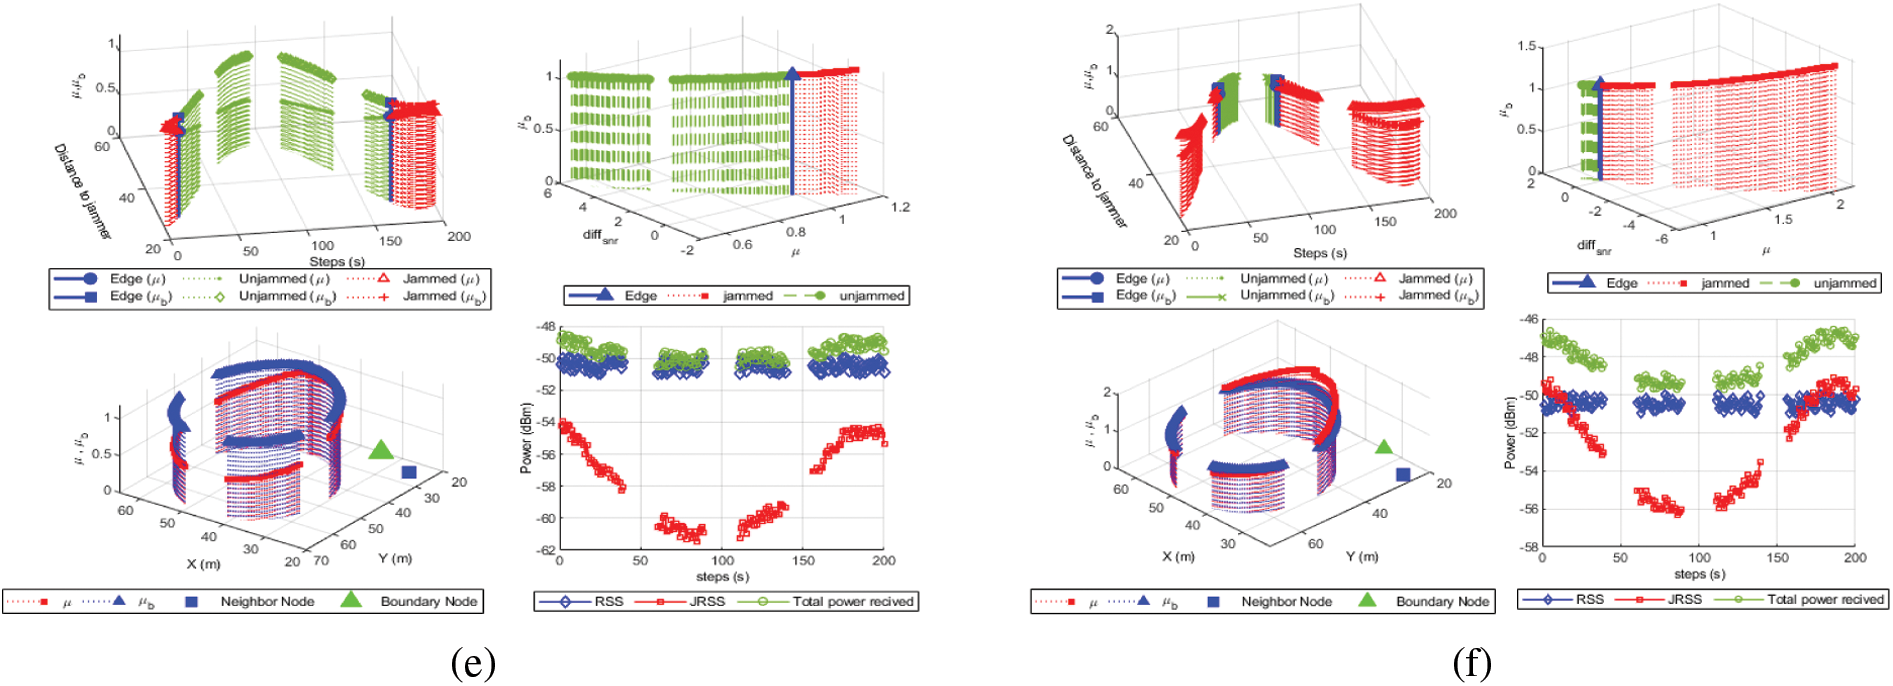
Figure 4: The UAV detection is based on distance ratios (
Several types of datasets are generated for evaluating jamming detection accuracy, including CONL, CONH, RANL, RANH, REAL, and REAH. A transmission power of −22 dBm is set for high power and −27 dBm for low power transmission. Using four different machine learning algorithms, we analyze the detection of different jammers. Various metrics, such as confused matrix and accuracy rate, are used to demonstrate classification performance. True Positives (TP), False Positives (FP), True Negatives (TN), and False Negatives (FN) comprise the confusion matrix. The performance was evaluated using precision, recall, accuracy, and F-Measure. All algorithms are implemented in MATLAB and the measures are calculated as in the following equations:
Table 4 and Fig. 5 show output from Linear Discrimination (LD), Naive Bayes (NB), Support Vector Machines (SVM), and KNN when the jammer UAV hovers and transmits different power. A KNN algorithm performs better than other algorithms, consistently achieving 98.5% average accuracy and detecting and classifying nodes with 99.9% as testing accuracy; NB algorithms show the worst performance with 91.2% average accuracy and 89% average testing accuracy. Based on a different machine learning algorithm, Figs. 6 and 7 presents the performance of different types of jammers using precision, recall, F1 scores, True Positive (TP), and True Negative (TN). With an average precision of 98%, KNN outperforms all other algorithms in different types of jammers. In the presence of different types of jammers, LD and NB remain the worst algorithms for detecting and classifying nodes. Based on the evaluated scenario, KNN is the only algorithm with stable performance across different strategies.
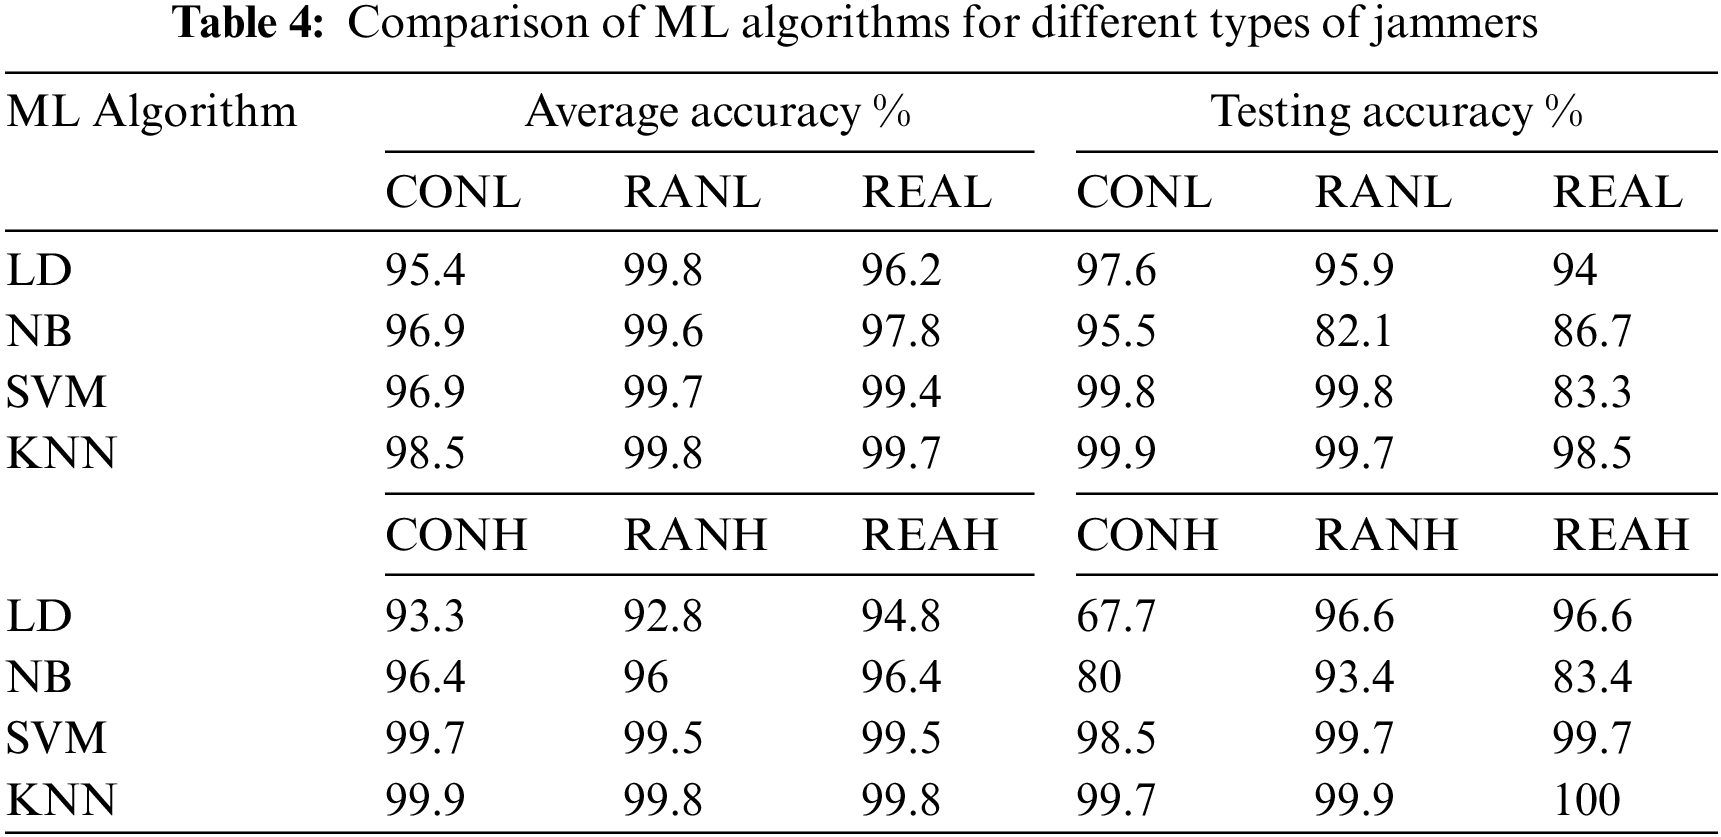
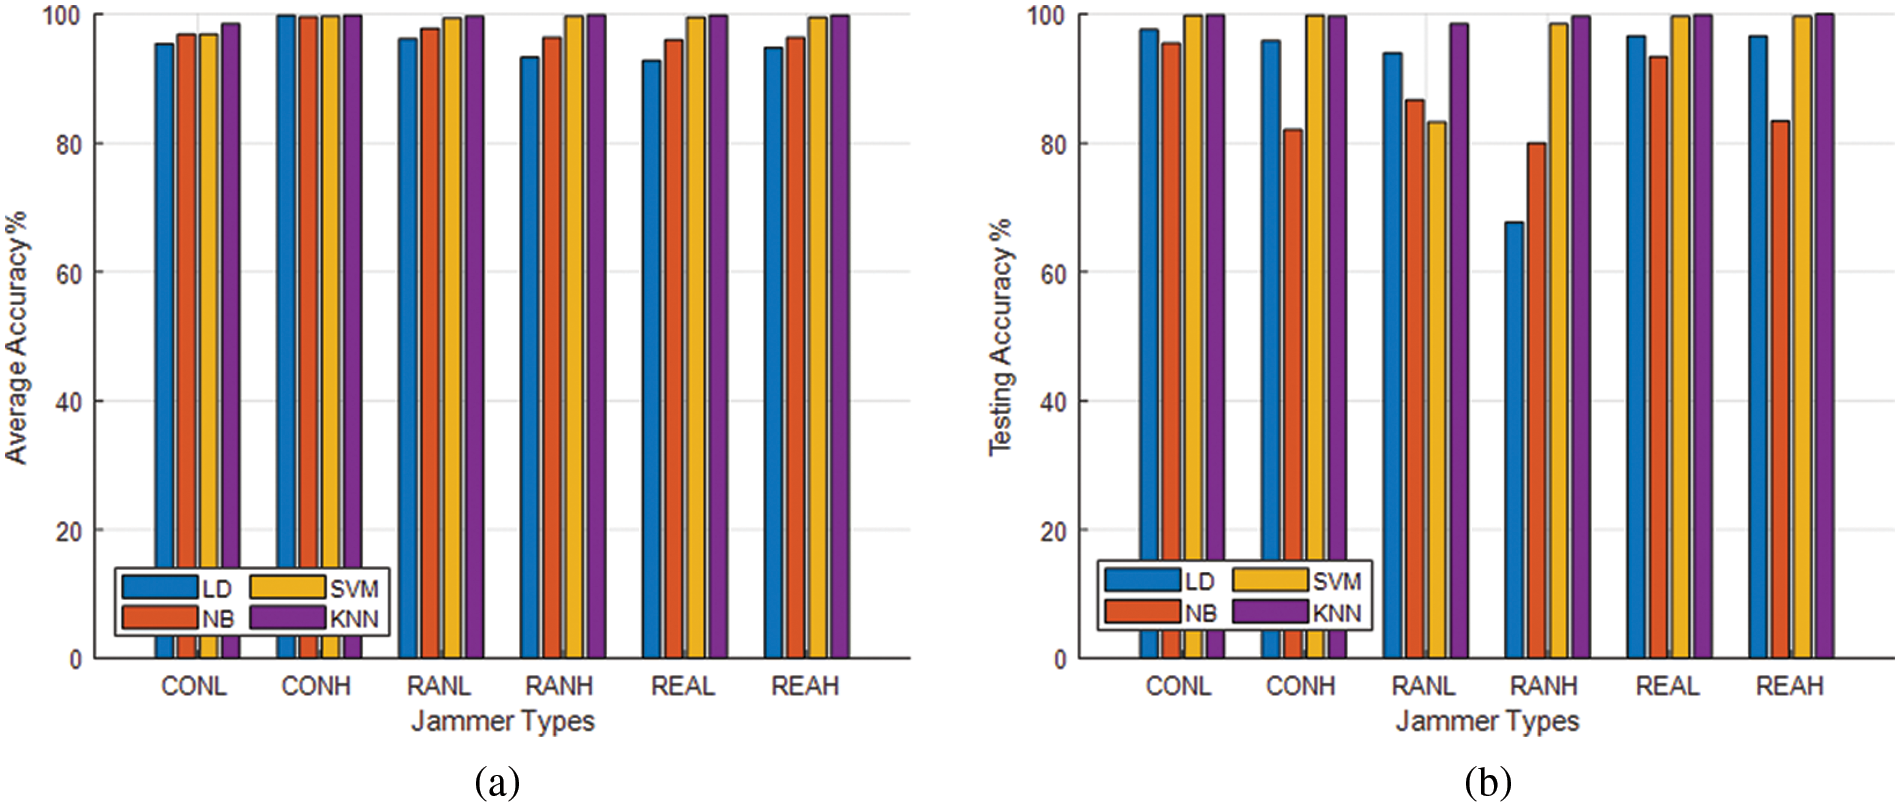
Figure 5: Illustration of the average accuracy and testing accuracy with different machine learning algorithms (a) Average accuracy, and (b) Testing accuracy
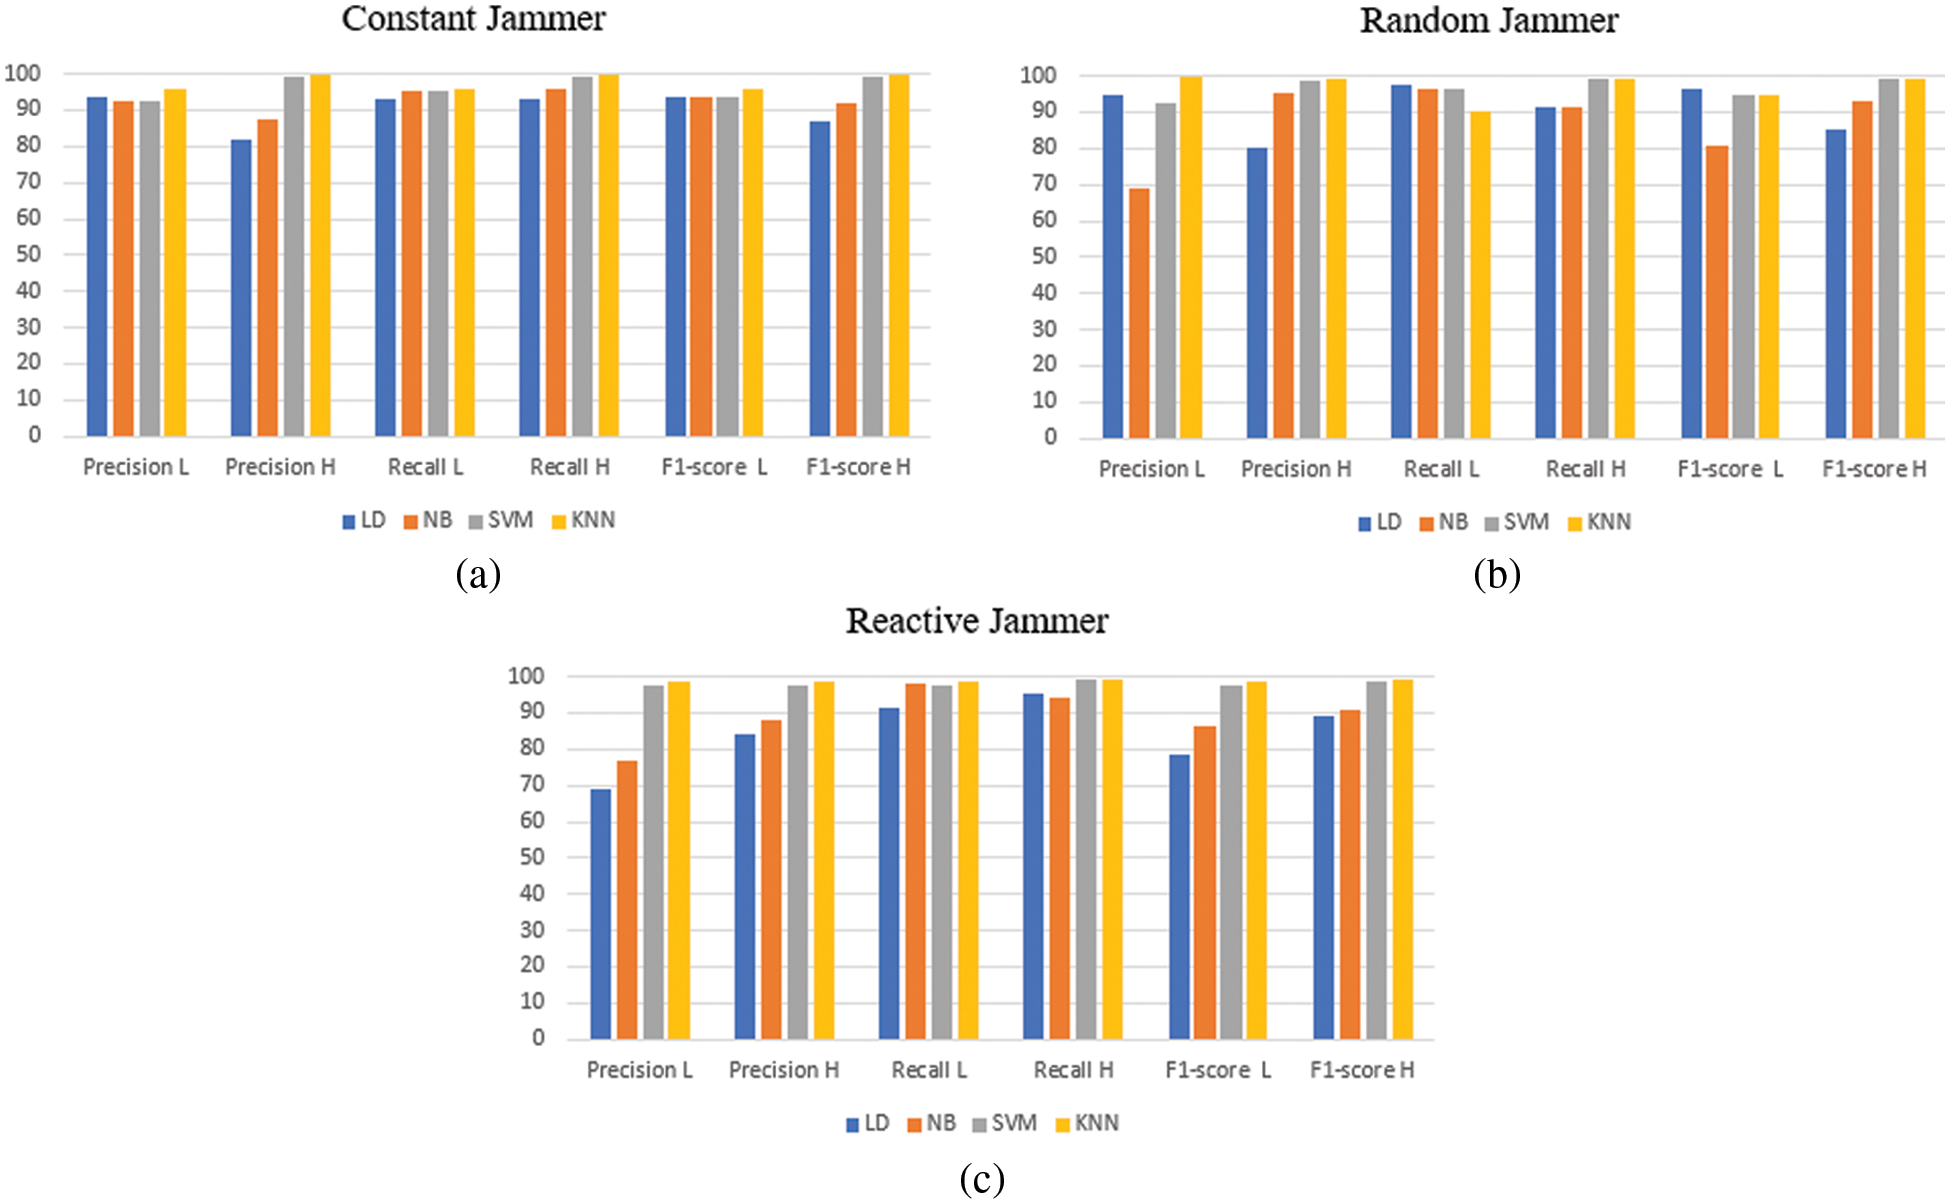
Figure 6: Performance of algorithms for different types of jammers where the low power depicted by L and the high power is H. (a) Constant jammer, (b) Random jammer, and (c) Reactive jammer
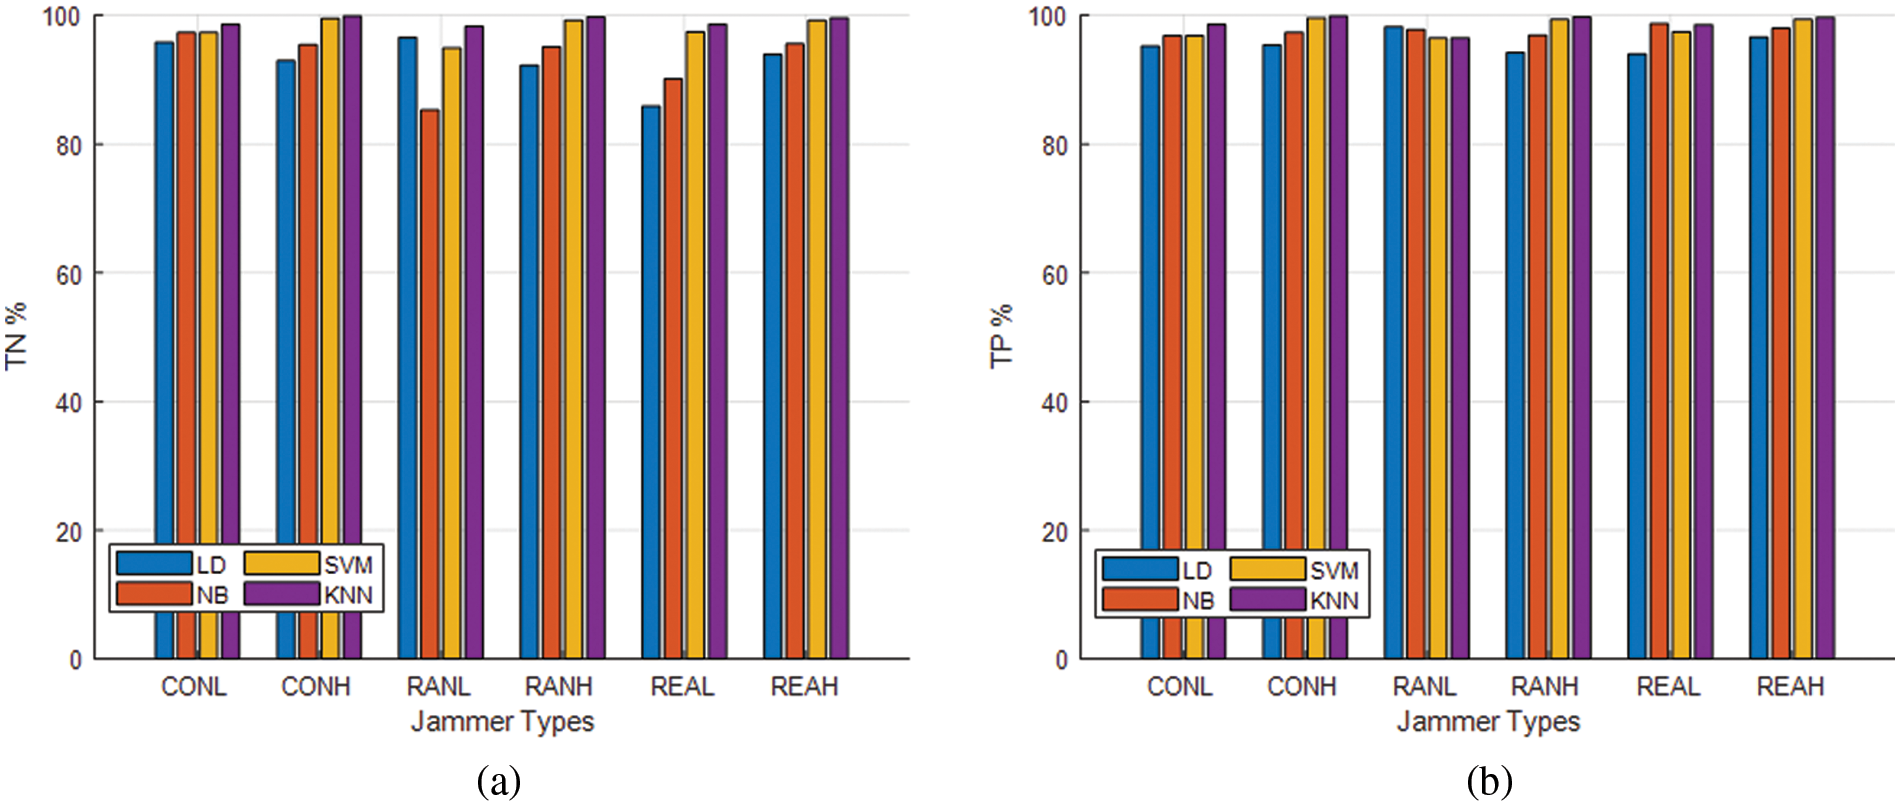
Figure 7: Performance of algorithms for different types of jammers (a) TP and (b) TN
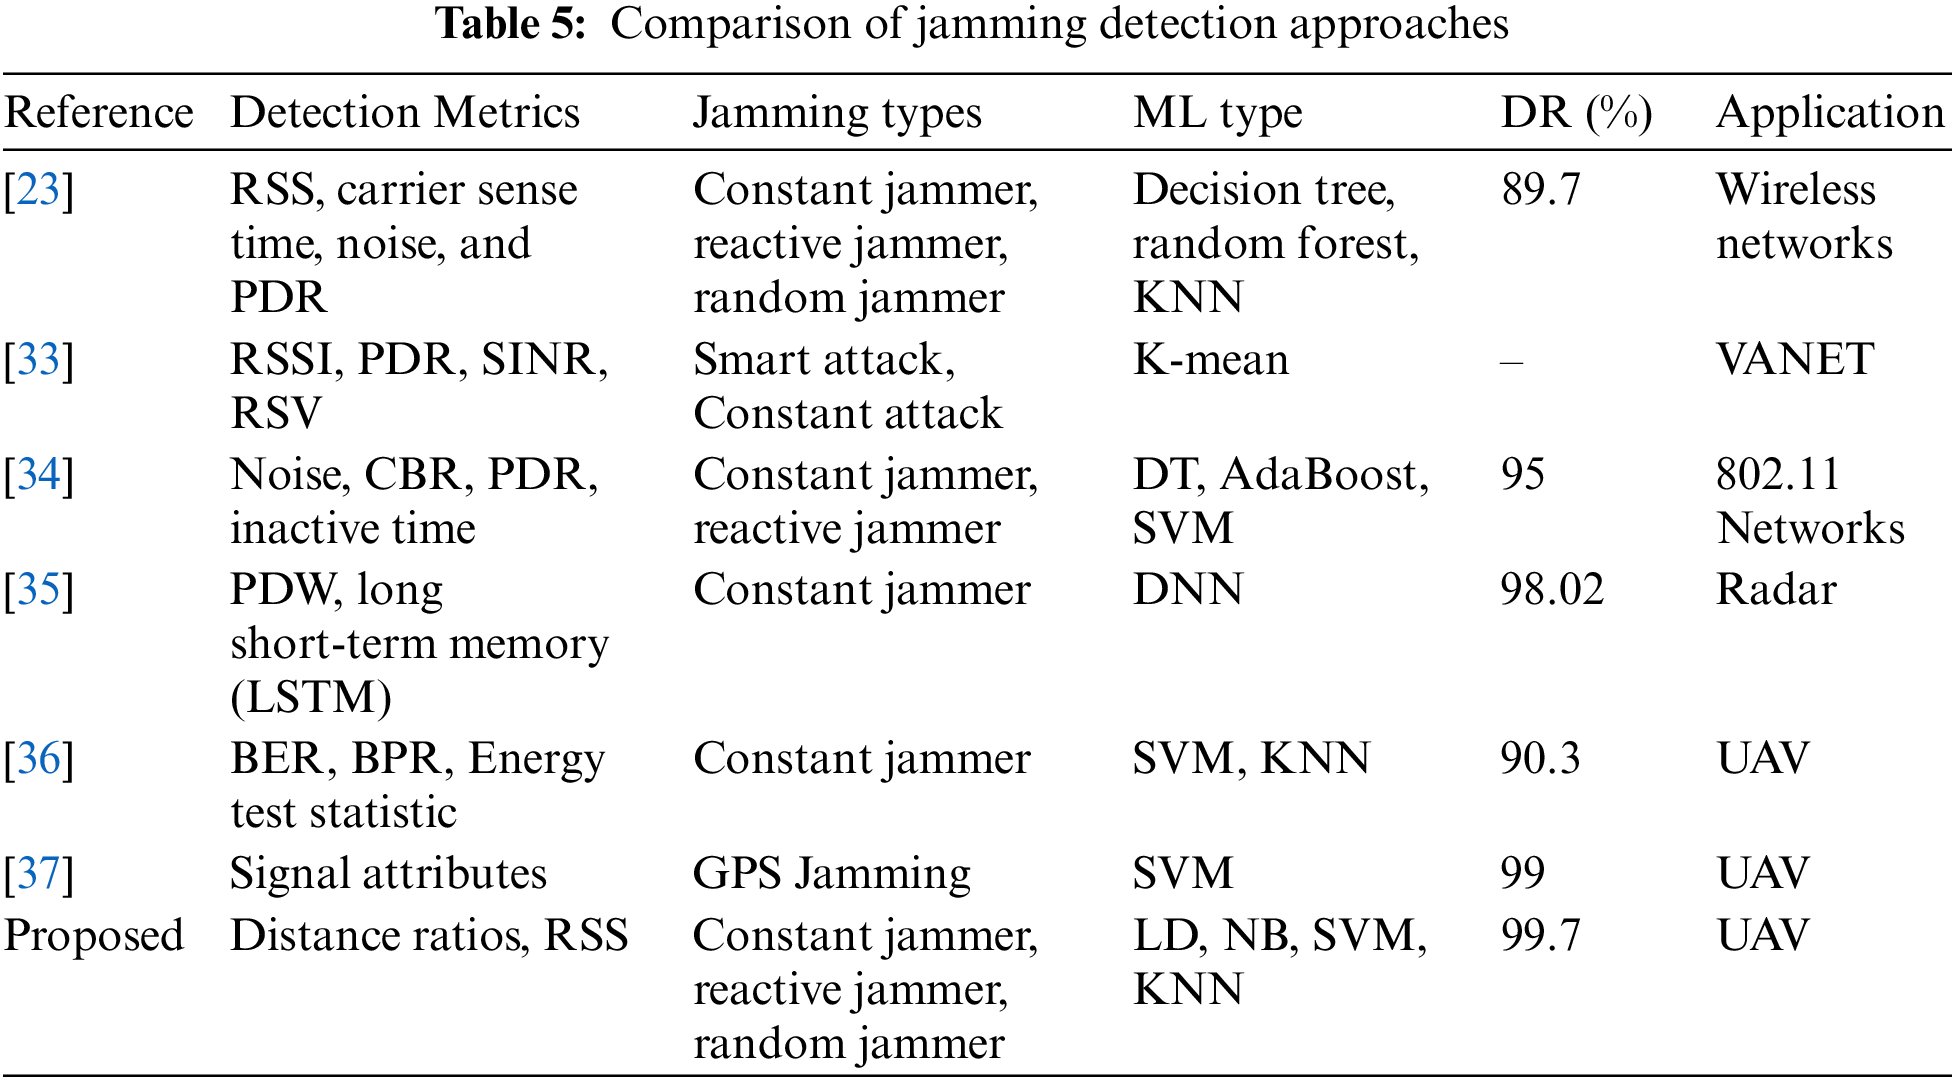
Table 5 shows the proposed method compared to the state of the art algorithm. the comparison is based on the detection metric, the jamming attack type, and the detection accuracy. It has been found that most of the proposed methods produce a high detection rate, similar to our approach. While most of these methods use multiple detection metrics, we have developed a technique that is based on distributed technique and requires less overhead for sensor nodes that are already resource constrained.
Detecting jamming UAVs and classifying nodes into jammed, unjammed, and edge nodes are presented in this paper. To generate the dataset, different types of jammers with different levels of the jamming signal were used. The three features were constructed based on distance ratios and received signal strength. In comparison, it was simpler and had a higher level of detection accuracy. Evaluation of the proposed technique was based on precision, recall, F1 score, and TP and TN. There is an average accuracy of 99.7% for the KNN algorithm, compared to DL, NB, and SVM algorithms. Moreover, because the proposed technique is based on distributed jamming detection, the nodes themselves decide on jamming detection. Based on our results, our proposed method is capable of detecting jamming attacks and classifying nodes with reduced complexity and overhead, and it does not flood the network with work. Further, the suggested detection metrics are based on distance ratios derived from power received and noise, including jamming signals, if present.
Acknowledgement: The authors extend their appreciation to the Deputyship for Research & Innovation, Ministry of Education in Saudi Arabia for funding this research work through the Project Number (IF-PSAU-2021/01/18707).
Funding Statement: This research work was funded by the Deputyship for Research & Innovation, Ministry of Education in Saudi Arabia through the Project Number(IF-PSAU- 2021/01/18707).
Conflicts of Interest: The authors declare that they have no conflicts of interest to report regarding the present study
References
1. Y. Zeng, Q. Wu and R. Zhang, “Accessing from the sky: A tutorial on UAV communications for 5G and beyond,” Proceedings of the IEEE, vol. 107, no. 12, pp. 2327–2375, 2019. [Google Scholar]
2. R. Allison, J. Johnston, G. Craig and S. Jennings, “Airborne optical and thermal remote sensing for wildfire detection and monitoring,” Sensors, vol. 16, no. 8, pp. 1310, 2016. [Google Scholar]
3. S. Naqvi, S. Hassan, H. Pervaiz and Q. Ni, “Drone-aided communication as a key enabler for 5G and resilient public safety networks,” IEEE Communications Magazine, vol. 56, no. 1, pp. 36–42, 2018. [Google Scholar]
4. Y. Zeng and R. Zhang, “Energy-efficient UAV communication with trajectory optimization,” IEEE Transactions on Wireless Communications, vol. 16, no. 6, pp. 3747–3760, 2017. [Google Scholar]
5. Y. Mekdad, A. Ahmet, F. Leonardo, C. Mauro, L. Riccardo et al., “A survey on security and privacy issues of UAVs,” arXiv preprint arXiv:2109.14442, vol 2, 2021. [Google Scholar]
6. W. Shi, H. Zhou, J. Li, W. Xu, N. Zhang et al., “Drone assisted vehicular networks: Architecture, challenges and opportunities,” IEEE Network, vol. 32, no. 3, pp. 130–137, 2018. [Google Scholar]
7. L. Gupta, R. Jain and G. Vaszkun, “Survey of important issues in UAV communication networks,” IEEE Communications Surveys & Tutorials, vol. 18, no. 2, pp. 1123–1152, 2016. [Google Scholar]
8. D. Tezza and M. Andujar, “The state-of-the-art of human-drone interaction: A survey,” IEEE Access, vol. 7, pp. 167438–167454, 2019. [Google Scholar]
9. A. Bhardwaj, L. Sam, F. Martín-Torres and R. Kumar, “Unmanned aerial vehicles for the assessment and monitoring of environmental contamination: An example from coal ash spills,” Environmental Pollution, vol. 218, pp. 889–894, 2016. [Google Scholar]
10. M. Messinger and M. Silman, “Unmanned aerial vehicles for the assessment and monitoring of environmental contamination: An example from coal ash spills,” Environmental Pollution, vol. 218, pp. 889–894, 2016. [Google Scholar]
11. C. Nguyen, O. Georgiou and V. Suppakitpaisarn, “Improved localization accuracy using machine learning: Predicting and refining RSS measurements,” in IEEE Globecom Workshops, Abu Dhabi, United Arab Emirates, 2018. [Google Scholar]
12. Y. Li, Y. Zhuang, X. Hu, Z. Gao, J. Hu et al., “Location-enabled IoT (LE-IoTA survey of positioning techniques, error sources, and mitigation,” arXiv:2004.03738, 2020. [Google Scholar]
13. V. Kristem, A. Molisch and L. Christen, “Jammer sensing and performance analysis of MC-CDMA ultrawideband systems in the presence of a wideband jammer,” IEEE Transactions on Wireless Communications, vol. 17, no. 6, pp. 3807–3821, 2018. [Google Scholar]
14. A. Li and W. Zhang, “Mobile jammer-aided secure UAV communications via trajectory design and power control,” China Communications, vol. 15, no. 8, pp. 141–151, 2018. [Google Scholar]
15. M. Abdollahi, K. Malekinasab, W. Tu and M. Mohammadi, “An efficient metric for physical-layer jammer detection in internet of things networks,” in Proc. LCN, Edmonton, AB, Canada, pp. 209–216, 2021. [Google Scholar]
16. Z. Liu, Q. Zhang and K. Li, “An anti-jamming method against two-dimensional deception jamming by spatial location feature recognition,” Sensors, vol. 21, no. 22, pp. 7702, 2021. [Google Scholar]
17. Y. Arjoune, F. Salahdine, M. Islam, E. Ghribi and N. Kaabouch, “A novel jamming attacks detection approach based on machine learning for wireless communication,” in Proc. ICOIN, Barcelona, Spain, pp. 459–464, 2020. [Google Scholar]
18. H. Kim and J. Chung, “VANET jamming and adversarial attack defense for autonomous vehicle safety,” Computers, Materials & Continua, vol. 71, no. 2, pp. 3589–3605, 2022. [Google Scholar]
19. K. Vijayakumar, P. Ganeshkumar, M. Anandaraj, K. Selvaraj and P. Sivakumar, “Fuzzy logic-based jamming detection algorithm for cluster-based wireless sensor network,” International Journal of Communication Systems, vol. 31, no. 10, pp. e3567, 2018. [Google Scholar]
20. W. Xu, K. Ma, W. Trappe and Y. Zhang, “Jamming sensor networks: Attack and defense strategies,” IEEE Network, vol. 20, no. 3, pp. 41–47, 2006. [Google Scholar]
21. Z. Su, X. Jiang, N. Li, H. Ling and Y. Zheng, “Optimization of false target jamming against UAV detection,” Drones, vol. 6, no. 5, pp. 114, 2022. [Google Scholar]
22. A. Perkins, L. Dressel, S. Lo, T. Reid, K. Gunning et al., “Demonstration of UAV based GPS jammer localization during a live interference exercise,” in Proc. ION GNSS+, Portland, Oregon, USA, pp. 3094–3106, 2016. [Google Scholar]
23. B. Upadhyaya, S. Sun and B. Sikdar, “Machine learning-based jamming detection in wireless IoT networks,” in Proc. APWCS, Singapore, SG, pp. 1–5, 2019. [Google Scholar]
24. K. Cao, W. Buhong, D. Haiyang, L. Lu, D. Runze et al., “Improving physical layer security of uplink NOMA via energy harvesting jammers,” IEEE Transactions on Information Forensics and Security, vol. 16, pp. 786–799, 2020. [Google Scholar]
25. M. Çakiroglu and A. Özcerit, “Jamming detection mechanisms for wireless sensor networks,” in Proc. ICST, Hong Kong, China, 2010. [Google Scholar]
26. Y. Li, P. Jered, P. Joshua, S. Khair, N. Quamar et al., “Jamming detection and classification in OFDM-based UAVs via feature- and spectrogram-tailored machine learning,” IEEE Access, vol. 10, pp. 16859–16870, 2022. [Google Scholar]
27. O. Osanaiye, A. Alfa and G. Hancke, “A statistical approach to detect jamming attacks in wireless Sensor Networks,” Sensors, vol. 18, no. 6, pp. 1691, 2018. [Google Scholar]
28. S. Misra, R. Singh and S. Mohan, “Information warfare-worthy jamming attack detection mechanism for wireless sensor networks using a fuzzy inference system,” Sensors, vol. 10, no. 4, pp. 3444–3479, 2010. [Google Scholar]
29. M. Chen, L. Wei, Z. Ning, L. Junling and R. Yingying, “GPDS: A multi-agent deep reinforcement learning game for anti-jamming secure computing in MEC network,” Expert Systems with Applications, vol. 210, pp. 118394, 2022. [Google Scholar]
30. Z. Yin, Y. Lin, Y. Zhang, Y. Qian, F. Shu et al., “Collaborative multi-agent reinforcement learning aided resource allocation for UAV anti-jamming communication,” IEEE Internet of Things Journal, vol. 9, pp. 1, 2022. [Google Scholar]
31. X. Chang, Y. Li, Y. Zhao, Y. Du and D. Liu, “An improved anti-jamming method based on deep reinforcement learning and feature engineering,” IEEE Access, vol. 10, pp. 69992–70000, 2022. [Google Scholar]
32. W. Aldosari, M. Zohdy and R. Olawoyin, “Jammer localization through smart estimation of jammer’s transmission power,” in Proc. NAECON, Dayton, OH, USA, pp. 430–436, 2019. [Google Scholar]
33. D. Karagiannis and A. Argyriou, “Jamming attack detection in a pair of RF communicating vehicles using unsupervised machine learning,” Vehicular Communications, vol. 13, pp. 56–63, 2018. [Google Scholar]
34. O. Punal, I. Aktas, C. Schnelke, G. Abidin, K. Wehrle et al., “Machine learning-based jamming detection for IEEE 802.11: Design and experimental evaluation,” in Proc. WoWMoM, Sydney, NSW, Australia, pp. 1–10, 2014. [Google Scholar]
35. B. AlRami, K. Alheeti, W. Aldosari, S. Alshahrani and S. AlAbrez, “A new classification method for drone-based crops in smart farming,” International Journal of Interactive Mobile Technologies, vol. 16, no. 9, pp. 164–174, 2022. [Google Scholar]
36. P. Douglas, S. Harris, A. Yuille and M. Cohen, “Performance comparison of machine learning algorithms and number of independent components used in fMRI decoding of belief vs. disbelief,” Neuroimage, vol. 56, no. 2, pp. 544–553, 2011. [Google Scholar]
37. A. Shafique, A. Mehmood and M. Elhadef, “Detecting signal spoofing attack in UAVs using machine learning models,” IEEE Access, vol. 9, pp. 93803–93815, 2021. [Google Scholar]
Cite This Article
 Copyright © 2023 The Author(s). Published by Tech Science Press.
This work is licensed under a Creative Commons Attribution 4.0 International License , which permits unrestricted use, distribution, and reproduction in any medium, provided the original work is properly cited.
 Downloads
 Citation Tools