
 Submit a Paper
 Propose a Special lssue
 Open Access
ARTICLE

Imbalanced Data Classification Using SVM Based on Improved Simulated Annealing Featuring Synthetic Data Generation and Reduction
1 Department of Computer Techniques Engineering, AlSafwa University College, Karbala, 56001, Iraq
2 Faculty of Electronic Engineering & Technology, Universiti Malaysia Perlis, Arau, 02600, Perlis, Malaysia
* Corresponding Author: Said Amirul Anwar. Email:
Computers, Materials & Continua 2023, 75(1), 547-564. https://doi.org/10.32604/cmc.2023.036025
Received 14 September 2022; Accepted 19 November 2022; Issue published 06 February 2023
 View Full Text
 Download PDF
Abstract
Imbalanced data classification is one of the major problems in machine learning. This imbalanced dataset typically has significant differences in the number of data samples between its classes. In most cases, the performance of the machine learning algorithm such as Support Vector Machine (SVM) is affected when dealing with an imbalanced dataset. The classification accuracy is mostly skewed toward the majority class and poor results are exhibited in the prediction of minority-class samples. In this paper, a hybrid approach combining data pre-processing technique and SVM algorithm based on improved Simulated Annealing (SA) was proposed. Firstly, the data pre-processing technique which primarily aims at solving the resampling strategy of handling imbalanced datasets was proposed. In this technique, the data were first synthetically generated to equalize the number of samples between classes and followed by a reduction step to remove redundancy and duplicated data. Next is the training of a balanced dataset using SVM. Since this algorithm requires an iterative process to search for the best penalty parameter during training, an improved SA algorithm was proposed for this task. In this proposed improvement, a new acceptance criterion for the solution to be accepted in the SA algorithm was introduced to enhance the accuracy of the optimization process. Experimental works based on ten publicly available imbalanced datasets have demonstrated higher accuracy in the classification tasks using the proposed approach in comparison with the conventional implementation of SVM. Registering at an average of 89.65% of accuracy for the binary class classification has demonstrated the good performance of the proposed works.Keywords
In recent years, the imbalanced data classification problem has drawn a significant amount of interest among researchers, scholars, and industries. This can be seen from the substantial number of research publications reported in the last decade [1]. One of the factors that contributed to the problem is the imbalanced number of data samples between majority and minority classes in the training dataset which affects the decision-making and prediction results. Normally, the classification would bias towards the majority class [2,3]. This problem is more prevalent and crucial in the case of the classification of real-world data in which obtaining the data for a certain class might be harder compared to the other classes [4]. Most of the classifiers or machine learning algorithms including Support Vector Machines (SVM) are impacted in terms of their performance when used in the imbalanced dataset setting [5].
Many classification learning algorithms have low predictive accuracy for the minority class due to their formulation and design. This is because most of these algorithms assume the training dataset to be balanced which may lead to the incorrect prediction of newly unseen data [6]. Hence, the implementations of a conventional approach to these algorithms often inaccurately predict new incoming data from the minority class compared to the majority class [7]. Therefore, solving the imbalanced data classification problem in machine learning can be divided into three approaches namely data level, algorithmic level, and hybrid or ensemble approach [8]. Other categories may include boosting algorithms and cost-sensitive learning approaches [9].
In the data-level approach, an additional pre-processing step was employed before the training of an algorithm. This step aims to balance the amount of data between classes through sampling techniques such as oversampling [10–12] or undersampling methods [4,13]. Modification of majority or minority or both classes in the dataset is expected to improve modeling during training by the classification algorithm. For example, the works done by [14] have highlighted that a novel extension of the Synthetic Minority Over-sampling Technique (SMOTE) algorithm facilitates attaching a higher weight to the minority class and demonstrated that oversampling technique can also be beneficial even in the case of larger sample size in the minority class.
The second approach to solving the imbalanced data classification problem is an algorithmic approach that focused on regulating the classification algorithm without modifying the dataset. This requires an in-depth understanding of the selected learning algorithm to identify a specific mechanism that is responsible for creating the bias towards the majority class. Algorithm-level solutions do not cause any shifts in the data distributions, being more adaptable to several types of imbalanced datasets. For example, in the case of SVM, a different weight to the penalty parameters can be assigned to improve the training of the imbalanced datasets [15–17]. Recently, [18] proposed adaptive Focal Hinge (FH) SVM that makes use of focal and hinge loss scaling factors. Their results have demonstrated the effectiveness of FH-SVM in dealing with most of the imbalanced data problems.
Thirdly, hybrid approaches make a trade-off between the algorithm levels and the data levels approaches. These approaches make some changes to the data distribution and regulate or modify some parameters at the algorithm levels. For example, [19] has introduced a sampling technique that combines k-means clustering with a genetic algorithm to demonstrate minority class performance in an imbalanced dataset. In their work, k-means clustering was used to divide the minority class samples while a genetic algorithm was used to select fresh samples from every cluster, which was then validated. This integrated technique which comprised of the k-nearest neighbor method and an SVM model has proved to be effective, and it is demonstrated through their experimental results. In another hybrid approach, boosting algorithms such as Geometric Mean Boosting (GMBoost) which enable learning with consideration of both majority and minority classes because it uses the geometric mean of both classes in error rate and accuracy calculation [20]. Assembly of classifiers was generated by the boosting algorithm combined with the synthetically generated data through techniques such as SMOTE was reported in their research works.
To reduce noisy samples from the majority class, [21] has proposed SMOTE with a thresholding technique and random forest as a learning algorithm. This novel approach eliminates noisy samples from the majority class located inside the borderline with noise filtering. This method combines oversampling SMOTE technique with the thresholding technique to balance the training data and choose the best boundary between classes. Then, a noise detection technique is used to identify and delete the misclassified samples. There are other hybrid approaches such as a combination of Gabriel Graph Editing (GGE) and Modified Back Propagation (MBP) to handle issues of class imbalances and overlapping classes in multiclass distribution [22], and ensemble construction algorithm technique that is based on the (random under-sampling) RUSBoost concept which known as Evolutionary Undersampling Boosting (EUSBoost) [23] have reported significant findings that improve the classification of an imbalanced dataset.
In summary, many hybrid approaches have been proposed in the literature which aim to improve the classification of imbalanced data. These approaches combine the alteration of data distribution through resampling techniques and modification of the classification algorithms. In terms of resampling technique, [24] have reported important findings and experimental data that supported the superiority of the oversampling technique compared to the undersampling technique because the former provides a higher proportion of safe samples and a lower proportion of some subtypes of unsafe samples.
In this work, an algorithm based on a hybrid approach was proposed to improve imbalanced dataset classification which combines data level and algorithmic level methods based on SVM as the main classifier. Initially, the dataset was pre-processed by synthetic data generation and reduction techniques to balance up the number of data between classes in the dataset as well as remove redundancies. Then, the SVM was trained, and the improved Simulated Annealing (SA) algorithm was employed to enhance penalty parameter searching. The main contributions of this paper can be summarized as follows:
• We have proposed a new synthetic data generation and reduction strategy that aims at balancing the number of data between majority and minority classes in the dataset.
• We have introduced a new compensation parameter to improve the acceptance criterion of the SA optimization algorithm in searching for the best penalty parameter for the SVM.
This paper has the following structure: Section 2 discusses the related works to this research which is the SVM algorithm and its parameters. Then, the proposed imbalanced data classification algorithm featuring synthetic data generation and reduction with SVM was presented in Section 3. These include the description of the proposed improved SA algorithm as a penalty parameter optimization algorithm for the SVM. In Section 4, experimental setups, dataset, performance metrics used, and overall results and discussion were presented and discussed. Finally, this study is summarized and concluded in Section 5.
In this section, the Support Vector Machine (SVM) algorithm was briefly introduced focusing on its user-specified or tunable penalty parameter optimization. Recent methods for optimizing the penalty parameter including the SA-based techniques were also discussed.
SVM is a supervised machine learning algorithm that was initially proposed by [25] and uses a structural risk minimization technique and it is based on the Vapnik-Chervonenkis (VC) theory. This algorithm works by attempting to determine the value where the required margin maximization and training set error minimization is achieved. This is corresponding to the best generalization ability and the generated model attempts to avoid over-fitting. Moreover, one significant benefit of using an SVM is the ability to implement convex quadratic programming, which does not get stuck at local optima since it can output only the global optima. Given a training set comprising of
which can be simplified as
Based on this expression, the margin of the hyperplanes can be maximized by minimizing w where this is a quadratic programming optimization problem. The problem then reduces to the soft margin optimization where the optimal hyperplane can be found as follows:
where C is a user-specified penalty parameter and
To simplify the soft margin optimization problem, it can be represented in the function of Lagrangian dual variables such as follows:
where
Solving this optimization problem yields the discrimination function of SVM as follows:
where
Therefore, it can be seen from the descriptions above that the penalty parameter, C of SVM is a user-specified or tunable variable. In the case of a certain kernel function, there exist another parameter for this function that needs to be properly fixed along with C to achieve the best classification model.
A typical and classical approach to determining these parameters is a model selection approach [26]. This method finds both values using the grid search and cross-validation process which in turn limited the searchability and consumes a lot of computational time. Fast forward to recent years, the trends in solving the parameter selection problem for the SVM make use of the like of metaheuristic optimization and swarm intelligence algorithms.
For instance, [27] proposed an optimization method based on Simulated Annealing (SA) in the classification of medical standard datasets. SA is a random search technique proposed to find the global minimum of a cost function. This method looks for a proper solution to an SVM parameters optimization problem in the next state by trying random variations of the solution at the current state. This work adapted the SA technique with a standard SVM formulation but later expanded to be used with the Least-Square Twin SVM which has been shown to improve the overall classification accuracy [28].
Other methods such as bat algorithm (BA) [29], an ensemble Kalman filter (EnKF) based model [30], differential Particle Swarm Optimization (PSO) [31], a hybrid optimization method that combines Glowworm Swarm Optimization (GSO) and Genetic Algorithm (GA) [32], a novel differential evolution (DE) [33], a quantum-behaved particle swarm optimization (QPSO) [34], random forest (RF) method [35] and a combination of Moth-Flame Optimization (MFO) and knowledge-based-search (KBS) [36] have also been proposed in the literature to improve the optimization of these parameters when involving the implementation of SVM.
This section presents the details implementation of the proposed algorithm based on a hybrid approach. This study aims to formulate an algorithm that can address imbalanced data classification problems and provide precise results using SVM as a classifier. Furthermore, enhanced accuracy was emphasized along with a targeted efficiency enhancement by reducing the computational complexity.
The proposed algorithm comprises two major phases which are data pre-processing and data classification using SVM based on improved Simulated Annealing (SA) algorithm. The first phase involves two subtasks which are data generation and data reduction where input data is synthetically enhanced to improve the number of data between minority and majority classes. The next phase is related to the training of the SVM classifier where its penalty parameter, C was optimized based on the proposed improved SA technique. Lastly, the classification stage involving the trained SVM model with the unseen testing data from the improved dataset was conducted to measure the accuracy and performance of the proposed works. Fig. 1 below shows the framework of the proposed algorithm.
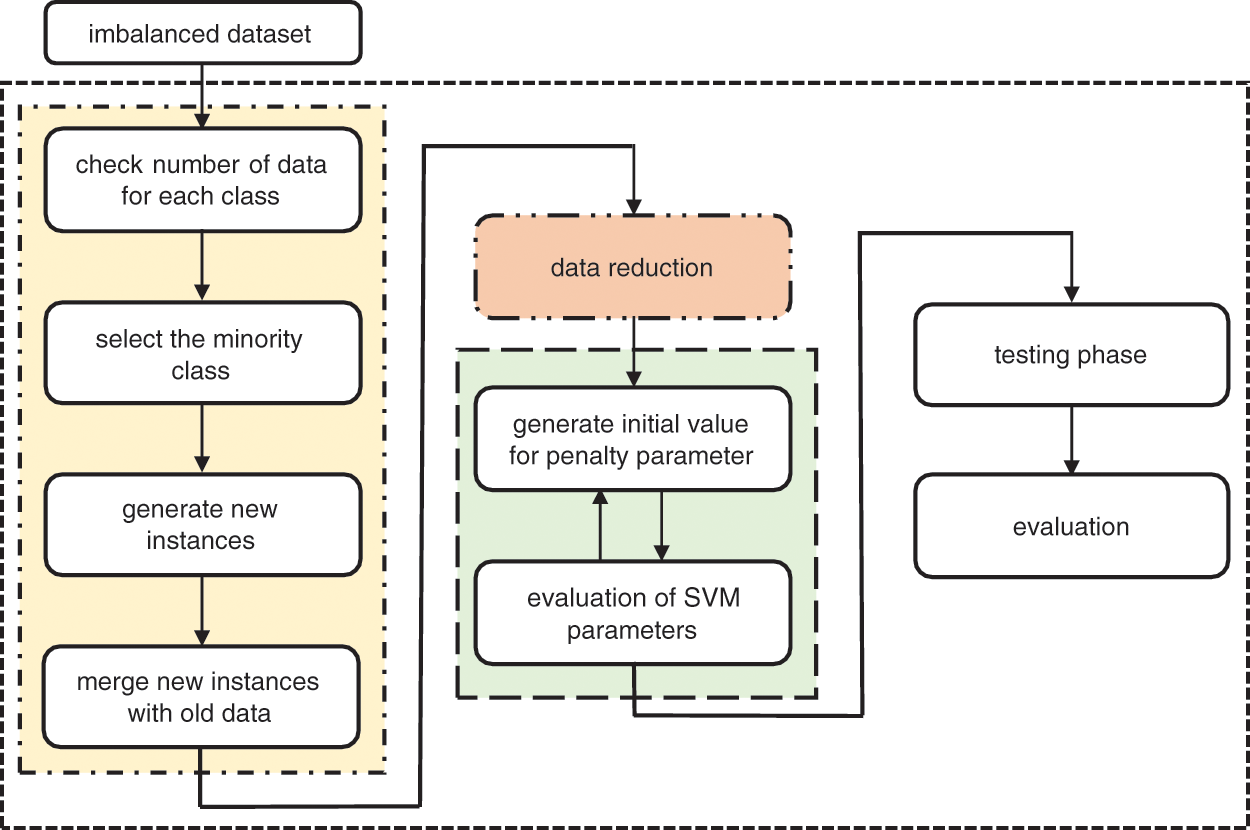
Figure 1: Framework of the proposed algorithm
This section described in detail the implementation of a proposed data pre-processing algorithm. In this algorithm, synthetic data are generated for the minority class and followed by the reduction of the data by removing the duplication and redundancy that exists in the dataset.
In this method, the imbalanced dataset is evaluated in terms of the number of data in each of its classes. The majority class which contains most of the data will be used as a reference in generating synthetic samples for the minority class. In this work, a new approach to synthetic data generation is proposed by examining the range of values in each of the features and randomly generating new data samples.
Assume the binary dataset consists of
The new class is formed by merging the minority class,
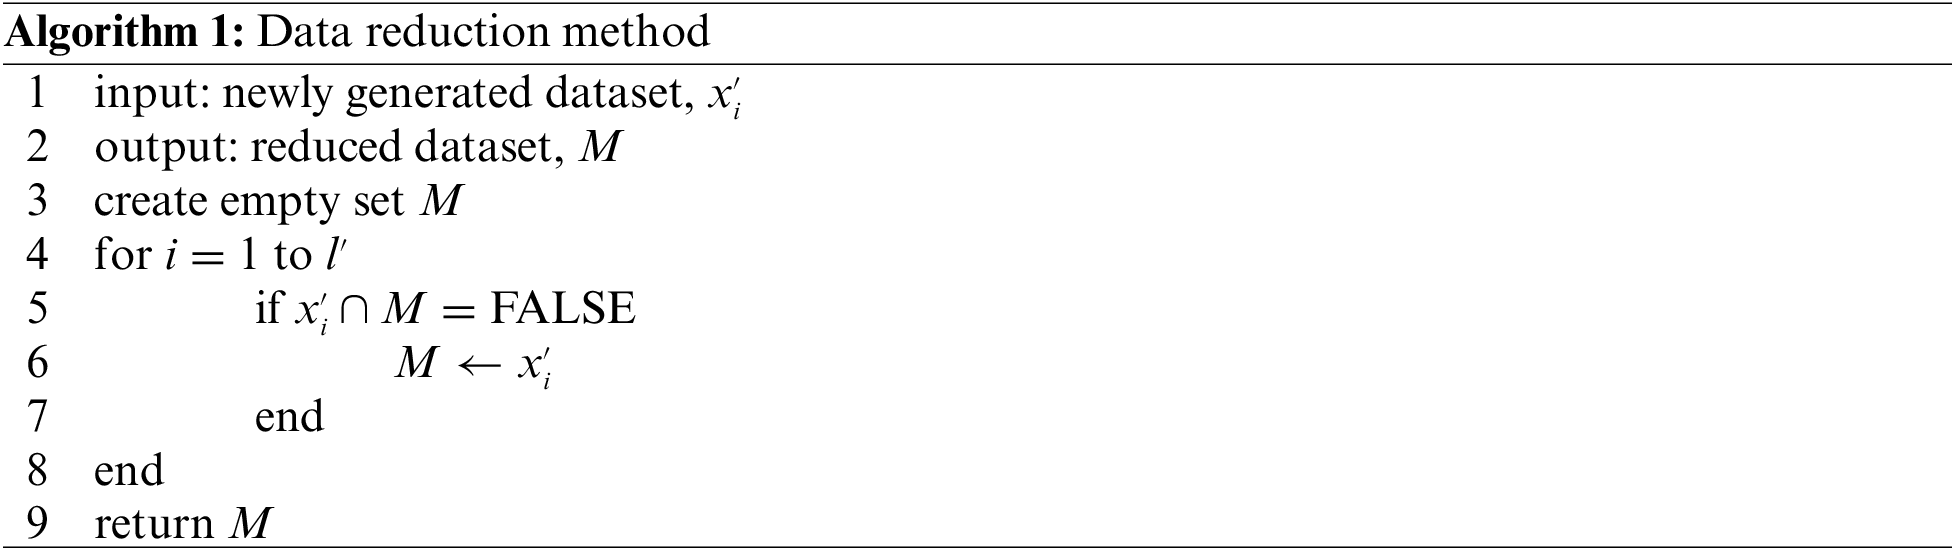
Once data generation is completed, there may be redundant or duplicated data samples that could affect the trained model. The proposed data reduction technique aims to eliminate duplicated samples at the data level and is employed to reduce this redundancy in the newly generated dataset,
In this technique, the data reduction method begins by creating an empty set M and each instance from the newly generated dataset
3.2 Penalty Parameter Optimization
Simulated Annealing (SA) is a global searching algorithm that was first proposed by [37] and later made popular by [38]. The fundamentals underlying the SA algorithm are borrowed from metallurgy whereby metal molecules undergo crystallization when they transit from the molten to the solid state as the temperature, T decreases gradually. All crystal grains transit to the lowest energy state, assuming that it is heated at an appropriate starting temperature and gradual cooling.
The SA algorithm formulated by [37] facilitates the betterment of the results during search iterations; moreover, the algorithm also does not halt at local optima. ‘‘Cooling’’ factor, which is analogous to the cooling of molten metal, enables steady convergence of the SA algorithm where the search outcomes point to the global optimum.
In this study, SVM was used in combination with SA to assess the efficacy of the penalty parameter, C that emerges from T during each iteration. The proposed technique attempts to reduce T so that the search outcome slowly converges to the global optimum. Parameter T is reduced by multiplying it with the proposed compensation parameter, V where its value lies in the range of (0,1].
There are two crucial stages in the SA algorithm used in this work: the initial state,
On the other hand, the current state is retained using probability values if the new state has relatively low accuracy. The probability cut-off is selected depending on the application and objectives. Such probabilistic transitions guide the system to a near-optimal state.
In each iteration, a random neighbor is selected. If the neighbor’s accuracy is higher than the current state, the neighbor is selected, and the parameter C is replaced with the value corresponding to the new state, the SA process accepts a new or best solution
where fitness function
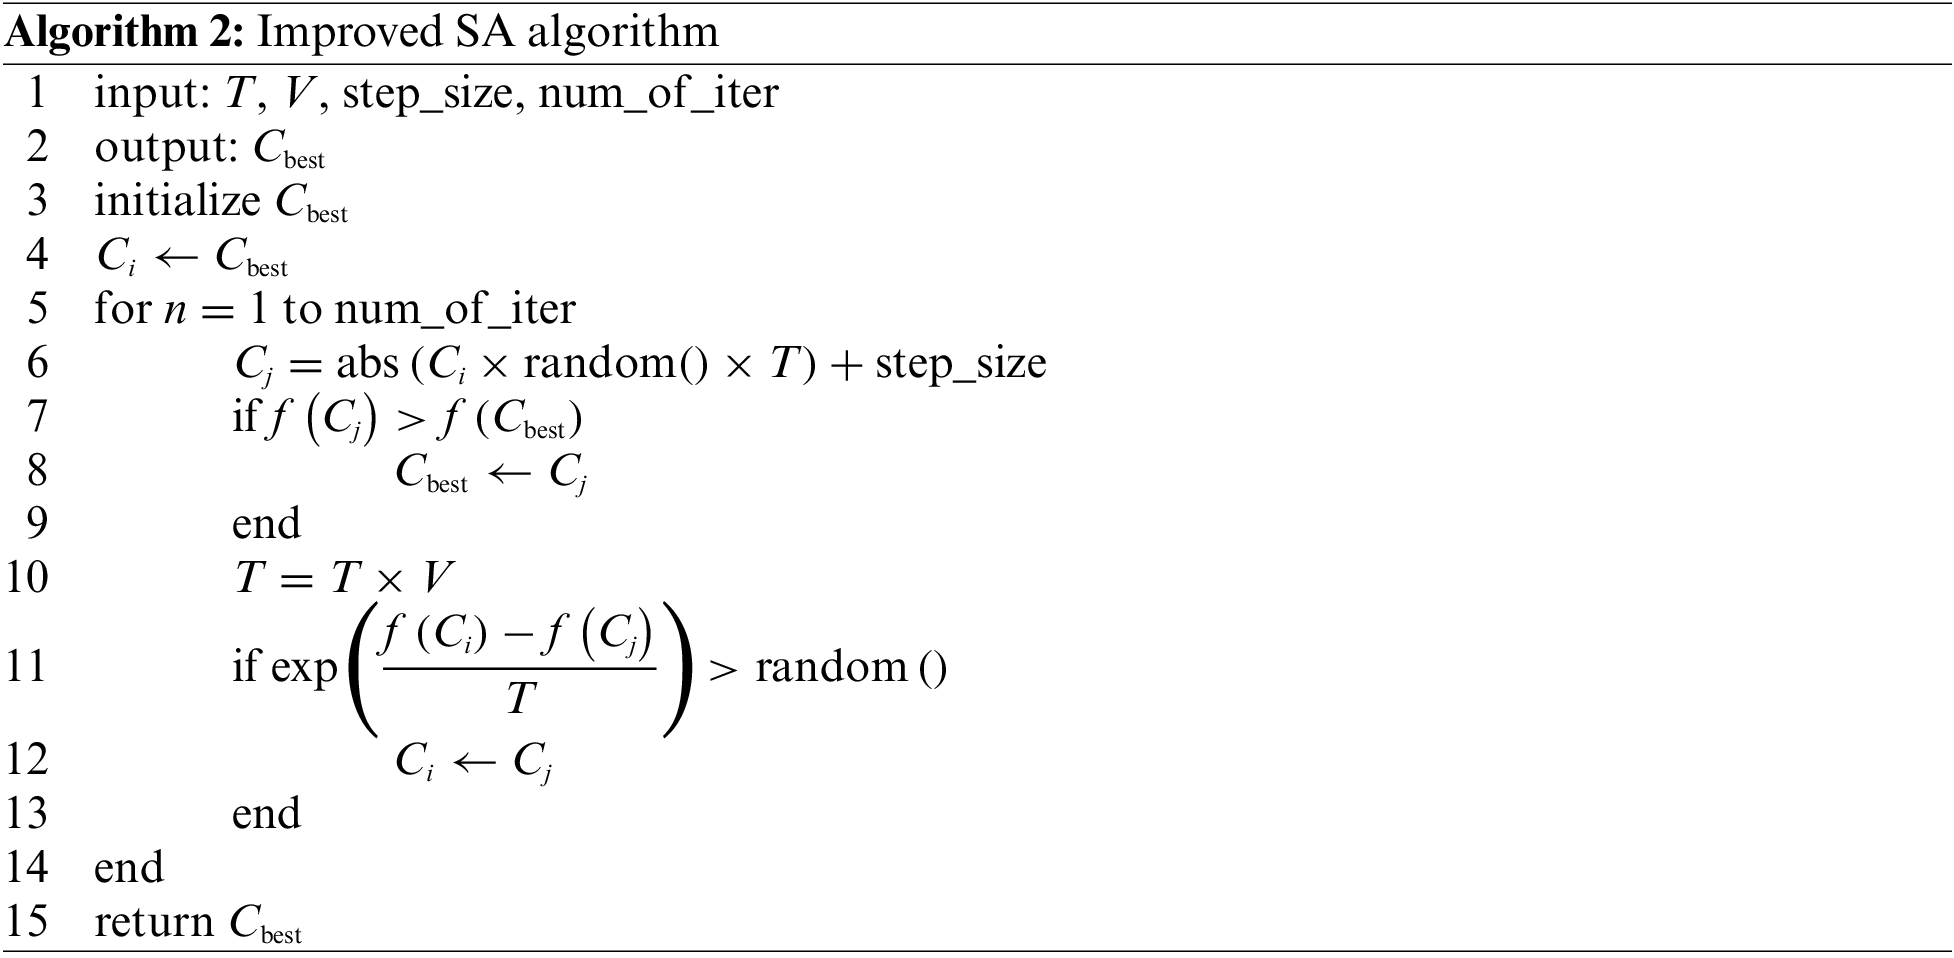
From Algorithm 2, the acceptance criterion for each iteration is based on the reduction of temperature, T by the factor of V which is the proposed compensation parameter. This is different from the conventional Metropolis criterion which solely relies on the reduction of T based on the number of iterations. To demonstrate this difference, Fig. 2 shows plots of the Metropolis acceptance criterion for conventional formulation and the proposed technique concerning the number of iterations and differences of the fitness function values,
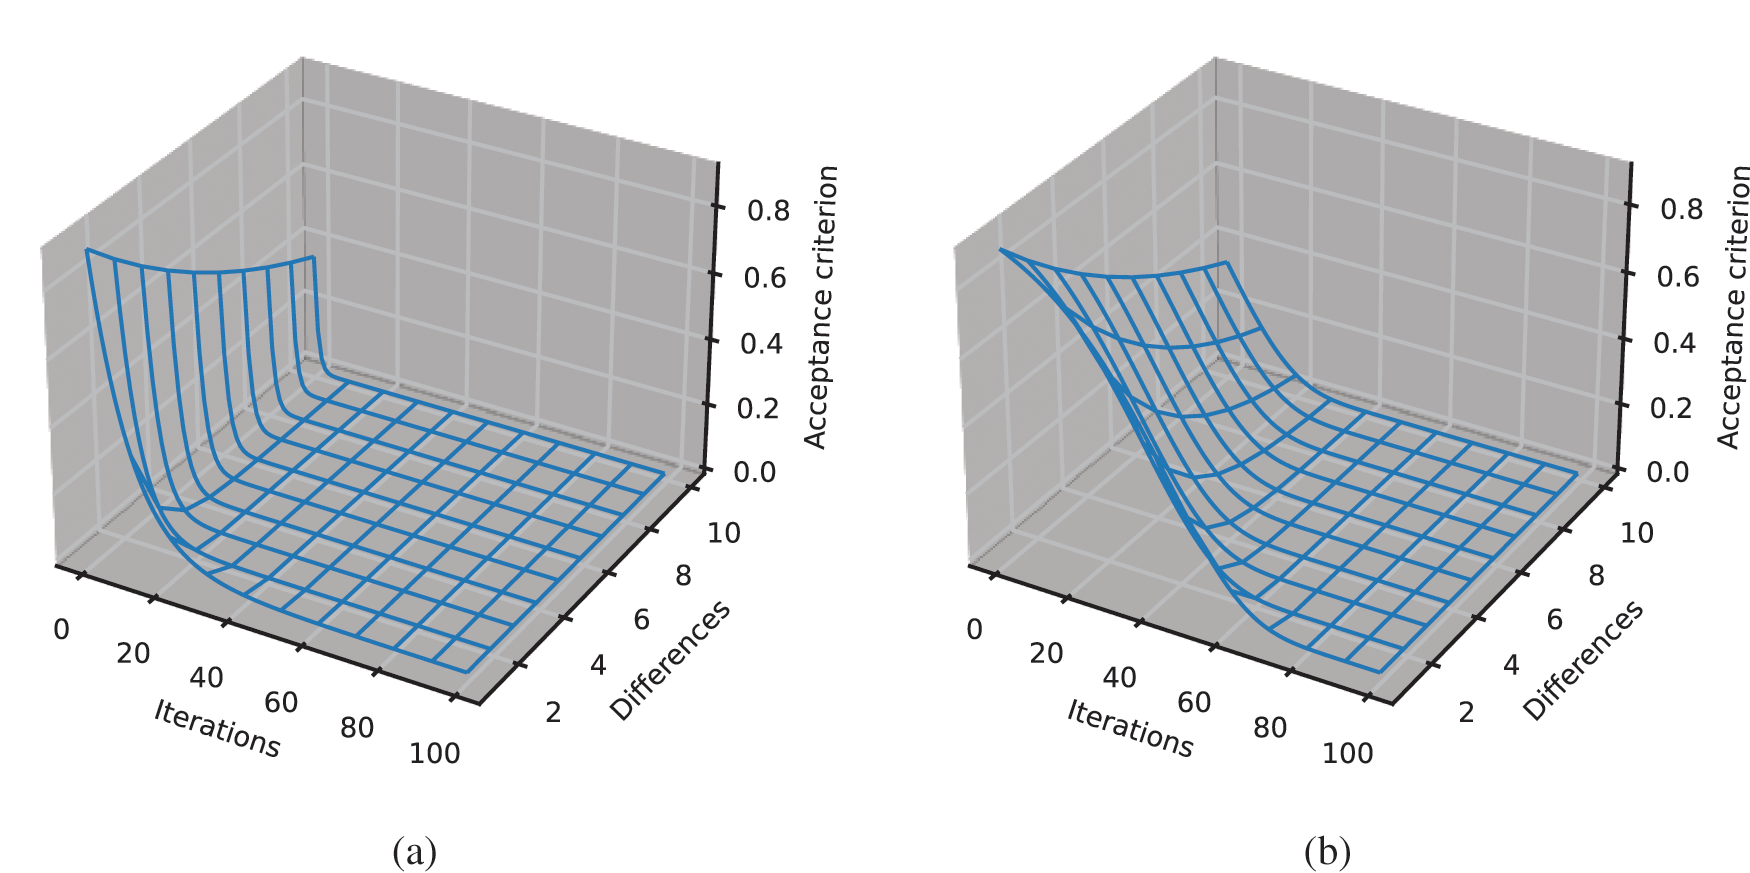
Figure 2: Plot showing acceptance criterion with respect to the number of iterations and differences of accuracy values at
This section provides the details of the analysis and performance measurements of the proposed algorithm using ten of the most used publicly available datasets. The sections are organized as follows; datasets, performance metrics used, experimental procedures, and lastly the results and discussion.
Experimental works were executed using datasets from the UCI machine learning repository (https://archive.ics.uci.edu/ml/index.php) which is publicly available. The overview of the chosen datasets is shown in the table below where all of them are imbalanced and have binary classes.
The first phase involving data generation and reduction results uses Principal Component Analysis (PCA) plot to achieve data visualization. The plot of the first two principal components is a good starting point for data exploration as well as showing the distribution of the newly constructed dataset.
The second phase of the reporting consists of classification results which make use of metrics such as overall accuracy computed as follows:
where TP, TN, FP, and FN are true positive, true negative, false positive, and false negative, respectively. Considering the special characteristics of class-imbalanced problems, the traditional evaluation criteria such as accuracy alone will result in the following problems: for higher global classification accuracy, the traditional classifier directly classifies the sample of minority class into majority class and obtains a higher global accuracy rate, but the correct classification rate for the sample of minority class is low. Therefore, the traditional single evaluation system using accuracy measure only will no longer be adapted to the evaluation system of the class-imbalanced classification problem.
To make sure that the performance measurement process is effective and capable to show significant data, other metrics such as recall and precision are used as specified in the formulas below:
The expressions above cannot be interpreted unless they are used together. Practically, a combined effectiveness metric such as
In the end, to visualize the classification of the constructed dataset, a receiver operating curve (ROC) was used which utilizes a true positive rate and a false positive rate. The area under the ROC curve which is known as AUC was also computed for each dataset.
In this works, the proposed algorithm was implemented using Python programming language running on a Windows 10-based computer system having an Intel® Core™ i7 CPU @ 7 GHz processor and a total of 8.00 GB RAM. Initially, all data in the dataset are normalized, and follows by each of the datasets was divided into two sets in the following manner: 70% of the data is for the training set and the remaining 30% is for the testing set. The training set was used in data generation and reduction steps as well as in determining the best parameters for SVM using SA. The SVM algorithm was trained using a linear kernel for all training datasets. Finally, the test set was used to evaluate the performance of the classification and all metrics described in Section 4.2 are computed.
In this section, the results of the proposed method are presented. It contains two categories which are the reporting of the results for data pre-processing and follows by the classification results. The first phase of the proposed method aims to increase the number of data in the minority class through synthetic data generation and reduction steps. Meanwhile, in the next phase, the classifications of testing datasets were implemented and reported in the second subsection.
4.4.1 Data Generation and Reduction Results
Table 2 tabulated the details of the results from this phase where the original and a new number of the data are reported for each selected dataset along with the percentage of increment of samples in the minority class. As can be seen from Tables 1 and 2, the number of synthetic data generated for the minority class is proportional to the imbalanced ratio for the dataset. The higher the imbalanced ratio will result in more synthetic data being generated for the minority class. For example, in the case of the hepatitis dataset, the imbalanced ratio of 3.84 has in turn yielded a massive 284% more samples generated for its minority class. The PCA plot was used to illustrate the distribution of the first two principal components in the feature space for each dataset before and after the data pre-processing algorithm was executed. Plots for all datasets are shown in Fig. 3. This is to visually demonstrate the efficacy of the proposed data generation and reduction algorithm in achieving a balanced dataset before the training of a classifier.
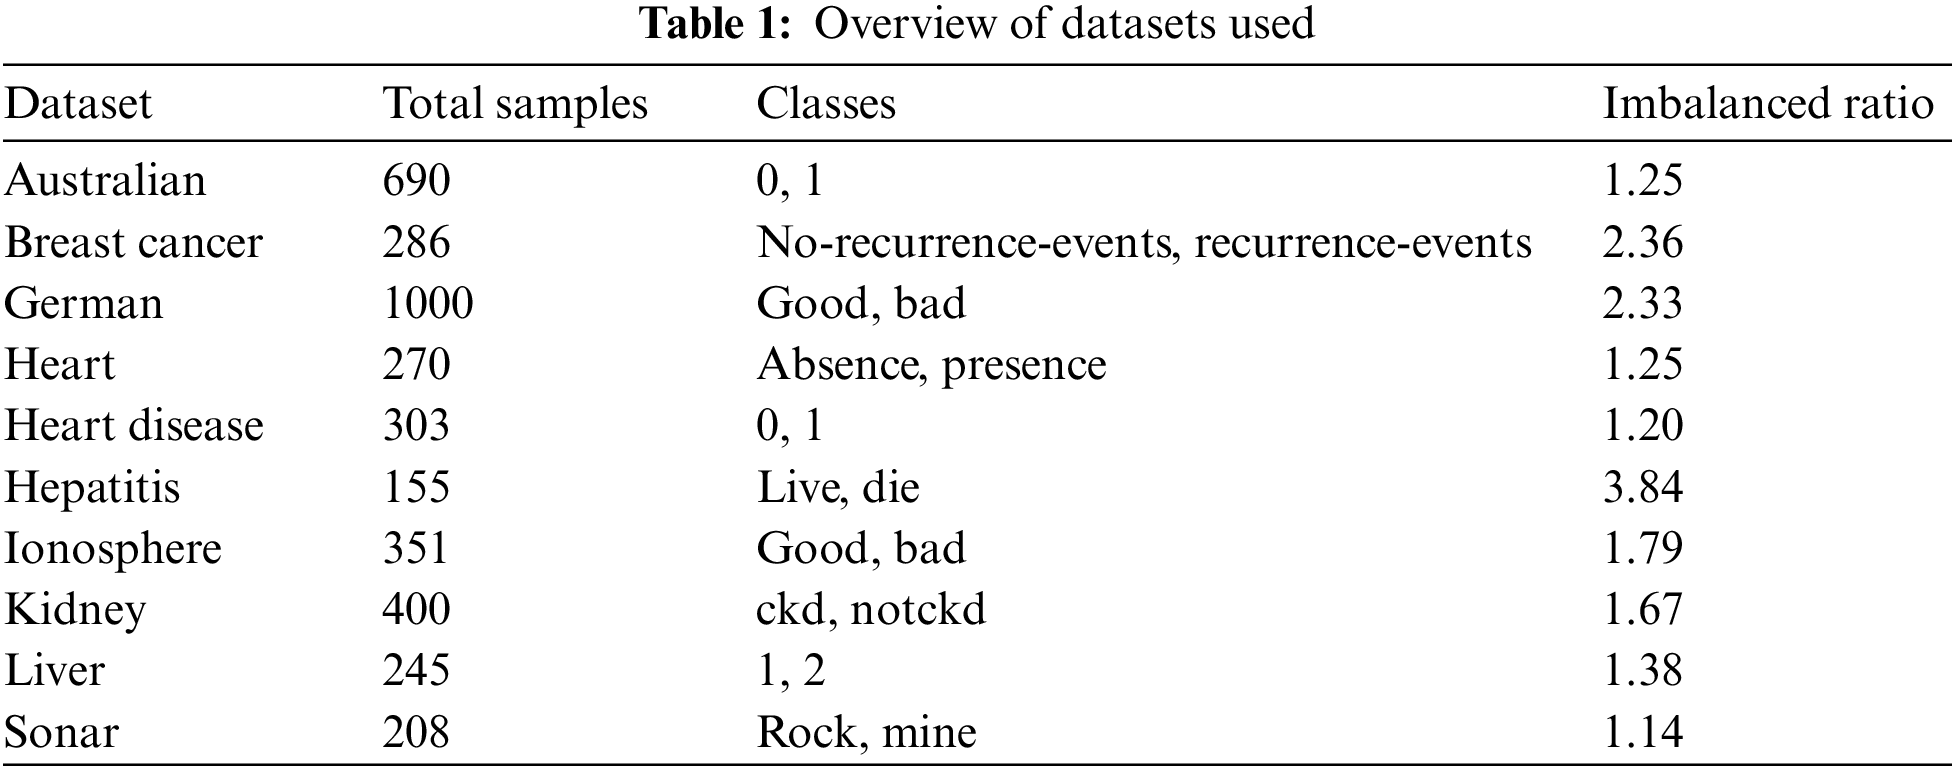
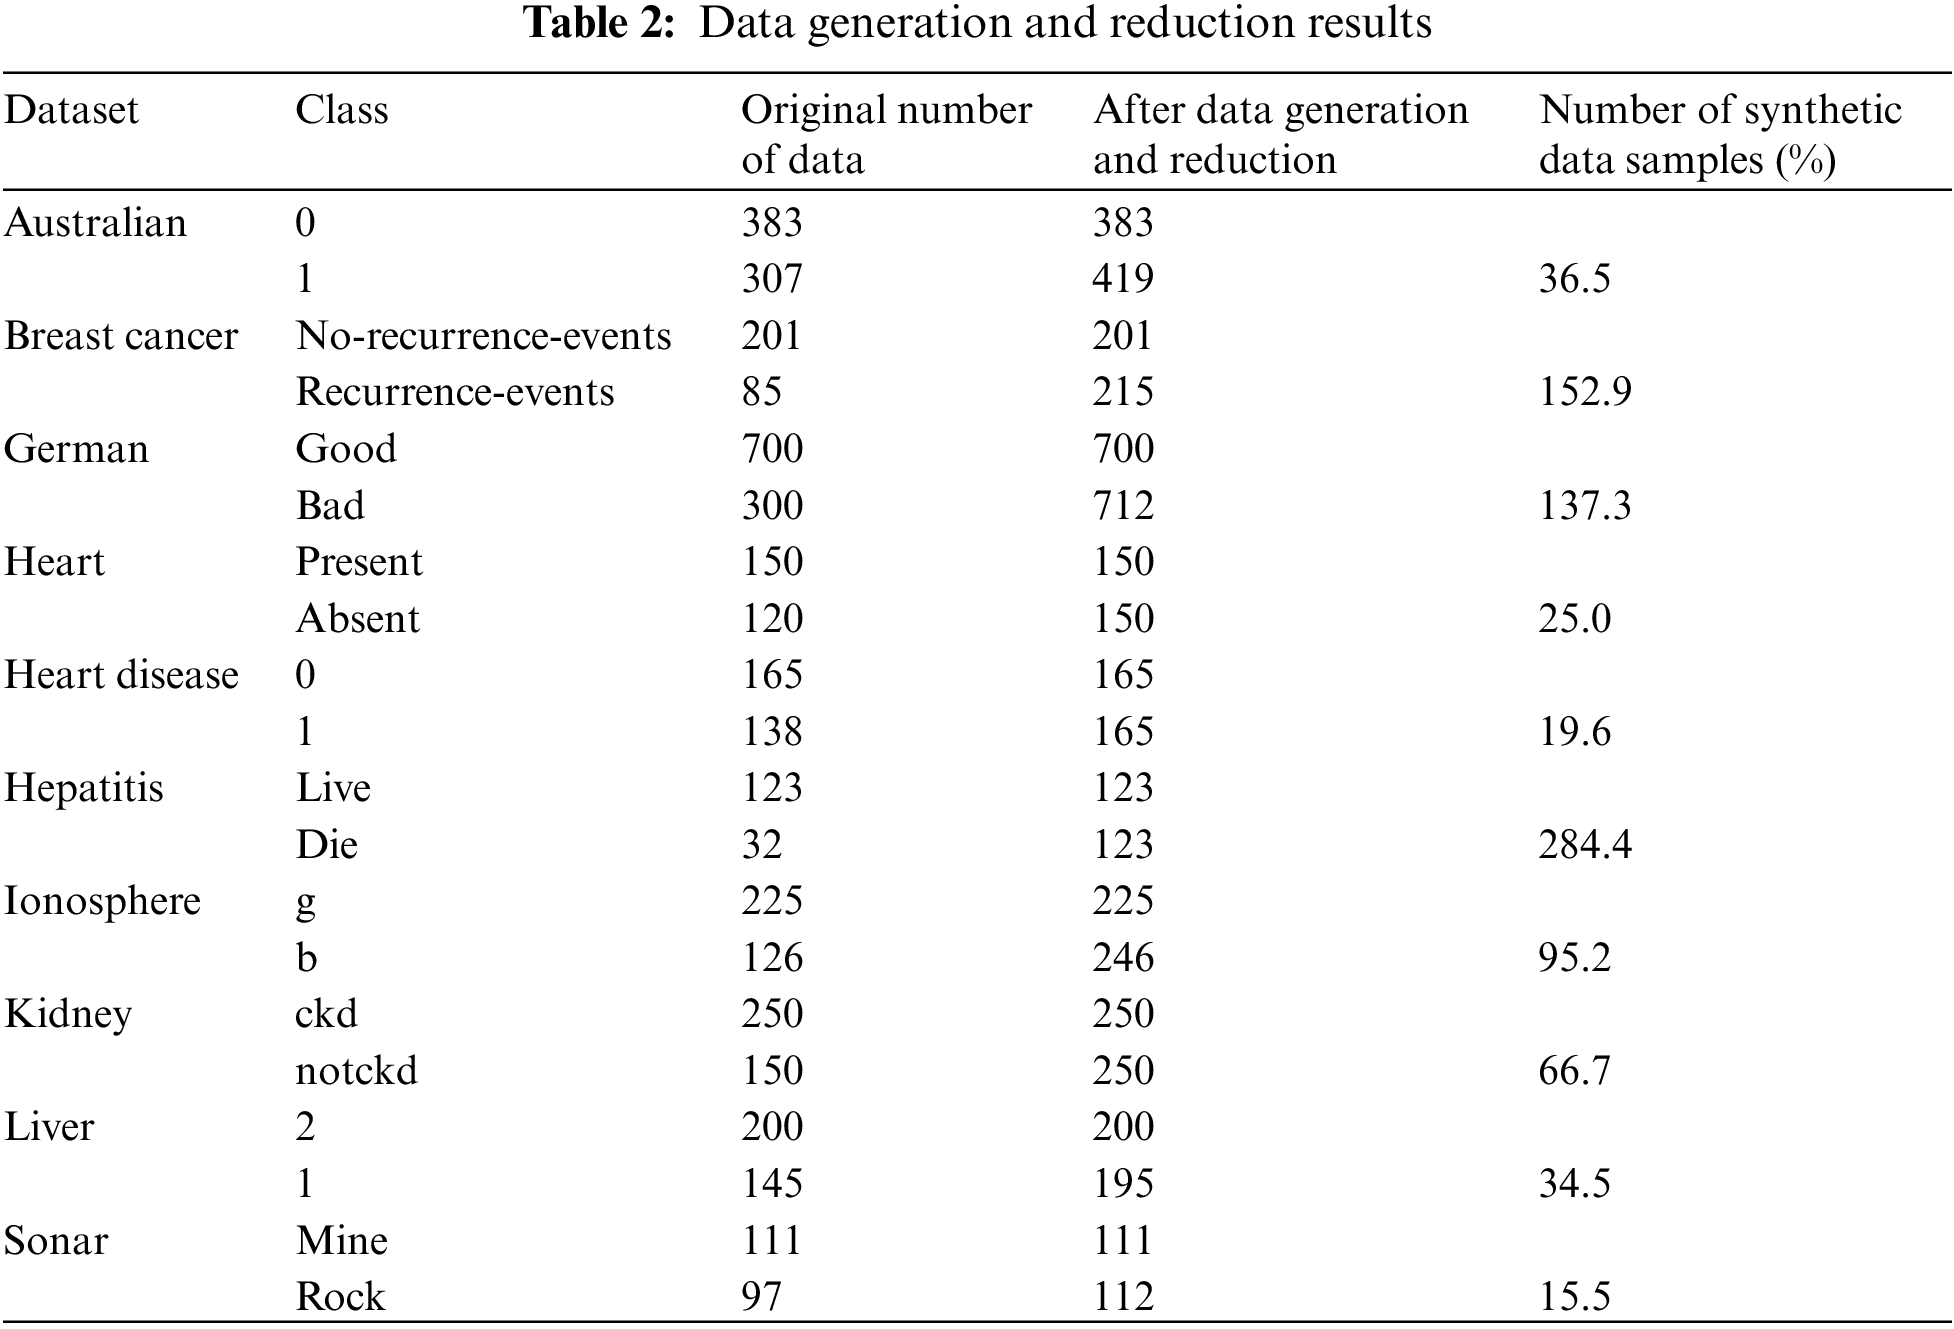
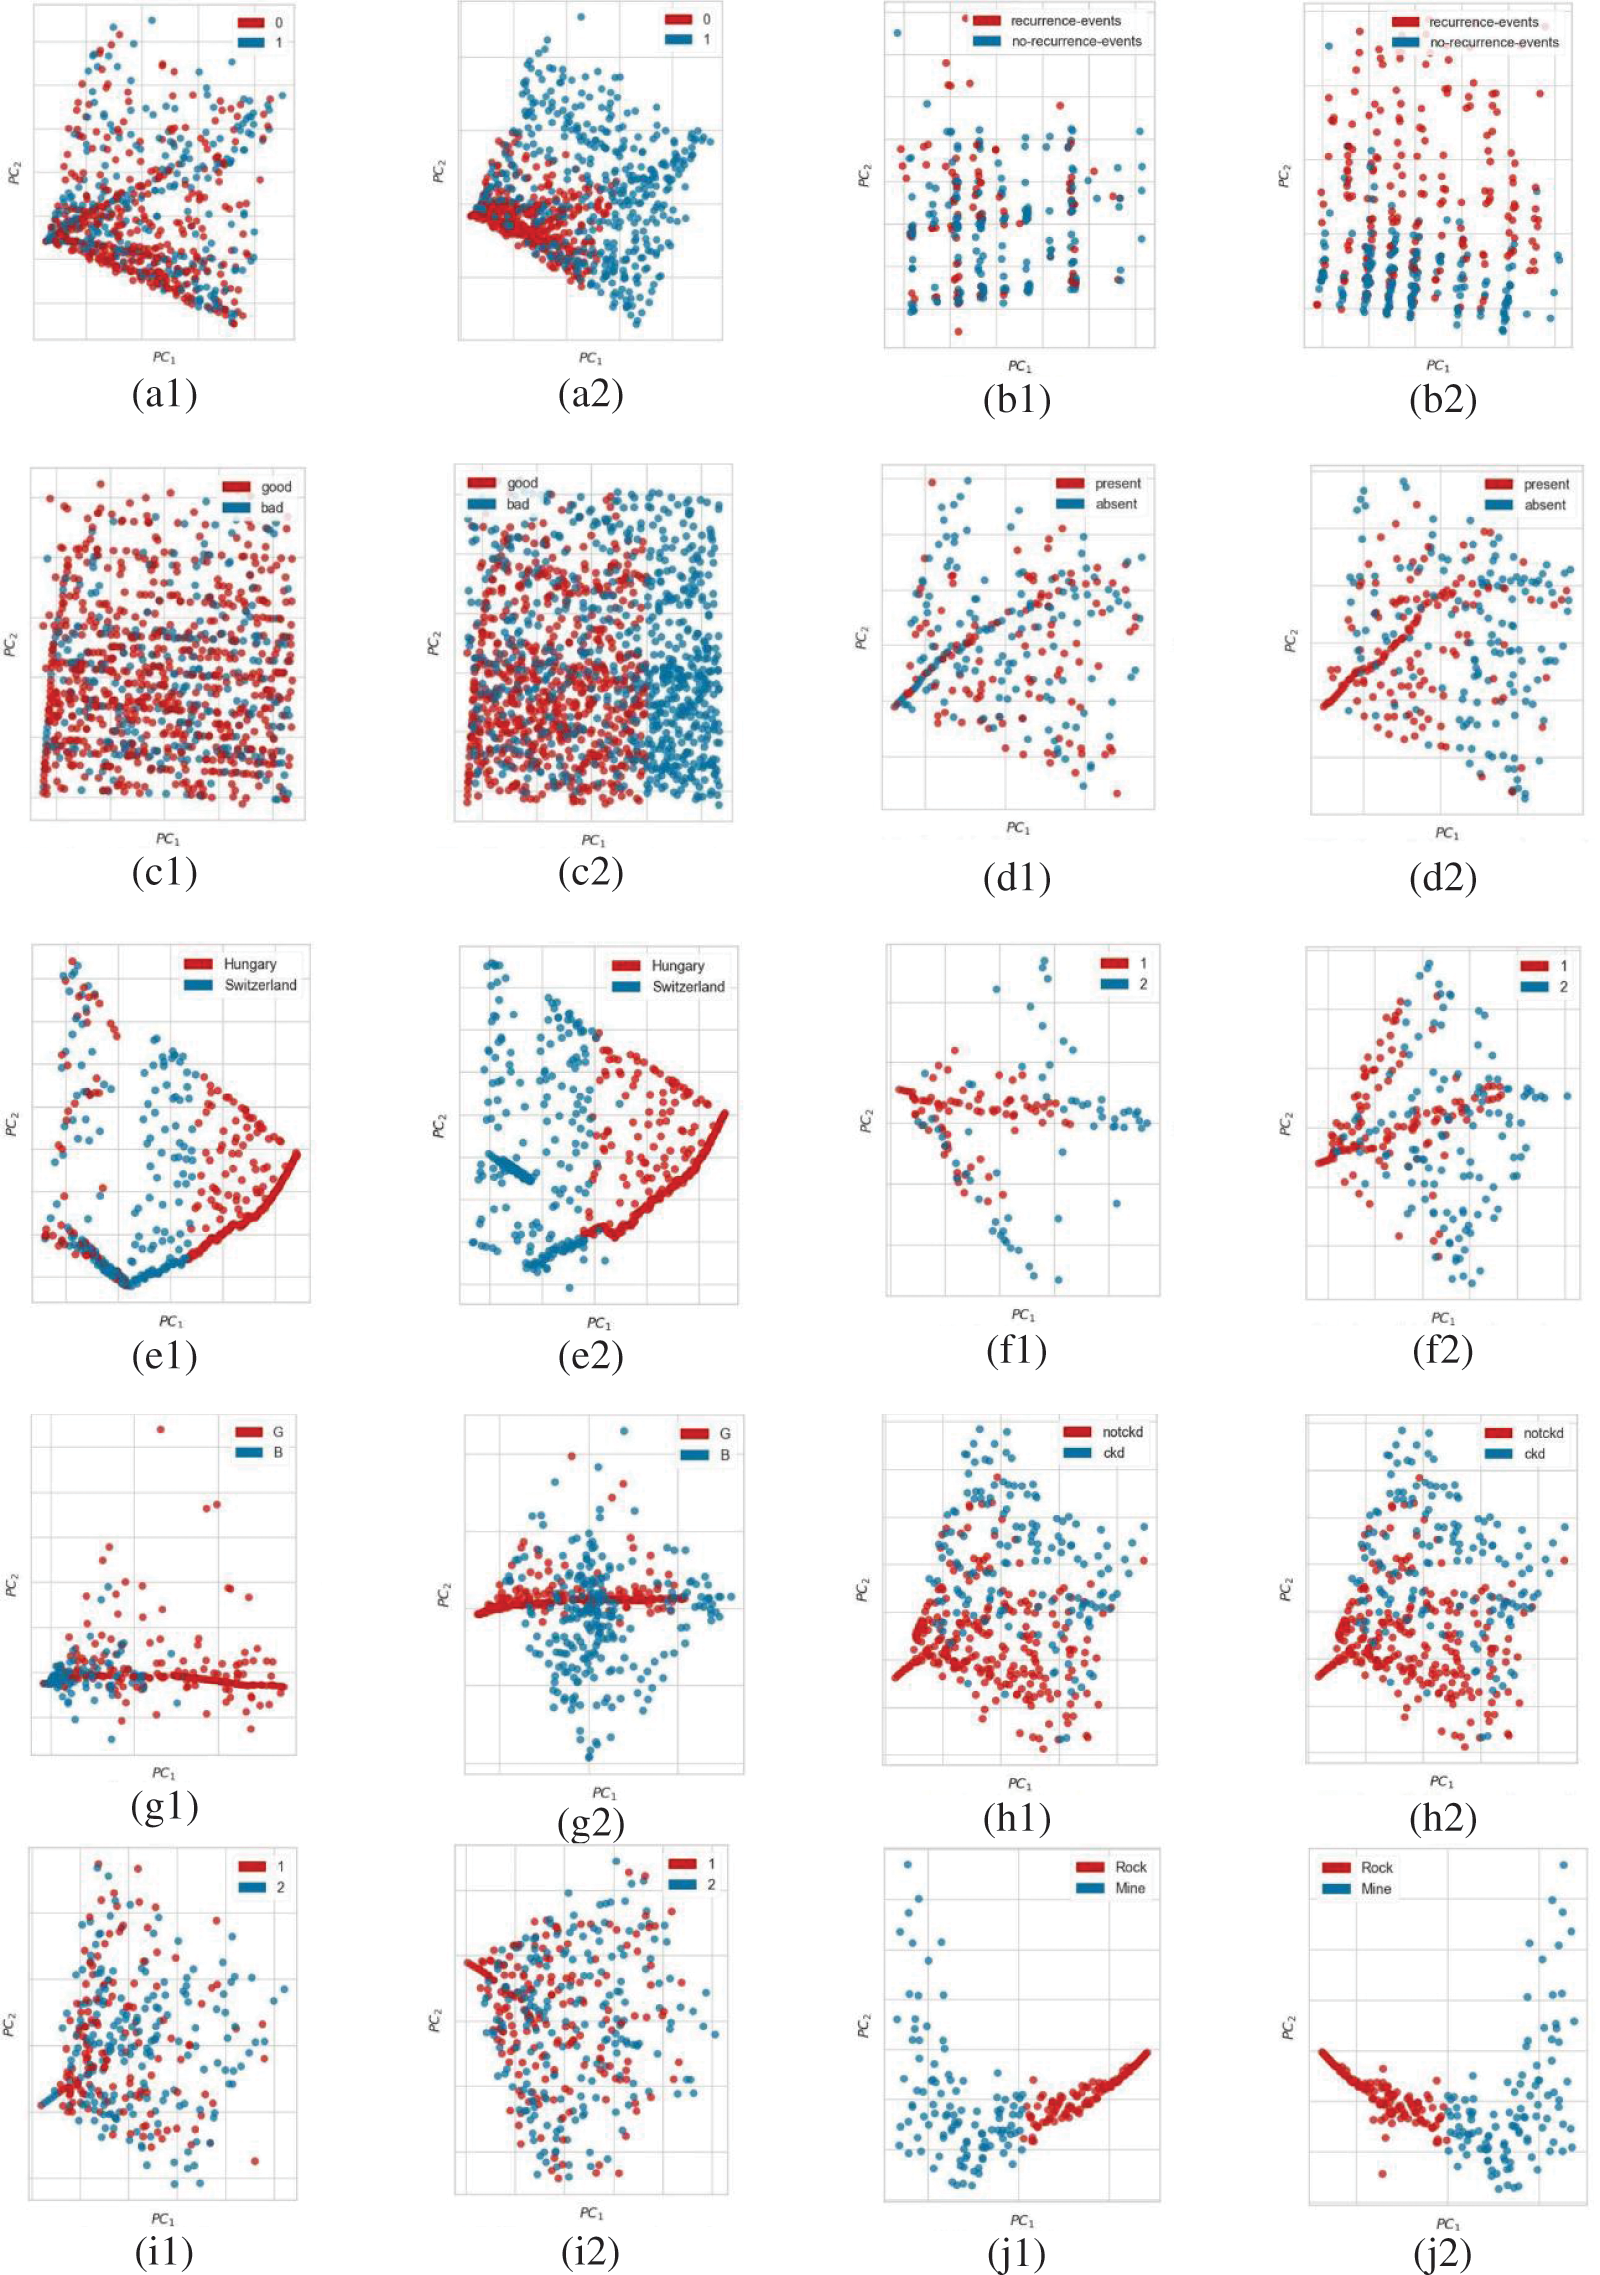
Figure 3: PCA plot showing the distribution of principal components of the dataset before (noted with 1) and after (noted with 2) data generation and reduction algorithm; (a) Australian, (b) Breast cancer, (c) German, (d) Heart, (e) Heart disease, (f) Hepatitis, (g) Ionosphere, (h) Kidney, (i) Liver, and (j) Sonar
As seen from Fig. 3, all corresponding PCA plots after data generation and reduction (denoted with index 2) have validated the ability of the algorithm to synthetically increase the data in minority class towards balancing the dataset without altering the generalization of data distribution in feature space.
In this section, the classification results of the test set from the selected dataset shown in Table 1 are reported. The test set is the unseen data set aside from the main dataset before the pre-processing algorithm is executed. The classification results of the original training and test dataset using SVM are as tabulated in Table 3. These results are based on the implementation of the conventional SVM algorithm and will be used as references in comparison to the proposed method.
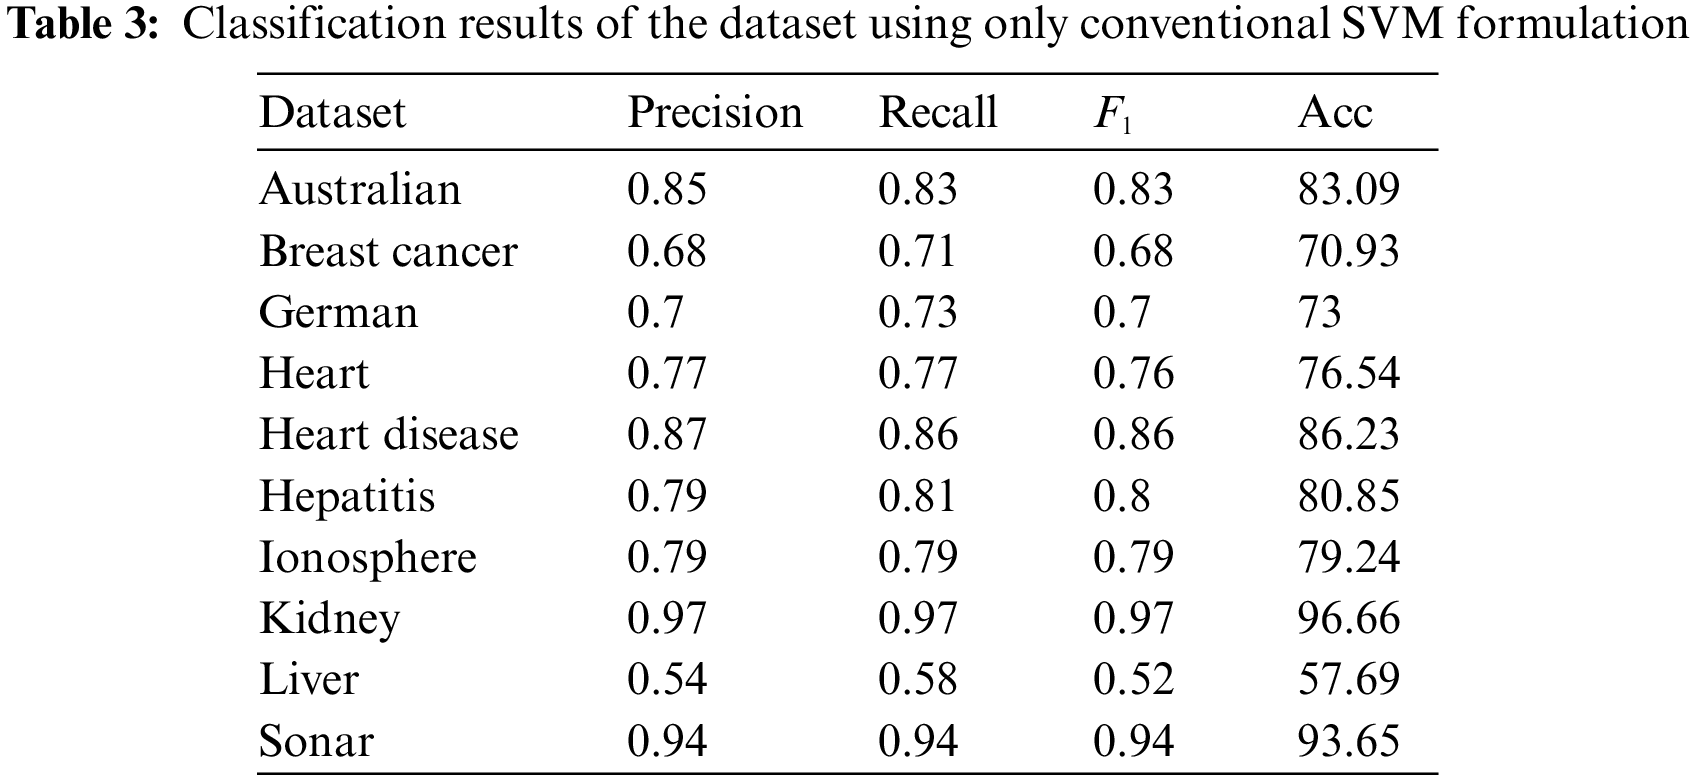
From Table 3, kidney and sonar datasets have recorded the best accuracy and
Table 4 tabulated the classification results using the proposed method. Clearly from the table, the accuracy values reported are improved for all datasets. The classification results for the breast cancer dataset using the proposed method have achieved the best improvement of a more than 20% increase in accuracy compared to only 70.93% when classified with the conventional SVM algorithm. To achieve this, the training set for the breast cancer dataset was trained with the value of T and V fixed at 1.5 and 0.8 respectively and the number of iterations was set at 250. Then, the best parameter C found by the improved SA algorithm is 994.8.
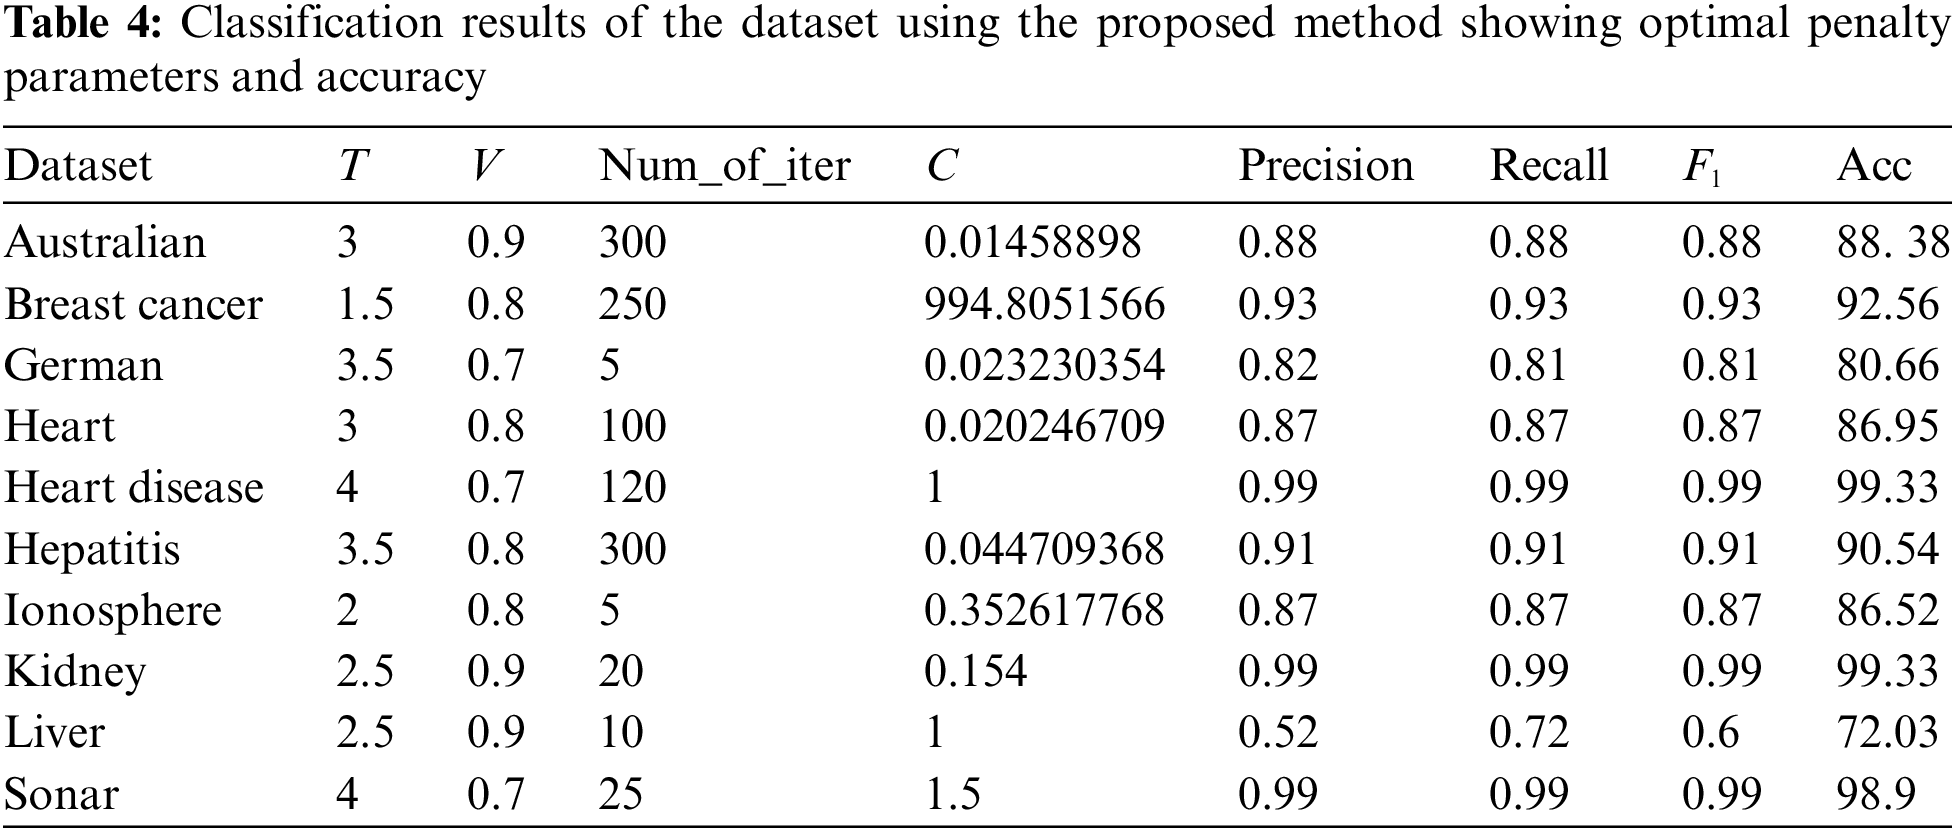
For liver, heart, and heart disease datasets, the accuracy has improved significantly between 10% to 15% while all other datasets have recorded an improvement by at least more than 2% when classified with the proposed method compared to the classification with conventional SVM. On another note, it can be observed from Table 4, the number of iterations initialized in the proposed improved SA depends on the distribution of the datasets including their separability in the feature space. Half of the datasets required a higher number of iterations such as more than 100 for the solution to be found.
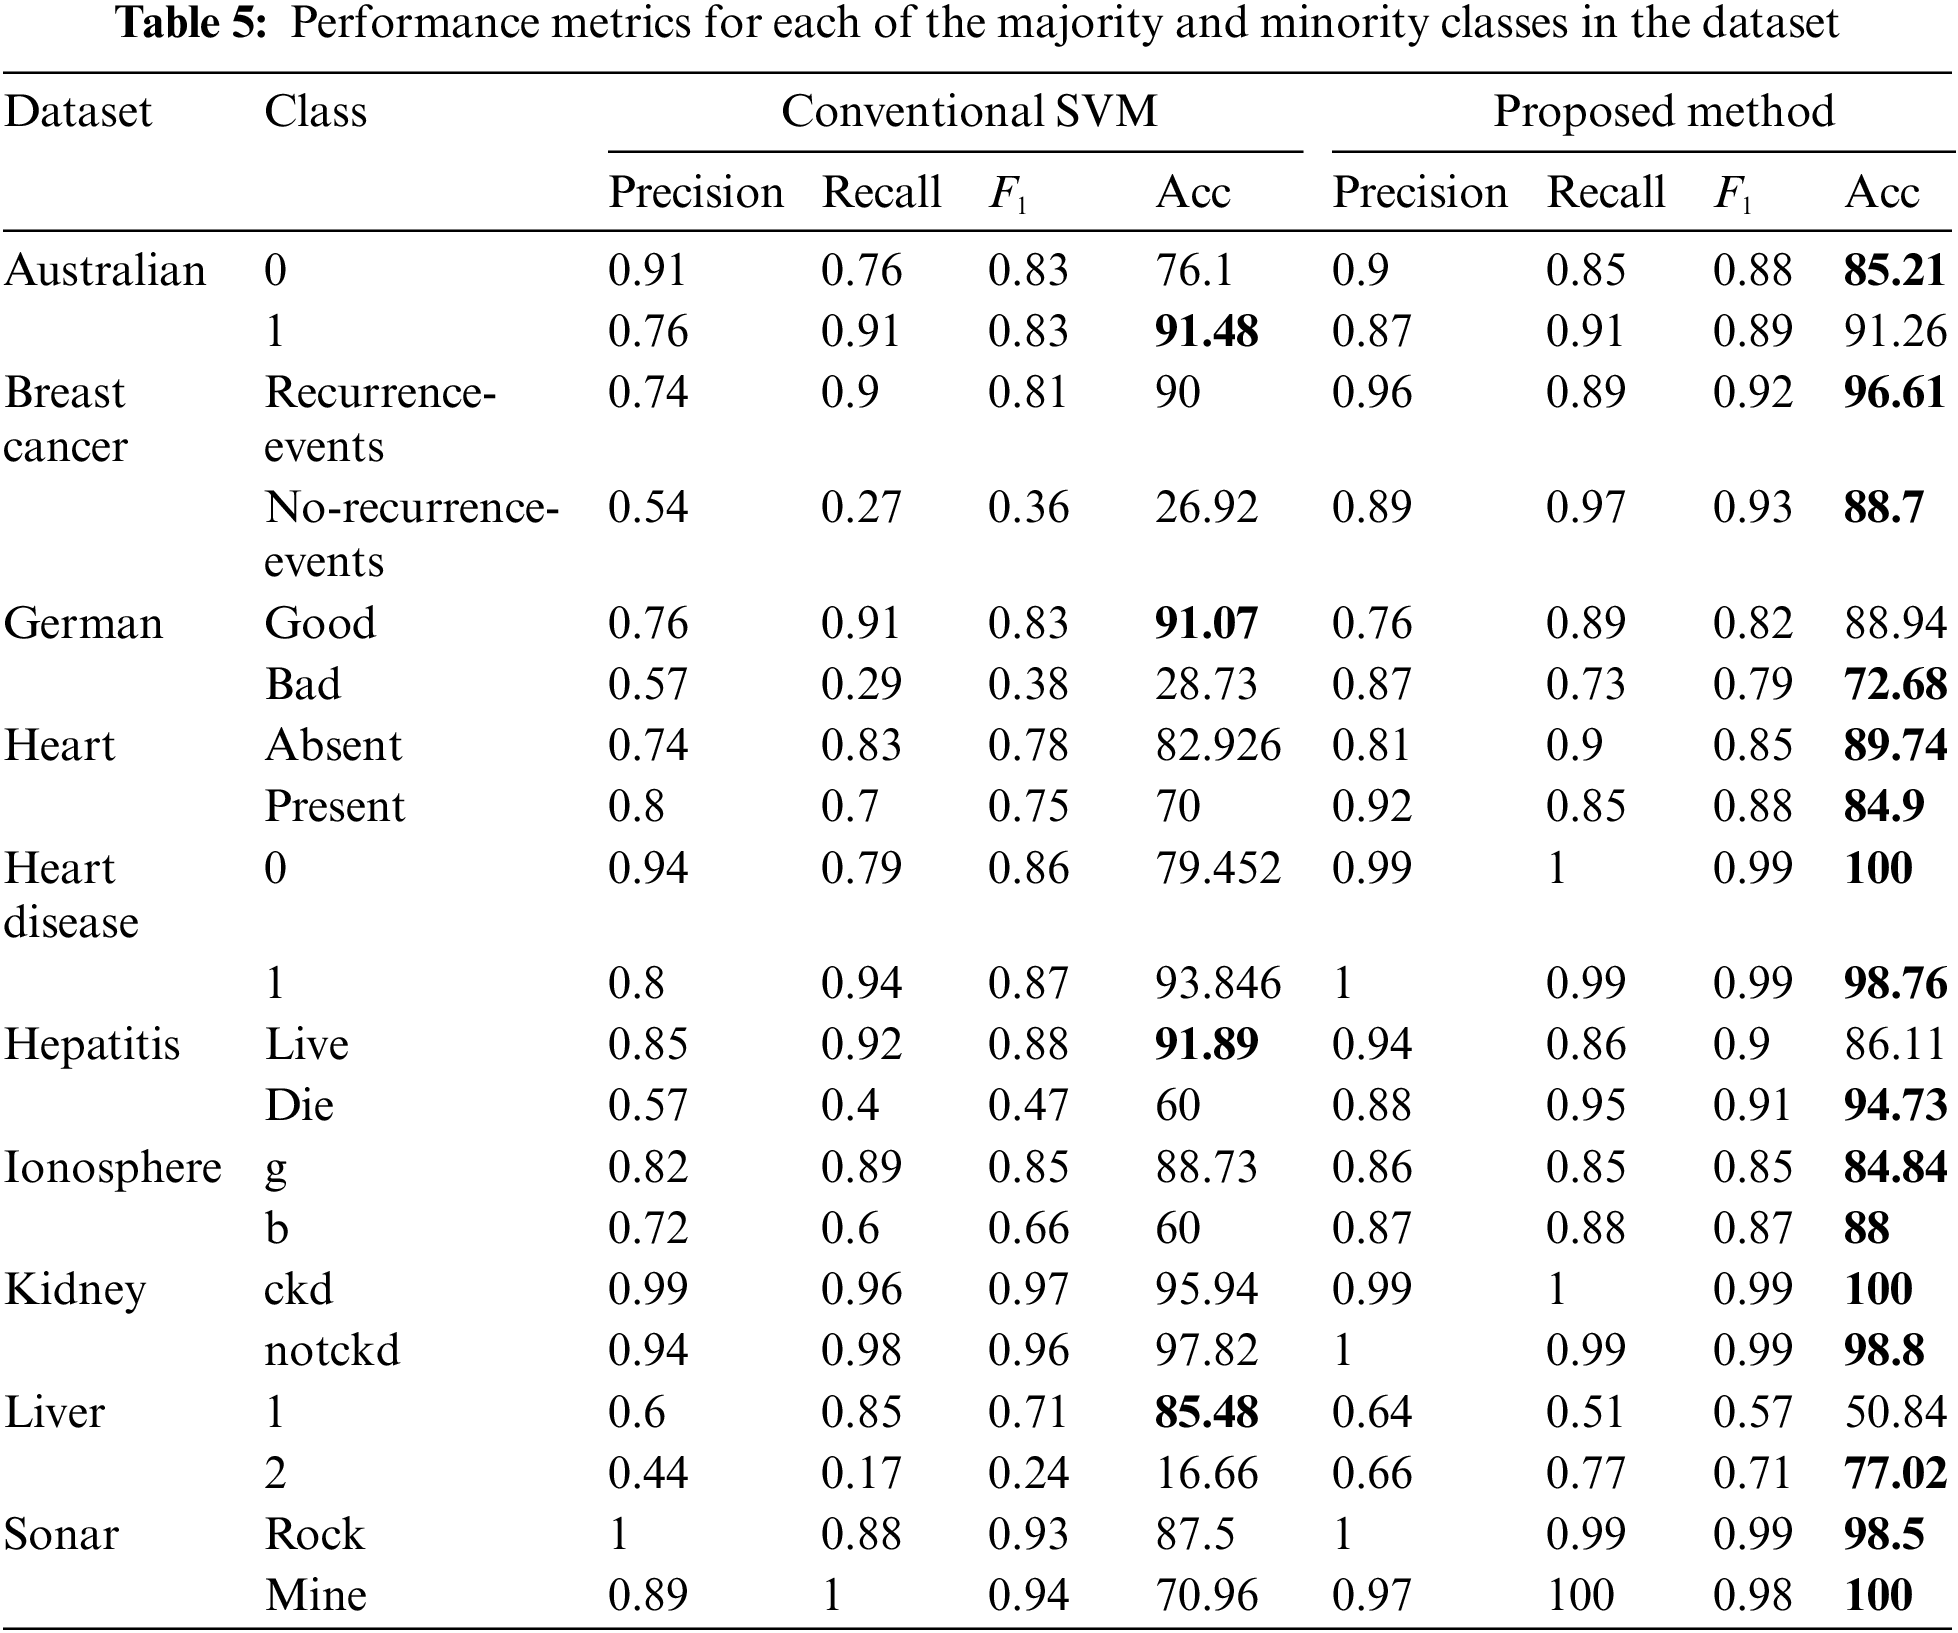
Meanwhile, in Table 5, the detailed results of the performance metrics for each majority and minority class in the dataset are tabulated. This is to examine the efficacy of the proposed method in achieving the aim of balancing the dataset and at the same time increasing the classification results compared to the implementation of the original dataset with conventional SVM. As can be seen from Table 5, all datasets recorded an increment in the accuracy measure as well as precision, recall, and
To demonstrate the effectiveness and performance of the proposed classification method, the ROC curve was used, and the AUC was computed for every dataset as shown in Fig. 4. As can be seen from the figure, the proposed method performs well in the classification of the heart disease, kidney, and sonar datasets registering an AUC of 1. This is followed by breast cancer, australian, ionosphere, and hepatitis with AUC of 0.95, 0.94, 0.93, and 0.91, respectively. At the lower end is the classification of the liver dataset with an AUC of 0.69 only. In general, these data have supported the reliable performance of the proposed method in dealing with binary classification problems.
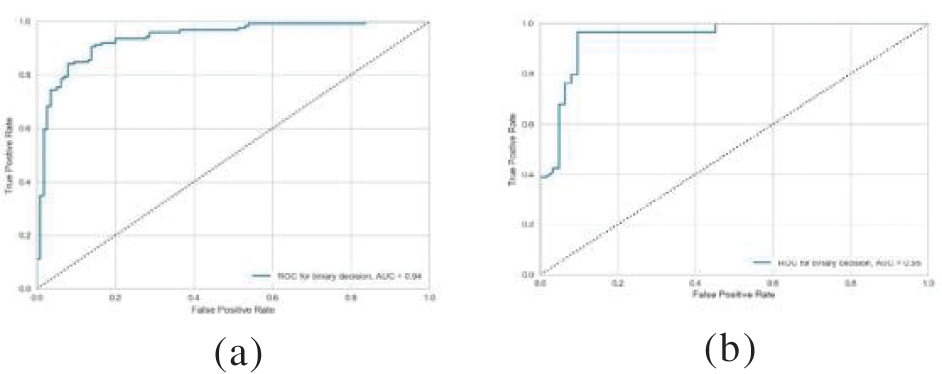
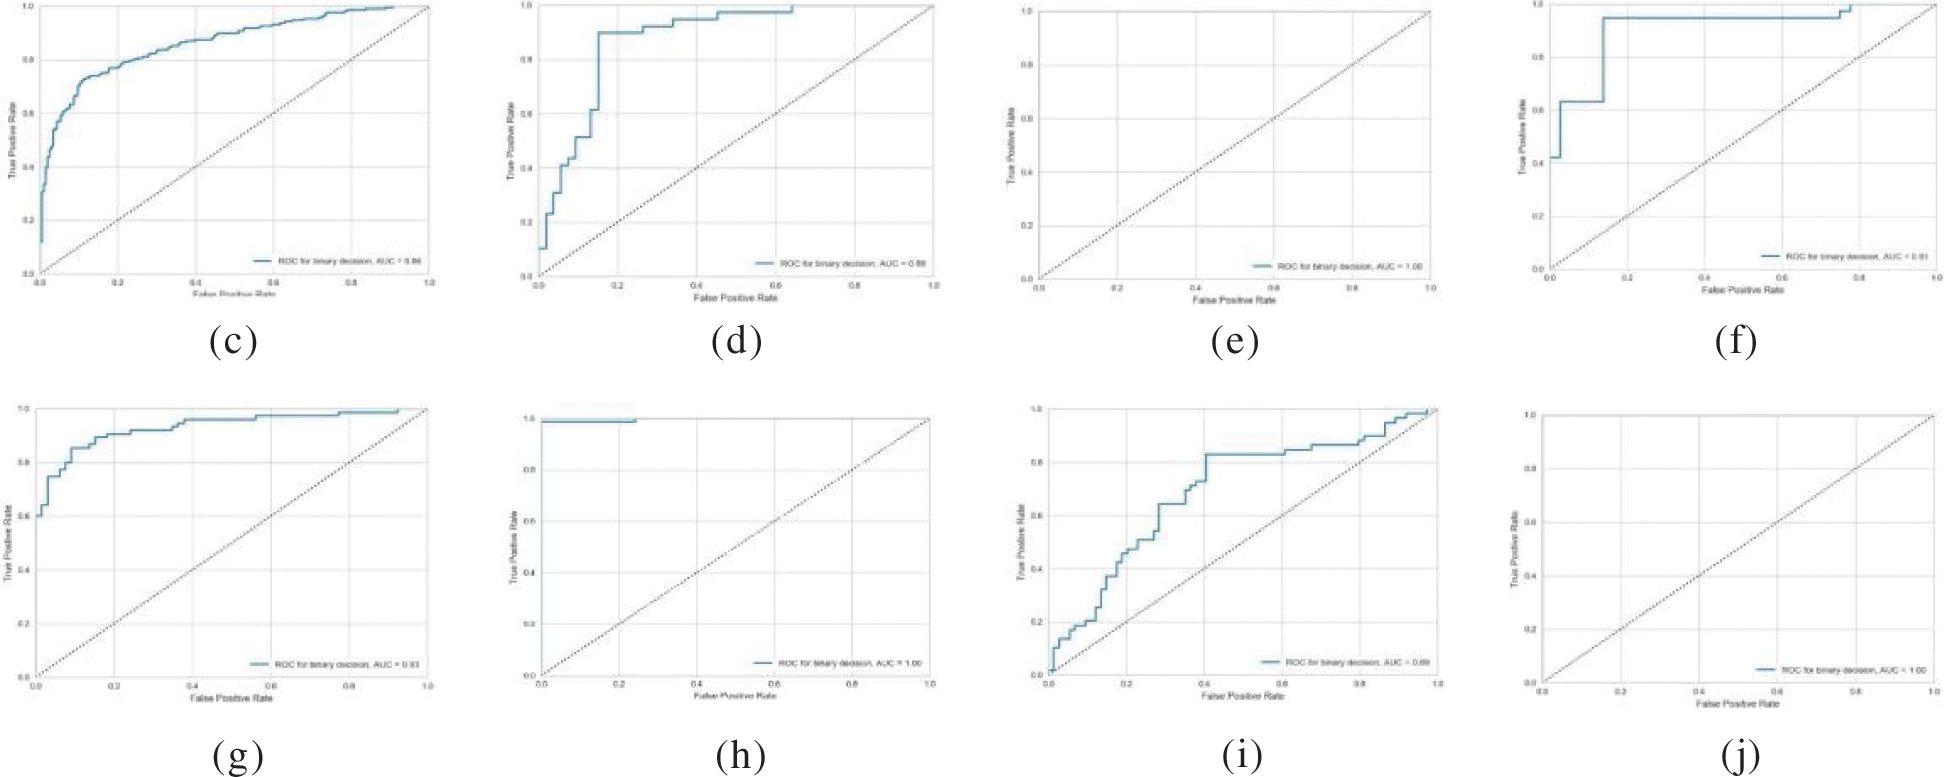
Figure 4: ROC curve for classification results for each dataset; (a) Australian, (b) Breast cancer, (c) German, (d) Heart, (e) Heart disease, (f) Hepatitis, (g) Ionosphere, (h) Kidney, (i) Liver, and (j) Sonar
In this work, a hybrid approach involving a data pre-processing strategy and an improved SVM parameter searching algorithm was proposed to overcome the problem of imbalanced data classification. This approach is based on a new strategy to pre-process the dataset and utilization of improved SA algorithm to optimize the parameter searching of the SVM classifier. In the data pre-processing stage, an effective synthetic data generation and reduction strategy was proposed to balance the number of data between the majority and minority classes in the dataset. Experimental results have demonstrated the effectiveness of this data pre-processing technique where all the distribution of the data between classes used in this study has been successfully enhanced. Moreover, the proposed data pre-processing technique can retain the original generalization characteristics of the data in feature space as shown in PCA plots after the introduction of synthetic data into the initial set.
For an improved SA algorithm, a new compensation parameter for the declining temperature was proposed to enhance the effectiveness of the acceptance criterion. This improvement has been shown to increase the accuracy of searching for the best penalty parameter for the SVM classifier by imposing better acceptance criteria compared to the conventional approach of SA. Experimental works were conducted using ten selected publicly available datasets have shown that the pre-processing strategy was effective in balancing the number of data between classes in the dataset. Further analysis was done in classification tasks where the outcomes have demonstrated that the SVM trained with the proposed improved SA outperformed conventional implementation of SVM in all ten datasets in terms of overall accuracy measure. Hence, as can be seen from the results, the proposed approach is a competitive hybrid strategy in dealing with class imbalances.
Further research works can be done to investigate the potential of the proposed approach in dealing with a highly imbalanced dataset as well as overlapping classes. Also, a comparative study involving state-of-the-art methods in this application can be further explored. Additionally, the study on the parameter searching of SVM using improved SA can be expanded to investigate the relationship between data distribution and the number of iterations involved.
Funding Statement: The authors received no specific funding for this study.
Conflicts of Interest: The authors declare that they have no conflicts of interest to report regarding the present study.
References
1. H. He and E. A. Garcia, “Learning from imbalanced data,” IEEE Transactions on Knowledge and Data Engineering, vol. 21, no. 9, pp. 1263–1284, 2009. [Google Scholar]
2. J. L. Leevy, T. M. Khoshgoftaar, R. A. Bauder and N. Seliyart, “A survey on addressing high-class imbalance in big data,” Journal of Big Data, vol. 5, no. 1, pp. 1–30, 2018. [Google Scholar]
3. H. Patel, D. S. Rajput, O. P. Stan and L. C. Miclea, “A new fuzzy adaptive algorithm to classify imbalanced data,” Computers, Materials and Continua, vol. 70, no. 1, pp. 73–89, 2021. [Google Scholar]
4. N. Japkowicz, “The class imbalance problem: Significance and strategies,” in Proc. of the 2000 Int. Conf. on Artificial Intelligence, Las Vegas, NV, USA, pp. 111–117, 2000. [Google Scholar]
5. F. Shakeel, A. S. Sabhitha and S. Sharma, “Exploratory review on class imbalance problem: An overview,” in 8th Int. Conf. on Computing, Communications and Networking Technologies, ICCCNT 2017, Delhi, India, 2017. [Google Scholar]
6. W. J. Lin and J. J. Chen, “Class-imbalanced classifiers for high-dimensional data,” Briefings in Bioinformatics, vol. 14, no. 1, pp. 13–26, 2013. [Google Scholar]
7. R. Blagus and L. Lusa, “Class prediction for high-dimensional class-imbalanced data,” BMC Bioinformatics, vol. 11, pp. 523, 2010. [Google Scholar]
8. M. Bach, A. Werner, J. Żywiec and W. Pluskiewicz, “The study of under- and over-sampling methods’ utility in analysis of highly imbalanced data on osteoporosis,” Information Sciences, vol. 384, pp. 174–190, 2017. [Google Scholar]
9. Y. Sun, A. K. C. Wong and M. S. Kamel, “Classification of imbalanced data: A review,” International Journal of Pattern Recognition and Artificial Intelligence, vol. 23, no. 4, pp. 687–719, 2009. [Google Scholar]
10. X. W. Liang, A. P. Jiang, T. Li, Y. Y. Xue and G. T. Wang, “LR-SMOTE—An improved unbalanced data set oversampling based on k-means and SVM,” Knowledge-Based Systems, vol. 196, no. 105845, pp. 1–10, 2020. [Google Scholar]
11. N. v. Chawla, K. W. Bowyer, L. O. Hall and W. P. Kegelmeyer, “SMOTE: Synthetic minority over-sampling technique,” Journal of Artificial Intelligence Research, vol. 16, pp. 321–357, 2002. [Google Scholar]
12. J. Arora, M. Tushir, K. Sharma, L. Mohan, A. Singh et al., “MCBC-SMOTE: A majority clustering model for classification of imbalanced data,” Computers, Materials and Continua, vol. 73, no. 3, pp. 4801–4817, 2022. [Google Scholar]
13. M. Kubat and S. Matwin, “Addressing the curse of imbalanced training sets: One-sided selection,” in Proc. of the Fourteenth Int. Conf. on Machine Learning, Nashville, TN, USA, pp. 179–186, 1997. [Google Scholar]
14. S. Maldonado, J. López and C. Vairetti, “An alternative SMOTE oversampling strategy for high-dimensional datasets,” Applied Soft Computing Journal, vol. 76, pp. 380–389, 2019. [Google Scholar]
15. K. Veropoulos, C. Campbell and N. Cristianini, “Controlling the sensitivity of support vector machines,” in Proc. of the Int. Joint Conf. on Artificial Intelligence, IJCAI 1999, Stockholm, Sweden, pp. 55–60, 1999. [Google Scholar]
16. C. F. Lin and S. de Wang, “Fuzzy support vector machines,” IEEE Transactions on Neural Networks, vol. 13, no. 2, pp. 464–471, 2002. [Google Scholar]
17. R. Batuwita and V. Palade, “FSVM-CIL: Fuzzy support vector machines for class imbalance learning,” IEEE Transactions on Fuzzy Systems, vol. 18, no. 3, pp. 558–571, 2010. [Google Scholar]
18. Q. Wang, Y. Tian and D. Liu, “Adaptive FH-SVM for imbalanced classification,” IEEE Access, vol. 7, pp. 130410–130422, 2019. [Google Scholar]
19. Y. Yong, “The research of imbalanced data set of sample sampling method based on k-means cluster and genetic algorithm,” Energy Procedia, vol. 17, pp. 164–170, 2012. [Google Scholar]
20. M. J. Kim, D. K. Kang and H. B. Kim, “Geometric mean based boosting algorithm with over-sampling to resolve data imbalance problem for bankruptcy prediction,” Expert Systems with Applications, vol. 42, no. 3, pp. 1074–1082, 2015. [Google Scholar]
21. A. M. Radwan, “Enhancing prediction on imbalance data by thresholding technique with noise filtering,” in 2017 8th Int. Conf. on Information Technology (ICIT), Amman, Jordan, pp. 399–404, 2017. [Google Scholar]
22. R. Alejo, R. M. Valdovinos, V. García and J. H. Pacheco-Sanchez, “A hybrid method to face class overlap and class imbalance on neural networks and multi-class scenarios,” Pattern Recognition Letters, vol. 34, no. 4, pp. 380–388, 2013. [Google Scholar]
23. M. Galar, A. Fernández, E. Barrenechea and F. Herrera, “Eusboost: Enhancing ensembles for highly imbalanced data-sets by evolutionary undersampling,” Pattern Recognition, vol. 46, no. 12, pp. 3460–3471, 2013. [Google Scholar]
24. V. García, J. S. Sánchez, A. I. Marqués, R. Florencia and G. Rivera, “Understanding the apparent superiority of over-sampling through an analysis of local information for class-imbalanced data,” Expert Systems with Applications, vol. 158, no. 113026, pp. 1–19, 2020. [Google Scholar]
25. C. Cortes and V. Vapnik, “Support-vector networks,” Machine Learning, vol. 20, no. 3, pp. 273–297, 1995. [Google Scholar]
26. C. W. Hsu, C. C. Chang and C. J. Lin, “A practical guide to support vector classification,” BJU International, vol. 101, no. 1, pp. 1396–1400, 2008. [Google Scholar]
27. J. S. Sartakhti, M. H. Zangooei and K. Mozafari, “Hepatitis disease diagnosis using a novel hybrid method based on support vector machine and simulated annealing (SVM-SA),” Computer Methods and Programs in Biomedicine, vol. 108, no. 2, pp. 570–579, 2012. [Google Scholar]
28. J. S. Sartakhti, H. Afrabandpey and M. Saraee, “Simulated annealing least squares twin support vector machine (SA-LSTSVM) for pattern classification,” Soft Computing, vol. 21, no. 15, pp. 4361–4373, 2017. [Google Scholar]
29. A. Tharwat, A. E. Hassanien and B. E. Elnaghi, “A BA-based algorithm for parameter optimization of support vector machine,” Pattern Recognition Letters, vol. 93, pp. 13–22, 2017. [Google Scholar]
30. Y. Ji, Y. Chen, H. Fu and G. Yang, “An EnKF-based scheme to optimize hyper-parameters and features for SVM classifier,” Pattern Recognition, vol. 62, pp. 202–213, 2017. [Google Scholar]
31. T. T. Hoang, M. Y. Cho, M. N. Alam and Q. T. Vu, “A novel differential particle swarm optimization for parameter selection of support vector machines for monitoring metal-oxide surge arrester conditions,” Swarm and Evolutionary Computation, vol. 38, no. July 2017, pp. 120–126, 2018. [Google Scholar]
32. R. Karthikeyan and P. Alli, “Feature selection and parameters optimization of support vector machines based on hybrid glowworm swarm optimization for classification of diabetic retinopathy,” Journal of Medical Systems, vol. 42, no. 195, pp. 1–11, 2018. [Google Scholar]
33. K. Li, J. Luo, Y. Hu and S. Li, “A novel multi-strategy DE algorithm for parameter optimization in support vector machine,” Journal of Intelligent Information Systems, vol. 54, no. 3, pp. 527–543, 2020. [Google Scholar]
34. A. Tharwat and A. E. Hassanien, “Quantum-behaved particle swarm optimization for parameter optimization of support vector machine,” Journal of Classification, vol. 36, no. 3, pp. 576–598, 2019. [Google Scholar]
35. E. Gul, N. Alpaslan and M. E. Emiroglu, “Robust optimization of SVM hyper-parameters for spillway type selection,” Ain Shams Engineering Journal, vol. 12, no. 3, pp. 2413–2423, 2021. [Google Scholar]
36. D. J. Kalita, V. P. Singh and V. Kumar, “A dynamic framework for tuning SVM hyper parameters based on moth-flame optimization and knowledge-based-search,” Expert Systems with Applications, vol. 168, no. April 2020, pp. 114139, 2021. [Google Scholar]
37. N. Metropolis, A. W. Rosenbluth, M. N. Rosenbluth, A. H. Teller and E. Teller, “Equation of state calculations by fast computing machines,” The Journal of Chemical Physics, vol. 21, no. 6, pp. 1087–1092, 1953. [Google Scholar]
38. S. Kirkpatrick, C. D. Gelatt and M. P. Vecchi, “Optimization by simulated annealing,” Science, vol. 220, no. 4598, pp. 671–680, 1983. [Google Scholar]
Cite This Article
 Copyright © 2023 The Author(s). Published by Tech Science Press.
This work is licensed under a Creative Commons Attribution 4.0 International License , which permits unrestricted use, distribution, and reproduction in any medium, provided the original work is properly cited.
 Downloads
 Citation Tools