
 Submit a Paper
 Propose a Special lssue
 Open Access
ARTICLE

Prediction of Traffic Volume of Motor Vehicles Based on Mobile Phone Signaling Technology
1 School of Architecture, The University of Sheffield, Sheffield, S10 2TN, England
2 Department of Environmental Science and Engineering, Fudan University, Shanghai, 200438, China
3 Fudan Planning and Architectural Design Institute, Shanghai, 200433, China
* Corresponding Authors: Jin Shang. Email: ; Hailong Su. Email:
Computers, Materials & Continua 2023, 75(1), 799-814. https://doi.org/10.32604/cmc.2023.035729
Received 01 September 2022; Accepted 18 November 2022; Issue published 06 February 2023
 View Full Text
 Download PDF
Abstract
Urban traffic volume detection is an essential part of traffic planning in terms of urban planning in China. To improve the statistics efficiency of road traffic volume, this thesis proposes a method for predicting motor vehicle traffic volume on urban roads in small and medium-sized cities during the traffic peak hour by using mobile signal technology. The method is verified through simulation experiments, and the limitations and the improvement methods are discussed. This research can be divided into three parts: Firstly, the traffic patterns of small and medium-sized cities are obtained through a questionnaire survey. A total of 19745 residents were surveyed in Luohe, a medium-sized city in China and five travel modes of local people were obtained. Secondly, after the characteristics of residents’ rest and working time are investigated, a method is proposed in this study for the distribution of urban residential and working places based on mobile phone signaling technology. Finally, methods for predicting traffic volume of these travel modes are proposed after the characteristics of these travel modes and methods for the distribution of urban residential and working places are analyzed. Based on the actual traffic volume data observed at offline intersections, the project team takes Luohe city as the research object and it verifies the accuracy of the prediction method by comparing the prediction data. The prediction simulation results of traffic volume show that the average error rate of traffic volume is unstable. The error rate ranges from 10% to 30%. In this thesis, simulation experiments and field investigations are adopted to analyze why these errors occur.Keywords
1.1 Background of Urban Transportation Planning
Urban transportation planning aims to develop this plan of efficient and balanced transport system for urban areas-a plan that will facilitate the formation of the desired pattern of human activity [1]. Over the past 30 years, traffic and transportation have developed rapidly in China, propelling the growth of the urban economy and promoting the transport links between small cities and large cities. As governments are dedicated to improving the traffic infrastructure, the number of cars has been soaring in recent years. However, the development of traffic also brings more traffic jams than before [2]. This problem is more salient in small and medium-sized cities. Therefore, urban transportation planning agencies need to spend more expenditure on collecting the statistic of traffic flow so that urban planners can discover which part of urban traffic network is exposed to the traffic jam problem and needs to be improved. That is why the detection of traffic volume is a significant part of urban transportation planning.
1.2 Background of Mobile Phone Signaling Data
With the rapid development of information technology, mobile phones have become a necessity in daily life. Mobile phone signaling data are produced when users utilize mobile phones. These signals consist of the serial numbers and the coordinates of the base stations to which the mobile phones are connected at each time node [3]. The mobile cellar network could apply to the sensors of human movement [4]. Therefore, it is crucial for the signaling data of mobile phones to show the general distribution and travel and mobility areas of the users. In this thesis, a method for predicting traffic volume during the traffic peak hours is proposed based on the mobile phone signaling data in small and medium-sized cities.
This thesis describes a method for predicting traffic volume by using cellular service base stations in the cities. First, the Voronoi tessellation method is used to establish the service network of cell phone base stations [5,6]. This network shows the service range of the cell phone base station. When a cell phone user moves from the service range of a cell phone base station to another, the cell phone base station will receive a record of the signal changes of the cell phone [7]. Secondly, when local residents move from the starting point to the endpoint, the system records the travel areas of local citizens and generates the travel chain map through a cell phone base station. Thirdly, the system will filter the data in the travel chain map. Fourthly, the travel chain map just records the travel areas of users within the service range of the cell phone base station, so several different routes in the map can be covered. The system will discover and choose more accessible paths based on Euclidean’s Shortest Path Principle [8]. At last, the system allocates many travel data from the shortest route to other routes based on the travel times of the cell phone signaling data from different users in the travel chain [9].
Thus, this thesis discusses a method to detect the travel volume of local citizens based on mobile phone signaling data. However, it could not predict the mode of travel. Since different vehicles travel at different speeds, the correct allocation of traffic volume may be affected based on travel time. In this thesis, a method will be proposed to predict the travel modes and traffic volume data on urban roads during the traffic peak hours through data filtering.
The methodology of this study is divided into three parts: (1) The statistics of the main modes of travel of the city’s residents through a sample survey of the communities. (2) Data selection and location prediction of residential areas and workplaces in the city through cell phone signaling technology. (3) The prediction of the current traffic volume from the city’s roads through cell phone signaling technology.
Luohe is a city in the southern part of Henan Province in China. Luohe covers an area of 2,617 square kilometers under its political jurisdiction [10]. According to the population surveys by related agencies, there are about 800,000 permanent residents in the central city of Luohe. The new standard in 2014 stipulates that urban areas with 10 million or more citizens are super mega-cities, 5 million to 10 million are mega-cities, 1 million to 5 million are large cities (3 million to 5 million are classified as Type I large cities and 1 million to 3 million are classified as Type II large cities), 500,000 to 1 million are medium-sized cities, and less than 500,000 are small cities (200,000 to 500,000 are Type I small cities and less than 200,000 are Type II small cities). Small cities are those with a population between 200,000 and 500,000 and those with a population of less than 500,000 [11]. Judged on its population, Luohe is a medium-sized city. Luohe is also a medium-sized city in terms of transport facilities and economic size [12]. Therefore, Luohe is a typical medium-sized city. Traffic congestion is a severe problem in the urban development of Luohe. In this thesis, Luohe is taken as an example to study a method for traffic volume detection applicable to medium and small-sized cities.
In this research, 20 settlements in Luohe and other small and medium-sized cities were selected as samples, and the leading travel modes of residents on weekdays were investigated. In this study, 19,745 residents were surveyed by questionnaire. Survey results are shown in Fig. 1. The main modes of travel for the city’s residents include walking, bicycles, electric vehicles (including two-wheel electric vehicles and three-wheel electric vehicles), cars (like private cars, taxis and online car-hailing), and buses. In this research, the travel habits of different travel groups are studied by interviewing different travel groups. According to the survey result, the travel rate of bicycles and electric bicycles is stable. This group is less likely to change their mode of travel despite the lousy weather conditions. However, during the rainy, snowy or hot weathers, and under low temperatures, some traveling groups on foot choose to travel by bus. Those who travel by car only turn to the bus if they cannot drive due to the restriction of the car plate number.

Figure 1: Survey results of residents’ travel modes in Luohe
There are also other vehicles, like motorbikes, trucks, special vehicles, municipal engineering vehicles, subways, and scheduled buses. To increase the accuracy of the methodology, the research team investigated the related agencies for these vehicles. For the motor-bicycle, many cities in China have issued “no motorcycle” policies. Many cities restrict the use of these vehicles on urban roads [13]. As for trucks, these vehicles are so heavy that damage urban roads. Therefore, many city roads set limitation on the weight of vehicles, and just a few urban roads allow trucks to pass through. Some special vehicles, like ambulances, police cars, and fire trucks, will just be in some accident places. Municipal engineering vehicles, like sprinkler trucks, will generally be allowed during flat hump hours on working days in urban areas. Regarding the subway, many small and medium-sized cities in China don’t have this public transportation. For scheduled bus, it consist of the school bus and company shuttle bus. In Luohe, just a few kindergartens have school buses, and they operate at other times rather than peak hours. According to the survey of companies, most of companies in Luohe are not equipped with shuttle buses. Only a few super-large enterprises, like HUAWEI and Foxconn, in super-first-tier cities, have been equipped with shuttle buses. However, these companies rarely set up branches in small and medium-sized cities. This thesis mainly focuses on a method to predict the traffic volume of urban roads during the peak hours on weekdays in small and medium-sized cities in China. There is little likelihood for these vehicles above to be on roads during peak hours. Therefore, vehicles above are not include in the research of this thesis.
3.2 Method for Urban Workplace and Residential Area Distribution Based on Mobile Phone Signaling Technology
3.2.1 Determine the Range of Daily Sleeping Hours and Working Hours for the Urban Population
With the development of mobile technology, mobile phone technology has become an integral part of people’s daily lives. When the mobile phone is used, the mobile phone signaling data will be generated. Therefore, mobile phone signaling data can show the spatial and temporal distribution of urban inhabitants. According to the related literature, the research team obtains the data about the rest hours and working hours of city residents through research. Also, it gains the distribution of workplaces and residential areas in the city by examining the cell phone signaling data during rest hours and working hours [14]. According to the survey in Luohe, most residents sleep before midnight, and they get up earlier than 7.00 a.m. Therefore, this research defines 12.00 a.m.–7.00 a.m. as the residents’ sleep time:
3.2.2 24-hour Static Observation of City-Wide Cellular Signaling Data
When the same mobile phone card is present in a particular area of the city, the time and duration of the mobile phone signaling generated in that area can be detected by the mobile phone base station. Therefore, the mobile phone signaling data can reflect the time and duration of the users in a particular location [15]. In this research, mobile phone base stations are used to detect the time intervals during the day when mobile phone signals appear in different city areas. If the proportion of mobile phone signaling data in one area appearing during the residents’ sleeping time (
3.2.3 Determine the Number of Residents and Jobs in Residential Areas and Workplaces Through Mobile Phone Signaling Data
The data volume of mobile phone signaling in the whole city is detected from the base station during working days. If the cell phone signaling data is transmitted from one of the local cell phone card companies, the cell phone signaling data need to be processed by sample expansion. The amount of mobile phone signaling data in the sleep time in the residential community refers to
3.3 Prediction Method of Current Urban Traffic Volume Based on Mobile Phone Signaling Data
3.3.1 Mapping the Distribution of Mobile Phone Base Station Network Services in Cities
As shown in Fig. 2, the service network model of mobile base stations is built based on the Voronoi tessellation method [5,6]. The service area of each base station is determined by connecting the service areas of neighboring base stations. When cell phones pass through different areas, multiple signaling events are generated. The service area changes most frequently. Cell stations generate two kinds of events-handover (HO) and location area update (LAU) events. The base station will generate a HO signal when an ongoing telephone call is redirected from one cell and from its channel to another cell and channel. In inactive (idle) mode, the base station will generate a LAU signal when the terminal enters a new service area [9]. Therefore, when a user moves from one area to another, the base station can detect the user’s travel traffic volume based on the changes in cell phone signals in the base station.

Figure 2: Service network model of the mobile base station based on the Voronoi tessellation method [8]
3.3.2 Data Selection for Different Modes of Travel
This method detects the travel volume of people in different regions by collecting mobile phone signaling data of residents traveling (
A. Method for collecting mobile phone signaling data from residents traveling on foot
As the average movement speed of residents traveling on foot is slower than that of motorized vehicles and bicycles, the average movement speed of users is obtained by comparing the time interval between the appearance of mobile phone signaling at adjacent base stations and the distance between adjacent base stations. Then, it could filter the amount of mobile phone signaling data for users traveling on foot according to a threshold value for the average movement speed on foot. The service radius of the signal base station is measured to be 250 meters, and the average distance between two adjacent base stations is about 500 meters. The average speed of walking is typically 1.34 m/s [16]. Therefore, cellular signaling data for users traveling on foot (
B. Method for collecting mobile phone signaling data from residents traveling by bicycle and electric vehicle (Including two-wheel electric vehicle and three-wheel electric vehicle)
Through a previous survey on the sample of different neighborhoods travel, the number of groups traveling by bicycle and electric vehicle does not vary greatly. This study obtains the average travel ratio (
C. Method for collecting mobile phone signaling data from residents traveling by bus
Since the routes of buses in a city are fixed and the departure intervals are constant, the number of buses generated in a city is also constant simultaneously. Based on this principle, this study calculates mobile signaling data for users traveling by bus (
Eq. (1): the formula of transport volume of bus:
Eq. (2): The formula of mobile signaling data for users traveling by bus.
D. Method for collecting mobile phone signaling data from residents traveling by car (Including private car, taxi and online car-hailing)
According to the survey, the main modes of travel for residents of small and medium-sized cities include walking, bicycles, electric vehicles, buses and cars. Therefore, the cellular signaling data for car trips can be calculated by subtracting the cellular signaling data for walking trips, bus trips, bicycle ride and electric vehicle trips from the total cellular signaling data during peak hours. The formula is as follows:
Eq. (3): The formula of mobile phone signaling data of cars.
E. Prediction method of route choice of car (Including private car, taxi and online car-hailing)
According to the literature, most residents traveling by car choose the shortest route to reach their destinations. Therefore, the road choice pattern of residents traveling by car is established based on the Euclidean shortest route [9]. Therefore, this method compares the distances of all routes from the starting point to the endpoint and then obtains the routes most likely to be chosen by residents who travel by car. According to Fig. 3, as the shortest paths are different between different residential communities and different workplaces, the mobile phone signaling data obtained by the mobile phone base station can only reflect the movement area of mobile phone signaling within the service area of the base station. Therefore, to obtain the mobile phone signaling data for trips by car on each path, the method assigns the amount of mobile phone signaling data for cars on each path by weighting the connection to different places of residential community and work by the weight of each path. The weights of different paths are equal to the strength of the connection between the workplace and the residential community on that path. Thus, according to the gravity formula, the strength of the link between different workplaces and residential communities is related to the number of inhabitants in the residential communities, the number of jobs in the workplace and the frequencies of travel to and from work between that workplace and that residential community [17].

Figure 3: Principle of car travel path selection in road network based on Euclidean shortest path principle
According to Eqs. (4) and (5),
Eq. (4): Gravity formula between workplace and residential community [17].
Eq. (5): Formula of the weight of European shortest path between workplace and residential community
The number of cars (
Eq. (6): The calculation formula for the volume of cars on the road
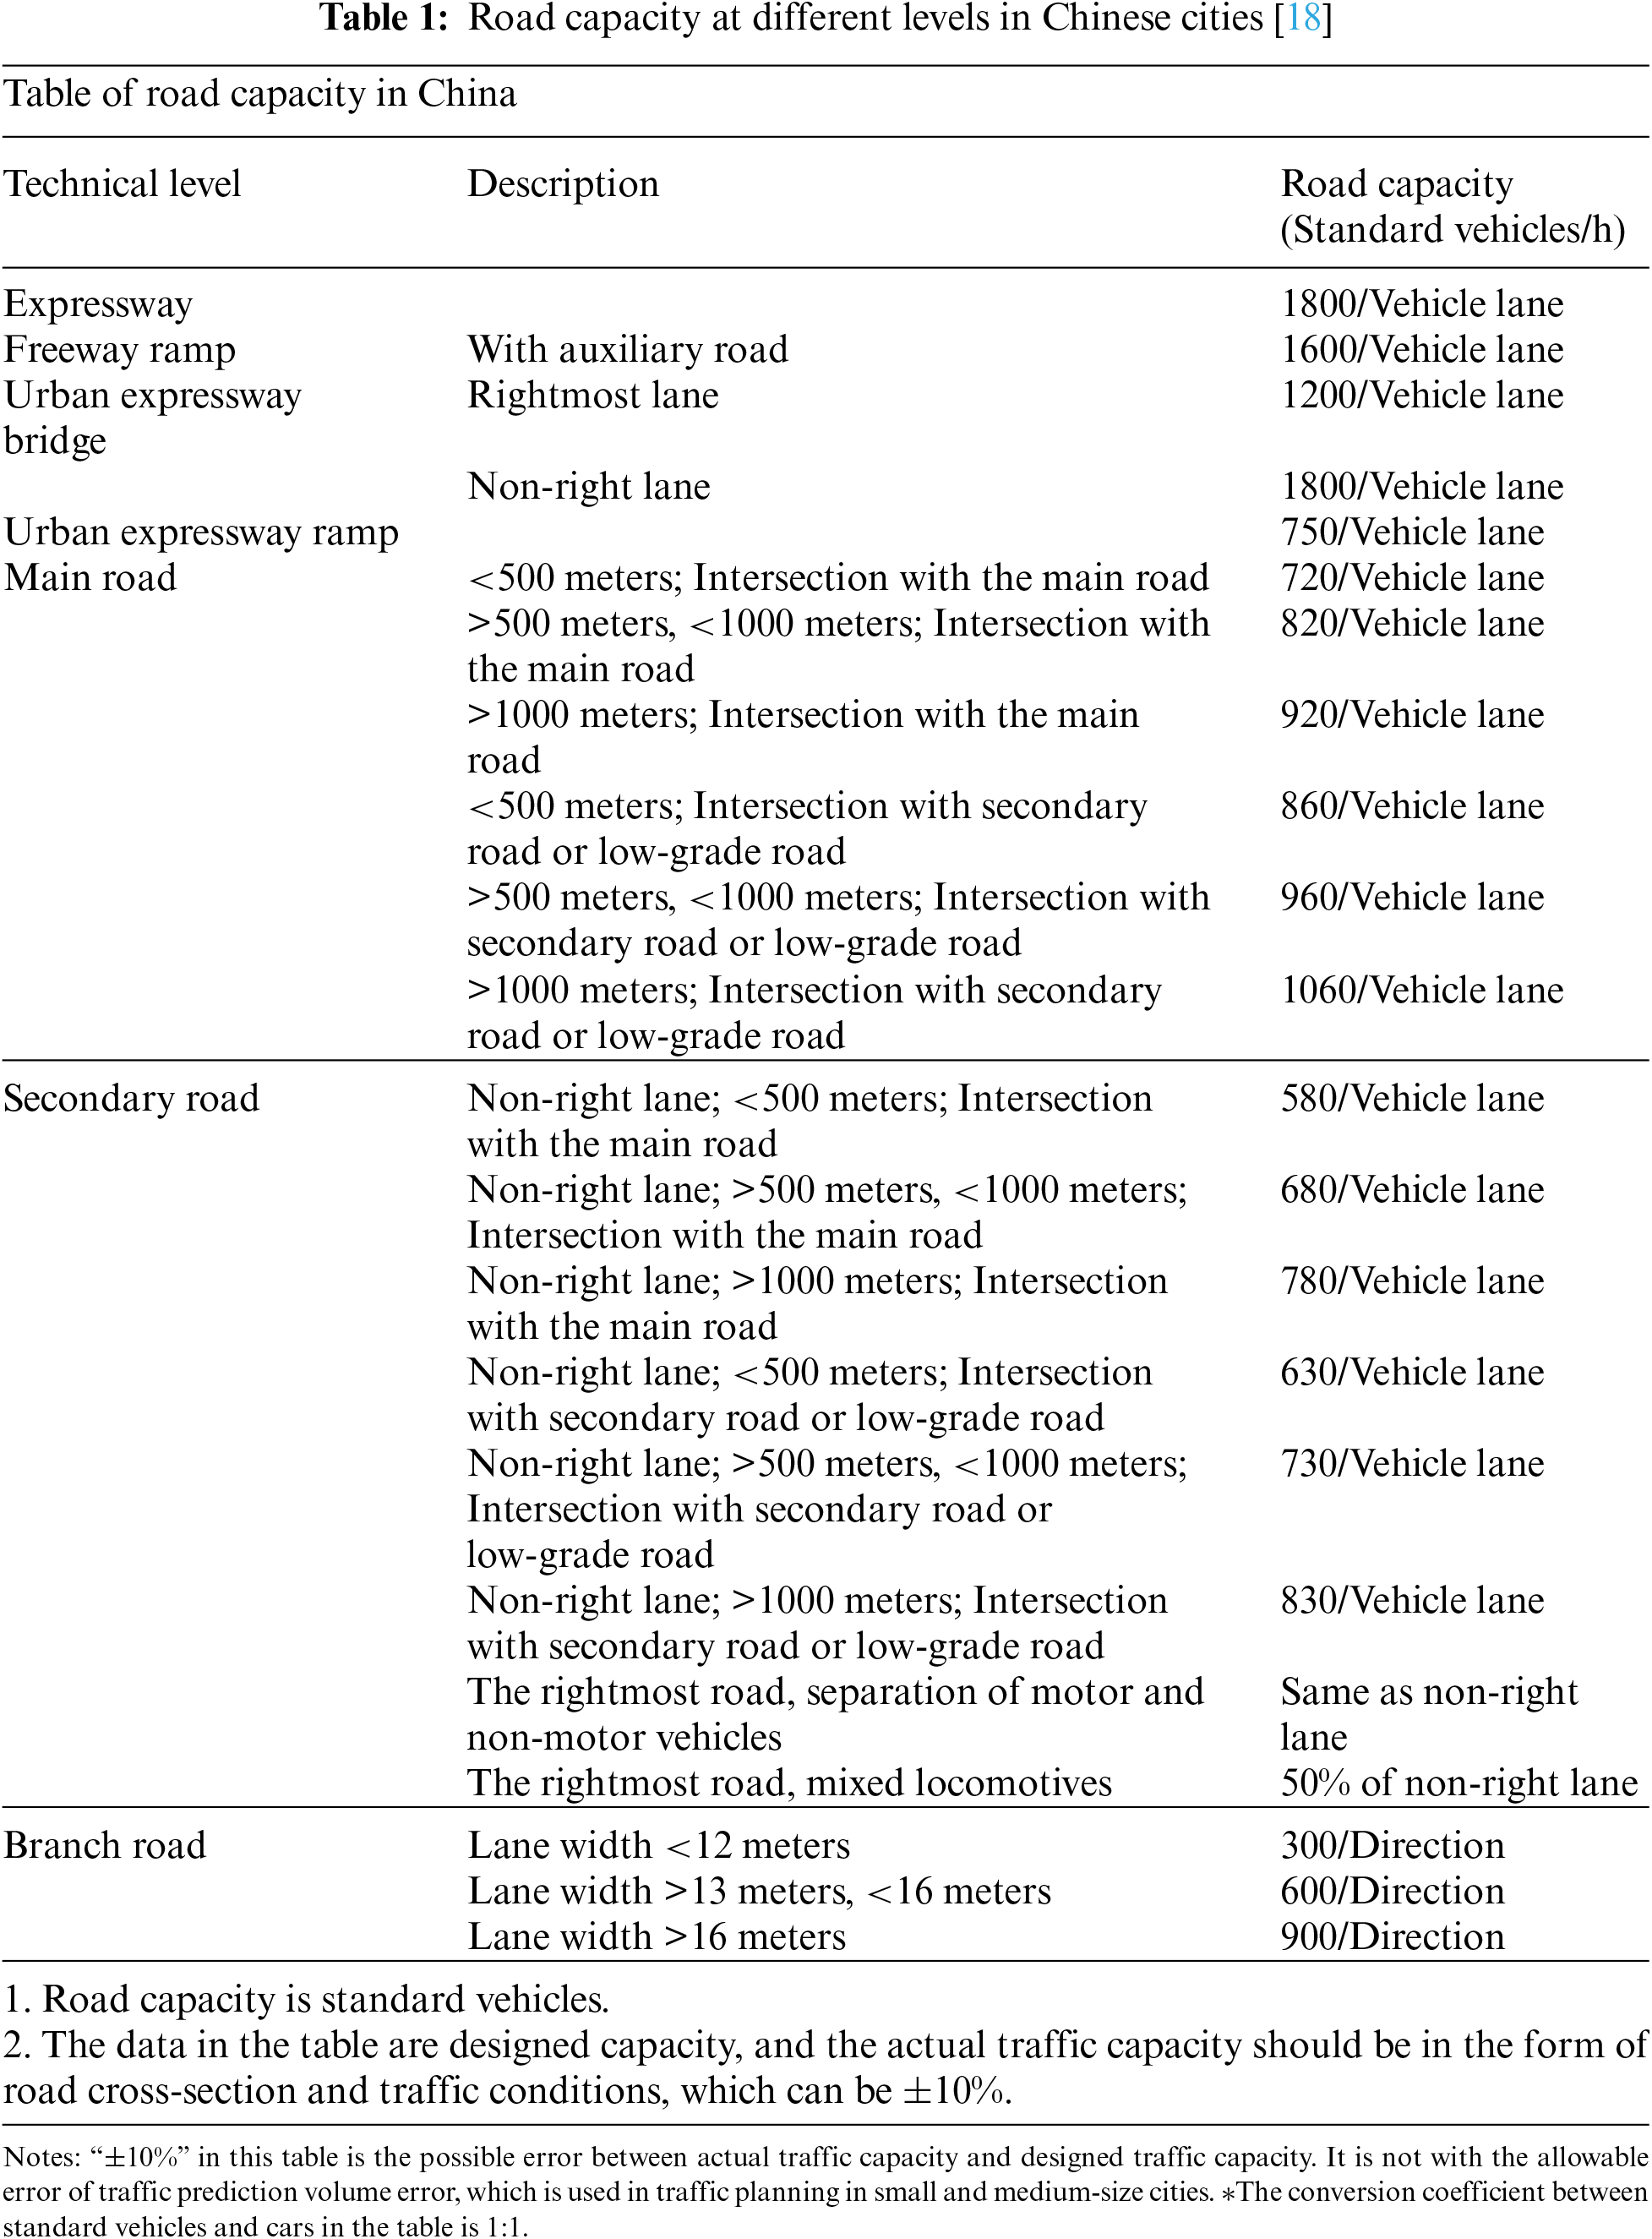
In addition to the shortest route, road congestion is also considered when residents select roads for travel. Therefore, when the volume of traffic allocated to a route exceeds the maximum traffic capacity on the urban road, the method allocates the excess traffic on that road to the second shortest route between the workplace and residential community (Table 1).
F. Normalization of traffic volume
According to the definition of road traffic volume, the traffic volume on an urban road mainly includes the number of motorized vehicles per unit hour. The number of motorized vehicles on the roads is dominated by cars, buses, and motorbikes on small and medium-sized cities. However, many cities in China have issued a “no motorcycle” policy. Therefore, the motorbike is not included in this prediction. The total traffic volume on the urban road can be calculated based on the detection results of cars and buses on different roads. To facilitate the counting and recording of road traffic volumes, this method converts the calculated bus traffic volumes on the road into traffic volumes of cars. According to statistics, the average ratio of buses to cars on the road is 2:1 (GB/T51328-2018 2019) [19], so this method converts the bus traffic volume (
Eq. (7): Calculation formula of volume of road traffic
4 Simulation Experiment for Data Validation
The prediction method based on mobile phone signaling data includes social surveys and data station detection. It may lead to some errors in different situations. For example, different samples of electric vehicle and bicycle travel rates may lead to different prediction results. Therefore, new methods need adopting for calibrating the accuracy of the prediction results.
The prediction method in this study consists of two parts: (1) Prediction of distribution of residential areas and workplaces; (2) Prediction of traffic volume.
4.1 Data Validation for Prediction of Distribution of Residential Areas and Workplaces
The technology of cell phone signaling data is a reliable method and can detect the distribution of residential areas and workplaces. However, it can generate noise data [14]. This simulation research takes Luohe as an example to simulate the results from prediction and uses the latest urban planning of land use for result validation. The mobile phone signaling data are obtained from China Unicom.
First of all, according to the social survey, it was found that the rest time in Luohe during weekdays is mainly between 12:00 a.m. and 7:00 a.m., while the work time is mainly between 8:30 a.m. and 12:00 p.m. and 1:30 p.m. and 5:30 p.m. Therefore, this experiment defines the location of mobile phone signaling data detected by the base station during rest time on weekdays as the urban residential area, while the location of the data concentrated during working hours is defined as the urban working area.
Land use planning involves the systematical assessment of land and water potential, land use alternatives and economic and social conditions for selecting and adjusting optimal land use options [20]. It informs the survey of land resources and the development of spatial planning, which is therefore vital for formulating policy and regulating land use [21]. Urban land use planning is planning the distribution of different functional areas of a city. Therefore, the project team combined the previous land use planning in Luohe City and field surveys to create a land use map for Luohe (Fig. 4). Project team used this map to calibrate the prediction results of the distribution of residential communities and workplaces.
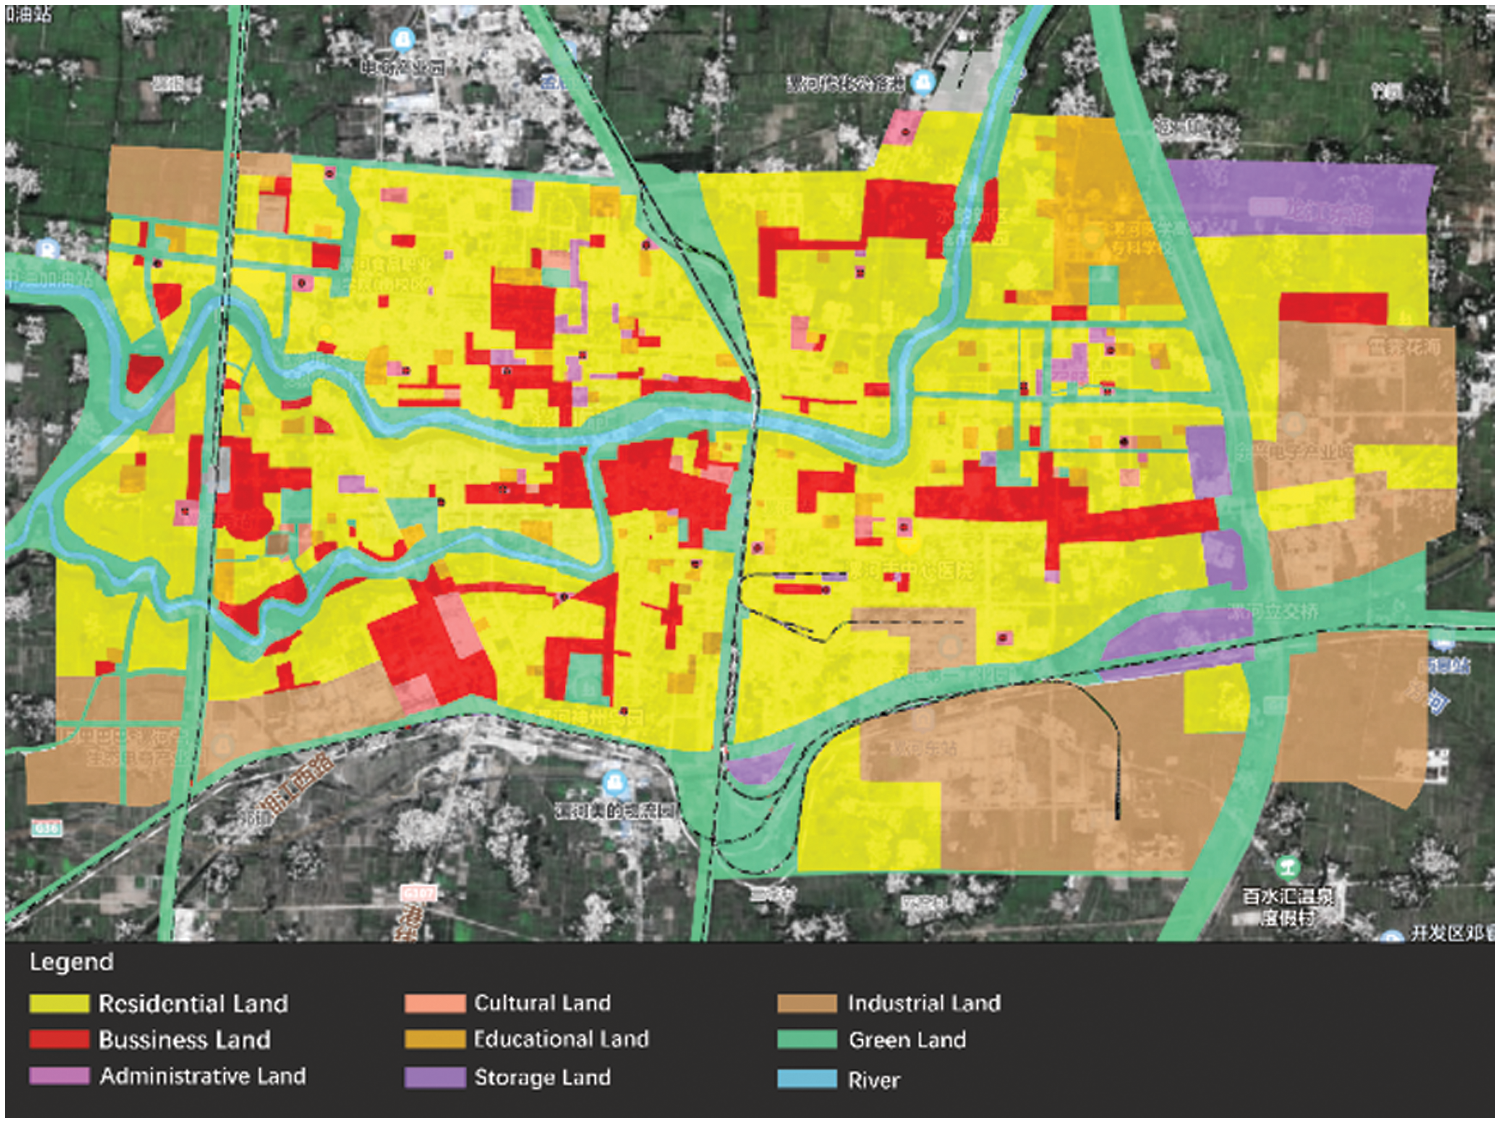
Figure 4: Map of the current situation of land use in Luohe (Data from the last urban land use planning of Luohe and land use investigation)
The project team studied the technical characteristics of cell phone signaling and the feasibility and limitations of the method based on the collected cell phone signaling data. By processing and calculating the data, the method identified a total of 890,310 residents. The result of validation shows that the location prediction of residential areas and workplaces is correct. Still, there are some workplaces detected as residential areas and some workplaces overlap with residential areas.
4.1.1 Discussion on Error Reasons of Distribution Prediction of Residential Areas and Workplaces
The error reasons for prediction are as follows: First, the work time of hospitals, some particular industries, and some government agencies, like the police stations, is different from the standard working time. Secondly, some residential areas have some commercial areas nearby. For example, the first and second floors of some residential buildings consist of shopping centers or small shops. Therefore, some urban areas will be repeatedly detected during the day and night. For the detection of number of residents and jobs, the prediction results still need to be verified based on the current land use planning map to exclude some noise data.
On the other hand, because of the privacy statements, the mobile phone card company could not provide the specific location of card users, so only the station that received the volume of mobile phone signaling data would be demonstrated. This technology could just obtain the general locations of residential areas and workplaces, but could not inform the exact extent of the detected residential areas and workplaces.
4.2 Data Validation for Prediction of Traffic Volume
The traffic volume prediction is based on the social survey and detection of mobile phone signaling data. The traffic volume of part roads is calculated based on the prediction method. The mobile phone signaling data are provided by China Unicom. To calibrate the accuracy of prediction, the project team selects nine city roads, including three main roads, three secondary roads and three branch roads, to count the traffic volume offline during peak hours. According to the survey, the peak hours of Luohe are mainly between 7.00 a.m. and 9.00 a.m. and 5.30 p.m. and 7.30 p.m. Therefore, the project team counts the traffic volume of these nine roads at peak times on weekdays. The results of the traffic volume survey are shown in Fig. 5. The project team made several experiments of traffic volume prediction based on the prediction in different situations and verified the results based on the traffic volume survey. In these experiments, the research team selected different communities as the study subjects in the social survey part of the method, such as the proportion of electric vehicles and bicycles surveyed. The research team found that the traffic volume prediction results are not always accurate. According to the research team, the accuracy of the traffic volume prediction results was erratic and subject to experimental error. 60% of the experimental prediction results have an error rate of 10%–20%, which meets the allowable error rate range (±20%) of traffic volume prediction in traffic planning in small and medium-sized cities in China; 40% of the experimental prediction results have an error rate of 20%–30%, higher than the allowable error range (±20%) for traffic forecast in traffic planning in small and medium-sized cities in China. According to the interviews with experts in some urban planning companies, a rate error of 0%–20% could be acceptable if the traffic volume prediction is based on the majority of small and medium-sized urban transportation planning projects. Still, some cities’ transportation planning requires that acceptable error for traffic volume prediction should be less than 20%.
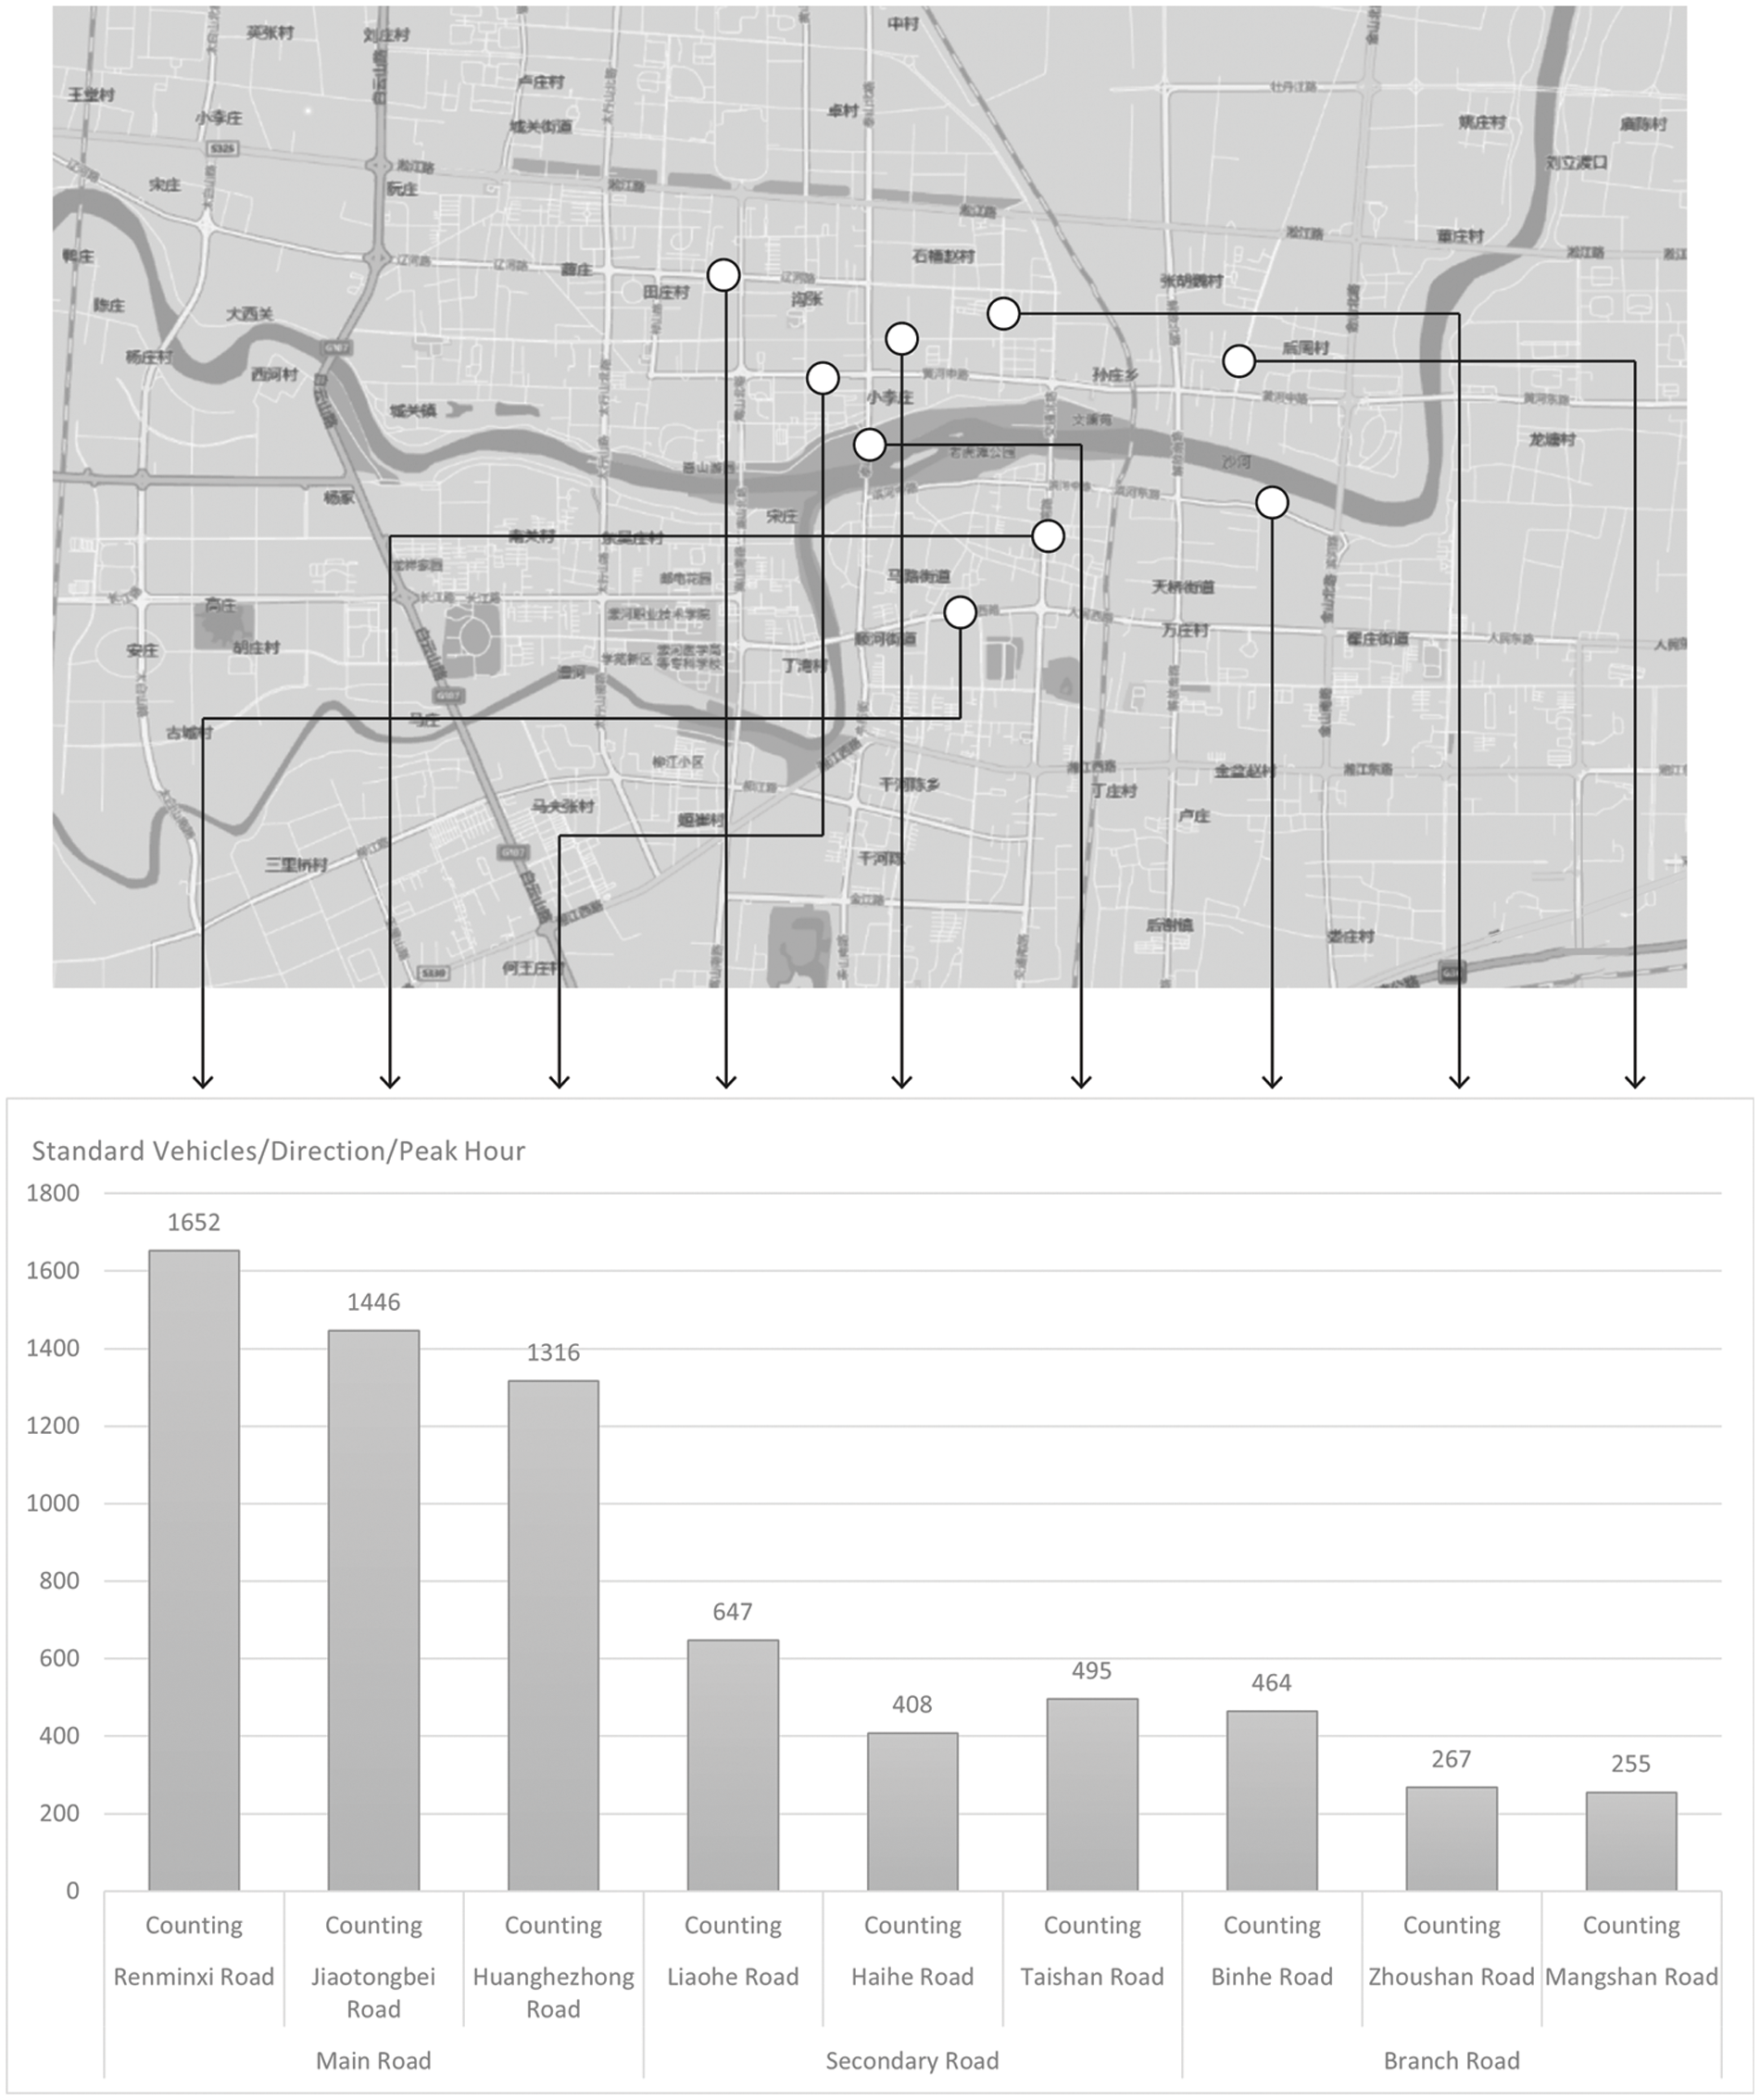
Figure 5: The survey results of road traffic volume
4.2.1 Discussion on Error Reasons of Traffic Volume Prediction
By studying the technical characteristics and investigation of the method, the following reasons for the instability of the prediction results were determined: First, different samples selected for the social survey may cause different prediction results. The prediction volume of bicycles and electric vehicles is based on the investigation of the proportion of trips. Therefore, if the research team fails to select a large number of representative samples, the range of error of the prediction may be increased. Instead, the research team could compare the prediction results of different samples with the actual counting volume to summarize the characters of the sound samples. Secondly, the weather is also a factor in the forecast results. Extreme weather, such as heavy rain, heat, snow and coldness, may increase the prediction error, because the road environment is more complex and prone to cause traffic accidents than usual during these extreme weather conditions. It will cause congestion on some urban roads, and drivers may choose the second shortest route or other routes to save time. Thirdly, dual SIM card phones may cause noise data. According to the survey on the mobile phone card company, many mobile phones can now support two mobile cards. The company’s technical team is conducting market research to avoid this noise data by data augmentation. Finally, residents’ travel routes are random in some situations. Some residents do not necessarily choose the shortest path between their workplace and residential community. For example, parents may travel to school to drop off their children before going to work.
In conclusion, this research studies a more efficient prediction method for traffic volume prediction during traffic peak hours based on mobile phone signaling data in small and medium-sized cities in China. This method provides a more convenient tool for urban traffic planning and urban land use planning. In the simulation experiment, the limitations and possibilities of the application method are discussed in this thesis. The simulation experiment consists of distribution prediction of residential areas and workplaces and traffic volume prediction. For the distribution prediction of residential areas and workplaces, almost residential areas and workplaces detected by mobile phone signaling technology are generally consistent with the current situation. However, this technology could just detect the general locations of residential areas and workplaces because of the privacy statements. In addition, it has limitations and could not detect some lands used for particular purposes, like some mixed commercial and residential lands, and hospitals. However, this technology can be integrated with land use planning to capture the number of residents and jobs in different residential areas and workplaces. It is helpful for traffic volume prediction and urban planning. For the prediction of traffic volume, nine urban roads are selected in Luohe to test the feasibility of this prediction method several times. The average rate of errors on the traffic volume prediction is unstable. There are about 60% of experiment errors within the allowable error range of the experiment. Based on the situation survey and the analysis of the technical characteristics of the method, the main factors contributing to the inconsistent results are discussed.
In the future, more emphasis needs to be placed on the selection of samples in the social survey and data augmentation in some special situations to increase the prediction accuracy. In addition, the research direction of the team will be more dedicated to the prediction method of traffic volume in large cities and the traffic connectivity between different cities based on mobile signaling data. That would be used for urban planning in large cities and research on the development of metropolitan areas.
Funding Statement: The authors received no specific funding for this study.
Conflicts of Interest: The authors declare that they have no conflicts of interest to report regarding the present study.
References
1. R. Schofer and B. Levin, “The urban transportation planning process,” Socio-Economic Planning Sciences, vol. 1, no. 2, pp. 185−197, 1967. [Google Scholar]
2. L. Jie and H. J. Van Zuylen, “Road traffic in China,” Procedia-Social and Behavioral Sciences, vol. 111, pp. 107−116, 2014. [Google Scholar]
3. J. Yang, Y. Shi, C. Yu and S. Cao, “Challenges of using mobile phone signalling data to estimate urban population density: Towards smart cities and sustainable urban development,” Indoor and Built Environment, vol. 29, no. 2, pp. 147−150, 2020. [Google Scholar]
4. A. Janecek, D. Valerio, A. Hummel, K. F. Ricciato and H. Hlavacs, “The cellular network as a sensor: From mobile phone data to real-time road traffic monitoring,” IEEE Transactions on Intelligent Transportation Systems, vol. 16, no. 5, pp. 2551−2572, 2015. [Google Scholar]
5. A. E. Baert and D. Seme, “Voronoi mobile cellular networks: Topological properties,” in Proc. Third Int. Symp. on Parallel and Distributed Computing/Third Int. Workshop on Algorithms, Models and Tools for Parallel Computing on Heterogeneous Networks, Cork, Ireland, pp. 29−35, 2004. [Google Scholar]
6. J. Candia, M. C. González, P. Wang, T. Schoenharl, G. Madey et al., “Uncovering individual and collective human dynamics from mobile phone records,” Journal of Physics A: Mathematical and Theoretical, vol. 41, no. 22, pp. 224015, 2008. [Google Scholar]
7. D. Valerio, “Road traffic information from cellular network signaling,” Technical Report FTW-TR-2009-003, Telecommunications Research Center Vienna, 2009. [Google Scholar]
8. T. Tettamanti, H. Demeter and I. Varga, “Route choice estimation based on cellular signaling data,” Acta Polytechnica Hungarica, vol. 9, no. 4, pp. 207−220, 2012. [Google Scholar]
9. T. Tettamanti and I. Varga, “Mobile phone location area based traffic flow estimation in urban road traffic,” Advances in Civil and Environmental Engineering, vol. 1, no. 1, pp. 1−15, 2014. [Google Scholar]
10. T. Bai, A. L. Mayer, W. D. Shuster and G. Tian, “The hydrologic role of urban green space in mitigating flooding (Luohe, China),” Sustainability, vol. 10, no. 10, pp. 3584, 2018. [Google Scholar]
11. Q. I. Wei, S. H. Liu, H. R. Jin, “Applicability of the new standard of city-size classification in China,” Progress in Geography, vol. 35, no. 1, pp. 47−56, 2016. [Google Scholar]
12. Luohe Municipal People’s Government. [Online]. Available: http://www.luohe.gov.cn/sitesources/lhsrmzf/page_pc/zjlh/index.html (in Chinese2022. [Google Scholar]
13. Y. Zu, Y. Si and B. Wang, “Reflections on the implementation and management policies of China’s motorcycle ban policy,” Comprehensive Transportation, vol. 44, no. 4, pp. 25−29, 2022. (in Chinese). [Google Scholar]
14. Z. Lu, Z. Long and Q. Yu, “Analysis of job-dwelling distribution and commuting characteristics in kunshan city based on mobile phone signaling data,” Modern Urban Studies, no. 3, pp. 50−55, (in Chinese2019. [Google Scholar]
15. D. Wang, W. Zhong, Z. Yin, D. Xie and X. Luo, “Spatio-temporal dynamics of population in Shanghai: A case study based on cell phone signaling data,” In: Z. Shen and M. Li (Eds.Big Data Support of Urban Planning and Management. Advances in Geographic Information Science, Cham: Springer, 2018. Available: https://doi.org/10.1007/978-3-319-51929-6_13. [Google Scholar]
16. W. Shang, Z. Wu, W. Zheng, Y. Zeng and S. Lu, “Research on the relationship between the attractiveness of modern urban streets and the change rate of walking speed,” Journal of Architecture, vol. S2, pp. 99−105, 2021. (in Chinese). [Google Scholar]
17. L. Liu, “Characteristics of external transportation links of urban agglomerations based on LBS data-changzhutan as an example,” in Proc. Academic Committee on Urban Transportation Planning, China Society of Urban Planning. (eds.) Traffic Governance and Spatial Remodeling-Proc. of the 2020 Annual Conf. on Urban Traffic Planning in China, Beijing, China, pp. 1779−1786, 2020. (in Chinese). [Google Scholar]
18. Beijing University of Technology Transportation Research Center, Highway Capacity Manual, China Communications Press, 2000. [Online] Available: https://max.book118.com/html/2019/1008/6113031241002111.shtm (in Chinese). [Google Scholar]
19. Ministry of Housing and Urban-Rural Development of the People’s Republic of China, Standard for urban comprehensive transport system planning (GB/T51328-2018China Construction Industry Press, 2019. [Online]. Available: https://www.soujianzhu.cn/NormAndRules/NormContent.aspx?id=997 (in Chinese). [Google Scholar]
20. F.A.O., Guidelines for Land Use Planning. Prepared by Soil Resources, Management and Conservation Service under guidance of the Inter-Departmental Working Group on Land Use Planning. Food and Agriculture Organization of the United Nations, Rome, pp. 96, 1993. [Online]. Available: https://www.fao.org/3/T0715E/t0715e00.htm. [Google Scholar]
21. X. Cao, S. Ouyang and C. Lyu, “Detailed compilation of national land spatial planning based on land use categorization,” Economic Geography, vol. 41, pp. 192−200, 2021. [Google Scholar]
Cite This Article
 Copyright © 2023 The Author(s). Published by Tech Science Press.
This work is licensed under a Creative Commons Attribution 4.0 International License , which permits unrestricted use, distribution, and reproduction in any medium, provided the original work is properly cited.
 Downloads
 Citation Tools