
 Submit a Paper
 Propose a Special lssue
 Open Access
ARTICLE

End-to-End 2D Convolutional Neural Network Architecture for Lung Nodule Identification and Abnormal Detection in Cloud
1 Department of Software Engineering, the University of Lahore, Defence Road Campus, Lahore, 55150, Pakistan
2 Department of Computer Engineering, Jeju National University, Ara Campus, Jeju City, 63243, Korea
* Corresponding Author: Dohyeun Kim. Email:
Computers, Materials & Continua 2023, 75(1), 461-475. https://doi.org/10.32604/cmc.2023.035672
Received 30 August 2022; Accepted 01 November 2022; Issue published 06 February 2023
 View Full Text
 Download PDF
Abstract
The extent of the peril associated with cancer can be perceived from the lack of treatment, ineffective early diagnosis techniques, and most importantly its fatality rate. Globally, cancer is the second leading cause of death and among over a hundred types of cancer; lung cancer is the second most common type of cancer as well as the leading cause of cancer-related deaths. Anyhow, an accurate lung cancer diagnosis in a timely manner can elevate the likelihood of survival by a noticeable margin and medical imaging is a prevalent manner of cancer diagnosis since it is easily accessible to people around the globe. Nonetheless, this is not eminently efficacious considering human inspection of medical images can yield a high false positive rate. Ineffective and inefficient diagnosis is a crucial reason for such a high mortality rate for this malady. However, the conspicuous advancements in deep learning and artificial intelligence have stimulated the development of exceedingly precise diagnosis systems. The development and performance of these systems rely prominently on the data that is used to train these systems. A standard problem witnessed in publicly available medical image datasets is the severe imbalance of data between different classes. This grave imbalance of data can make a deep learning model biased towards the dominant class and unable to generalize. This study aims to present an end-to-end convolutional neural network that can accurately differentiate lung nodules from non-nodules and reduce the false positive rate to a bare minimum. To tackle the problem of data imbalance, we oversampled the data by transforming available images in the minority class. The average false positive rate in the proposed method is a mere 1.5 percent. However, the average false negative rate is 31.76 percent. The proposed neural network has 68.66 percent sensitivity and 98.42 percent specificity.Keywords
Cancer is a disease that causes unrestrained growth of abnormal cells in the body of the patient, which can lead to a number of abnormalities in the body and eventually results in the death of the patient. Development of cancer takes place when the body’s normal control mechanism ceases to work, old cells do not die instead they start uncontrolled growth of abnormal cells and sometimes these irregular cells form a mass of tissue called a tumor [1]. According to the statistics of the world health organization, cancer is the second leading cause of death in the world, about 1 in every 6 deaths is because of cancer just in 2018 almost 9.6 million people died of cancer among which 70 percent of those deaths were registered in underdeveloped countries. The most common types of cancer are breast cancer, lung cancer, colorectal, prostate, skin cancer, and stomach cancer and in 2018, 2.09 million lung cancer patients were registered around the globe [2]. This makes lung cancer the second most common type of cancer and the real problem is the high mortality rate of lung cancer. In 2018, lung cancer accounted for the death of over 1.76 million people, which is approximately a mortality rate of 84 percent to put that in perspective it indicates that 84 out of every 100 people diagnosed with lung cancer died [2].
As stated by the world health organization, cancer treatment works more effectively at the early stages of cancer, so we can conclude that the patient’s probability of survival can improve significantly if cancer is diagnosed at an early stage. There are two components of early cancer detection, one of those components is educating people about early diagnosis and the other one is medical image screening [2]. Cancer screening is a primary method for cancer diagnosis at an early stage; medical imaging such as computer tomography (CT) scan is a predominant practice for cancer screening as it is accessible in most countries. However, manual inspection of medical images is subject to a high error rate so much so that for an individual going through 14 screening trials the cumulative risk of a false positive can be as high as 50 percent. Male patients have a higher risk of false positives as compared to female patients, for men, the risk of having at least one false positive per 14 tests is approximately 60 percent and for women; the risk is around 48 percent [3]. These results indicate the inconsistencies in the human analysis of CT scan for cancer screening which can be fatal in the case of cancer. Flawed, as it may seem, cancer screening is still an effective way to diagnose cancer at an early stage and it can prove to be very beneficial in the treatment of cancer. Nevertheless, novel computer-aided detection CADe and computer-aided diagnosis CADx techniques are being developed to ameliorate cancer screening using medical images, and artificial intelligence is at the center of modern medical image processing systems.
The revolution in deep learning started with the arrival of AlexNet in 2012 as it changed the general perspective of people regarding deep learning models and deep neural networks. Deep learning, since then has shown tremendous success in many domains including medical image processing [4]. Leveraging deep learning techniques to process medical images is a propitious innovation in health care as deep convolutional neural networks (DCNN) have exhibited exceptional results in CADx systems [5,6]. The escalation in AI research is evident from the upsurge of publications in the domain of AI, the annual publications in artificial intelligence rose from 100–150 in 2007–2008 to 700–800 in 2017–2018. Fifty percent of the published articles are related to MRI or CT scans and AI-based systems can produce highly accurate results and even identify abnormalities undetectable by the human eye [7]. Machine-learning is a sub-domain of AI, which has shown tremendous results in complex pattern recognition systems. Machine-learning systems learn from existing data and make a prediction about unobserved data [8]. Deep learning is a class of machine learning algorithms used to extract and transform features; another term used for deep learning is neural networks [9,10]. Deep learning earned this name because it is designed to mimic the human brain’s neural structure of the human brain but a neural network requires a massive amount of data to extract features that will enable it to predict unseen data. Prior to deep learning the features for nodules, classification was manually engineered by domain experts or identified after months if not years of study [11]. Data plays a significant role in determining the performance of the neural network [12] and that is the reason why the advent of publicly available largescale lung CT datasets such as lung image database consortium (LIDC) and Lung nodule analysis 2016 also known as LUNA16 has boosted lung nodule detection and classification research [13]. A number of effective computer-aided diagnosis/detection systems have been proposed using these datasets.
LUNA16 dataset is used in this study for the generation of nodule candidates, it consists of 888 cases and it is derived from the LIDC dataset that contains 1018 cases [14]. There are a total number of 551,065 candidate nodules in this dataset. Out of these candidates, only 1351 are nodules and the rest of the candidates are non-nodules, which represents the severe data imbalance in this dataset, which results in the deep learning model being biased towards the dominant class and hinders the generalization ability of the model. This problem of data imbalance is often observed in publicly available medical image datasets as the class of negative cases dominates the class with positive cases. This muddle up the learning phase [15] and it is difficult to assess the performance of the model on imbalanced data, which makes training effective classification models relatively difficult. Two common techniques to deal with data imbalance are sampling and cost-sensitive learning, sampling can further be divided into three types, random oversampling [16–18], under-sampling [19,20], and synthetic minority oversampling technique commonly known as SMOTE [21]. Under-sampling is a technique in which we reduce the number of data points in the majority class to balance the data but it can lead to massive information loss. In random oversampling, we take random data points from the minority class, duplicate those data points and augment those data points in the minority class to balance the data. Effective as it may seem but oversampling can lead to model overfitting the training data and failing to generalize. SMOTE is quite an effective technique but it is also subject to generalization problems [22]. Even with its flaws, random oversampling is the simplest and very effective technique to tackle data imbalance. Aside from the lopsided distribution of data points among the classes, another issue is structuring the neural network that can yield the ideal outcomes as the neural network gets deeper and more complicated it requires more computational power to process data, given constrained resources this impediment can hinder the training process. This problem gets even more cumbersome in the case of CT images as these are 3-dimensional images and require 3-dimensional convolutional neural networks to process them.
The aim of this study is to design an end-to-end convolutional neural network that can reduce the false positive rate in nodule classification and modify random oversampling by applying image transforms to distort pixels of images being oversampled. We extracted patches of 2D images from 3D CT scans. We redefined the problem to a simple 2D binary classification instead of a 3D binary classification problem. The extracted images are normalized using the Hounsfield units provided by the official LUNA16 web repository. We proposed a simple 2D end-to-end convolutional neural network to identify lung nodules and we achieved our goal of a low false positive rate but at the cost of a high false negative.
The rest of the article is set out in the following order, Section 2 accommodates literature review, Section 3 contains Dataset characteristics, Section 4 contains image transformation and oversampling, Section 5 contains proposed neural network, Section 6 discussed results, and Section 7 presented the conclusions.
The arrival of LIDC and LUNA16 datasets, and the deep learning revolution started by AlexNet in 2012, has led to the development of a few systems to classify lung nodules from CT scans. Al-Shabi et al. [23] proposed a novel technique deep local–global network to classify malignant nodules. Deep local–global networks use residual blocks with a 3 × 3 kernel for local feature extraction and non-local blocks for global feature extraction. The essential idea of the global Block is to use matrix multiplications between features on the feature maps. Their proposed network produced an AUC of 95.62 percent. Apart from using CNN for feature extraction, different studies have been conducted to use different feature extractors. Kumar et al. [24] presented an auto-encoder and decoder method to extract nodule features and classify malignant and benign nodules. For feature extraction, they used a five-layered de-noising auto-encoder trained by L-BFGS with an iteration set to 30 and a batch size of 400. They used a binary tree classifier. They achieved an average accuracy of 75 percent along with a sensitivity of 83.35 percent. Nibali et al. [25] proposed a residual network-based pulmonary nodule classification system. They modified the ResNet architecture to accommodate 64 × 64 images. Secondly, they reduced the number of feature maps to support their three-column configuration and they converted the ResNet into a fully convolutional network by trimming the fully connected layer. They used 2D planar views instead of 3D volume to reduce the input size of images. They achieved a sensitivity of 91.07 percent, specificity of 88.64 percent, and overall accuracy of 89.90 percent. Shen et al. [26] presented a multi-scale CNN. Their MCNN takes multi-scale raw nodule patches, instead of segmented regions, this proves that information gained from raw nodule patches is also useful and can provide reasonable information for classification. Their proposed multi-scale convolutional neural network was also able to handle noisy points. The scales they used are 96 × 96 × 96, 64 × 64 × 64, and 32 × 32 × 32 in pixels. They achieved an average accuracy of 84.86 percent in nodule classification. Jiang et al. [27] proposed a lung nodule detection system, which is based on multi-group patches cut out from the lung images and enhanced by the Frangi filter. They combined two groups of images and a four-channel convolutional neural network for detecting lung nodules of four levels. Their proposed system achieved an accuracy score of 80.06 percent and 4.7 false positives per scan. Their paper also displayed the tradeoff between sensitivity and false positive rate. At 94 percent sensitivity, the false positive rate was increased to 15.1 per scan. Huang et al. [28] proposed a 3D convolutional neural network for nodule detection from low-dose CT scans. Their system takes advantage of the prior knowledge about nodules as well as machine-learned features. They used a geometric-model-based filter to generate candidate nodules. The generated candidates were 3D cubes that were fed into a 3D convolutional neural network for classifying whether the candidate is nodule or non-nodule. Their system achieved a sensitivity of 90% percent with five false positives per scan. Other neural network approaches that can be applied to the lung nodule classifications are presented in [29–32].
We leveraged the potential of 2D convolutional neural networks to address this problem. We propose an end-to-end convolutional neural network that takes a 2D image patch, resizes it and predicts whether the candidate is a nodule or non-nodule, instead of passing the image through a complex machine-learning pipeline. Our proposed solution provides a specificity of 98.42 percent at the cost of sensitivity. However, sensitivity can be improved but at the cost of specificity.
For this study, we used the publicly available LUNA16 dataset. Lung nodule analysis 2016 (LUNA16) dataset was originally made public in 2016 to encourage the development of lung nodule segmentation systems [14]. It contains 888 cases with nodules > = 3 mm accepted by at least 3 radiologists and this dataset also contains an annotation CSV file which contains the series of the candidate nodule and X Y Z coordinates to locate the candidate nodule and the class label of the nodule, class 0 represents non-nodules and class 1 represents nodules. LUNA16 is divided into 10 subsets that can be beneficial in the process of cross-validation. The LUNA16 is derived from the Lung Image Database Consortium image collection (LIDC IDRI) dataset. The (LIDC-IDRI) consists of lung cancer screening computed tomography (CT) scans with annotated lesions. It is publicly available on a web repository to assist in the development of computer-aided diagnosis systems, and it was initiated by the National Cancer Institute (NCI) [33]. There is a total number of 1018 cases in this dataset; each case contains the CT scan images associated with an XML file that contains an annotation of that case marked by four experienced radiologists [34]. LUNA16 provides a thorough tutorial for candidate nodule extraction to help researchers in extracting the relevant data. Each potential nodule is present in the candidates_v2 CSV file with its X Y Z coordinates and each subset contains images, pixel spacing, and origin, using the CSV file, the scan with the candidate nodule is loaded and rescaled from world coordinates to voxel coordinates then normalized and saved in the desired location [33].
4 Image Transformation and Augmentation
Oversampling has proven to be remarkably effective in the case of data imbalance. It not only balances the distribution of data in the classes but also prevents loss of information [17]. Oversampling is a technique in which we augment the minority class to overcome the data imbalance between different classes. This technique can also be used if there is a small number of data points in the dataset that is the reason why in this study we used oversampling to overcome the problem of data imbalance in the dataset. The total number of potential nodules was 551, 065 among which only 1351 were nodules and the rest of the candidates were non-nodules. If an imbalanced dataset is fed to the model for training, then it will result in a biased model because as the model tries to optimize the loss function it will classify all the points to the dominant class. To mitigate this problem, we can under-sample the dominant class or oversample the minority class. However, under-sampling the majority class results in massive information loss, which can hinder the performance of the resultant model. Therefore, we used oversampling to avoid information loss, and instead of oversampling random points, we oversampled each image in the training set of the nodule class, and each image except the image that was separated for testing was augmented 440 times and, in each augmentation, a random transform is applied to the image. We used four image transforms for image augmentation: vertical flip with random rotation, horizontal flip with random rotation, and color jitter. The augmentation and transformation algorithm is shown in Table 1. Prior, to augmentation we separated 300 images from the nodule class and 38,375 images from the non-nodule class for testing. Fig. 1 represent three samples of original images, and Fig. 2 represent their corresponding transformed images.


Figure 1: Three samples original images

Figure 2: Three corresponding transformed images
5 Proposed Convolutional Neural Network
5.1 Network Architecture and Description
The proposed network architecture is shown in Fig. 3. The goal of the proposed work is the development of a lightweight end-to-end model that can be used as a backbone in a lung nodule detection and image segmentation system. In 2016, researchers at Nvidia demonstrated the power of end-to-end CNNs when they developed a neural network for a self-driving car [35]. Our proposed model is inspired by the architecture of VGG-16 network that won the image net competition in 2014 and Nvidia’s end-to-end self-driving car model that displayed the potential of end-to-end convolutional neural networks [35]. The aim of this network is to minimize binary cross-entropy loss also referred to as log loss and optimize the parameters for correct nodule identification. We used Adam [36] optimizer algorithm with a learning rate of 0.0001 for swift convergence, weights for this network were initialized using the Xavier Uniform initializer also known as the Glorot uniform initializer. The flow chart of the proposed CNN algorithm is shown in Fig. 4.

Figure 3: Proposed network architecture
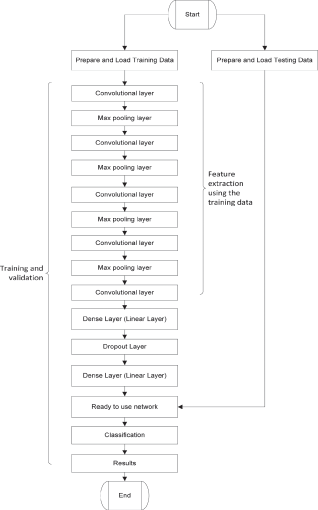
Figure 4: Flow chart of proposed network architecture
5.2 Mathematical Representation of Log Loss
where N is the total number of points. y is the true label and
Xavier Initializer Equation
where in is the number of input units and out is the number of output units.
The proposed network contains five convolutional layers followed by a dense layer and output layer, each convolution layer has a kernel size of 3 × 3 and uses rectified linear unit more commonly known as ReLu as an activation function. First, four convolutional layers are followed by max-pool layers with a kernel of size 2 × 2. The proposed network takes a 3 channel 64 × 64 image as input after passing the image through the convolutional layers the output matrix is flattened into a 28,800-feature array afterward, it is passed through the first dense layer followed by a dropout layer with a dropout probability of 0.25 on a scale of 0–1. Table 2 contains the description of the layers of the neural network. The network is trained on Nvidia 920 m GPU with 2GB VRam. The utilization of GPU was necessary for accelerated learning. The laptop used had 8GB of RAM, 500GB of SSD, and an Intel i5 processor.

Each epoch took approximately 30 min to finish and a batch of 128 images is fed to the network per iteration. Prior to training, 300 data points from the nodule class and 38,375 images from the non-nodule class are separated for the testing set, separation of data points was carried out before augmentation to avoid the repetition of training data points in the testing set. The training set is oversampled to reduce data imbalance but nodule images in the testing set were not oversampled. The validation set was derived from the training set. Fig. 5 represents the increase in accuracy on each epoch, over the course of 25 epochs, training and validation accuracy is increasing along with each epoch. The horizontal axis represents the epochs and the vertical axis represents the accuracy on a scale of [0, 1] where 0 is the minimum and 1 is the maximum accuracy. The accuracy can be seen to improve even after the 13th epoch however testing showed that the model started overfitting the training data after the 13th epoch. On the other hand, Fig. 6 represents the decrease in the log loss over each epoch. The loss value of each iteration of the epoch is calculated and added to the total loss value of the epoch and by the end of each epoch, the total loss value is set back to zero.

Figure 5: Training and validation accuracy over epochs
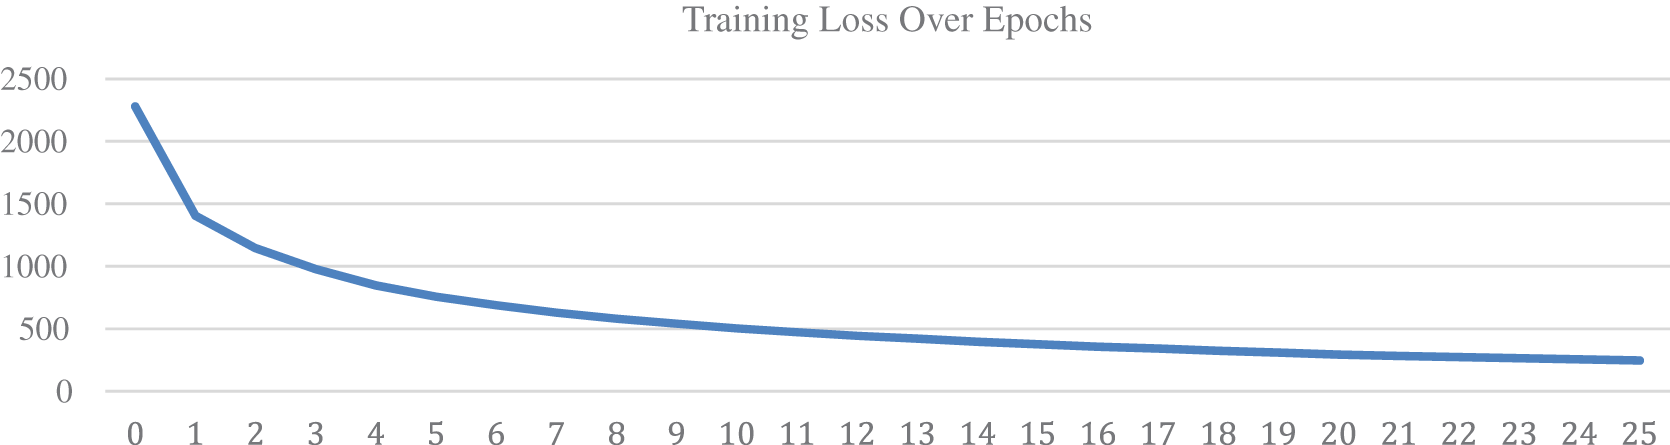
Figure 6: Training loss over epochs
We validated the model on 38,675 data points to verify the performance of the proposed model but data points from the minority class were not oversampled during the testing phase. The validation set consisted of 300 nodules and 38,375 non-nodules. We ran ten times on validation data to verify the model’s consistency and achieved an average accuracy score of 95 percent. However, the model displayed a tradeoff between false positive and false negative rate. As the false positives dropped, the false negative increased. It can be inferred from the confusion matrix that out of 300 points in the nodule class 206 were correctly classified as nodules and 94 were misclassified as non-nodules and out of 38,375 non-nodules 37,769 were correctly classified and only 606 were misclassified as nodules. The confusion matrix on the validation dataset is presented in Table 3.

In order to test the network, we split the data 80:20 where 80% of the data is used for training the model and 20% of the data was used for testing. There was a major problem of data imbalance because the non-nodule class had over 50k images and the nodule class had 1351 images. We used 1-fold cross-validation due to a lack of data in the nodule class. We also oversampled the nodule images at the ratio of 1:440. Prior to the training we randomly separated 200 images from the nodule class out of the 1351 images of the nodule class, and 300 images from the non-nodule class out of the 50k images of the non-nodule to test the system. Training time per epoch was approximately 30–45 min on Nvidia 980 m while testing time for 300 images was approximately 5 min given the potential nodule patches were already extracted. The model achieved an accuracy result of 95 percent on the test data. The confusion matrix on the unseen test data is presented in Table 4.

Multi-group patch-based deep learning networks [27] also exhibited a tradeoff between sensitivity and false positive rate. As the sensitivity increased so did the number of false positives per scan. This pattern is also witnessed in our proposed method as well. As we adjusted the hyper-parameters to reduce the false positive rate the overall sensitivity dropped as well. The 3D convolution neural network presented by Huang et al. [28] achieved 90 percent sensitivity at the cost of 5 false positives per scan. In order to identify the capability of the proposed model to distinguish nodules from non-nodules, we tested it as a standalone model instead of using it as a backbone of an image segmentation model. The proposed method produced 98.4 percent specificity and the false positive rate was barely 1.5 percent. Out of 300 nodules, 68 percent were correctly classified and 38 percent were misclassified. This is a tradeoff between sensitivity and false positives we noted, which is also reported by [27]. As we adjusted the hyper-parameters to commend lower false positives the sensitivity also dropped. We sacrificed a little bit of sensitivity to achieve our goal of low false positives.
In Table 5, we compared the results of the proposed E2E network with [27,28]. We calculated the average specificity of [27] from level 1 to level 4 over group 1. They used LIDC/IDRI dataset for their study; the LIDC/IDRI dataset divides the nodules into 4 categories based on their malignancy level, which is represented as levels in this study. Jiang et al. [27] also divided the images into two groups, the first group labeled group 1 contained original images, and the second group labeled group 2 contained a binarized form of group 1 images. They had the highest specificity of 94.1% on level 3 and the lowest specificity of 81.8% on level 2. Huang et al. [28] On the other hand used 3D convolutional neural networks to solve the same problem they achieved a high sensitivity of 90% but they did not mention the specificity of their neural network. Unlike [27,28], our proposed neural network does not require a complicated machine-learning pipeline to produce results. It follows a simple end-to-end approach and produces results with high specificity. It makes our proposed model highly flexible and easy to implement in a solution. Our proposed model produced a specificity of 98.4%, which exceeds the specificity of [27] by a considerable margin.

High specificity means a very low rate of false positives, which can be essential in lung cancer diagnosis as it will eliminate non-nodule candidates. The elimination of these non-nodules will improve the performance of malignancy classifiers and it will allow the radiologists to identify malignant nodules more accurately. Our proposed model can prove to be quite useful if a solution requires a minimum false positive rate in lung nodule classification as it is easy to implement and computationally efficient. Our proposed model can be integrated with a complex machine-learning pipeline seamlessly. It can also be used as a backbone in a lung nodule image segmentation model. By fine-tuning, its hyper-parameters we can also improve its sensitivity but at the cost of specificity which makes the model flexible to change.
The aim of this study is to develop an end-to-end convolutional neural network that is capable of identifying lung nodules in two-dimensional images and reducing the number of false positives to a bare minimum. We have also discussed the problem of severe data imbalance in publicly available medical image datasets. The proposed neural network consists of five convolutional layers, one dropout layer and two fully connected layers. This neural network can be used as a backbone in image segmentation models. Our proposed model achieved a specificity of 98.4 percent and the false positives were reduced to a mere 1.5 percent but the sensitivity was also reduced to 68 percent. We trained and tested this model on the largescale LUNA16 dataset. The results exhibit the consistency and high specificity of the mode. We utilized data oversampling to cope with the problem of data imbalance. We separated, transformed and augmented the images from the nodule class. The need for an effective computer-aided lung cancer detection system is evident from the high mortality rate of lung cancer. Most lung cancer-related deaths are a result of late and ineffective diagnoses. We will continue our work on this model to improve the sensitivity by optimizing the hyper-parameters using recent optimization algorithms [37–45] and design a similar end-to-end model to classify malignant and benign nodules in the near future.
The proposed method is only applicable to 2D potential nodule images and it does not take into consideration the 3D aspect of CT scans. The non-nodule class is the dominant class with over 50k images while the nodule class only had 1351 images. Due to the lack of nodule data and extremely unbalanced classes, the training and testing ability of the model is restricted and limited.
Acknowledgement: We are thankful to the Energy Cloud R&D Program which supported this research through the National Research Foundation of Korea (NRF) funded by the Ministry of Science, ICT (2019M3F2A1073387), and this work was supported by the Institute for Information & communications Technology Promotion (IITP) (NO. 2022-0-00980, Cooperative Intelligence Framework of Scene Perception for Autonomous IoT Device). Any correspondence related to this paper should be addressed to Dohyeun Kim.
Funding Statement: We are thankful to the Energy Cloud R&D Program which supported this research through the National Research Foundation of Korea (NRF) funded by the Ministry of Science, ICT (2019M3F2A1073387), and this work was supported by the Institute for Information & communications Technology Promotion (IITP) (NO. 2022-0-00980, Cooperative Intelligence Framework of Scene Perception for Autonomous IoT Device). Any correspondence related to this paper should be addressed to Dohyeun Kim.
Conflicts of Interest: The authors declare that they have no conflicts of interest to report regarding the present study.
References
1. M. Markman, “Cancer treatment centers of america, (CTCA),” 2020. [Online]. Available: https://www.cancercenter.com/what-is-cancer. [Google Scholar]
2. W. H. Organization, “World health organization,” 2020. [Online]. Available: https://www.who.int/news-room/fact-sheets/detail/cancer. [Google Scholar]
3. J. M. Croswell, B. S. Kramer, A. R. Kreimer, P. C. Prorok, J. L. Xu et al., “Cumulative incidence of false-positive results in repeated, multimodal cancer screening,” Annals of Family Medicine, vol. 7, no. 3, pp. 212–222, 2009. [Google Scholar]
4. M. Z. Alom, T. M. Taha, C. Yakopcic, S. Westberg, P. Sidike et al., “The history began from AlexNet: A comprehensive survey on deep learning approaches,” arXiv preprint arXiv:1803.01164, 2018. [Google Scholar]
5. G. Litjens, T. Kooi, B. E. Bejnordi, A. A. A. Satio, F. Ciompi et al., “A survey on deep learning in medical image analysis,” Medical Image Analysis, vol. 42, pp. 60–88, 2017. [Google Scholar]
6. R. Anirudh, J. J. Thiagarajan, T. Bremer and H. Kim, “Lung nodule detection using 3D convolutional neural networks trained on weakly labeled data,” in SPIE Medical Imaging, vol. 9785, 2016. [Google Scholar]
7. F. Pesapane, M. Codari and F. Sardanelli, “Artificial intelligence in medical imaging: Threat or opportunity? radiologists again at the forefront of innovation in medicine,” European Radiology Experimental, vol. 2, no. 35, 2018. [Google Scholar]
8. W. J. Murdoch, C. Singh, K. Kumbier, R. Abbasi-Asl and B. Yu, “Definitions, methods, and applications in interpretable machine learning,” Proceedings of the National Academy of Sciences, vol. 116, no. 44, pp. 22071–22080, 2019. [Google Scholar]
9. Y. LeCun, Y. Bengio and G. Hinton, “Deep learning,” Nature, vol. 521, pp. 436–444, 2015. [Google Scholar]
10. L. Deng and D. Yu, “Deep learning: Methods and applications,” Foundations and Trends® in Signal Processing, vol. 7, no. 3–4, pp. 197–387, 2014. [Google Scholar]
11. W. Zhu, C. Liu, W. Fan and X. Xie, “DeepLung: Deep 3D dual path nets for automated pulmonary nodule detection and classification,” in IEEE Winter Conf. on Applications of Computer Vision, Lake Tahoe, NV/CA, USA, pp. 673–681, 2018. [Google Scholar]
12. J. Liu, Y. Deng, T. Bai, Z. Wei and C. Huang, “Targeting ultimate accuracy: Face recognition via deep embedding,” arXiv:1506.07310, 2015. [Google Scholar]
13. A. A. A. Setio, A. Traverso, T. D. Bel, M. S. Berens, C. V. D. Bogaard et al., “Validation, comparison, and combination of algorithms for automatic detection of pulmonary nodules in computed tomography images: The LUNA16 challenge,” Medical Image Analysis, vol. 42, pp. 1–13, 2017. [Google Scholar]
14. “LUNA16,” 2016. [Online]. Available: https://luna16.grand-challenge.org/Data/. [Accessed 2020]. [Google Scholar]
15. X. Yuan, L. Xie and M. Abouelenien, “A regularized ensemble framework of deep learning for cancer detection from multi-class, imbalanced training data,” Pattern Recognition, vol. 77, pp. 160–172, 2018. [Google Scholar]
16. J. C. Candy and G. C. Temes, “Oversampling delta-sigma data converters,” in Theory, Design, and Simulation, NY, USA: Wiley-IEEE Press, pp. 512, 1992. [Google Scholar]
17. S. Ando and C. Y. Huang, “Deep over-sampling framework for classifying imbalanced data,” in Joint European Conf. on Machine Learning and Knowledge Discovery in Databases, Skopje, Macedonia, 2017. [Google Scholar]
18. C. B. Ha and H. K. Song, “Signal detection scheme based on adaptive ensemble deep learning model,” Access IEEE, vol. 6, pp. 21342–21349, 2018. [Google Scholar]
19. X. -Y. Liu, J. Wu and Z. -H. Zhou, “Exploratory undersampling for class-imbalance learning,” IEEE Transactions on Systems, Man, and Cybernetics, Part B (Cybernetics), vol. 39, no. 2, pp. 539–550, 2009. [Google Scholar]
20. A. Anand, G. Pugalenthi, G. B. Fogel and P. N. Suganthan, “An approach for classification of highly imbalanced data using weighting and undersampling,” Amino Acids, vol. 39, pp. 1385–1391, 2010. [Google Scholar]
21. N. V. Chawla, K. W. Bowyer, L. O. Hall and W. P. Kegelmeyer, “SMOTE: Synthetic minority over-sampling technique,” Journal of Artificial Intelligence Research, vol. 16, pp. 321–357, 2002. [Google Scholar]
22. S. Wang, W. Liu, J. Wu, L. Cao, Q. Meng et at, “Training deep neural networks on imbalanced data sets,” in Int. Joint Conf. on Neural Networks (IJCNN), Vancouver, pp. 4368–4374, 2016. [Google Scholar]
23. M. Al-Shabi, B. L. Lan, W. Y. Chan, K. -H. Ng and M. Tan, “Lung nodule classification using deep local–Global networks,” International Journal of Computer Assisted Radiology and Surgery, vol. 14, no. 10, pp. 1815–1819, 2019. [Google Scholar]
24. D. Kumar, A. Wong and D. A. Clausi, “Lung nodule classification using deep features in CT images,” in 12th Conf. on Computer and Robot Vision, Halifax, NS, Canada, pp. 133–138, 2015. [Google Scholar]
25. A. Nibali, Z. He and D. Wollersheim, “Pulmonary nodule classification with deep residual networks,” International Journal of Computer Assisted Radiology and Surgery, vol. 12, no. 10, pp. 1799–1808, 2017. [Google Scholar]
26. W. Shen, M. Zhou, F. Yan, C. Yang and J. Tian, “Multi-scale convolutional neural networks for lung nodule classification,” in Int. Conf. on Information Processing in Medical Imaging, Isle of Skye, Scotland, pp. 588–599, 2015. [Google Scholar]
27. H. Jiang, H. Ma, W. Qian, M. Gao and Y. Li, “An automatic detection system of lung nodule based on multigroup patch-based deep learning network,” IEEE Journal of Biomedical and Health Informatics, vol. 22, no. 4, pp. 1227–1237, 2017. [Google Scholar]
28. X. Huang, J. Shan and V. Vaidya, “Lung nodule detection in CT using 3D convolutional neural networks,” in IEEE 14th Int. Symp. on Biomedical Imaging (ISBI 2017), Melbourne, VIC, Australia, pp. 379–383, 2017. [Google Scholar]
29. G. -G. Wang, M. Lu and Y. Q., Dong, “Self-adaptive extreme learning machine,” Neural Computing and Applications, vol. 27, pp. 291–303, 2016. [Google Scholar]
30. Y. Wang, X. Qiao and G. -G. Wang, “Architecture evolution of convolutional neural network using monarch butterfly optimization,” Journal of Ambient Intelligence and Humanized Computing, 2022. [Google Scholar]
31. J. -H. Yi, J. Wang and G. -G. Wang, “Improved probabilistic neural networks with self-adaptive strategies for transformer fault diagnosis problem,” Advances in Mechanical Engineering, vol. 8, no. 1, pp. 1–13, 2016. [Google Scholar]
32. Z. Cui, F. Xue, X. Cai, Y. Cao, G. -G. Wang et al., “Detection of malicious code variants based on deep learning,” IEEE Transactions on Industrial Informatics, vol. 14, no. 7, pp. 3187–3196, 2018. [Google Scholar]
33. “Data,” LUNA16, 2016. [Online]. Available: https://luna16.grand-challenge.org/Data/. [Accessed 12 3 2019]. [Google Scholar]
34. B. Vendt, “LIDC-IDRI,” The Cancer Imaging Archive, 16 12 2019. [Online]. Available: https://wiki.cancerimagingarchive.net/display/Public/LIDC-IDRI. [Accessed 18 1 2019]. [Google Scholar]
35. M. Bojarski, D. D. Testa, D. Dworakowski, B. Firner, B. Flepp et al., “End to End learning for self-driving cars,” arXiv:1604.07316, 2016. [Google Scholar]
36. K. P. Diederik and J. Ba, “Adam: A method for stochastic optimization,” in Int. Conf. on Learning Representations, 2014. [Google Scholar]
37. Y. Feng, S. Deb, G. -G. Wang and A. H. Alavi, “Monarch butterfly optimization: A comprehensive review,” Expert Systems with Applications, vol. 168, 2021. [Google Scholar]
38. G. -G. Wang, S. Deb and L. D. S. Coelho, “Earthworm optimisation algorithm: A bio-inspired metaheuristic algorithm for global optimisation problems,” International Journal of Bio-Inspired Computation, vol. 12, no. 1, pp. 1–22, 2018. [Google Scholar]
39. G. -G. Wang, S. Deb and L. d. S. Coelho, “Elephant herding optimization,” in 3rd Int. Symp. on Computational and Business Intelligence (ISCBI), Bali, Indonesia, pp. 1–5, 2015. [Google Scholar]
40. G. -G. Wang,, “Moth search (MS) algorithm,” MATLAB Central File Exchange, 2022. [Online]. Available: https://www.mathworks.com/matlabcentral/fileexchange/59010-moth-search-ms-algorithm. [Google Scholar]
41. S. Li, H. Chen, M. Wang, A. A. Heidari and S. Mirjalili, “Slime mould algorithm: A new method for stochastic optimization,” Future Generation Computer Systems, vol. 111, pp. 300–333, 2020. [Google Scholar]
42. Y. Yang, H. Chen, A. A. Heidari and A. H. Gandomi, “Hunger games search: Visions, conception, implementation, deep analysis, perspectives, and towards performance shifts,” Expert Systems with Applications, vol. 177, pp. 1–22, 2021. [Google Scholar]
43. I. Ahmadianfar, A. A. Heidari, A. H. Gandomi, X. Chu and H. Chen, “RUN beyond the metaphor: An efficient optimization algorithm based on runge kutta method,” Expert Systems with Applications, Bali, Indonesia, vol. 181, 2021. [Google Scholar]
44. J. Tu, H. Chen and M. Wang, “The colony predation algorithm,” Journal of Bionic Engineering, vol. 18, pp. 674–710, 2021. [Google Scholar]
45. A. A. Heidari, S. Mirjalili, H. Faris, I. Aljarah, M. Mafarja et al., “Harris hawks optimization: Algorithm and applications,” Future Generation Computer Systems, vol. 97, pp. 849–872, 2019. [Google Scholar]
Cite This Article
 Copyright © 2023 The Author(s). Published by Tech Science Press.
This work is licensed under a Creative Commons Attribution 4.0 International License , which permits unrestricted use, distribution, and reproduction in any medium, provided the original work is properly cited.
 Downloads
 Citation Tools