
 Submit a Paper
 Propose a Special lssue
 Open Access
ARTICLE

Energy Prediction in IoT Systems Using Machine Learning Models
Department of ECE, SRM Institute of Science and Technology, Vadapalani Campus, No1 Jawaharlal Nehru Road, Vadapalani, 600026, TN, India
* Corresponding Author: S. Balaji. Email:
Computers, Materials & Continua 2023, 75(1), 443-459. https://doi.org/10.32604/cmc.2023.035275
Received 15 August 2022; Accepted 24 October 2022; Issue published 06 February 2023
 View Full Text
 Download PDF
Abstract
The Internet of Things (IoT) technology has been developed for directing and maintaining the atmosphere in smart buildings in real time. In order to optimise the power generation sector and schedule routine maintenance, it is crucial to predict future energy demand. Electricity demand forecasting is difficult because of the complexity of the available demand patterns. Establishing a perfect prediction of energy consumption at the building’s level is vital and significant to efficiently managing the consumed energy by utilising a strong predictive model. Low forecast accuracy is just one of the reasons why energy consumption and prediction models have failed to advance. Therefore, the purpose of this study is to create an IoT-based energy prediction (IoT-EP) model that can reliably estimate the energy consumption of smart buildings. A real-world test case on power predictions is conducted on a local electricity grid to test the practicality of the approach. The proposed (IoT-EP) model selects the significant features as input neurons, the predictable data is selected as output nodes, and a multi-layer perceptron is constructed along with the features of the Convolution Neural Network (CNN) algorithm. The analysis of the proposed IoT-EP model has higher accuracy of 90%, correlation of 89%, and variance of 16% in less training time of 29.2 s, and with a higher prediction speed of 396 (observation/sec). When compared to existing models, the results showed that the proposed (IoT-EP) model outperforms with a satisfactory level of accuracy in predicting energy consumption in smart buildings.Keywords
The intensification of urban development has resulted in a substantial rise in energy usage. The internet of things has risen exponentially, fostering the growth of smart buildings. Variable environmental data is compiled and measured to give recommendations for better municipal efficiency related to smart communities [1]. In particular, a key element in the creation of clever communities is the short-term power forecast. Simultaneously, energy firms need to generate energy to guarantee adequate power generation, leading to power losses and societal issues [2,3]. For this reason, short-term power predictions are necessary to decrease wastage and optimize power requirements. Power consumption is often strongly linked to the ecological status of power use. The micro-environmental status of the energy demand sector can be sensed by IoT-connected phones on either side. A short-term assessment and energy demand forecast are carried out to help decision-makers for power generation, transmission, and preservation, significantly reducing waste and emissions from the atmosphere relying on this data [4]. In other words, a short-term power forecasting process is a critical supplement to power systems to accomplish flexible production. Regional and foreign researchers have made attempts in the field of power forecasting. The most popular strategy is now the forecast method, where a storehouse is set up by evaluating a huge set of related data [5]. To some extent, this method is advantageous, like the forecast findings’ high precision. In reality, though, IoT smart energy solutions are not affected by such a forecast method. Data storage is a form of off-site data processing, and its links to manufacturing technologies aren’t strong enough to respond to changing weather conditions [6].
IoT technology simultaneously increases demands for efficiency in real-time. Energy centers often generate surplus energy to prevent under energy. The more rapidly the manufacturer can change the project schedule, the more rapidly the effectiveness of saving energy and minimizing power waste is improved, and the faster the projected result is reached [7,8]. The forecast of energy is strongly linked to climatic parameters. The transactional data often varies and is variable based on spatio-temporal knowledge. The study of the affective state and handling is hard to determine [9]. Based on intelligent devices, there is also an important requirement to identify the surroundings efficiently. The power forecast is implemented as fast as possible to assist the energy conservation system by making prompt decisions [10]. Moreover, the features of the IoT contexts to consecutively enter data into the flow and continuously modify the flow of information must be addressed while building forecasting analytics. In other words, flexible learning and updating approaches should apply to the prediction model.
This paper summarises the major achievements as follows:
• A short-term energy forecast system is designed to decrease delays and the computational burden of the centralized servers, integrating information gathering, event log generation, and forecasting development.
• A spatial database approach is formulated using stream analysis methods. It combines spatial information semanticity and translates weak somaticized data sources into data sources.
• An updated (CNN) model is followed by a short forecast situation that refreshes the forecast modelling stream to adapt to the modifications to the IoT infrastructure.
The rest of the article is as follows: Section 2 denotes the background to the energy prediction systems. The proposed IoT-based energy prediction (IoT-EP) system is designed and implemented in Section 3. Section 4 indicates the software analysis and performance comparison of the proposed system. Section 5 discusses the conclusion and future scope.
2 Background to the Energy Prediction Models
IoT detectors have been widely used to observe and collect data for a wide range of practical applications, including medical services, agriculture, advanced energy management, urban safety, transit, pollution monitoring, and other software [11]. This article introduces a novel short-term load prediction method based on the Multi-Objective Grasshopper Optimization Algorithm (MOGOA) and Deep Extreme Learning Machine (DELM). The model achieved the greatest accuracy of 85.80 percent in predicting the testing data, as indicated by the experimental results [12]. Research on the battery life and the complex varieties of discharging of electricity in the habitat was undertaken. The research was carried out with sensor systems and wearing technologies in the sensing material housing section. The study was constrained by aberrant energy dissipation trends, and the highest variance between the gadgets in the software was noticed [13]. A third-generation collaboration programme to resolve low-energy miscommunication was initiated to provide a bandpass concept of the internet of things to exist without a new battery for more than ten years [14]. The paper suggests that the accuracy of Artificial neural network (ANN) and Random forest (RF) models is affected in distinct ways by the level of detail at which forecasts are made and the data input parameters that are made available to the models. The RF model was shown to be faster than the alternatives in terms of the amount of time it took for the algorithms to converge across all datasets [15]. Further research on the results of dispute settlement in several multi-user settings has not been undertaken. As an energy use paradigm, a tool was provided to estimate the battery capacity of connected devices simply by evaluating the specifics of the intended network activity and the amount of disturbance possible [16]. The paper outlined that, in contrast to previous Machine Learning (ML) techniques, the 2D-CNN produced promising results. The suggested CNN employs a two-dimensional input as opposed to the standard one-dimensional input utilised for seasonal and trend decomposition using the Loess Forecasting model (STLF). When compared to other ML approaches, CNN’s results were superior for both the one-quarter and 24-hour-ahead forecasts [17]. It was discovered that the smart sensor networks operated at a higher level when the data was transmitted in excess. A weighted mean light brightness technique was presented to assess the energy gathered from the solar panels. This forecasting system’s failure rate was about 0.8%. Global positioning system (GPS), accelerometer, Wi-Fi, and other geolocation programmes were widely used on cellphones. GPS seems to be the crucial element for greater temporal services, and online batteries were exhausted quickly, as suggested by Puri et al. [18]. This research suggests a method for enhancing the grasshopper optimization algorithm’s (GOA) exploration and exploitation capabilities by adopting a new function for the algorithm’s primary governing parameter. Experiments [19] show that the suggested method is better than the cross-validation method in terms of accuracy of predictions, accuracy of feature selection, and speed of execution. Different wireless sensing networks and IoT commercial power usage techniques were developed. A system called I3Mote with a few linked IoT devices was created, and far more I3Motes were united to make a maximally provided data range, which gave the linked power networks a life of up to 10 years, as suggested by Ashraf et al. [20]. Sensor networks were employed for information transmission to portals. The energy infrastructure of such IoT devices is restricted. When the transmission was finished, switching off the network device was preferable to use energy effectively. That enables network devices to preserve power consumption by autonomously transitioning between rest and operational modes. A methodology for addressing sustainability surveillance was provided using a self-monitoring mechanism to protect the capacitor’s long-life power. In comparison to 13 percent of information received in 2 h, the power source used by IoT devices was 3 percent. It demonstrated a network throughput of 100% for less than 600 m. For a time being, battery-powered smart objects can be installed in remote areas and function without service for a period of time. For replenishing the devices using accessible renewable resources in the surroundings, collecting power could be done. A two-stage predictor was given using the overcast climate forecast, which was concurrently gathered daily for evaluation. When predictions were made for 24 h, the model suggested did 12% better than the exponential smoothing moveable mean forecast [21]. Machine learning (ML) algorithms are mostly used to forecast power consumption in IoT devices, collect electricity, etc. Nurgaliyev et al. [22] made smart power software for conventional solar cells in sensor devices that use reinforced training. RF beat ANN in terms of processing power and time, as well as precision error for predicting electricity consumption [23]. Mobile nodes were famous for their rechargeable sensors, which enhanced standby time and lowered the price. Data on solar energy was needed to design, install, and operate self-rechargeable terminals suggested by Wang et al. [24]. For solar radiation prediction, a prediction framework was designed utilising ML techniques, and these methods were created using Spring Forward, Cubist, and Spikes lab. The findings showed that solar radiation predictions were properly measured in simulations with ML techniques from several hours to a couple of days when season changes were not considered in weather circumstances [25]. To conclude, several scholars conducted a thorough study of techniques for energy forecasting. The research gave useful reference points for power forecast extracted features and structure analysis. Such investigations were mostly dependent on data warehouses for research methodology; the lack of clear contact with the internet of things and the variability in IoT devices cannot swiftly occur. These difficulties can be resolved with IoT methods. Building a short-term power forecasting model that is directly related to IoT manufacturing used powerful computational concepts, interpretation approaches, batch processing, and computational intelligence models as one global IoT environment.
3 Proposed IoT Based Energy Prediction (IoT-EP) System
Smart energy management is a major problem in buildings in commercial areas—energy usage changes during varying periods of the day in the commercial district due to several environmental conditions. Generally speaking, the power system comprises the power center, the power usage, and the transit pipes. Several intelligent gadgets are used for monitoring progress in multiple environmental variables in real time within power generation. These components comprise numerous environmental elements like residents’ number and temperature fluctuations, notably energy demand. They are changing external data that gives an actual energy usage forecast, acquired by evaluating and tabulating.
The architectural design of the proposed IoT-EP system is shown in Fig. 1. It has four units: the data acquisition and fusion unit; event data generation unit; scenario model establishment unit; and prediction model building unit. It accesses data from different devices and predicts the energy consumption of the system. The architecture has four main phases: collection and integration of data; production of data sets; setting of situation models; and forecasting. The process is sequential and has four stages. This capability allocates the tasks on three levels: collected data, merging restricted endpoints, and restricted endpoints are handled. As in forwarding endpoints of the top layer, performance data production is carried out only after received data and situation forecasting models. Forecasting is eventually carried out from a centralised computer. The analysis of information is the basis of the power forecast model driven by data. In the data capture and integration stage, semantical approaches apply to complex and different datasets, diversity, and duplication of information inside the IoT platform. The first is to provide a uniform description of heterogeneous data sources in the data structure. Following that, data aggregation is performed using topic ontologies approaches to reduce duplicate data. It is noteworthy that information fusion activity only occurs during the startup phase without changing the internet-of-things information system. Following this work, incompatible duplicate wireless sensor data from multi-source systems will be depicted as a uniform data module (DM) which can be handled immediately. Since the calculation power needed to acquire a piece of data is modest and the volume of data sources is extremely large, acquiring data is allocated to the network edge. Individual information cannot capture the features of the situation because of the poor semantics of data sources. Hence, it is necessary to generate data points rich in semantic data. It is usually recognised that time and position features of data are very semantical, as in IoT devices. The spatial time characteristics of data samples and event characteristics are therefore factored in. In this step, data are initially aggregated in networking routers based on their spatiotemporal semantics. A parallel programming approach that relies on a rolling windows approach is built to treat collected data and information. Therefore, the consolidated data is entered into the streaming data packet and applied to extract data-rich with semantic data per the pre-configured event criteria. The application of spatial interpretation gives spatial flexibility to the production of data sets. This technique is indeed used in networking routers to enhance processing performance in the regional web analytics procedure.
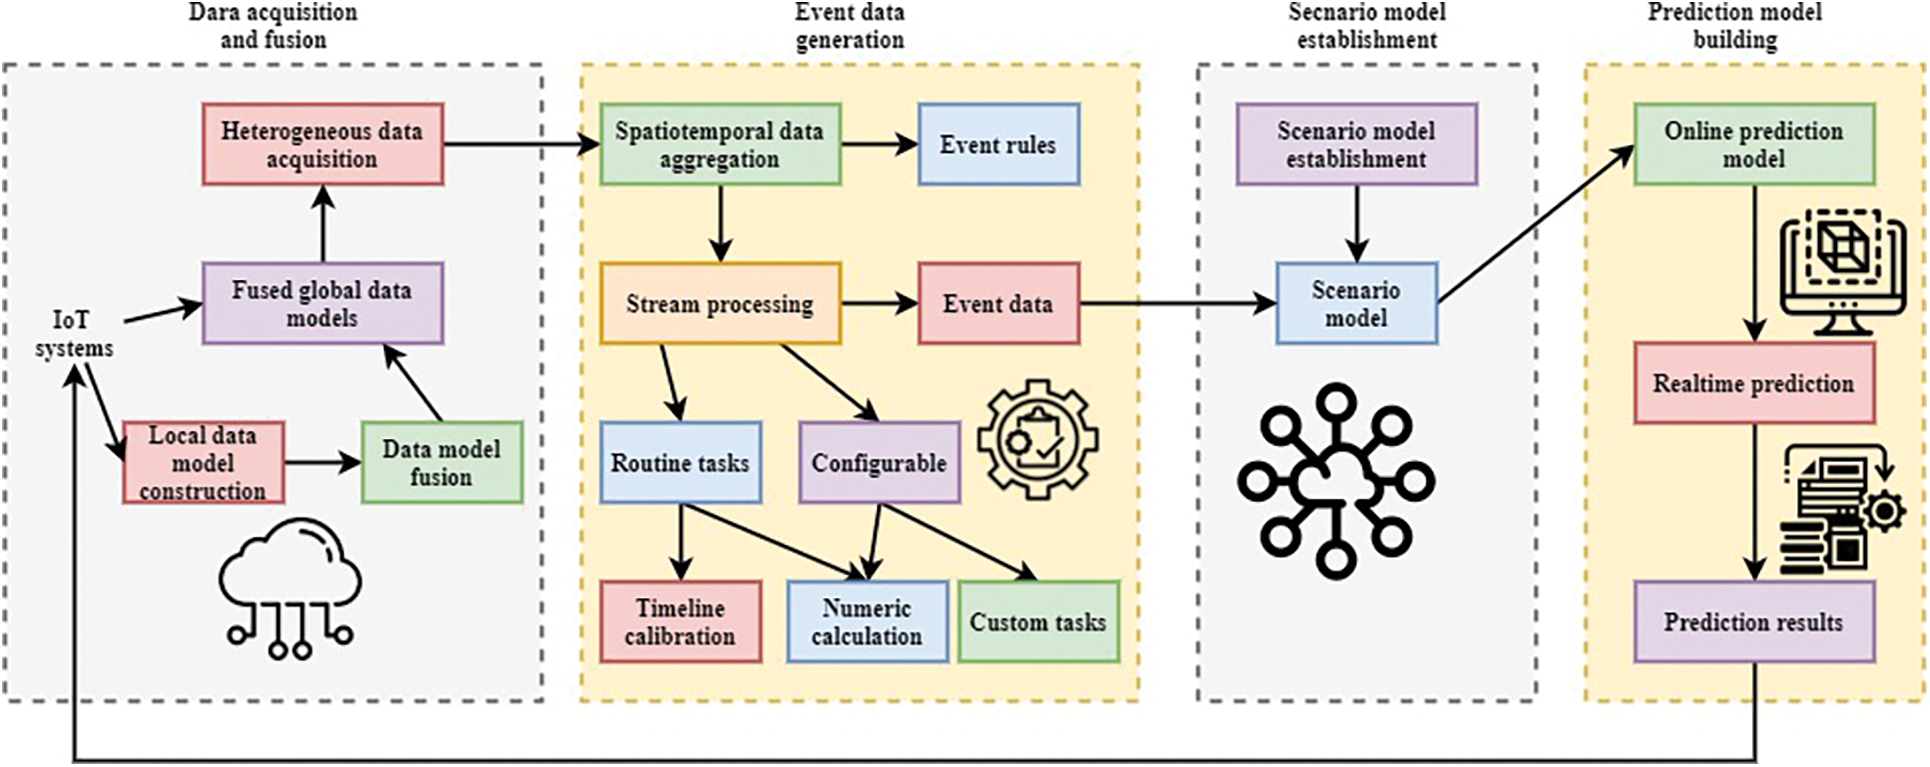
Figure 1: The architectural design of the proposed IoT-EP system
Different IoT information sources have been converted into significant data sources in the previous part. In the electricity system, there’s a lot of incident information to represent the status of different occurrences. The energy forecasting system incorporates several events that form the forecast situation combined. Also, the different events have different roles in predicting the future. Some of them are forecast inputs, while others are actual forecast value outcomes for the model update. This is to match the different forecasting positions. Integrating such data sources into a somaticized situation picture and translating it into forecasting frameworks is crucial in the next stages. A basic requirement model comprises several occurrence phases that define a situation and show the prediction’s responsibilities. A unified approach is thus critical to control these data points for such basic requirement definitions as the occurrence data processing in the individual vector and the forecast results as in the statistical model. For this purpose, it is suggested to reconstruct the predicted scenario in logistic regression. As per the situation type, the same period aspect data files are a picture of the stage and are translated into simulation selected features. A scene consists of several characteristics commonly defined by occurrences. Situation characteristics are separated primarily into three kinds in the forecast situation: status, management, and characteristic features. The condition is evaluated to identify the shifting IoT ecosystem status normally utilised as the forecast factor. For example, in the local smart electricity system, the number of residents between 2 and 3 pm exemplifies the condition. The monitoring process is the forecasting designer’s goal outcome, computed quietly on a status basis to guide the information ecosystem. For instance, in the local smart electricity system, the chiller’s component object is power. In particular, the usual purpose is an important type of situation characteristic. It refers to descriptive features of the Internet environment that are always changing, like date features, the current time frame, etc.
An overview of the forecasting situation is briefly described. (SF) Set represents the state characteristics set, (CF) Set is the controlling set of functions, and (GF) Set is the universal characteristics set. The IoT-EP requires a while as default and gathers similar time series to provide a picture of the situation, as per characteristic kinds. In the same picture, the characteristic information is immediately transformed into forecasting intake or result dependent on its function in the forecast and forwarded to the forecasting model. The IoT-EP gathers every event statistic between 2 p.m. and 3 p.m. per day, like climate data, local people, and power. This is mostly a picture of the situation that specifies the overall management and condition characteristics of geographical data, gadget condition, and power usage during the present period. This characteristic information is then translated into outcome indicators for the forecasting classifier or immediately updated in the model. The IoT-EP information is pre-configured by the environmental and forecasting aims of power system management. It uses time-dependent data points from the IoT-EP set to meet the conceptual definition of the set of equations for forecasting or to translate the necessary deterministic data into a forecasting model.
Prediction accuracy is the key element of the electricity system as a whole. When a piece of information is sent from each forwarding component to a central computer, the system combines and changes the data based on the predetermined IoT-EP within the function information bundle suitable for deep learning models to learn. The power forecasting system gathers and utilizes these models to determine the power demand and related components of energy demand variables on the power usage end and transportation piping system. That is a common assignment to analyse regression. The system chooses the important elements as input neurons, chooses the predictable data as output nodes, and builds a multilayer perceptron. This operation can be handled successfully by the CNN algorithm. The forecast feature of the forecast for a regressive forecast is
The output layer function is denoted
where
The pictorial representation of
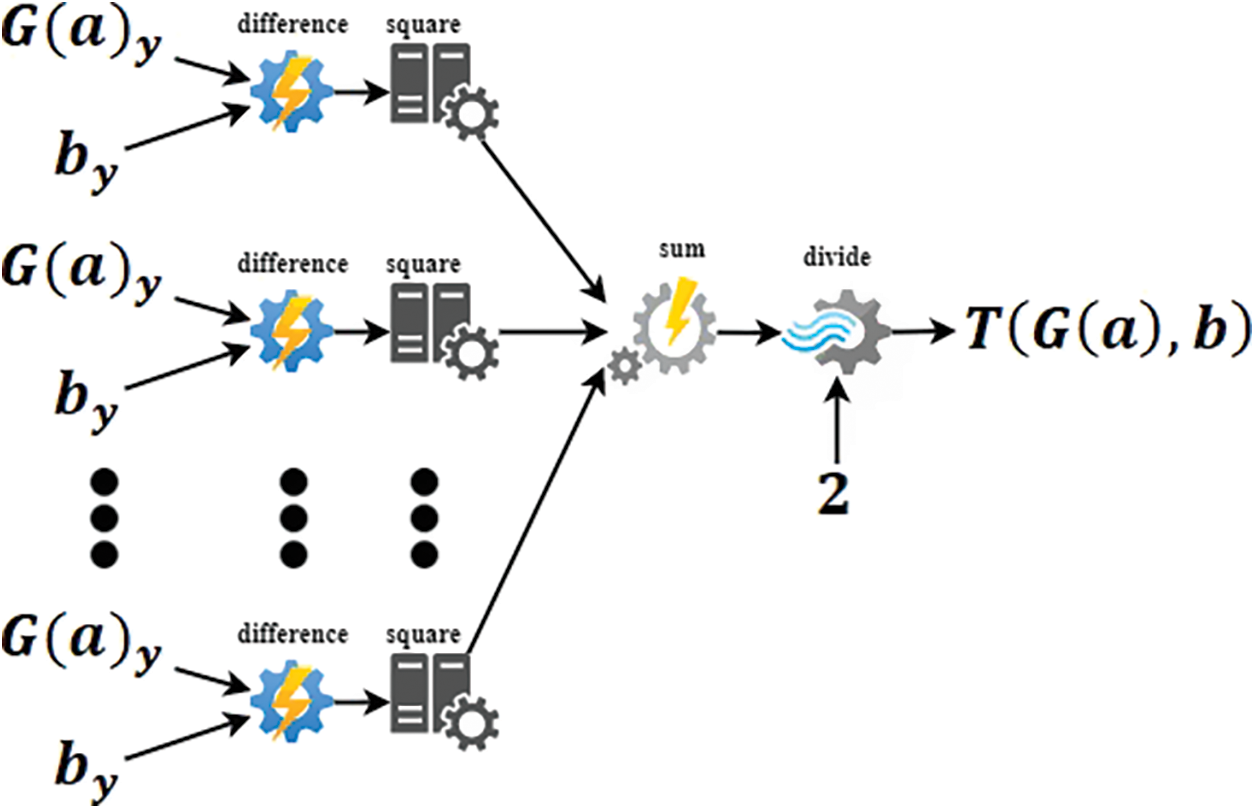
Figure 2: Pictorial representation of
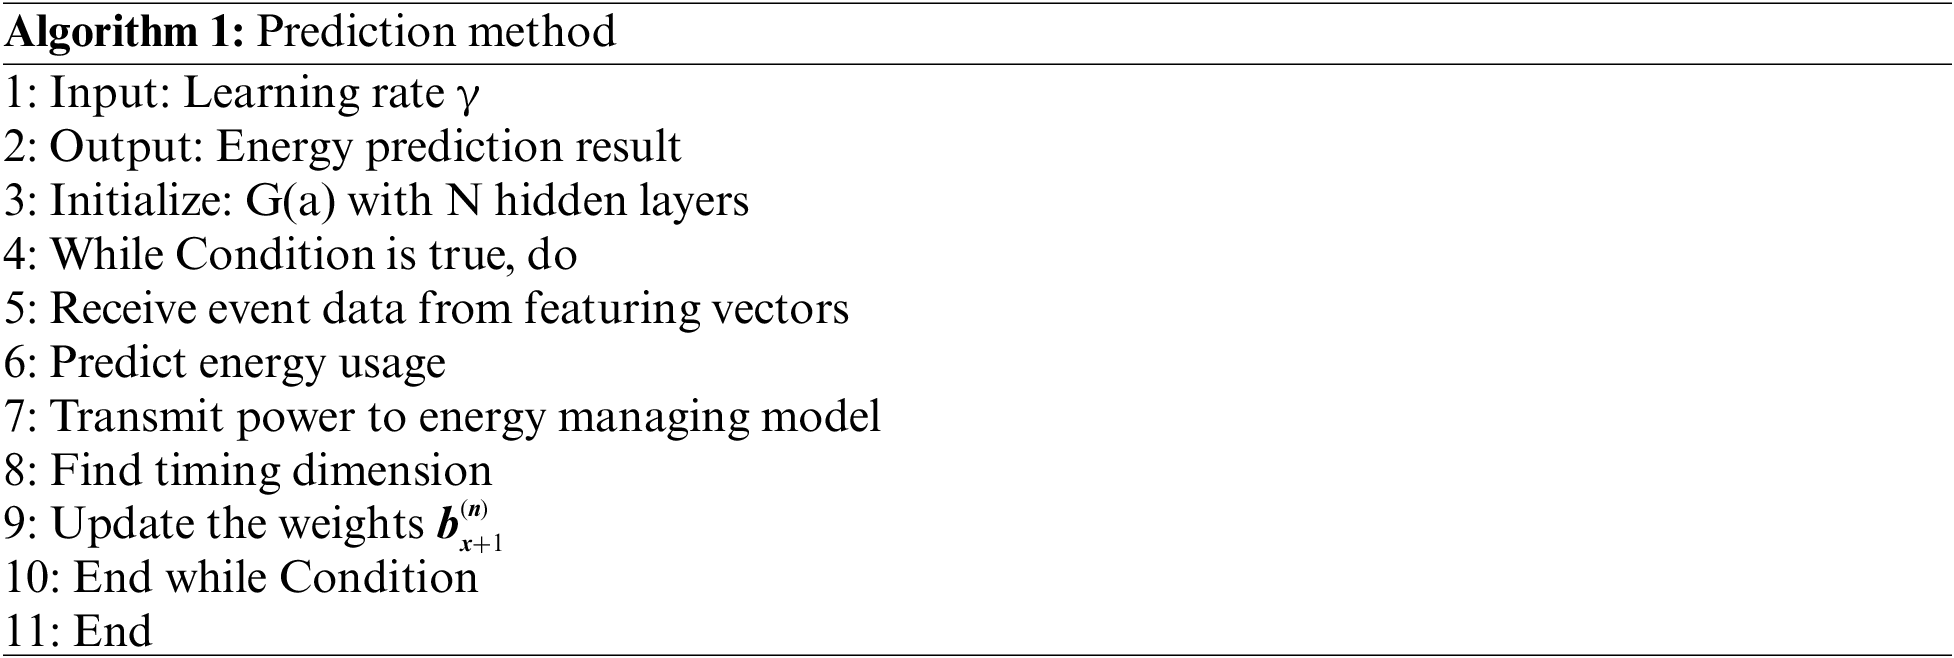
Algorithm 1 explains the process of predicting and modifying live machine learning. The forecasted outcome and the actual value are being used to compute the damage, and the whole network updates with the training algorithm method if the real value of the forecast goal arrives. The findings of the forecast are utilised as the internet-of-things response and are kept briefly. A cycle is finished at this time.
:
The system simulates the power usage using a neural feeding network that uses a multilayer feed-in layer. The intake layer functional vector is translated into a unique electricity production using a series of concealed layers. The particular description of intake is provided by every concealed layer of CNN, based upon the result of the preceding layer. The system can create a strong set of inputs at complex geometries with this level of generalization. The link between two neighboring network levels could be described in Eqs. (5) and (6)
To create non-linearity, it employed the Rectified Linear Unit activation (ReLU), the functional that is used at each output vector. The data is corrected to 0 when
The learning network is denoted
The most suggested training algorithm for the transmission of machine learning is ReLU, as this allows generalizing a range of nonlinear input. The output layer feature is denoted
The range of outcomes activated at every layer changes greatly during learning; the interior covariate movement is recognized. This intake inconsistency enables the system to stay humid, leading to a delayed resolution. The level normalization is utilized by determining the incoming range of values to decrease the covariant shift on every node level. In particular, the input is standardized for all functions, irrespective of the lot size. Average (
The number of samples in the hidden layer is denoted C, and the input feature is denoted
When C is the quantity concealed in a level, and
A steady variance was maintained across the link layer due to the network weight training. It initialised them according to the approach, which enhanced the findings and made the connection convergence more quickly. The indication of the disappearance or explosion to a substantial-quality is held in this technique. The value matrix
They are training the system like an error function using backpropagation, and that is the squared variance energy consumed and the target outcome. This technique improves root mean square (RMS) Property that offers a bias and velocity adjustment. It keeps an inverse linear mean of the previous sum of squares and previous slopes comparable to Adadelta and RMS. It provides variable training rates for updating the random downward gradient, calculated from slopes 1 and 2 times. Adam optimizer is utilized with such a learning period rate of 0.002 and a lot size of 200.
The steps to develop the system are discussed in this section.
First, it had established numerous DMs for information collection dependent on nature. For instance, the appropriate version of a DM called Pipe Info uses the complex pipe packet headers. In the XML schema, the DM set of numbers is expressed. The connection among DMs is then achieved by the metaphysics of the electrical domain, which is prefabricated by the technique mentioned in the earlier chapters. In light of the circulation in Bureau A or flow in Bureau B, since the tube system of two towers is uninterrupted, the same information is stored (the heated liquid level passes through) due to data duplication. Data aggregation is thus done here to remove unnecessary information. After that, the data was collected by the merged universal DMs at the perception routers, where it was reflected, and then sent to the navigation networks for more analysis
Users specify the rules of information hostility and performance data generation. This framework utilises the flow data packet to analyse the information so that dispersed information and occurrences are converted and the dataset is generated.
The system design model of the proposed IoT-EP system is depicted in Fig. 3. It has a residential area, an industrial park, a commercial district, a cooling system, and a thermal energy storage device. It has heating and cooling energy plants and triple generation plants. Real power is an instance of events representing power use at a particular location during a given period. Statistics from the same region are collected depending on the spatial features of DM. The user-defined registers data like the connection of computation among the electricity usage and DM-attributes like the network throughput and the execution speed. Then treat the original information, including these criteria, via the data flow components. Data is analysed in 5 s divisions, and power usage in 5 s in every detector during the time frame is computed. Finally, the short-term energy demand is added every five minutes to get the ultimate power usage. Consequently, from 7 am until 8 am, it gets event information detailing energy usage here. This change gradually completes the pairing of weak semantic information with occurrences and creates incident data that describes the occurrence features of the same simultaneous dimension.
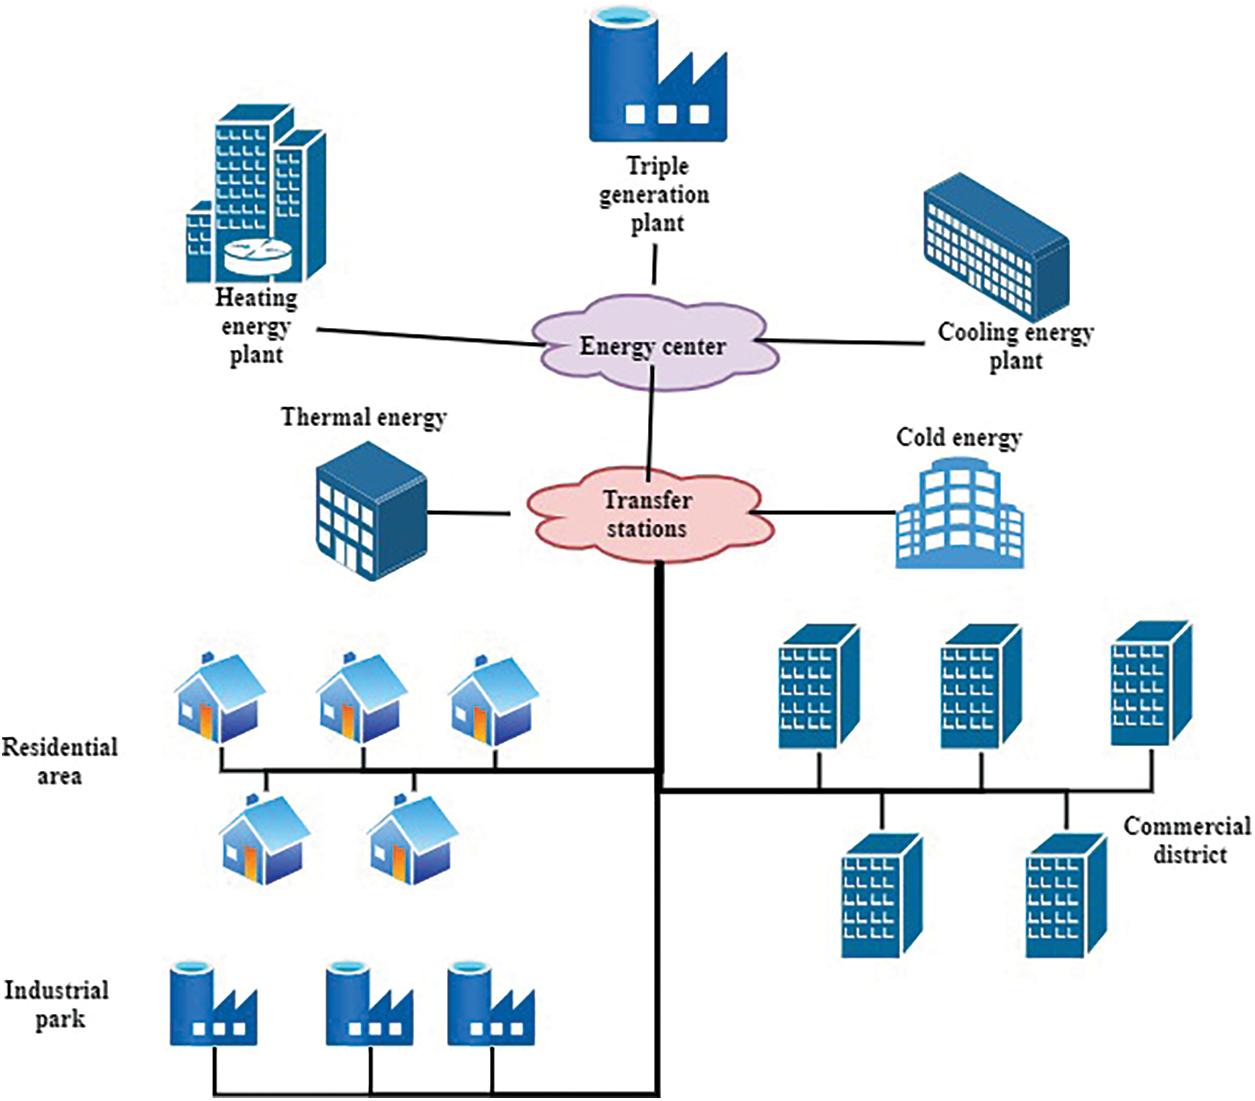
Figure 3: System design model
Some incident data officials are already here. The modification within the occurrence state is described.
(1) Majority of individuals, which explains the overall rate of residents over a specific interval of time.
(2) Wind conditions: describing in the region the severe weather conditions, including climate, heat, moisture, etc., for a particular amount of time.
Production Planning and control Data: represents the situation of management of power center equipment operations.
(1) Chiller units operating Condition: explain the chiller device management status for this timeframe, like the number of items activated and the operating capacity of these units.
(2) Performance condition: explain throughout this period and the heating systems ratios of equipment the situation of three-fold co-generation components management.
Based on the real-time state of the local smart electricity system, it created a version of the predicted paradigm for power consumption and generation. The software forecasts the power usage of the next alternative energy programme by the present surroundings of ending and transmission pipe networks to manage electricity generating equipment. The IoT-EP is built utilising relevant data (e.g., number of residents, weather changes, etc.) to create the SF Set, the terms and conditions of the power centre component to make up the CF Set, and the time attributes to produce the GF Set. The status of the network and the shared characteristic of the actual time are the intakes and the management characteristic for the subsequent time, to define the CNN by the simulation model. In engineering practice, the net architecture of the prediction model is a crucial element. It should strive to select a concise, concealed layer under the assumption of assuring exactness to prevent excessive skill required and fitting. Previous leaders of CNN might offer a best-served testing process. Due to the quantity of information based on the sizes of the components, most research was based on 1 to 3 convolutional nodes. The present CNN algorithms might include more than 100 convolutional nodes based on the exact transformation. The fully linked architecture is a decent option because of the lack of significant layers and the interaction of different elements. On this basis, it chose a sample for pre-experimentation from the given data and evaluated the 1 to 5 layered systems correspondingly. The findings demonstrate that a system with two convolutional nodes has decent precision, so the addition of hidden nodes doesn’t enhance the precision. It chose a fully interconnected CNN system with multiple hidden units and 64 to 32 neurons per layer for linear forecasting The condition is evaluated to identify the shifting IoT ecosystem status normally utilised as the forecast factor. In the preceding stage, the computers implement the suggested web-based learning technique and modify the system constantly using multiple data examples of inbound incidents. Then, using the prediction system to predict how much power devices will make and how they will trade, a fully autonomous proportional controller was made.
4 Software Analysis and Evaluation
The effectiveness and correctness of the approaches are assessed. It first examined the effectiveness of the calculation. The extent to which the reaction time improves depends on network circumstances. The IoT edge design significantly reduces the quantity of data transmitted via the network. Thus, in bad network circumstances, the increase in reaction speed is more substantial. The decentralisation of computer tasks on either side enables simultaneous activity that also contributes to excellent efficiency. It utilised four basic measurements to evaluate system efficiency: regression measurement factor, average mean squared errors.
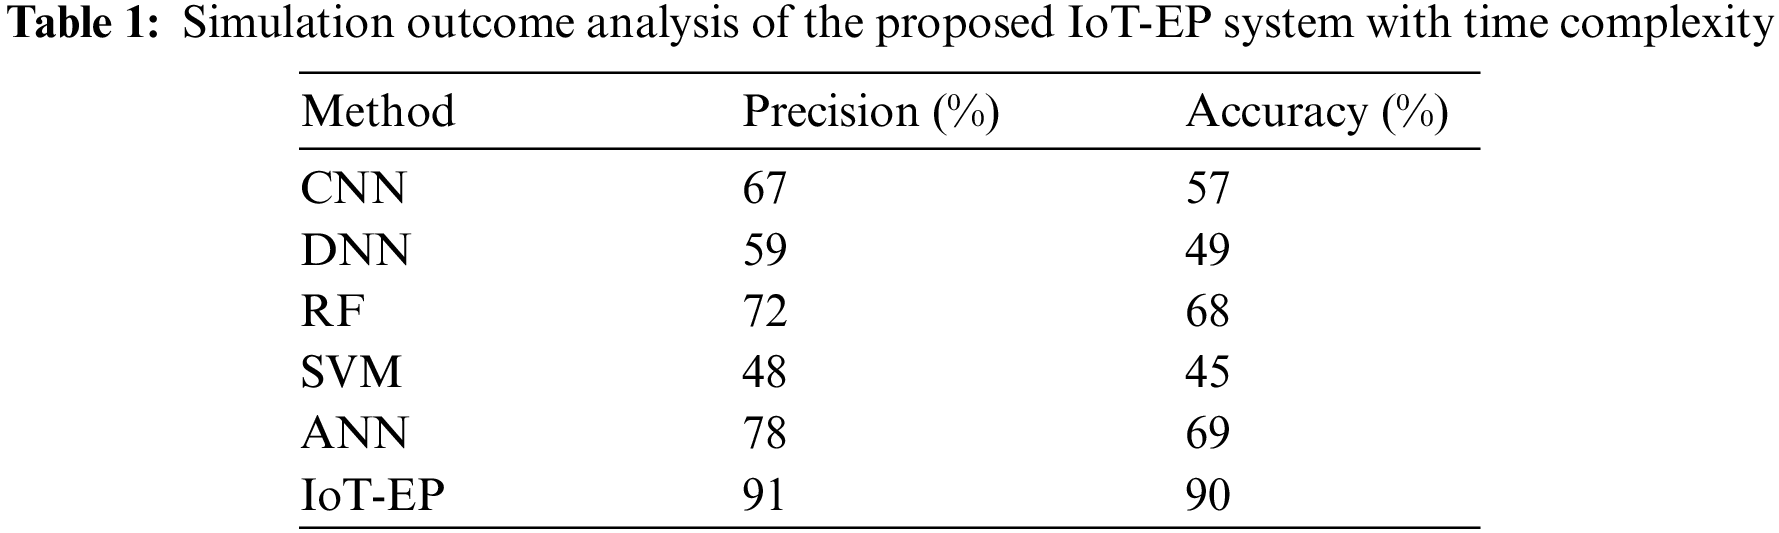
Table 1 depicts the simulation outcome analysis of the proposed IoT-EP system with time complexity. The simulation analysis of the proposed IoT-EP system, such as precision and accuracy, are analyzed over the simulation period. The findings of the analysis are compared with the existing systems such as Convolutional neural network (CNN), Deep neural network (DNN), Artificial neural network (ANN), Random forest (RF), and Support vector machine (SVM). The proposed IoT-EP system with wireless sensor networks predicts the energy consumption well than the existing models with higher accuracy and precision.
Figs. 4 and 5 indicate the proposed IoT-EP system’s mean square and average error analysis, respectively. The proposed IoT-EP system is designed with the help of wireless sensor nodes and machine learning models, and the energy required for the entire system is predicted using the suggested model. The machine learning model enhances the learning capacity of the proposed IoT-EP system and hence reduces the overall system error at the output. The variations in the errors are very small and very low, which improves system performance.
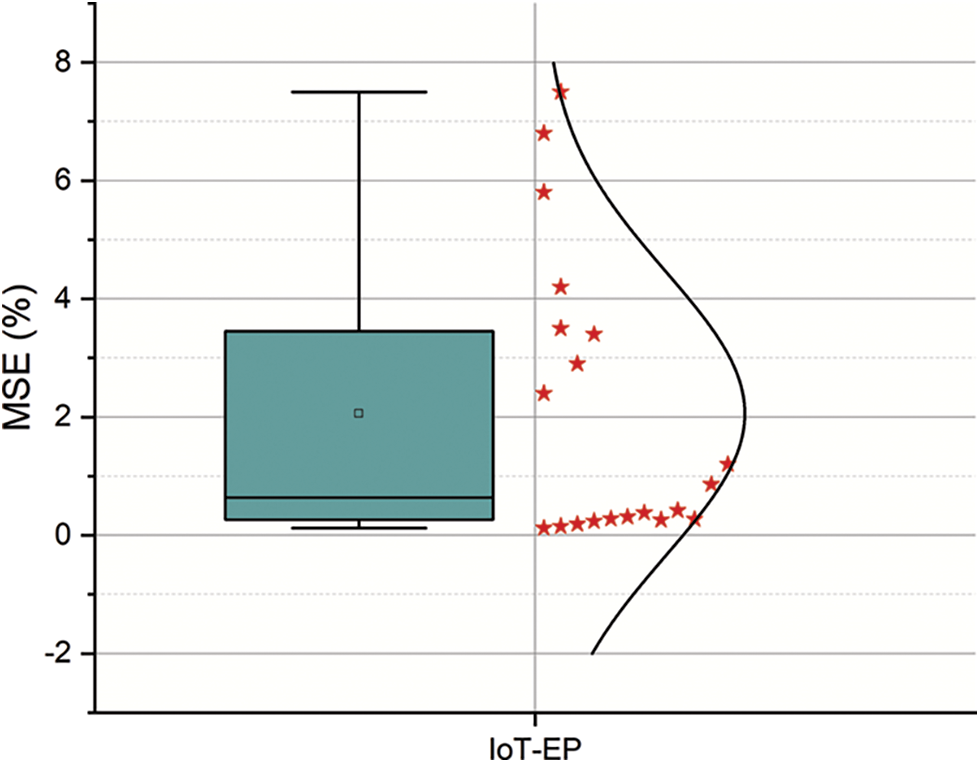
Figure 4: Mean squared error analysis of the proposed IoT-EP system
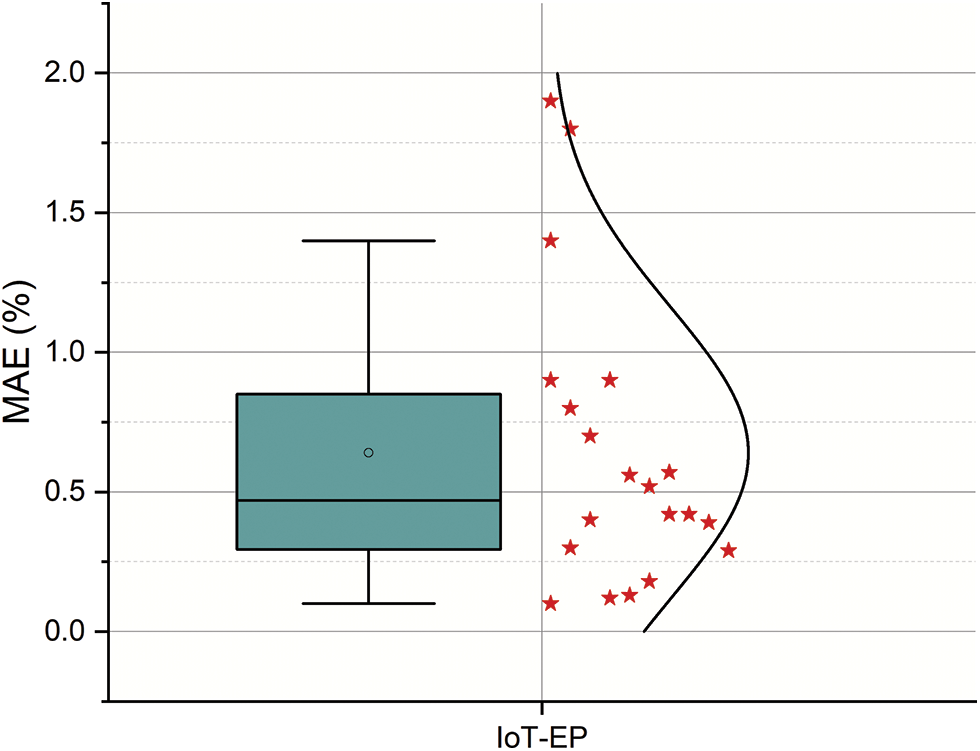
Figure 5: Mean average error analysis of the proposed IoT-EP system
Figs. 6 and 7 depict the proposed IoT-EP system’s precision and accuracy analysis, respectively. The simulation outcomes in terms of accuracy and precision are continuously monitored, and the simulation findings are continuously compared with the existing models. The proposed IoT-EP system exhibits higher simulation findings than the existing models with the help of machine learning. The proposed IoT-EP system with WSN consumes very little power and finds the better-predicted energy consumption of the systems.
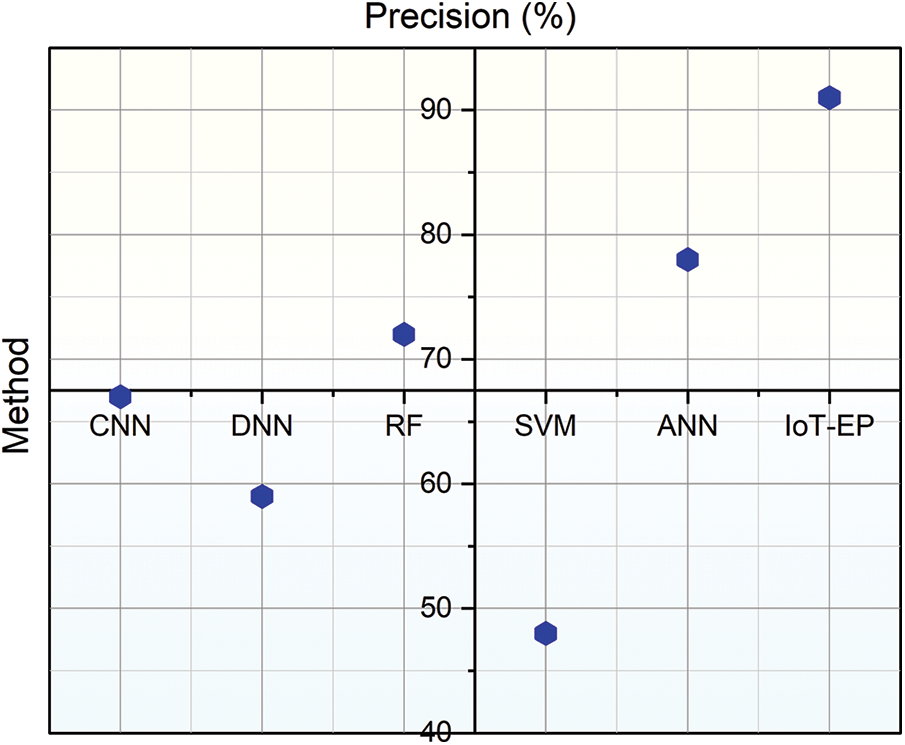
Figure 6: Precision analysis of the proposed IoT-EP system
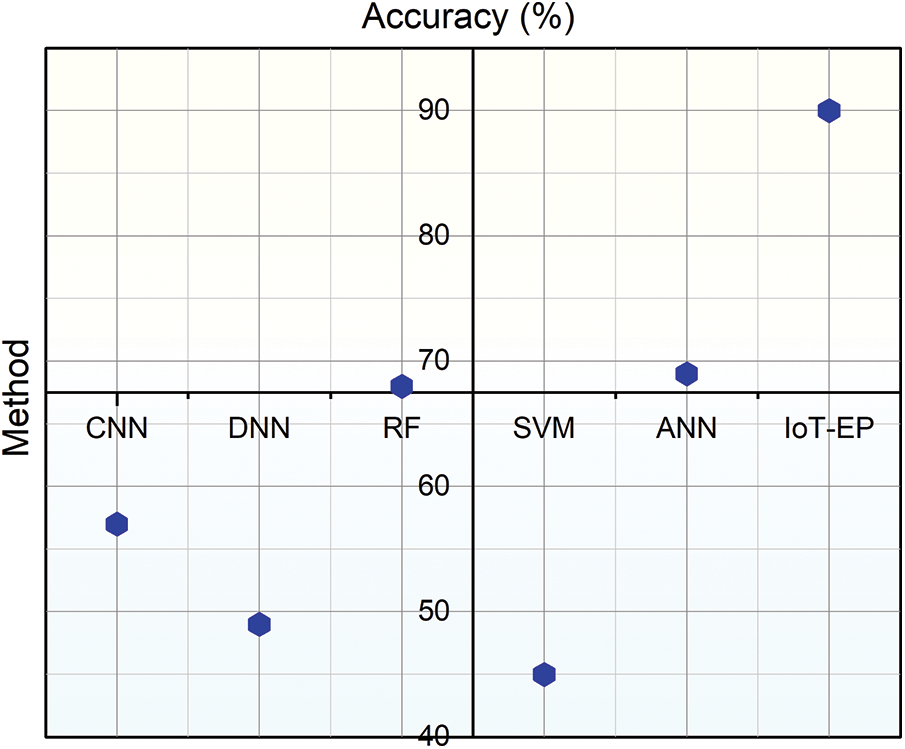
Figure 7: Accuracy analysis of the proposed IoT-EP system
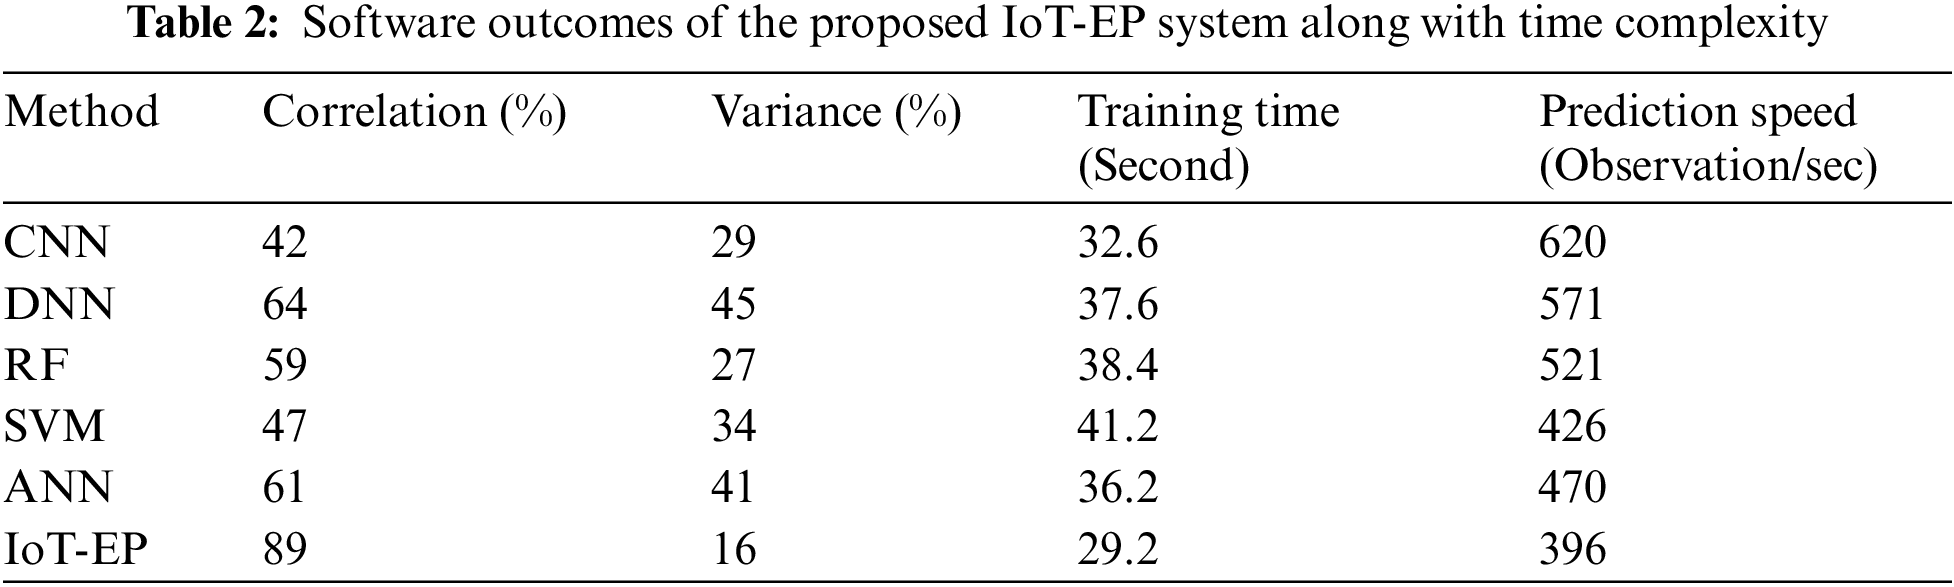
Table 2 indicates the software outcomes of the proposed IoT-EP system along with time complexity. The software outcomes such as correlation and variance of the proposed IoT-EP system are analyzed. The simulation results are compared with the existing models such as CNN, DNN, ANN, RF, and SVM. The results indicate that the proposed IoT-EP system with a machine learning model predicts the systems’ energy consumption well and helps reduce the error in the output. The proposed IoT-EP system exhibits higher correlation and lower variance with the actual output to the predicted results.
The correlation and variance analysis of the proposed IoT-EP system are shown in Figs. 8 and 9. The simulation analysis of the proposed IoT-EP system is done by varying the data samples for the analysis. The variations in the simulation outcomes, such as correlation and variance of the predicted outcomes with the actual energy consumption, are analyzed, and the simulation findings are compared with the existing models. The time complexity of the proposed IoT-EP system is shown in Fig. 10. The proposed IoT-EP system with machine learning and wireless sensor networks produces higher simulation results than the existing models. The proposed IoT-EP system is designed and analysed in this section. The simulation outcomes, such as accuracy, precision, correlation, variance, etc., of the proposed IoT-EP system are analyzed, and the results are compared with the existing models. The proposed IoT-EP system with machine learning and wireless sensor networks exhibits better simulation results.

Figure 8: Correlation analysis of the proposed IoT-EP system
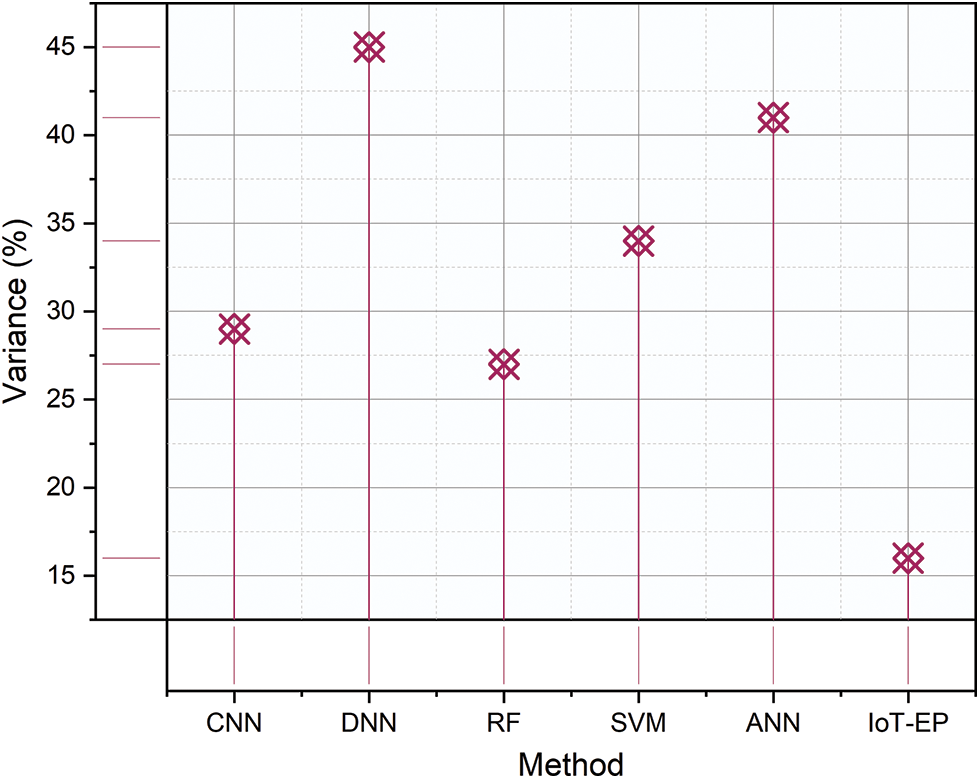
Figure 9: Variance analysis of the proposed IoT-EP system
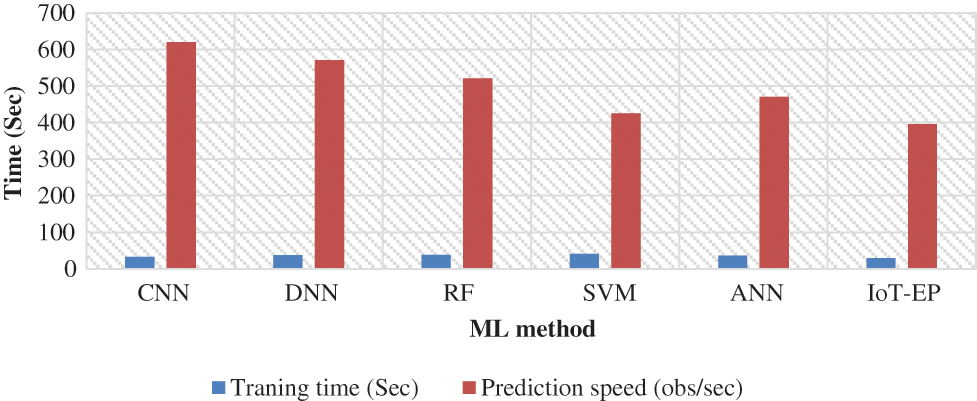
Figure 10: Time complexity of the proposed IoT-EP system
A method to make short-term power predictions for the internet of things is presented in this work. A comprehensive range of options is provided, from information gathering through processing and forecasting. An IoT-based energy prediction (IoT-EP) system is proposed in this article. In this solution, the edge computer design increases computer efficiency and lowers the central computer’s control. To handle and convert dispersed data from IoT devices, a semantic approach to information is presented. The first way to manage big heterogeneous data is to form a single database structure. Domain vocabularies are then used to assist fuse data in solving duplication and information mistakes. To enable the creation of a dataset from poor semantic information, a dataflow architecture that integrates spatial characteristics and incident regulations is built after data capture. Eventually, the situation is described using a basic requirement framework. An online model for the human brain is created to finish the forecasting and update the behavior in the real time. This model integrates the data sets into a situation picture and maps the forecasting models. An actual case analysis of data or information in the local smart energy economy shows the feasibility and effectiveness. The scope of the IoT device system is increasing and growing via the advent of the Web of Everything technologies. Further enhancements must be made to the wireless environment in the Edges Computation architectural system, like the introduction of a high-availability method for forwarding networks to combine processing resources and large IoT information inside the dataflow architecture of the Edge Device. In addition, the profound learning approach is further enhanced and adapted more swiftly to the distributed device.
Acknowledgement: The authors would like to thank the SRM Institute of Science and Technology, Vadapalani Campus for the support provided during this research.
Funding Statement: The authors received no specific funding for this study.
Conflicts of Interest: The authors declare that they have no conflicts of interest to report regarding the present study.
References
1. M. Chu, H. Li, X. Liao and S. Cui, “Reinforcement learning-based multiaccess control and battery prediction with energy harvesting in IoT systems,” IEEE Internet of Things Journal, vol. 6, no. 2, pp. 2009–2020, 2018. [Google Scholar]
2. H. Luo, H. Cai, H. Yu, Y. Sun, Z. Bi et al., “A Short-term energy prediction system based on edge computing for a smart city,” Future Generation Computer Systems, vol. 101, pp. 444–457, 2019. [Google Scholar]
3. M. Chammas, A. Makhoul and J. Demerjian, “An efficient data model for energy prediction using wireless sensors,” Computers & Electrical Engineering, vol. 76, pp. 249–257, 2019. [Google Scholar]
4. A. Jarwan, A. Sabbah and M. Ibnkahla, “Data transmission reduction schemes in WSNs for efficient IoT systems,” IEEE Journal on Selected Areas in Communications, vol. 37, no. 6, pp. 1307–1324, 2019. [Google Scholar]
5. P. Pawar and M. TarunKumar, “An IoT-based intelligent smart energy management system with accurate forecasting and load strategy for renewable generation,” Measurement, vol. 152, pp. 107187, 2020. [Google Scholar]
6. F. Li, Y. Shi, A. Shinde, J. Ye and W. Song, “Enhanced cyber-physical security in the internet of things through energy auditing,” IEEE Internet of Things Journal, vol. 6, no. 3, pp. 5224–5231, 2019. [Google Scholar]
7. W. Li, T. Logenthiran, V. T. Phan and W. L. Woo, “A novel smart energy theft system (SETS) for IoT-based smart homes,” IEEE Internet of Things Journal, vol. 6, no. 3, pp. 5531–5539, 2019. [Google Scholar]
8. X. J. Luo, L. O. Oyedele, A. O. Ajayi, C. G. Monyei, O. O. Akinade et al., “Development of an IoT-based big data platform for the day-ahead prediction of building heating and cooling demands,” Advanced Engineering Informatics, vol. 41, pp. 100926, 2019. [Google Scholar]
9. F. Terroso-Saenz, A. Gonzalez-Vidal, A. P. Ramallo-Gonzalez and A. F. Skarmeta, “An open IoT platform for the management and analysis of energy data,” Future Generation Computer Systems, vol. 92, pp. 1066–1079, 2019. [Google Scholar]
10. S. Abbas, M. A. Khan, L. E. Falcon-Morales, A. Rehman, Y. Saeed et al., “Modeling, simulation, and optimization of power plant energy sustainability for IoT enabled smart cities empowered with deep extreme learning machines,” IEEE Access, vol. 8, pp. 39982–39997, 2020. [Google Scholar]
11. P. K. Maddikunta, G. Srivastava, T. Reddy Gadekallu, N. Deepa and P. Boopathy, “A predictive model for battery life in IoT networks,” IET Intelligent Transport Systems, vol. 14, no. 11, pp. 1388–1395, 2020. [Google Scholar]
12. L. Jacob Varghese, K. Dhayalini, S. Sira Jacob, I. Ali, A. Abdelmaboud et al., “Optimal load forecasting model for peer-to-peer energy trading in smart grids,” Computers, Materials & Continua, vol. 70, no. 1, pp. 1053–1067, 2022. [Google Scholar]
13. S. Vimal, M. Khari, R. G. Crespo, L. Kalaivani, N. Dey et al., “Energy enhancement using multi objective ant colony optimization with double Q learning algorithm for IoT-based cognitive radio networks,” Computer Communications, vol. 154, pp. 481–490, 2020. [Google Scholar]
14. F. Al-Turjman, C. Altrjman, S. Din and A. Paul, “Energy monitoring in IoT-based ad hoc networks: An overview,” Computers & Electrical Engineering, vol. 76, pp. 133–142, 2019. [Google Scholar]
15. M. Kazmi, H. Raza Khan, Lubada, M. Hashir Bin Khalid and S. Ahmed Qazi, “Threefold optimized forecasting of electricity consumption in higher education institutions,” Computers, Materials & Continua, vol. 73, no. 2, pp. 2351–2370, 2022. [Google Scholar]
16. M. Chu, X. Liao, H. Li and S. Cui, “Power control in energy harvesting multiple access systems with reinforcement learning,” IEEE Internet of Things Journal, vol. 6, no. 5, pp. 9175–9186, 2019. [Google Scholar]
17. N. Bendaoud and N. Farah, “Using deep learning for short-term load forecasting,” Neural Computing and Applications, vol. 32, no. 18, pp. 15029–15041, 2020. [Google Scholar]
18. V. Puri, S. Jha, R. Kumar, I. Priyadarshini, M. Abdel-Basset et al., “A hybrid artificial intelligence and internet of things model for a generation of renewable resources of energy,” IEEE Access, vol. 7, pp. 111181–111191, 2019. [Google Scholar]
19. Z. Y. Algamal, M. K. Qasim, M. H. Lee and H. T. M. Ali, “Improving grasshopper optimisation algorithm for hyperparameters estimation and feature selection in support vector regression,” Chemometrics and Intelligent Laboratory Systems, vol. 208, pp. 104196, 2021. [Google Scholar]
20. N. Ashraf, A. Hasan, H. K. Qureshi and M. Lestas, “Combined data rate and energy management in harvesting enabled tactile IoT sensing devices,” IEEE Transactions on Industrial Informatics, vol. 15, no. 5, pp. 3006–3015, 2019. [Google Scholar]
21. M. M. Rana and W. Xiang, “IoT communications network for wireless power transfer system state estimation and stabilization,” IEEE Internet of Things Journal, vol. 5, no. 5, pp. 4142–4150, 2018. [Google Scholar]
22. M. Nurgaliyev, A. Saymbetov, Y. Yashchyshyn, N. Kuttybay and D. Tukymbekov, “Prediction of energy consumption for LoRa based wireless sensors network,” Wireless Networks, vol. 26, no. 5, pp. 3507–3520, 2020. [Google Scholar]
23. S. Walker, W. Khan, K. Katic, W. Maassen and W. Zeiler, “Accuracy of different machine learning algorithms and added-value of predicting aggregated-level energy performance of commercial buildings,” Energy and Buildings, vol. 209, pp. 109705, 2020. [Google Scholar]
24. X. Wang, X. Mao and H. Khodaei, “A Multi-objective home energy management system based on the internet of things and optimization algorithms,” Journal of Building Engineering, vol. 33, pp. 101603, 2021. [Google Scholar]
25. Y. Wen, Z. Wang, Y. Zhang, J. Liu, B. Cao et al., “Energy and cost-aware scheduling with batch processing for instance-intensive IoT workflows in clouds,” Future Generation Computer Systems, vol. 101, pp. 39–50, 2019. [Google Scholar]
Cite This Article
 Copyright © 2023 The Author(s). Published by Tech Science Press.
This work is licensed under a Creative Commons Attribution 4.0 International License , which permits unrestricted use, distribution, and reproduction in any medium, provided the original work is properly cited.
 Downloads
 Citation Tools