
 Submit a Paper
 Propose a Special lssue
 Open Access
ARTICLE

A Framework of Deep Optimal Features Selection for Apple Leaf Diseases Recognition
1 Department of Computer Science, HITEC University, Taxila, Pakistan
2 Computer Sciences Department, College of Computer and Information Sciences, Princess Nourah bint Abdulrahman University, Riyadh, 11671, Saudi Arabia
3 Department of Electrical Engineering, College of Engineering, Jouf University, Sakakah, Saudi Arabia
4 Department of Management Information Systems, CoBA, Prince Sattam bin Abdulaziz University, Saudi Arabia
5 Department of Computer Science, Hanyang University, Seoul, 04763, Korea
6 Center for Computational Social Science, Hanyang University, Seoul, 04763, Korea
* Corresponding Author: Byoungchol Chang. Email:
Computers, Materials & Continua 2023, 75(1), 697-714. https://doi.org/10.32604/cmc.2023.035183
Received 10 August 2022; Accepted 12 November 2022; Issue published 06 February 2023
 View Full Text
 Download PDF
Abstract
Identifying fruit disease manually is time-consuming, expert-required, and expensive; thus, a computer-based automated system is widely required. Fruit diseases affect not only the quality but also the quantity. As a result, it is possible to detect the disease early on and cure the fruits using computer-based techniques. However, computer-based methods face several challenges, including low contrast, a lack of dataset for training a model, and inappropriate feature extraction for final classification. In this paper, we proposed an automated framework for detecting apple fruit leaf diseases using CNN and a hybrid optimization algorithm. Data augmentation is performed initially to balance the selected apple dataset. After that, two pre-trained deep models are fine-tuning and trained using transfer learning. Then, a fusion technique is proposed named Parallel Correlation Threshold (PCT). The fused feature vector is optimized in the next step using a hybrid optimization algorithm. The selected features are finally classified using machine learning algorithms. Four different experiments have been carried out on the augmented Plant Village dataset and yielded the best accuracy of 99.8%. The accuracy of the proposed framework is also compared to that of several neural nets, and it outperforms them all.Keywords
Agriculture cultivates land and plants to produce crops and fruits [1]. It is a significant source of food for a large population in Pakistan and India [2]. Agriculture employs more than 70% of Pakistan’s total population. It is Pakistan’s most important economic sector, accounting for 19.2% of the GDP and 38.5% of the labor force. According to the Pakistan Bureau of Statistics, agriculture is Pakistan’s largest economic sector, and the majority of the country’s population is directly or indirectly dependent on it [3].
Fruits play an important role in human nutrition as sources of vitamins, minerals, and dietary fibers [4]. Furthermore, fruits and vegetables contain 16% magnesium, 19% iron, and 9 percent calories [5]. The apple is the world’s most popular fruit, containing vitamins, dietary fibers, and antioxidants; however, many apples are unable to reach customers due to diseases caused by bacteria or fungal viruses, resulting in economic losses [6]. Apple scabs, apple rust, and cedar are the most common apple diseases [7]. Fire blight fire-like appearance on infected plant parts, and secretion of golden color bacterial secretion is seen on the stem [8]. Powdery mildew is a serious disease that wreaks havoc on buds, new shoots, and leaves. A white powdery coating on the leaves distinguishes this disease [9,10]. Cedar apple or yellow patches on the leaf undersides are surrounded by a red band, and small black spots in the center are called aecia form [11].
Traditional methods of detecting and identifying fruit diseases rely on skilled naked-eye observation. Because of the remote locations of specialists’ availability, manually identifying fruit disease is a time-consuming and costly in some developing countries. Consultation with them is also time-consuming and costly [12]. Early detection of leaf disease is critical for effective prevention, which improves fruit quality and growth rate [13,14]. The symptoms that appear on the leaves of various fruit plants provide information that can be used to help diagnose disease. Many computer scientists demonstrated various methods for detecting fruit diseases. A simple computerized method includes key steps such as image preprocessing, feature extraction using pattern recognition techniques, feature fusion, and classification [15]. To achieve better results, preprocessing is working on image quality, improving some image features, and removing image distortion [16]. A variety of techniques are used to extract features, including shape-based features, point features, color features, and many others. The process of combining information from multiple descriptors to improve overall system performance is known as feature fusion. However, one limitation of this work is that the testing process’s computational time has increased [17]. Finally, the features are classified using machine learning classifiers like support vector machine, K-Nearest neighbors, neural network, and a few others.
Deep learning is a type of machine learning that shows huge success in the area of computer vision for several tasks such as object classification, medical imaging [18,19], plant diseases classification [20,21], and named a few more [22,23]. Convolutional neural network (CNN) is a deep learning technique that consists of several hidden layers, including convolutional, pooling, ReLu, batch normalization, and fully connected layers. A CNN is a powerful deep learning algorithm that can deal with millions of variables, input 2D images to reduce computational costs, and apply convolutional filters [24]. It can learn the filters while other algorithms use hand-engineering filters with enough training [25]. The convolutional layer is the linear operation in which filters (kernel) are applied to real images [25]. Transfer learning (TL) is a machine learning technique used for transferring knowledge from one deep model to another fine-tuned model [23,26]. The main advantage of this technique is that it allows for quick processing when only limited data is available.
Computer vision researchers used deep learning to introduce several techniques for recognizing fruit leaf diseases. However, due to various factors, they continue to lose classification accuracy. The hot challenges are: i) limited dataset images for training; ii) extraction of redundant and irrelevant features; iii) choice of selected deep model for training; and iv) missing some essential features during the best features selection. This article proposed an automated framework for apple fruit leaf disease recognition using deep learning and multi-stage feature selection. Our significant contributions in this work are: i) proposed a contrast enhancement technique that was later utilized for the data augmentation; ii) Two pre-trained deep models have been updated based on the last layers and trained through deep transfer learning; iii) proposed a fusion approach and developed an improved optimization technique for best feature selection.
The rest of the manuscript is organized in the following order. Related works that contain methodology and results of the presented techniques are discussed in Section 2. Sections 3 and 4 describe the proposed methods and results. Finally, Section 5 concludes the manuscript.
Numerous automated techniques for recognizing fruit leaf diseases have been introduced in the literature. Many of them concentrated on deep learning-based feature extraction, while only a few used traditional features. Bosilj et al. [26] presented a study using a deep learning approach to detect and recognize fruit leaves by transfer learning. They trained the Nasnet model and tested it over the available Plant Village Dataset. They achieved a high level of accuracy of 93.82%. Vallabhajosyula et al. [27] presented a wide taxonomy of the performance of several pre-trained neural networks, as well as the performance of a weighted ensemble of those models that are important to the detection of plant leaf disease. Furthermore, the suggested work’s performance is assessed using a publicly accessible plant village dataset, which has 38 classes collected from 14 crops. The suggested model’s performance evaluation shows that it is effective at identifying various plant diseases and outperforms pre-trained models. Bharati Devi et al. [28] trained their model on ten different classes of tomato plant leaf images that represent various tomato plant illnesses. They used various types of data augmentation approaches to expand the quantity of the training data. Their suggested model outperforms the current models for detecting tomato leaf disease, with 92.3% accuracy on the dataset. Bimorogo et al. [29] used a Plant Village dataset with 38 different classes. MobileNet V2, NasNet Mobile, DenseNet 121 layer, and InceptionV3 are the models that have been tested and compared. NasNet Mobile had a performance of 97.3%, MobileNet V2 had a performance of 96.55%, and DenseNet 121 had a performance of 96.21%. They concluded that NasNet Mobile is the CNN model that is best for mobile devices. Bansal et al. [30] suggested a model which is a combination of pre-trained DenseNet121, EfficientNetB7, and EfficientNet NoisyStudent models that use photos to classify apple tree leaves into one of four categories: healthy, apple scab, apple cedar rust, and numerous illnesses. The study uses a variety of Image Augmentation approaches to improve the dataset size and, as a result, the model’s accuracy. Their suggested model achieves an accuracy of 96.25% on the validation dataset. With a 90% accuracy rate, the suggested model can detect leaves with different illnesses. Their suggested model performed well on several measures and can be used in the agricultural area to reliably and quickly determine plant health. Kim [31] propose superpixel-based disease classification as an alternative to traditional approaches that rely on either region segmentation or end-to-end learning of a full image by a neural network. They used Convolutional Neural Network for classification purpose. They used plant village dataset and achieved accuracy of 92.43 and Fi-score of 0.93 compared to 98.28 and 0. 98. Lu et al. [32] examined the most recent CNN networks for plant leaf disease classification. They reviewed the DL principles involved in the classification of plant diseases. They have compiled a list of the major issues with CNN and their plant disease detection solutions. They also talked about the future of plant disease classification. Sun et al. [33] suggested a lightweight CNN model for real-time detection of apple leaf diseases on mobile devices. Then, by recreating the common
The proposed automated framework for apple fruit leaf disease recognition is illustrated in Fig. 1. In this figure, it is described that initially original images are acquired and performed contrast enhancement. Two pre-trained models are opted for in the next step and fine-tuned based on the feature layers. Transfer learning is applied in the later step, and two models are utilized for feature extraction. Features of both models are fused using the proposed Parallel Priority (PP), and select the best features in the later step using an improved artificial butterfly optimization algorithm. Finally, the selected features are classified using machine learning classifiers for final classification results. A brief description of each step is given below.
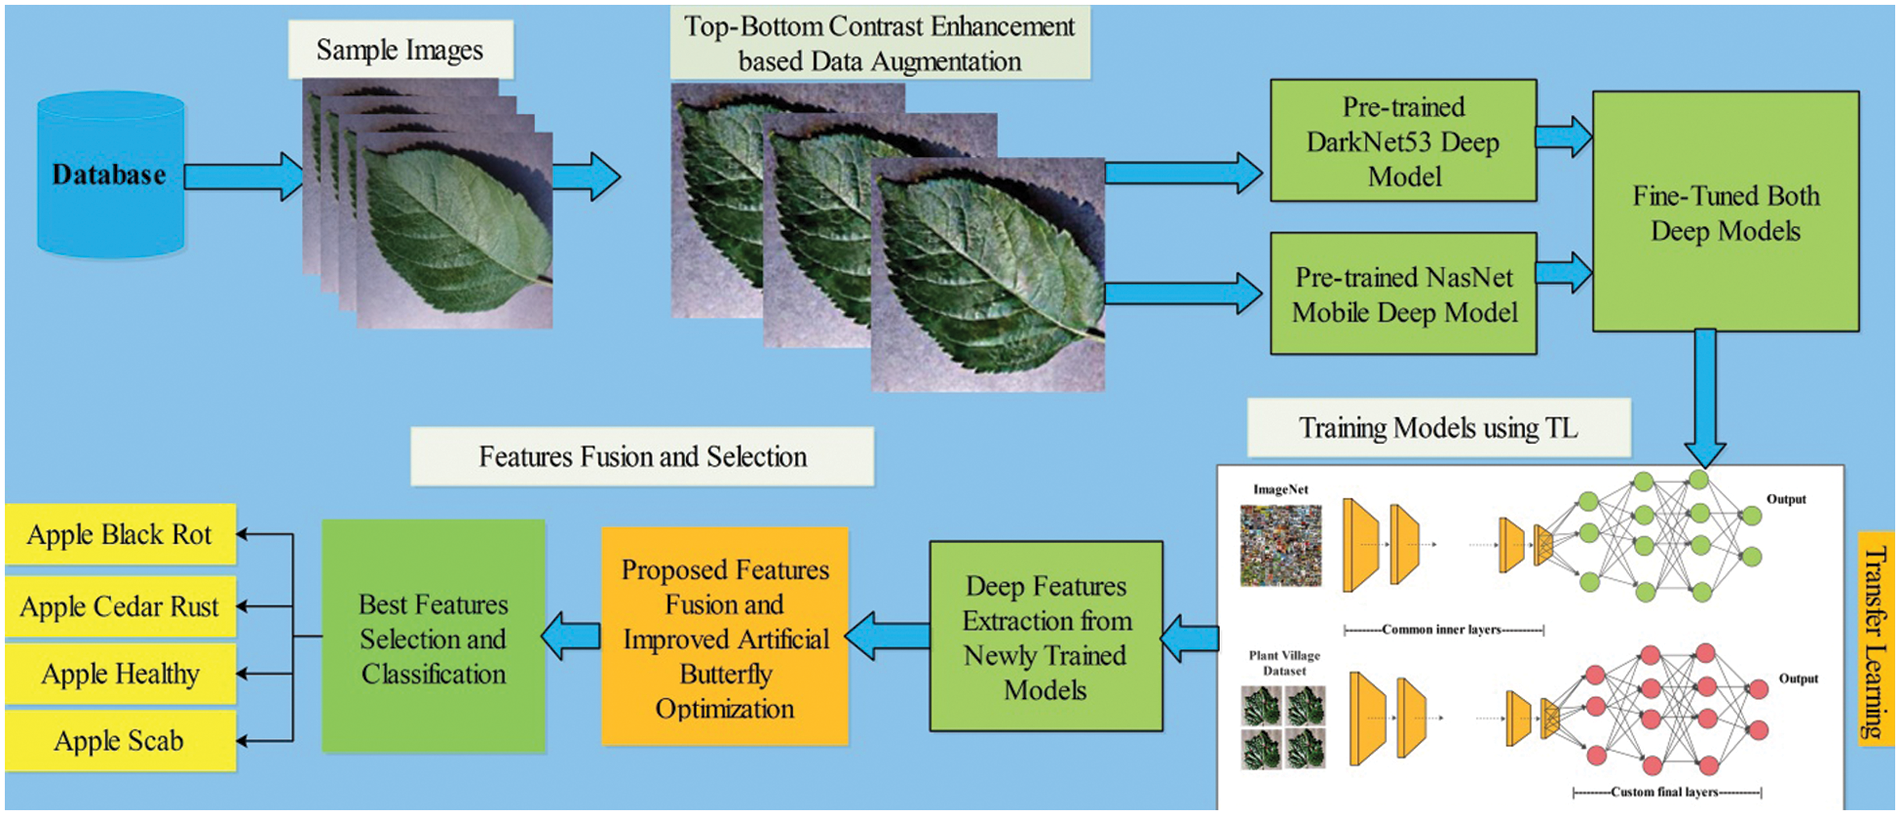
Figure 1: Proposed framework of apple leaf disease recognition
In this work, the Plant Village dataset [37] is utilized for the experimental process. This dataset contains a variety of leaf diseases from various crops and fruits. In this article, we will look at apple leaf images. Apple scab, apple cedar rust, apple black rot, and apple healthy are the four apple classes (as illustrated in Fig. 2). The total number of images is 3171, all in RGB format. There are 630 images of apple scab, 621 images of apple black rot, 275 images of apple cedar rust, and 1645 images of healthy class.
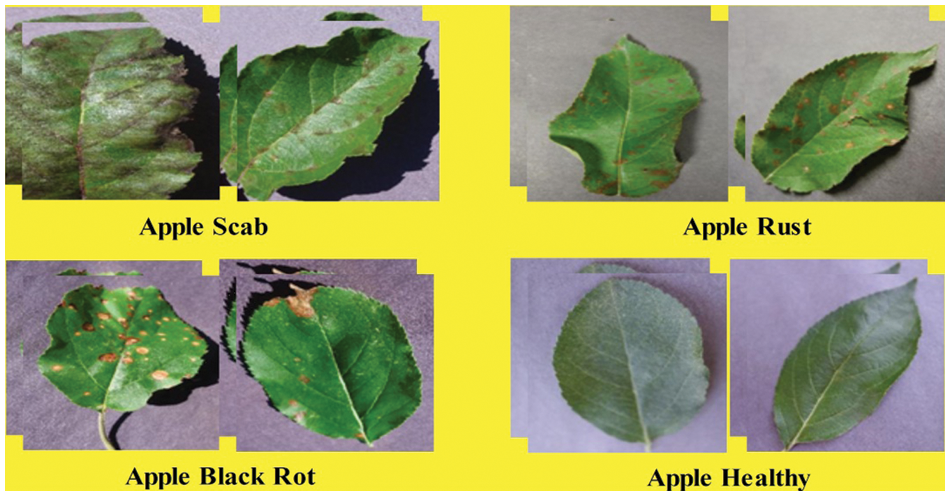
Figure 2: Sample images of selected apple leaf disease classes (collected from plant village dataset)
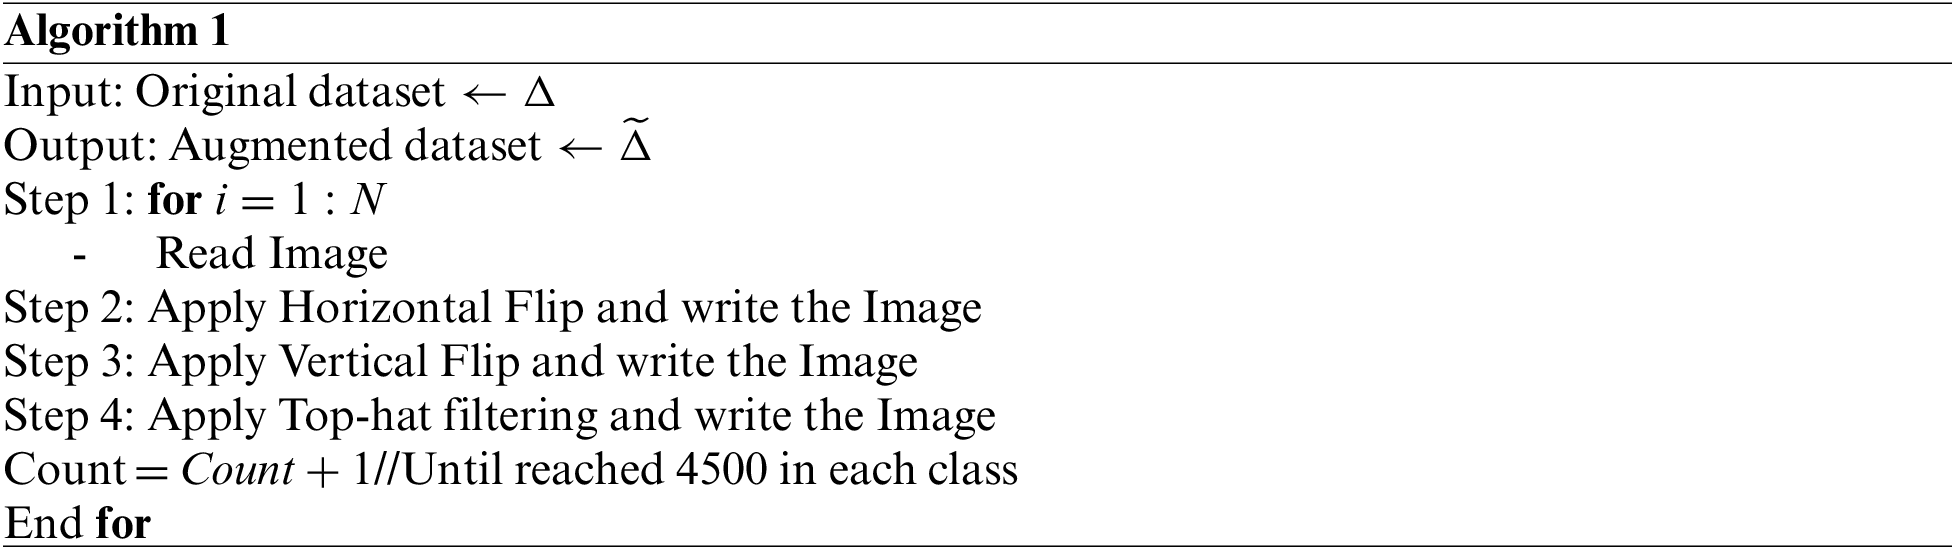
Data Augmentation is a technique for increasing the size of a dataset and modifying data from existing data. In this work, we used data augmentation to increase the number of images of the selected apple classes. Our target number of images is 4500 for each class after the augmentation process. We applied three different operations to increase the images: i) horizontal flip, ii) vertical flip, and iii) top-hat operation-based contrast enhancement of original images. In the healthy class augmentation process, horizontal and vertical flip operations are performed and stop the process when images are reached 4500. The algorithm of data augmentation is given below.
3.3 Convolutional Neural Networks
Convolutional Neural Network (CNN) is a type of artificial neural network inspired by the visual cortex of humans. Mainly, CNN has several layers, such as an input layer, convolution layer, pooling layer, ReLu layer, fully connected layer, and output layer [38]. The structure of a convolutional neural network is shown in Fig. 3.
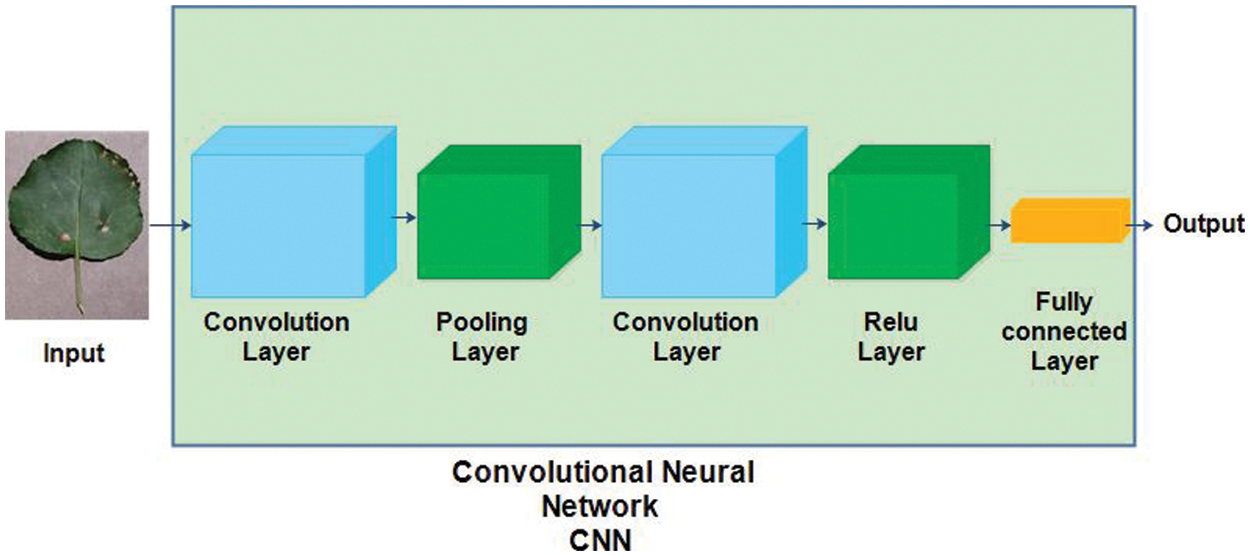
Figure 3: Convolutional neural network
A CNN normally accepts an image of the three dimensional such as
where
In this work, we utilized transfer learning (TL) for training pre-trained deep models on selected apple datasets for classification purposes (apple diseases). TL [40] is useful when the training data of target domain is smaller than the source domain. Mathematically, the TL is defined as follows: A domain D which is consists of X and
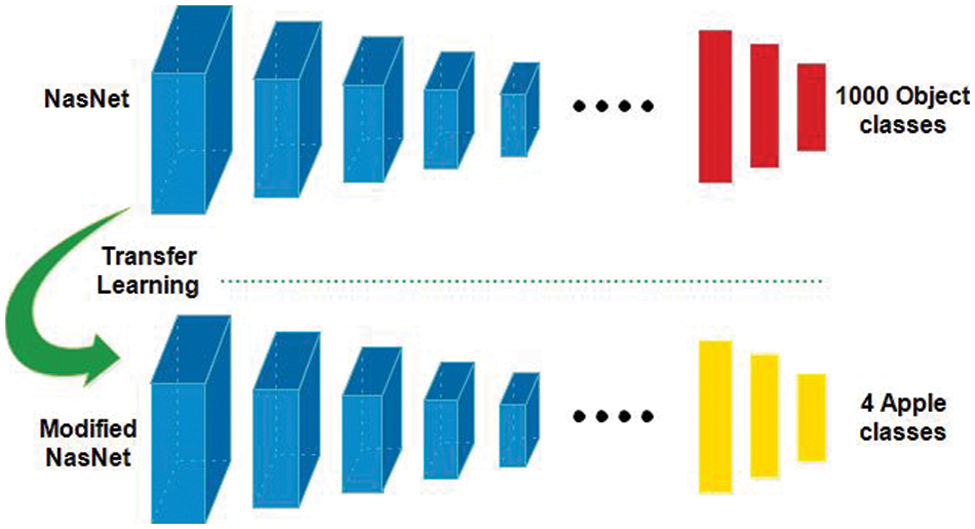
Figure 4: Transfer learning-based training of pre-trained models for apple leaf diseases classification
In this work, we utilized two pre-trained models named Nasnet Mobile [43] and Darknet-53 [44] for deep feature extraction. Google’s brain team developed the Neural Architecture Search Network (Nasnet), which has two key functions, normal cell, and reduction cell. Nasnet first performs its operations on a small dataset and then transfers its block to a larger dataset to get a greater mean average precision (mAP) [45]. The network learned a powerful feature to detect images and the input image sizeis
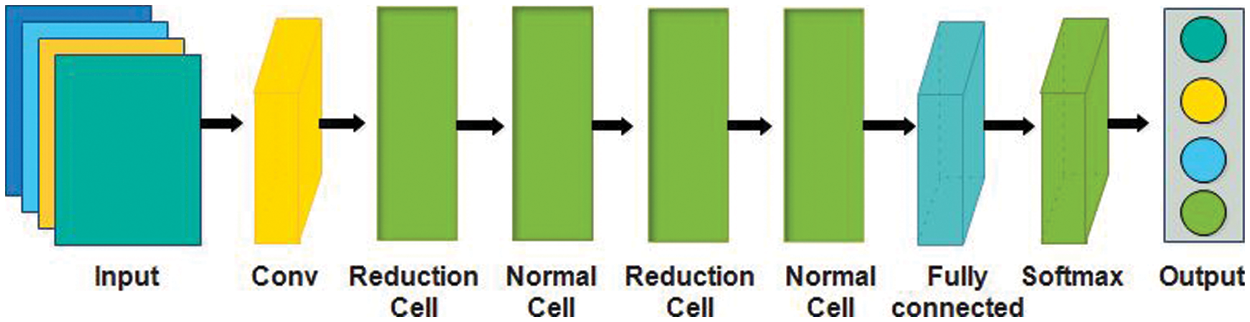
Figure 5: NasNet mobile architecture
Darknet-53 is a 53-layered convolutional neural network. In this model, the feature extractor is mainly composed of a series of convolutional layers at the dimension of
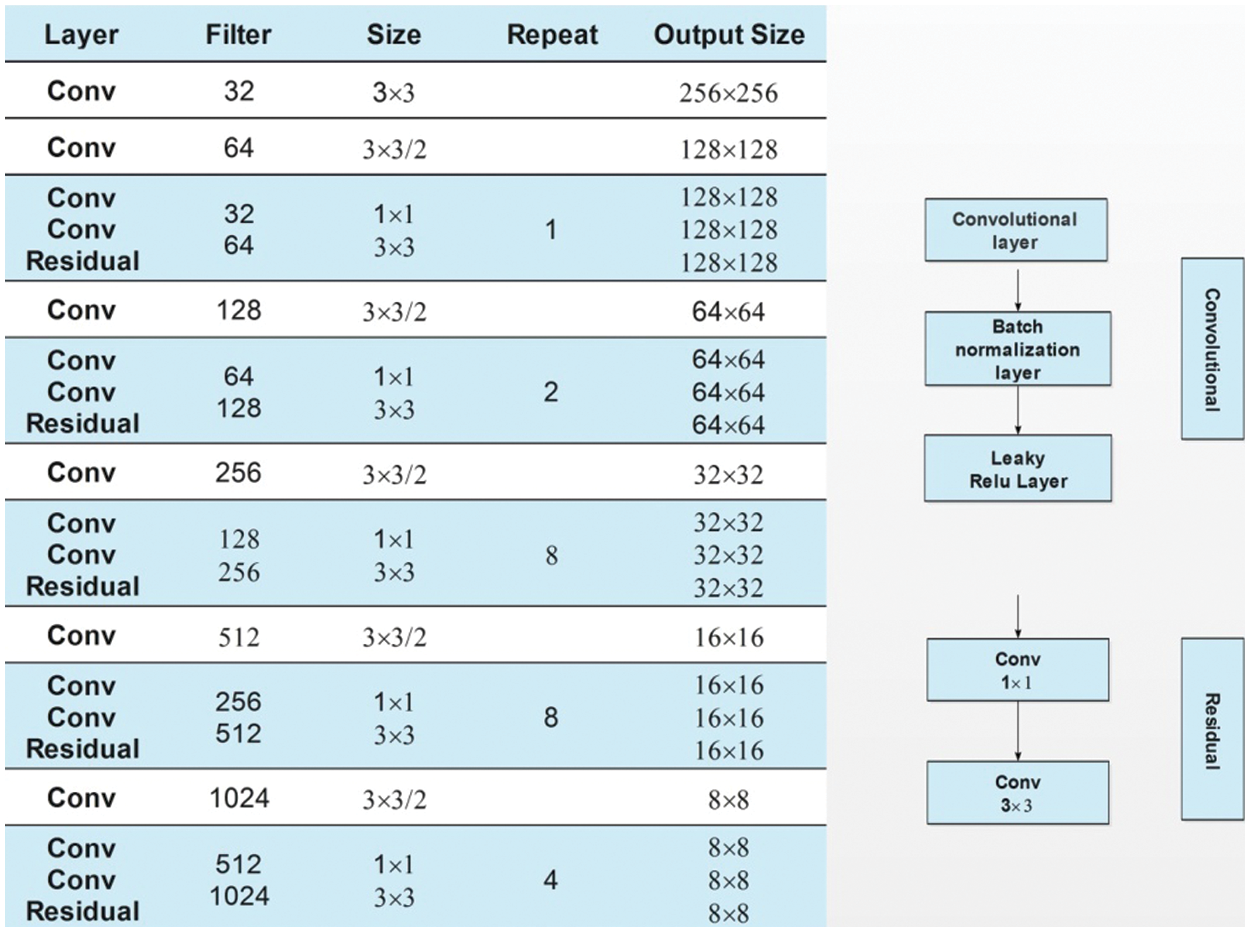
Figure 6: Fine-tuned darknet53 architecture for apple leaf diseases classification
We utilized the transfer learning process for deep learning feature extraction and trained both fine-tuned models. For the NasNet Mobile, a fully connected layer is removed, and added a new layer. After that, TL-based training is performed, and extract features from the global average pooling layer and obtained a feature vector of dimensional
3.6 Proposed Parallel Features Fusion
In this work, we proposed a parallel features fusion approach named Parallel Priority (PP). The main motivation behind using parallel fusion is to reduce the feature vector with more important features. This approach is based on three important steps. In the first step, make the equal size of both vectors based on the entropy value padding. Then, the entropy value is computed from a large-size feature vector and utilized for padding of a smaller feature vector. Mathematically, the entropy of large size feature vector is calculated as follows:
Here
where,
where the function
where,
3.7 Improved Artificial Butterfly Optimization
In this article, we proposed an improved butterfly optimization algorithm (BOA) to select the best features. Originally, the BOA [48] is divided into three phases: the initialization phase, the searching phase, and the concluding phase. At first, the initialization of the butterfly swarm has been processed followed by the initialization of the cost function [49]. Artificial butterflies in the search space move to new positions after the iteration begins, and their cost values are attained. After that, butterflies produce the following fragrance at their respective locations.
From this equation
where in the search space,
In the above equations of logistic mapping, i is the iteration number of every parameter of vectors and
where
where D denotes the distance formulation and K represents the total features
The experimental process of the proposed framework is conducted on augmented Plant Village Apple leaf images. Several classifiers have been utilized and select the best classifier based on maximum accuracy. A 60:40 approach has opted for the training and testing of the proposed framework performance. All the results are computed using 10-Fold cross-validation. Seven performance measures have been implemented: sensitivity rate, precision rate, F1-Score, accuracy, false positive rate (FPR), area under the curve (AUC), and testing time of the classification process. The framework is implemented on MATLAB 2021b using a Personal Computer Corei7 with 16GB of Ram and an 8GB graphic processing unit.
The proposed framework results are presented in this section. Several experiments are conducted such as i) experiment 1 computes results using Nasnet Mobile deep features; ii) experiment 2 computes the results of Darknet-53 deep features; iii) experiment 3 is computed the results of the proposed fusion approach, and iv) experiment 4 computed the results of the proposed feature selection approach. The results are computed using several classifiers, and the best classifier sensitivity rate is also verified through a confusion matrix.
Experiment No 1: Deep NasNet Mobile features are retrieved and performed classification in this experiment. The classification findings from this experiment are shown in Table 1. The best accuracy in this table is 95.7% for the Cubic SVM classifier, and the computing time was 39.638 s. This classifier has a sensitivity rate of 95.9%, which is higher than the rest of the classifiers included in this table. The Cubic SVM’s confusion matrix, shown in Fig. 7, illustrates the accuracy of each apple class’s predictions. According to this statistic, the apple healthy class has a higher error rate of 5.4%.
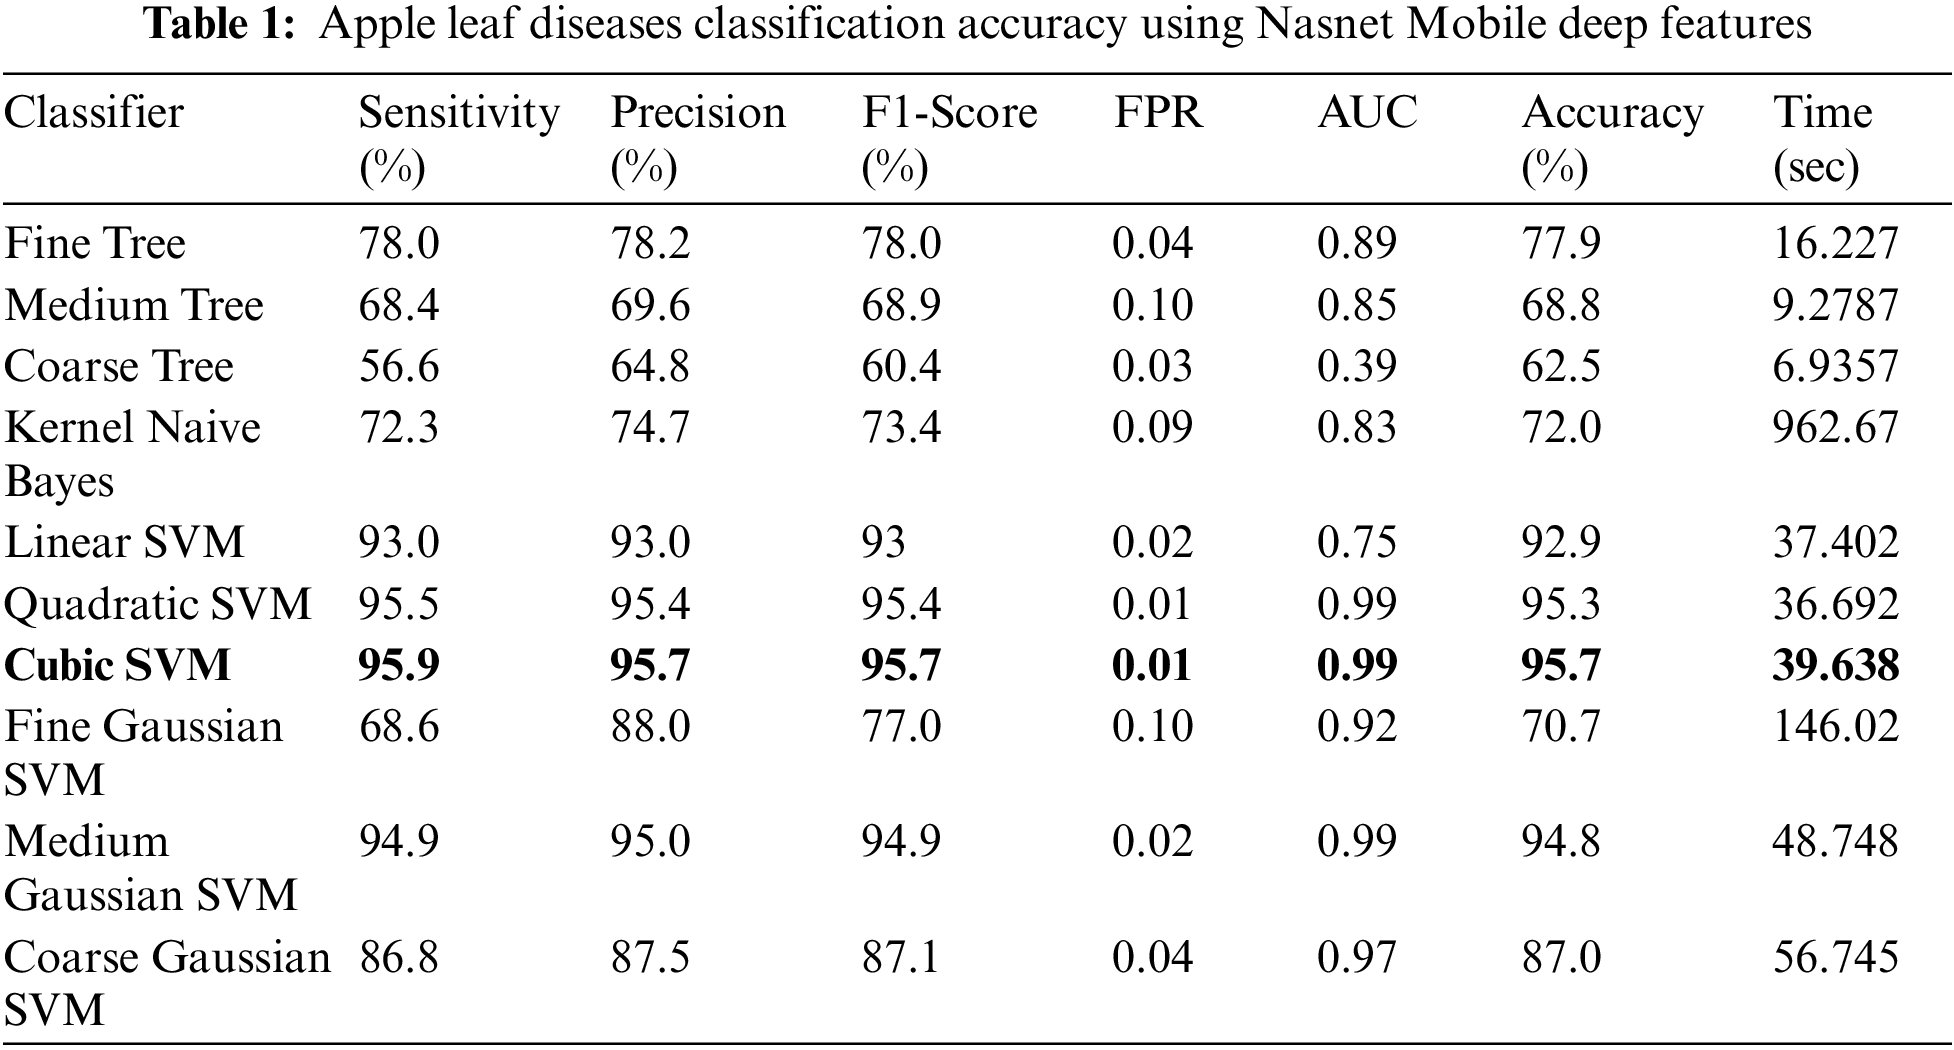
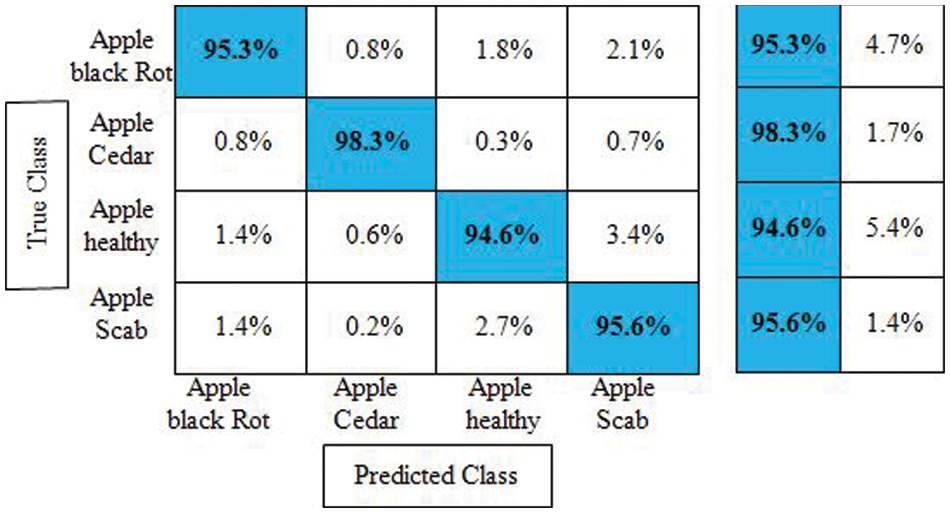
Figure 7: Confusion matrix of cubic SVM for experiment no 1
Experiment No 2: In this experiment, DarkNet-53 deep features are extracted, and performed apple leaf disease classification. Table 2 presents the classification results of this experiment. In this table, the best obtained accuracy is 100.0% for the Cubic SVM classifier whereas the computational time is 53.909 (S). The sensitivity rate of this classifier is also 100.0%, which is better than the rest of the classifiers listed in this table. Fig. 8 illustrates the Cubic SVM confusion matrix that confirms each apple class’s correct prediction accuracy. Compared with Table 1, it is noted that the accuracy rate of experiment 2 is better than experiment 1, but the time of the first experiment is almost half for all listed classifiers.


Figure 8: Confusion matrix of cubic SVM for experiment no 2
Experiment 3: Deep extracted features are fused in this experiment using the proposed features fusion approach. The dimension of the fused feature vector is
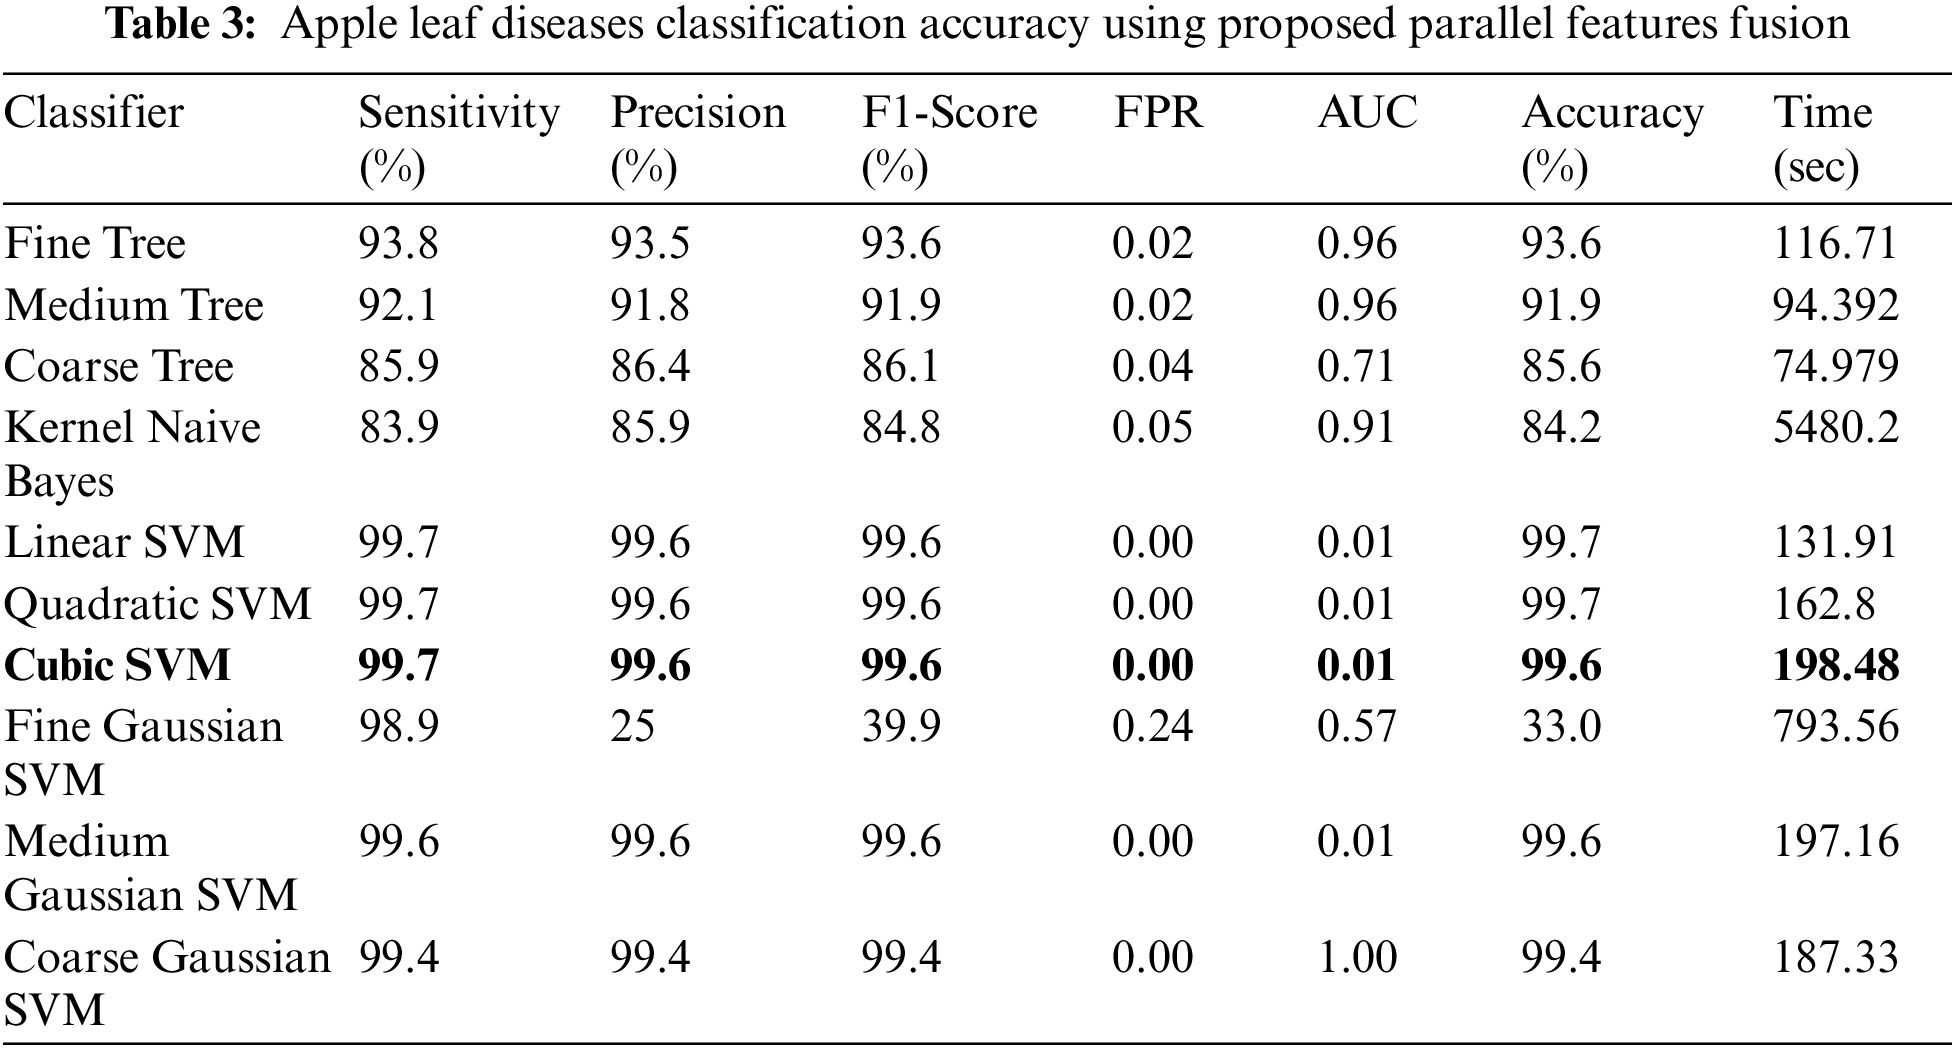

Figure 9: Confusion matrix of cubic SVM for experiment no 3
Experiment 4: The proposed improved optimization algorithm is applied to fused feature vector and obtains maximum accuracy of 99.7%, as given in Table 4. The sensitivity rate of Cubic SVM is 99.8%, whereas the precision and F1-Score values are 99.7%. The computational time of Cubic SVM is 32.972 s. Compared with the first three experiments, the time is significantly reduced and accuracy is also improved. Moreover, the sensitivity rate of Cubic SVM is also verified by a confusion matrix, illustrated in Fig. 10. Overall, the proposed features fusion technique and improved optimization algorithm give better accuracy.
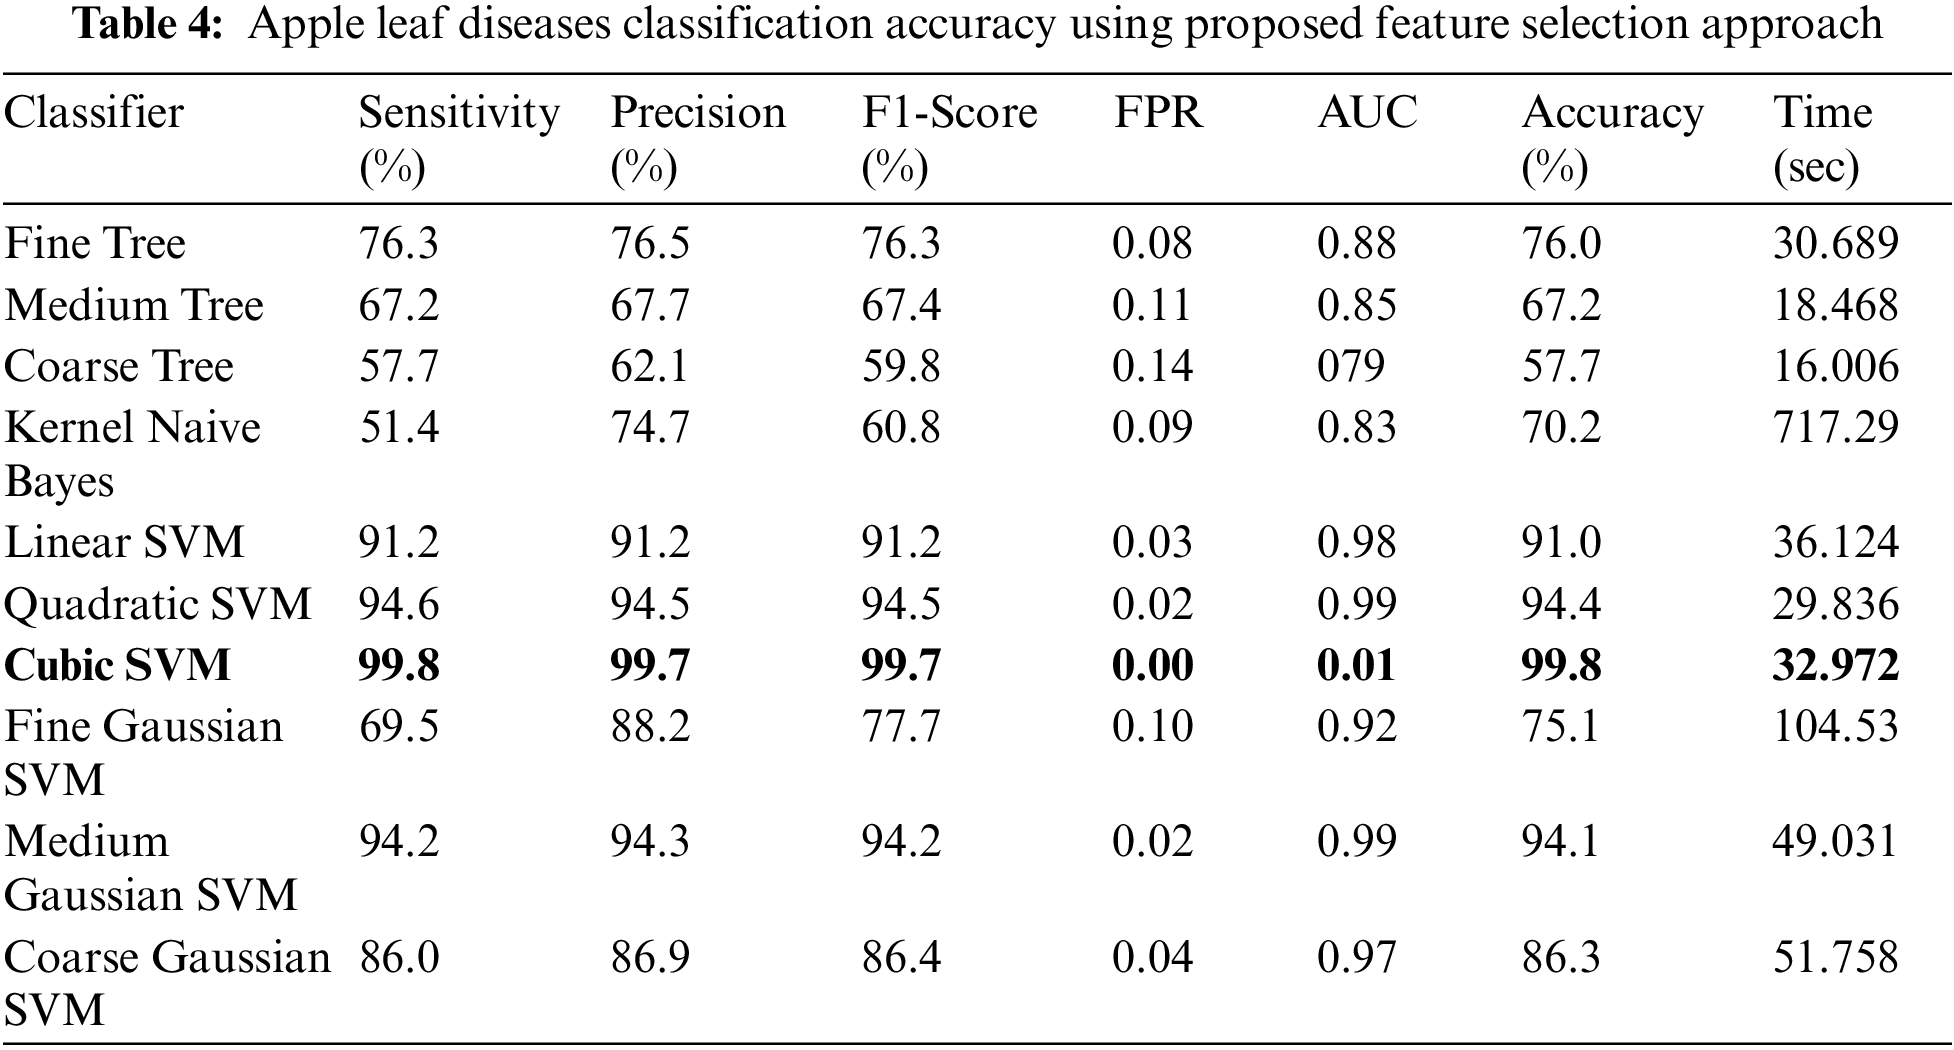
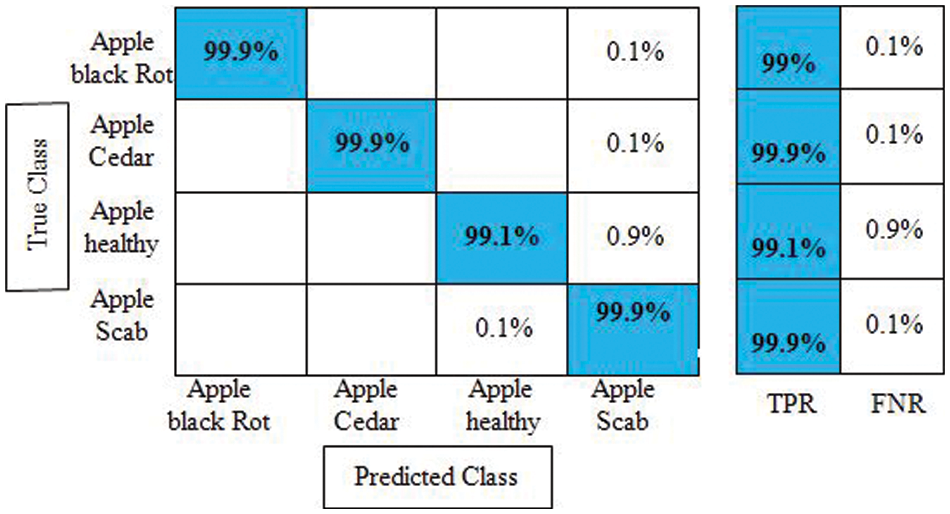
Figure 10: Confusion matrix of cubic SVM for experiment no 4
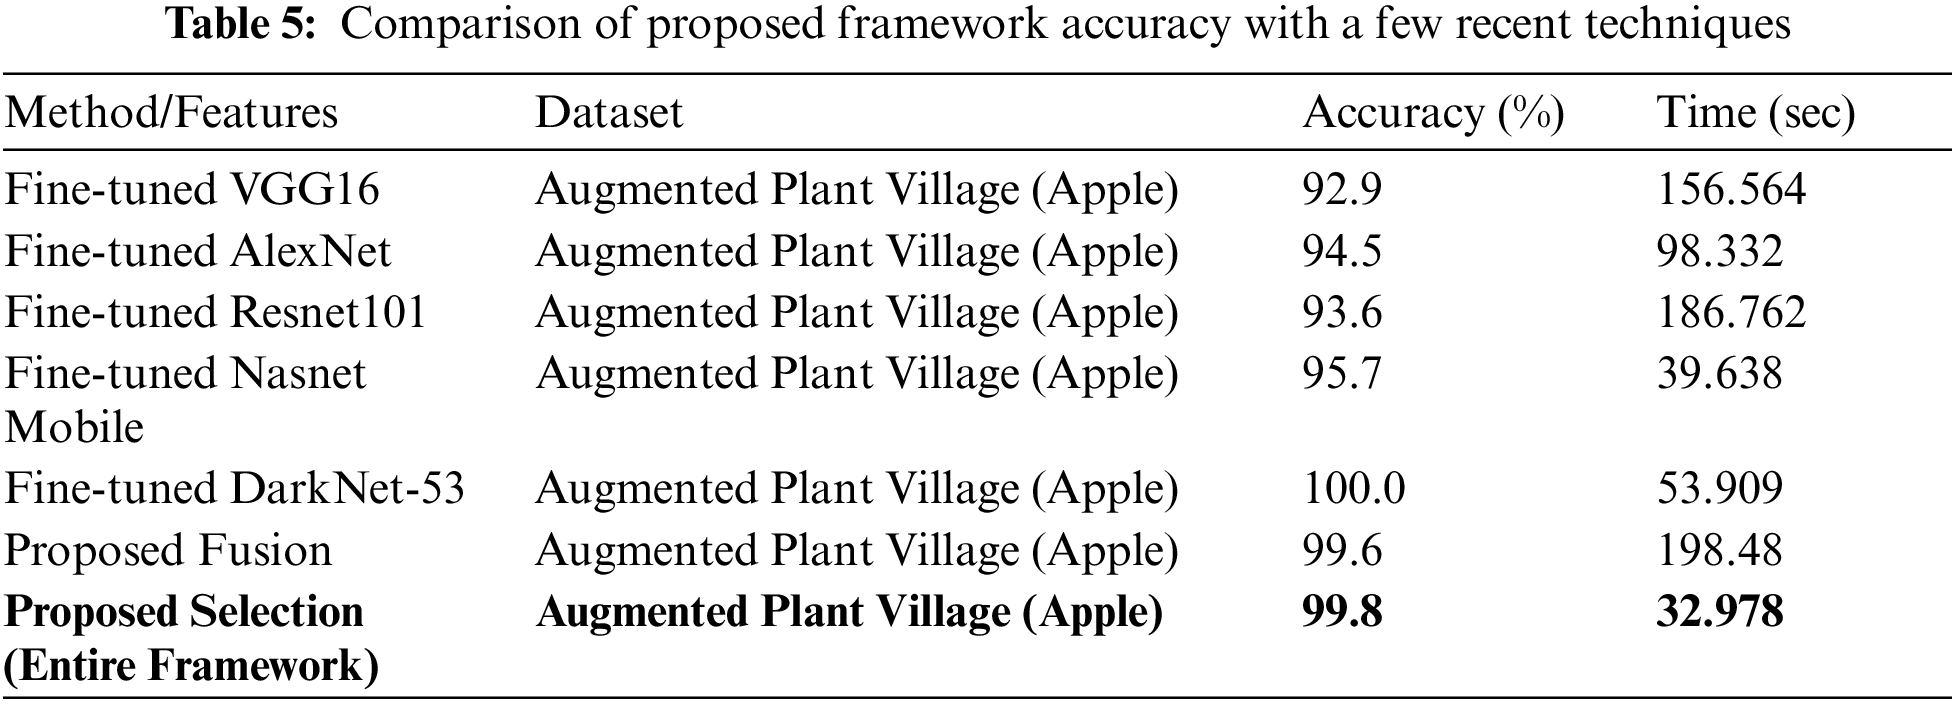
A comprehensive comparison is also conducted of the proposed method with other deep models, as given in Table 5. In this table, accuracy and classification time during the testing process are noted. For example, the accuracy of fine-tuned Darknet-53 is maximum but the time is 53.909 s. On the other side, the accuracy of the proposed fusion approach is 99.6% but the time is 198.48 s which is higher than the previous methods (as mentioned in this table). The proposed framework obtained an overall accuracy of 99.8% whereas the time is 32.978 s. The noted time is almost half than the above-mentioned features which shows the significance of the proposed approach.
In this article, we proposed an automated framework based on feature fusion and an improved optimization algorithm. Data augmentation is used to increase the number of training samples. Transfer learning was used to fine-tune and train two pre-trained models, Darknet-53 and NasNet Mobile. A parallel priority approach was proposed for the fusion of deep features of both models. Furthermore, an improved optimization algorithm is proposed, which selects the best features for final classification. Overall, we concluded that the proposed fusion method improves classification accuracy while increasing computational time. As a result, the enhanced selection algorithm reduces classification time while maintaining accuracy. A CNN-based network will be proposed in the future, and the hyperparameters will be optimized using Bayesian optimization. Furthermore, more optimal feature selection techniques will be used [52,53] and employed some active learning methods [54].
Funding Statement: This work was supported by “Human Resources Program in Energy Technology” of the Korea Institute of Energy Technology Evaluation and Planning (KETEP), granted financial resources from the Ministry of Trade, Industry & Energy, Republic of Korea. (No. 20204010600090).
Conflicts of Interest: The authors declare that they have no conflicts of interest to report regarding the present study.
References
1. A. Alqahtani, A. Khan, S. Alsubai, A. Binbusayyis and M. M. I. Ch, “Cucumber leaf diseases recognition using multi level deep entropy-ELM feature selection,” Applied Sciences, vol. 12, no. 4, pp. 59–77, 2022. [Google Scholar]
2. M. D. Toor, M. Adnan, F. Rehman, R. Tahir and M. S. Saeed, “Nutrients and their importance in agriculture crop production; A review,” Inderscience Journal of Pure Applied Bioscience, vol. 9, no. 2, pp. 1–6, 2021. [Google Scholar]
3. T. Akram, M. Sharif and T. Saba, “Fruits diseases classification: Exploiting a hierarchical framework for deep features fusion and selection,” Multimedia Tools and Applications, vol. 79, no. 31, pp. 25763–25783, 2020. [Google Scholar]
4. U. Yasmeen, U. Tariq, J. A. Khan, M. A. E. Yar and C. A. Hanif, “Citrus diseases recognition using deep improved genetic algorithm,” Computers, Material, and Continua, vol. 68, no. 1, pp. 1–15, 2021. [Google Scholar]
5. A. Kader, “Importance of fruits, nuts, and vegetables in human nutrition and health,” Perishables Handling Quarterly, vol. 106, no. 38, pp. 1–6, 2001. [Google Scholar]
6. N. Ortega-Sánchez, E. Rodríguez-Esparza, D. Oliva, M. Pérez-Cisneros and A. W. Mohamed, “Identification of apple diseases in digital images by using the gaining-sharing knowledge-based algorithm for multilevel thresholding,” Soft Computing, vol. 21, no. 5, pp. 1–37, 2021. [Google Scholar]
7. L. Li, S. Zhang and B. Wang, “Apple leaf disease identification with a small and imbalanced dataset based on lightweight convolutional networks,” Sensors, vol. 22, no. 11, pp. 150–173, 2022. [Google Scholar]
8. N. Amirchakhmaghi, H. Yousefzadeh, B. Hosseinpour and H. Abdollahi, “Evaluating responses of caucasian apple (malus orientalis) from hyrcanian forests to fire blight (erwinia amylovora) using an in vitro assay,” Journal of Crop Improvement, vol. 25, no. 6, pp. 1–12, 2022. [Google Scholar]
9. A. Acosta, A. Ochoa, E. Rodriguez-Eparza and D. Oliva, “Classification system to detect diseases in apples by using a convolutional neural network,” Technological and Industrial Applications Associated with Industry 4.0, vol. 4, no. 6, pp. 331–340, 2022. [Google Scholar]
10. W. Guo, W. Chen, N. Guo, J. Zang and L. Liu, “MdWRKY61 positively regulates resistance to colletotrichum siamense in apple (malus domestica),” Physiological and Molecular Plant Pathology, vol. 117, no. 26, pp. 10–17, 2022. [Google Scholar]
11. P. D. Kalwad, S. G. Kanakaraddi, T. Preeti and S. Ichalakaranji, “Apple leaf disease detection and analysis using deep learning technique,” Information and Communication Technology for Competitive Strategies, vol. 5, no. 2, pp. 803–814, 2022. [Google Scholar]
12. S. K. Maria, S. S. Taki, M. Mia, A. A. Biswas and A. Majumder, “Cauliflower disease recognition using machine learning and transfer learning,” Smart Systems, vol. 16, no. 5, pp. 359–375, 2022. [Google Scholar]
13. F. A. Shah, M. Sharif, U. Tariq, A. Khan and S. Kadry, “A cascaded design of best features selection for fruit diseases recognition,” Computers, Material and Continua, vol. 70, no. 1, pp. 1491–1507, 2022. [Google Scholar]
14. M. Z. U. Rehman, F. Ahmed, U. Tariq, S. S. Jamal and J. Ahmad, “Classification of citrus plant diseases using deep transfer learning,” Computers, Materials & Continua, vol. 70, no. 2, pp. 1401–1417, 2022. [Google Scholar]
15. S. Dananjayan, Y. Tang, J. Zhuang, C. Hou and S. Luo, “Assessment of state-of-the-art deep learning based citrus disease detection techniques using annotated optical leaf images,” Computers and Electronics in Agriculture, vol. 193, no. 4, pp. 10–21, 2022. [Google Scholar]
16. E. Khan, M. Z. U. Rehman, F. Ahmed and M. A. Khan, “Classification of diseases in citrus fruits using squeezeNet,” in 2021 Int. Conf. on Applied and Engineering Mathematics (ICAEM), Taxila, Pakistan, pp. 67–72, 2022. [Google Scholar]
17. N. Hussain, U. Tariq, S. Kadry, M. A. E. Yar and A. M. Mostafa, “Multiclass cucumber leaf diseases recognition using best feature selection,” Computers, Materials and Continua, vol. 70, no. 2, pp. 3281–3294, 2022. [Google Scholar]
18. K. Muhammad, S. H. Wang, S. Alsubai, A. Binbusayyis and A. Alqahtani, “Gastrointestinal diseases recognition: A framework of deep neural network and improved moth-crow optimization with DCCA fusion,” Human-Centric Computing and Information Sciences, vol. 12, no. 5, pp. 1–16, 2022. [Google Scholar]
19. M. Nawaz, T. Nazir, M. Masood, F. Ali and U. Tariq, “Melanoma segmentation: A framework of improved DenseNet77 and UNET convolutional neural network,” International Journal of Imaging Systems and Technology, vol. 3, no. 2, pp. 1–123, 2022. [Google Scholar]
20. M. R. Latif, M. Y. Javed, H. Masood, U. Tariq and Y. Nam, “Cotton leaf diseases recognition using deep learning and genetic algorithm,” Computers, Material and Continua, vol. 69, no. 3, pp. 1–16, 2021. [Google Scholar]
21. T. Akram, M. Sharif, M. Alhaisoni, T. Saba and N. Nawaz, “A probabilistic segmentation and entropy-rank correlation-based feature selection approach for the recognition of fruit diseases,” EURASIP Journal on Image and Video Processing, vol. 21, no. 6, pp. 1–28, 2021. [Google Scholar]
22. U. Tariq, N. Hussain, Y. Nam and S. Kadry, “An integrated deep learning framework for fruits diseases classification,” Computers, Material and Continua, vol. 69, no. 1, pp. 31–45, 2022. [Google Scholar]
23. Z. U. Rehman, F. Ahmed, R. Damaševičius and S. R. Naqvi, “Recognizing apple leaf diseases using a novel parallel real-time processing framework based on MASK RCNN and transfer learning: An application for smart agriculture,” IET Image Processing, vol. 15, no. 2, pp. 2157–2168, 2021. [Google Scholar]
24. R. Chauhan, K. K. Ghanshala and R. Joshi, “Convolutional neural network (CNN) for image detection and recognition,” in 2018 First Int. Conf. on Secure Cyber Computing and Communication (ICSCCC), New Delhi, India, pp. 278–282, 2018. [Google Scholar]
25. S. Naik and P. Desai, “Mango (mangifera indica) classification using convolutional neural network and linear classifiers,” in Proc. of Third Int. Conf. on Sustainable Computing, Mumbai, India, pp. 163–172, 2022. [Google Scholar]
26. P. Bosilj, E. Aptoula, T. Duckett and G. Cielniak, “Transfer learning between crop types for semantic segmentation of crops versus weeds in precision agriculture,” Journal of Field Robotics, vol. 37, no. 4, pp. 7–19, 2020. [Google Scholar]
27. S. Vallabhajosyula, V. Sistla and V. K. K. Kolli, “Transfer learning-based deep ensemble neural network for plant leaf disease detection,” Journal of Plant Diseases and Protection, vol. 44, no. 6, pp. 1–14, 2021. [Google Scholar]
28. M. Bharati Devi and K. Amarendra, “A convolutional neural network architecture for tomato leaf disease detection using data augmentation,” Smart Computing Techniques and Applications, vol. 21, no. 5, pp. 507–516, 2021. [Google Scholar]
29. S. D. Bimorogo and G. P. Kusuma, “A comparative study of pretrained convolutional neural network model to identify plant diseases on android mobile device,” International Journal, vol. 9, no. 7, pp. 1–20, 2020. [Google Scholar]
30. P. Bansal, R. Kumar and S. Kumar, “Disease detection in apple leaves using deep convolutional neural network,” Agriculture, vol. 11, no. 6, pp. 61–77, 2021. [Google Scholar]
31. M. Kim, “Apple leaf disease classification using superpixel and CNN,” Advances in Computer Vision and Computational Biology, vol. 5, no. 2, pp. 99–106, 2021. [Google Scholar]
32. J. Lu, L. Tan and H. Jiang, “Review on convolutional neural network (CNN) applied to plant leaf disease classification,” Agriculture, vol. 11, no. 14, pp. 70–87, 2021. [Google Scholar]
33. H. Sun, H. Xu, B. Liu, D. He and J. He, “MEAN-SSD: A novel real-time detector for apple leaf diseases using improved light-weight convolutional neural networks,” Computers and Electronics in Agriculture, vol. 189, no. 14, pp. 63–79, 2021. [Google Scholar]
34. S. Kumar, “Plant disease detection using CNN,” Turkish Journal of Computer and Mathematics Education, vol. 12, no. 2, pp. 2106–2112, 2021. [Google Scholar]
35. D. Wang, J. Wang, W. Li and P. Guan, “T-CNN: Trilinear convolutional neural networks model for visual detection of plant diseases,” Computers and Electronics in Agriculture, vol. 190, no. 16, pp. 64–78, 2021. [Google Scholar]
36. S. Pawar, V. Ugale, H. Patil and K. Sujgure, “Review on: Plant leaf disease detection using image processing,” Sensors, vol. 5, no. 6, pp. 1–21, 2021. [Google Scholar]
37. S. P. Mohanty, D. P. Hughes and M. Salathé, “Using deep learning for image-based plant disease detection,” Frontiers in Plant Science, vol. 7, no. 8, pp. 14–29, 2016. [Google Scholar]
38. S. Albawi, T. A. Mohammed and S. Al-Zawi, “Understanding of a convolutional neural network,” in 2017 Int. Conf. on Engineering and Technology (ICET), Mumbai, India, pp. 1–6, 2017. [Google Scholar]
39. H. Nakahara, T. Fujii and S. Sato, “A fully connected layer elimination for a binarizec convolutional neural network on an FPGA,” in 2017 27th Int. Conf. on Field Programmable Logic and Applications (FPL), NY, USA, pp. 1–4, 2017. [Google Scholar]
40. K. Weiss, T. M. Khoshgoftaar and D. Wang, “A survey of transfer learning,” Journal of Big Data, vol. 3, no. 6, pp. 1–40, 2016. [Google Scholar]
41. G. Pinto, Z. Wang, A. Roy and A. Capozzoli, “Transfer learning for smart buildings: A critical review of algorithms, applications, and future perspectives,” Advances in Applied Energy, vol. 6, no. 2, pp. 10–34, 2022. [Google Scholar]
42. T. M. Ghazal, S. Abbas, S. Munir and M. Khan, “Alzheimer disease detection empowered with transfer learning,” Applied Sciences, vol. 4, no. 6, pp. 1–21, 2022. [Google Scholar]
43. F. Saxen, P. Werner, S. Handrich and E. Othman, “Face attribute detection with mobilenetv2 and nasnet-mobile,” in 2019 11th Int. Symp. on Image and Signal Processing and Analysis (ISPA), NY, USA, pp. 176–180, 2019. [Google Scholar]
44. J. Redmon and A. Farhadi, “Yolov3: An incremental improvement,” ArXiv, vol. 11, no. 5, pp. 1–8, 2018. [Google Scholar]
45. P. Vasavi, A. Punitha and T. V. Narayana Rao, “Crop leaf disease detection and classification using machine learning and deep learning algorithms by visual symptoms: A review,” International Journal of Electrical & Computer Engineering, vol. 12, no. 4, pp. 1–14, 2022. [Google Scholar]
46. A. M. Roy, R. Bose and J. Bhaduri, “A fast accurate fine-grain object detection model based on YOLOv4 deep neural network,” Neural Computing and Applications, vol. 21, no. 6, pp. 1–27, 2022. [Google Scholar]
47. Y. Zhang, J. Yu, Y. Chen, W. Yang and W. Zhang, “Real-time strawberry detection using deep neural networks on embedded system (rtsd-netAn edge AI application,” Computers and Electronics in Agriculture, vol. 192, no. 23, pp. 65–86, 2022. [Google Scholar]
48. S. Arora and S. Singh, “Butterfly optimization algorithm: A novel approach for global optimization,” Soft Computing, vol. 23, no. 2, pp. 715–734, 2019. [Google Scholar]
49. V. V. Jha, K. S. Jajoo, B. Tripathy and S. Durai, “An improved monarch butterfly optimization based multivariate fuzzy time series approach for forecasting GDP of India,” Evolutionary Intelligence, vol. 8, no. 3, pp. 1–15, 2022. [Google Scholar]
50. Y. Li, X. Yu and J. Liu, “Enhanced butterfly optimization algorithm for large-scale optimization problems,” Journal of Bionic Engineering, vol. 21, no. 2, pp. 1–17, 2022. [Google Scholar]
51. Y. Zhi, W. Weiqing, W. Haiyun and H. Khodaei, “Improved butterfly optimization algorithm for CCHP driven by PEMFC,” Applied Thermal Engineering, vol. 173, no. 51, pp. 47–66, 2020. [Google Scholar]
52. Y. Masmoudi, M. Ramzan, S. A. Khan and M. Habib, “Optimal feature extraction and ulcer classification from WCE image data using deep learning,” Soft Computing, vol. 10, no. 1, pp. 1–14, 2022. [Google Scholar]
53. Z. Akhtar, J. W. Lee, S. A. Khan and N. Riaz, “Optical character recognition (OCR) using partial least square (PLS) based feature reduction: An application to artificial intelligence for biometric identification,” Journal of Enterprise Information Management, vol. 4, no. 2, pp. 1–20, 2020. [Google Scholar]
54. Y. Yang, Y. Li, J. Yang and J. Wen, “Dissimilarity-based active learning for embedded weed identification,” Turkish Journal of Agriculture and Forestry, vol. 46, pp. 390–401, 2022. [Google Scholar]
Cite This Article
 Copyright © 2023 The Author(s). Published by Tech Science Press.
This work is licensed under a Creative Commons Attribution 4.0 International License , which permits unrestricted use, distribution, and reproduction in any medium, provided the original work is properly cited.
 Downloads
 Citation Tools