
 Submit a Paper
 Propose a Special lssue
 Open Access
ARTICLE

Gaussian Blur Masked ResNet2.0 Architecture for Diabetic Retinopathy Detection
1 School of Electronics Engineering, Vellore Institute of Technology, Chennai, 600127, India
2 School of Computer Science and Engineering, Vellore Institute of Technology, Chennai, 600127, India
3 Centre for Cyber-Physical Systems, Vellore Institute of Technology, Chennai, 600127, India
* Corresponding Author: Manas Ranjan Prusty. Email:
Computers, Materials & Continua 2023, 75(1), 927-942. https://doi.org/10.32604/cmc.2023.035143
Received 09 August 2022; Accepted 17 November 2022; Issue published 06 February 2023
 View Full Text
 Download PDF
Abstract
Diabetic Retinopathy (DR) is a serious hazard that can result in irreversible blindness if not addressed in a timely manner. Hence, numerous techniques have been proposed for the accurate and timely detection of this disease. Out of these, Deep Learning (DL) and Computer Vision (CV) methods for multiclass categorization of color fundus images diagnosed with Diabetic Retinopathy have sparked considerable attention. In this paper, we attempt to develop an extended ResNet152V2 architecture-based Deep Learning model, named ResNet2.0 to aid the timely detection of DR. The APTOS-2019 dataset was used to train the model. This consists of 3662 fundus images belonging to five different stages of DR: no DR (Class 0), mild DR (Class 1), moderate DR (Class 2), severe DR (Class 3), and proliferative DR (Class 4). The model was gauged based on ability to detect stage-wise DR. The images were pre-processed using negative and positive weighted Gaussian-based masks as feature engineering to further enhance the quality of the fundus images by removing the noise and normalizing the images. Up-sampling and data augmentation methods were used to address the skewness of the original dataset. The proposed model achieved an overall accuracy of 91% and an area under the receiver-operating characteristic curve (AUC) score of 95.1%, outperforming existing Deep Learning models by around 10%. Furthermore, the class-wise F1 score for No DR was 92%, Mild DR was 82%, Moderate DR was 66%, Severe was DR 89% and Proliferative DR was 80%.Keywords
Diabetes is caused due to the lack of insulin production or a failure to utilize the insulin that is generated in the body [1]. Diabetes affects a variety of organs, one such example is diabetic retinopathy, which damages the eye’s tiny vessels. It is one of the leading causes of blindness worldwide today [2,3]. Non-proliferative diabetic retinopathy (NPDR) and Proliferative Diabetic Retinopathy (PDR) are the two main forms of DR. In its early beginnings, the DR is referred to as NPDR, and it is further classified into Mild, Moderate, and Severe phases [4]. According to statistics, there are 415 million diabetes sufferers globally and at some time in their lives, 40 to 45 percent of diabetes patients will develop DR; yet, less than half of DR patients are aware of their illness [5]. This is because patients with DR are asymptomatic in the early stages and if the illness is not addressed, it can lead to visual loss [6]. Early identification and treatment of DR are therefore critical in addressing this global epidemic and preventing complete vision loss.
Diabetic Retinopathy is still widespread today, and preventing it is a difficult task. Diabetics should be tested every year to avoid blindness. Ophthalmologists generally diagnose the existence and severity of disease by doing a physical examination of the fundus and analyzing the color images of the eye. Although effective, this method is costly and time-consuming, given the enormous number of diabetes patients worldwide [7]. Moreover, 75% of the patients with DR conditions reside in impoverished areas, where there are insufficient experts and facilities for diagnosis [8]. Global screening systems have been established to combat this; however, DR is prevalent at such a vast scale that such programs cannot effectively identify and treat retinopathy on an individual basis. As a result, millions of people throughout the world continue to have this problem due to a lack of availability of early detection and effective treatment. Therefore, using computer vision algorithms to automatically evaluate fundus pictures and aid physicians/radiologists is critical.
Automated methods for diagnosing retinal disease using filtered color fundus pictures have previously been presented to overcome the shortcomings of current diagnostic processes [9,10]. Deep Learning along with Computer Vision techniques has made the process of automation more effective than any other methods, by accurately predicting the disease while utilizing lesser time and resources. The work of LeCun et al. [11] gave birth to deep learning (DL). The convolutional neural network (CNN), a DL approach employed by his student Krizhevsky et al. [12] in the 2012 ImageNet [13] competition, helped to launch DL’s popularity in 1998. Since then, many state-of-the-art architectures have been developed and greater results have been achieved year after year. The neural networks kept becoming more complex and deeper in layers. The success of this was highly influenced by graphics processing unit (GPU) hardware availability, as the number of trained parameters grew in direct proportion to the depth of the created networks.
Deep learning can facilitate medical studies by improving, classifying, segmenting, and detecting medical pictures, as well as relating to the images and taking important measures [14–18]. Automatic diabetic retinopathy identification has been the subject of several studies in the literature in the past years. Unlike traditional machine learning methods, deep learning does not require external feature extraction techniques via image processing. It employs automated feature extraction on the colored fundus images of the eye. Deep learning-based systems have an advantage over standard machine learning systems due to the availability of vast amounts of data and transfer learning techniques. Although the computer-aided diagnosis of DR has shown tremendous results, there are a few major shortcomings that still exist. The first is that the current literature focuses on the diagnosis of only two stages of Diabetic Retinopathy, i.e., No DR and DR. Early-stage detection of DR is necessary to avoid complete blindness. Hence, accurate class-wise detection of DR is necessary especially in the initial stages. Second is the imbalance of the dataset as it is highly skewed towards one class (Class 0–No DR). This means that the model would be highly biased towards classes with a greater number of images, leading to inaccurate prediction of the classes with lesser images. Third is the high variability of the dataset. As these images were taken using fundus photography, they are not uniform in terms of dimensions, intensity, etc. To address the above-mentioned issues, we have proposed an extended ResNet model named ResNet2.0 to perform multi-class classification on the dataset. Sampling methods and data pre-processing steps have been adopted before training the model to overcome the imbalance and variability of the fundus images. The methodology adopted and contributions of this paper are listed down below:
• First, the images were normalized by resizing them and then applying pre-processing techniques to the whole dataset.
• To address the imbalanced classes and normalize the dataset, classes with lower number of images were up-sampled.
• ResNet2.0 model was built using transfer learning on ResNet152V2 and customizing it by adding additional layers on top of it.
• The model was trained to perform five class classifications on the original and up-sampled dataset.
• Lastly, the performance of the model was assessed and compared to previous related works.
Gondal et al. [19] proposed a CNN model and performed binary classification on normal and referable DR images. The publicly available Kaggle dataset was used for training the model and DiaretDB1 was used to test it. They categorized normal and mild classes to be non-referable and the rest as referable DR. This resulted in a specificity and sensitivity of 97.6% and 93% respectively on the test dataset. Garcia et al. [20] increased the contrast of the fundus images during the preprocessing and augmentation stages since the difference in appearance between the fundus images belonging to each stage is minute. Then they applied CNN separately to the left and right eye images but did not have a fully connected layer. Their model achieved an accuracy of 83.68%. One drawback of this study is that they did not explicitly classify each stage of DR. A convolutional neural-based model having 13 layers was proposed by Pratt et al. [21] for detecting DR. They used the eyePACS DR dataset, which is a publicly available dataset to train their model. A sensitivity of 95% was achieved on 5,000 test images. However, they were unable to correctly classify the mild stage, which is essential for the timely detection of DR. Another drawback is that the dataset used in this study was highly skewed, which resulted in high specificity at the expense of low sensitivity. So, although their model was good at detecting actual cases of DR, it had a high false positive rate.
Zhuang et al. in their paper [22] used transfer learning to build deeper models, which led to an improved accuracy, hence proving that deeper neural network models can classify the DR better. Regarding Diabetic Retinopathy (DR) categorization, they offered two alternative approaches. A superficial neural specification is introduced in the first approach. This model does a good job of identifying the most common classes but fails miserably at classifying the less common ones. In the second technique, transfer learning is used to retrain the deep neural network's last changed layer in order to improve the model’s generalization capacity to less frequent classes. It was also discovered that the approach employed was unable to generalize adequately because of the usage of extremely deep neural network models (overfitting scenario). This proved that too deep of a neural network is also not capable of classifying the 5 stages of DR. Study [23] compared the results obtained by using fine-tuned pre-trained model and a CNN trained from scratch for medical image classification. The result of this study was that former performed better. Kassani et al. [24] evaluated the performance of pre-trained models such as VGG16, VGG19, and InceptionV3, for binary and 5-class DR classification. According to their observation, the accuracy of models is strongly proportional to the number of convolutional and pooling layers. They used data augmentation to reduce the skewness of the dataset which resulted in an accuracy of 80.4% (using the VGG19 model). Hence, the increased number of layers in the architecture and data augmentation helped them achieve an improvement in overall accuracy.
Tymchenko et al. developed a multi-stage transfer learning methodology as well as an automated method for detecting the stage of DR using single fundus imaging [25]. They used the APTOS dataset and achieved a kappa score of 0.92. It was noted that the authors were able to achieve high and stable results due to the use of an ensemble of networks. The drawback was that they used unstable metrics hence, hyperparameter optimization could have led to even better performance. Sikder et al. [26] used the ensemble learning technique and created a complete pipeline for early identification of DR. Image preparation, image pre-processing, feature extraction, and image classification are the four key phases in their pipeline. They used the APTOS dataset in their study, but the results were not promising. They achieved a precision, recall and F1-score of 90.4, 89.54 and 89.97 respectively. In the study [27], it was proved that techniques that combine classification and segmentation had a higher performance rate. In this research, the authors suggested FGADR, a substantial dataset of fine-grained labeled DR. In addition, they carried out comprehensive experiments to investigate the lesion classification tasks and evaluate the various state-of-the-art segmentation models. On the DR grading job, joint classification and segmentation algorithms performed better. They also created the DSAA inductive transfer learning approach to use their DR database for bettering the detection of many ocular diseases. Finally, it was also mentioned that determining the precise difference between grades 3 and 4 was challenging.
In this paper, we propose an extended ResNet based deep learning model named ResNet2.0. Transfer learning was used to enhance the performance of the network i.e., ResNet152V2 was used as the base model. This was done by freezing the top layer of the pre-trained network and custom layers were added to it which resulted in the custom deep learning model ResNet2.0. Image pre-processing steps were then performed on the dataset to improve the quality of the images. Then the entire dataset was split into train and test sets. On the training set images, data augmentation such as rescaling, horizontal flip, vertical flip, rotation, shifting width and height wise were applied. The classes with comparatively lower numbers of images were up-sampled so that each class had the same number of images. This data was then fed into the proposed model. Sections 4 and 5 explain the individual aspects of the methodology used in this study. Sections 5.1 and 5.2 depicts the pre-trained model and the additional layers used. Fig. 1 summarizes the methodology adopted.
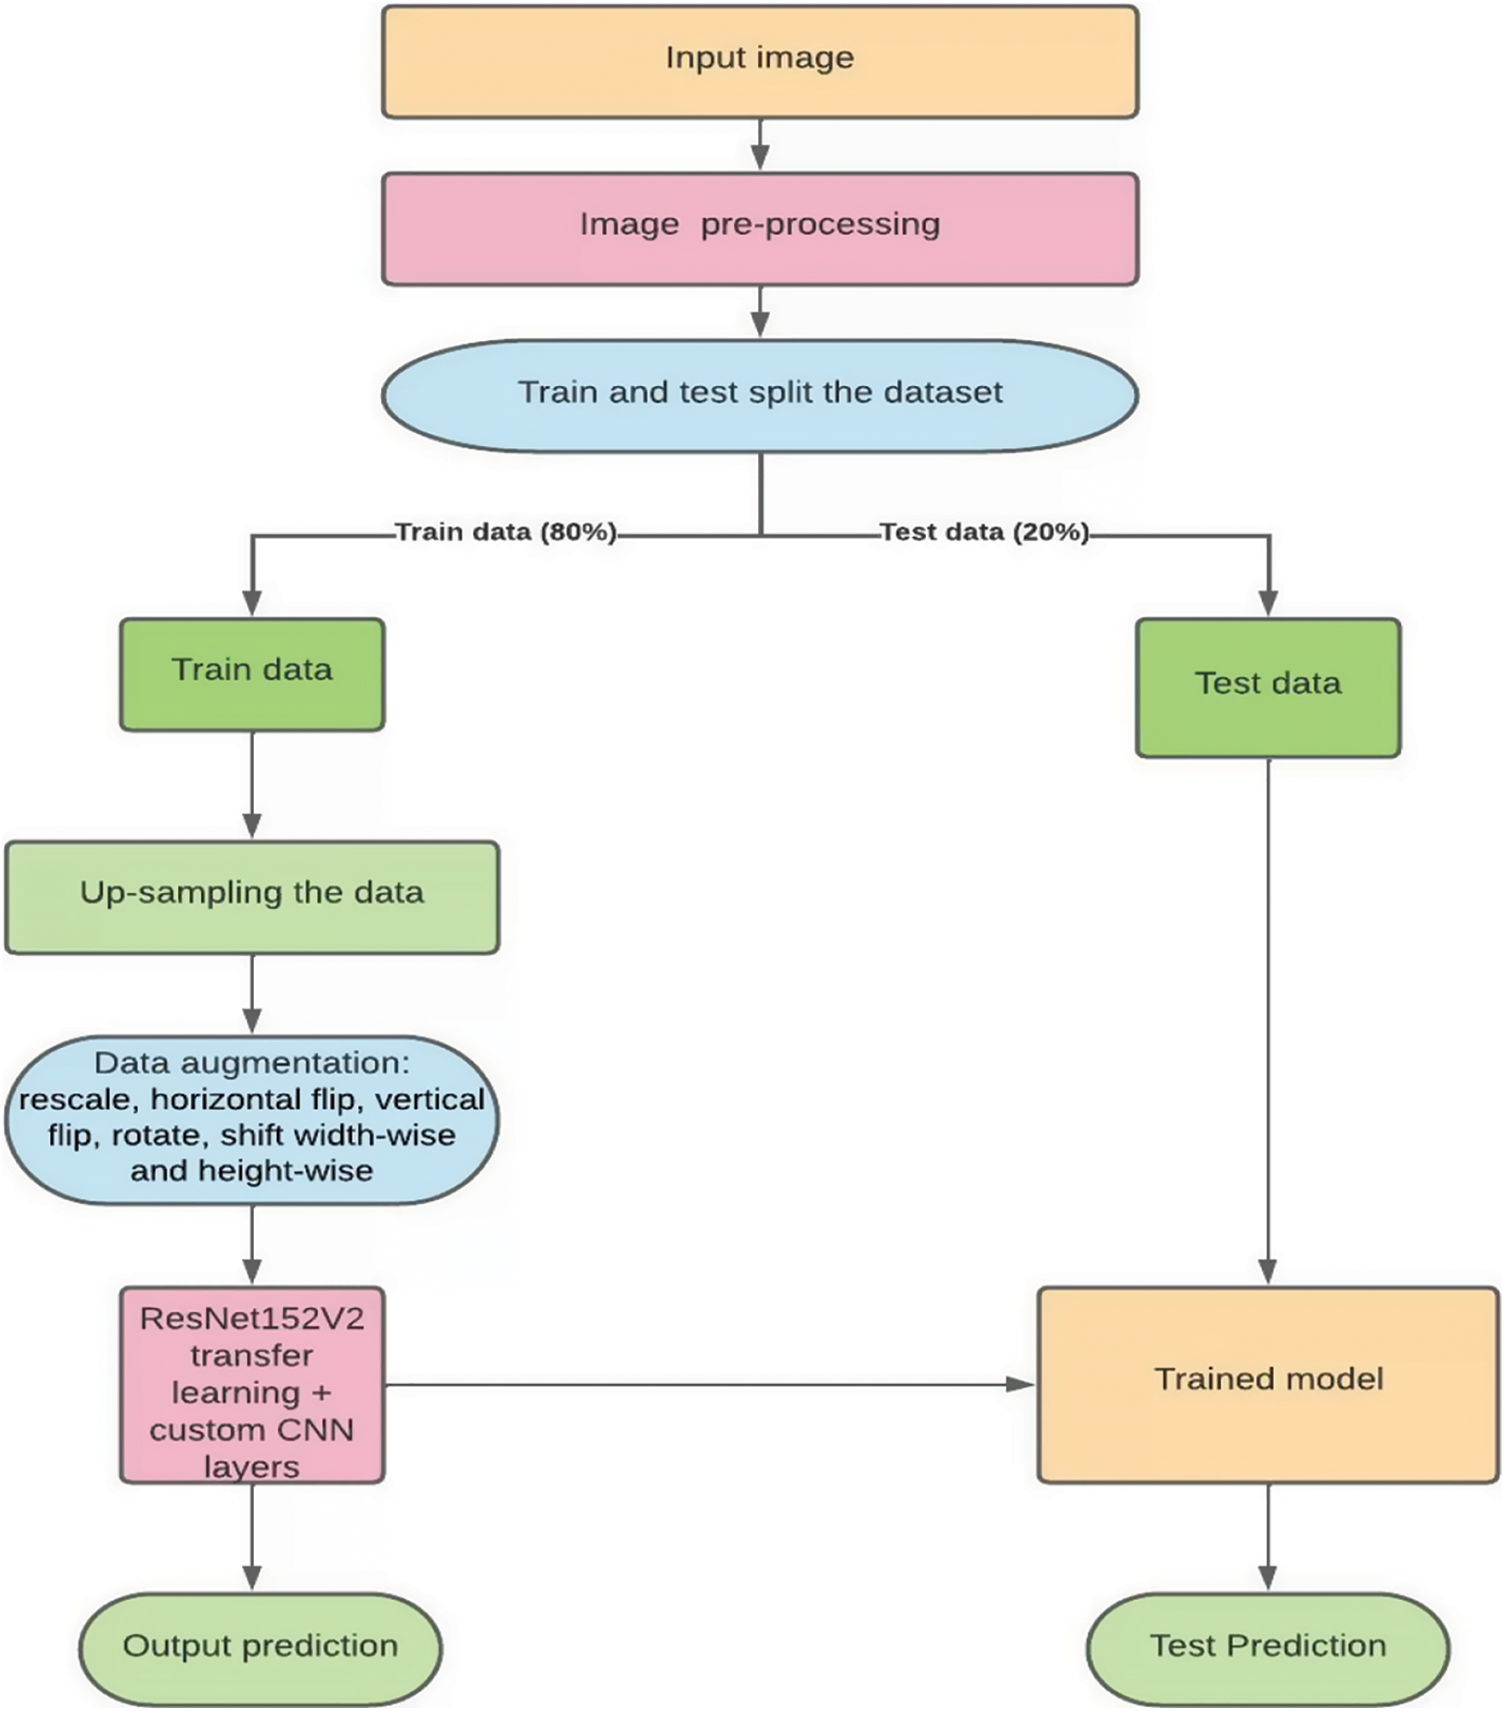
Figure 1: Proposed methodology
In computer vision, a popular time efficient approach to building models is by using transfer learning techniques [28]. Instead of starting the learning process from scratch, transfer learning begins with patterns gained while tackling a separate problem, drawing on prior knowledge rather than beginning from scratch. Transfer learning is commonly demonstrated in computer vision using pre-trained models. A pre-trained model is one that has been trained on a big benchmark dataset. Typically, when we train a convolutional neural network on image dataset, we extract general features, and when we move further into the network, we extract specialized features which might result in significant processing costs. However, since pre-trained models already know how to extract features, transfer learning does not start training from scratch. Therefore, it is more effective to import and use models from the existing literature (e.g., VGG, Inception, ResNet).
Canziani et al. [29] offer a detailed assessment of the pre-trained model's performance on computer vision tasks using data from the ImageNet challenge 2016. Transfer learning is used on pre-trained models except for the final layer, which will be replaced by customs layers. In this study, we have used ResNet152V2 which belongs to the family of ResNets or residual networks, which was first proposed by Microsoft. The residual network has residual blocks that skip connections between layers and solve the vanishing gradient problem, which is a common problem with very deep networks [30]. The purpose of residual blocks is to connect the input of the first block to the second output of the second block. This aids the residual block in learning the residual function and preventing grading explosion by using regularization. ResNetV2, also known as ResNet version 2 uses pre-activation of weight than post-activation. ResNet V2 applies Batch Normalization and ReLu activation to the input before the weights are multiplied. ResNet152V2 has 152 layers and 60,380,648 parameters. As discussed in the related works, deeper neural networks have been proven to improve the accuracy of the models while causing the opposite effect if the network is too deep.
The last layer of the ResNet152V2 was frozen and its architecture was extended by adding custom layers. Following this, a dropout layer with a ratio of 0.4 was added. Then a flatten layer, batch normalization layer, dense layer consisting of 312 neurons, another batch normalization layer, and activation layer (with activation function ReLU) were added. Following this, there was a second dropout layer of a dropout ratio of 0.6. Succeeding this was a dense layer consisting of 132 neurons, a batch normalization layer, and an activation layer (with activation function ReLU). Then there was a third dropout layer with a dropout ratio of 0.5. Following this was a dense layer consisting of 32 neurons, a batch normalization layer, and an activation layer (with activation function ReLU). Finally, a dense output layer was added consisting of 5 classes (3 classes which perform the 3-class classification), L2 regularizer of 0.01, and activation function SoftMax. Lastly, the batch size, learning rate, and optimizer used are 32, 1e-4, and Adam optimizer. The mathematical expression for the ReLU is depicted in Eq. (1) where x refers to the data point and for SoftMax is depicted in Eq. (2) where z represents the values from the neurons from the output layers. Fig. 2 summarizes the architecture of our model.
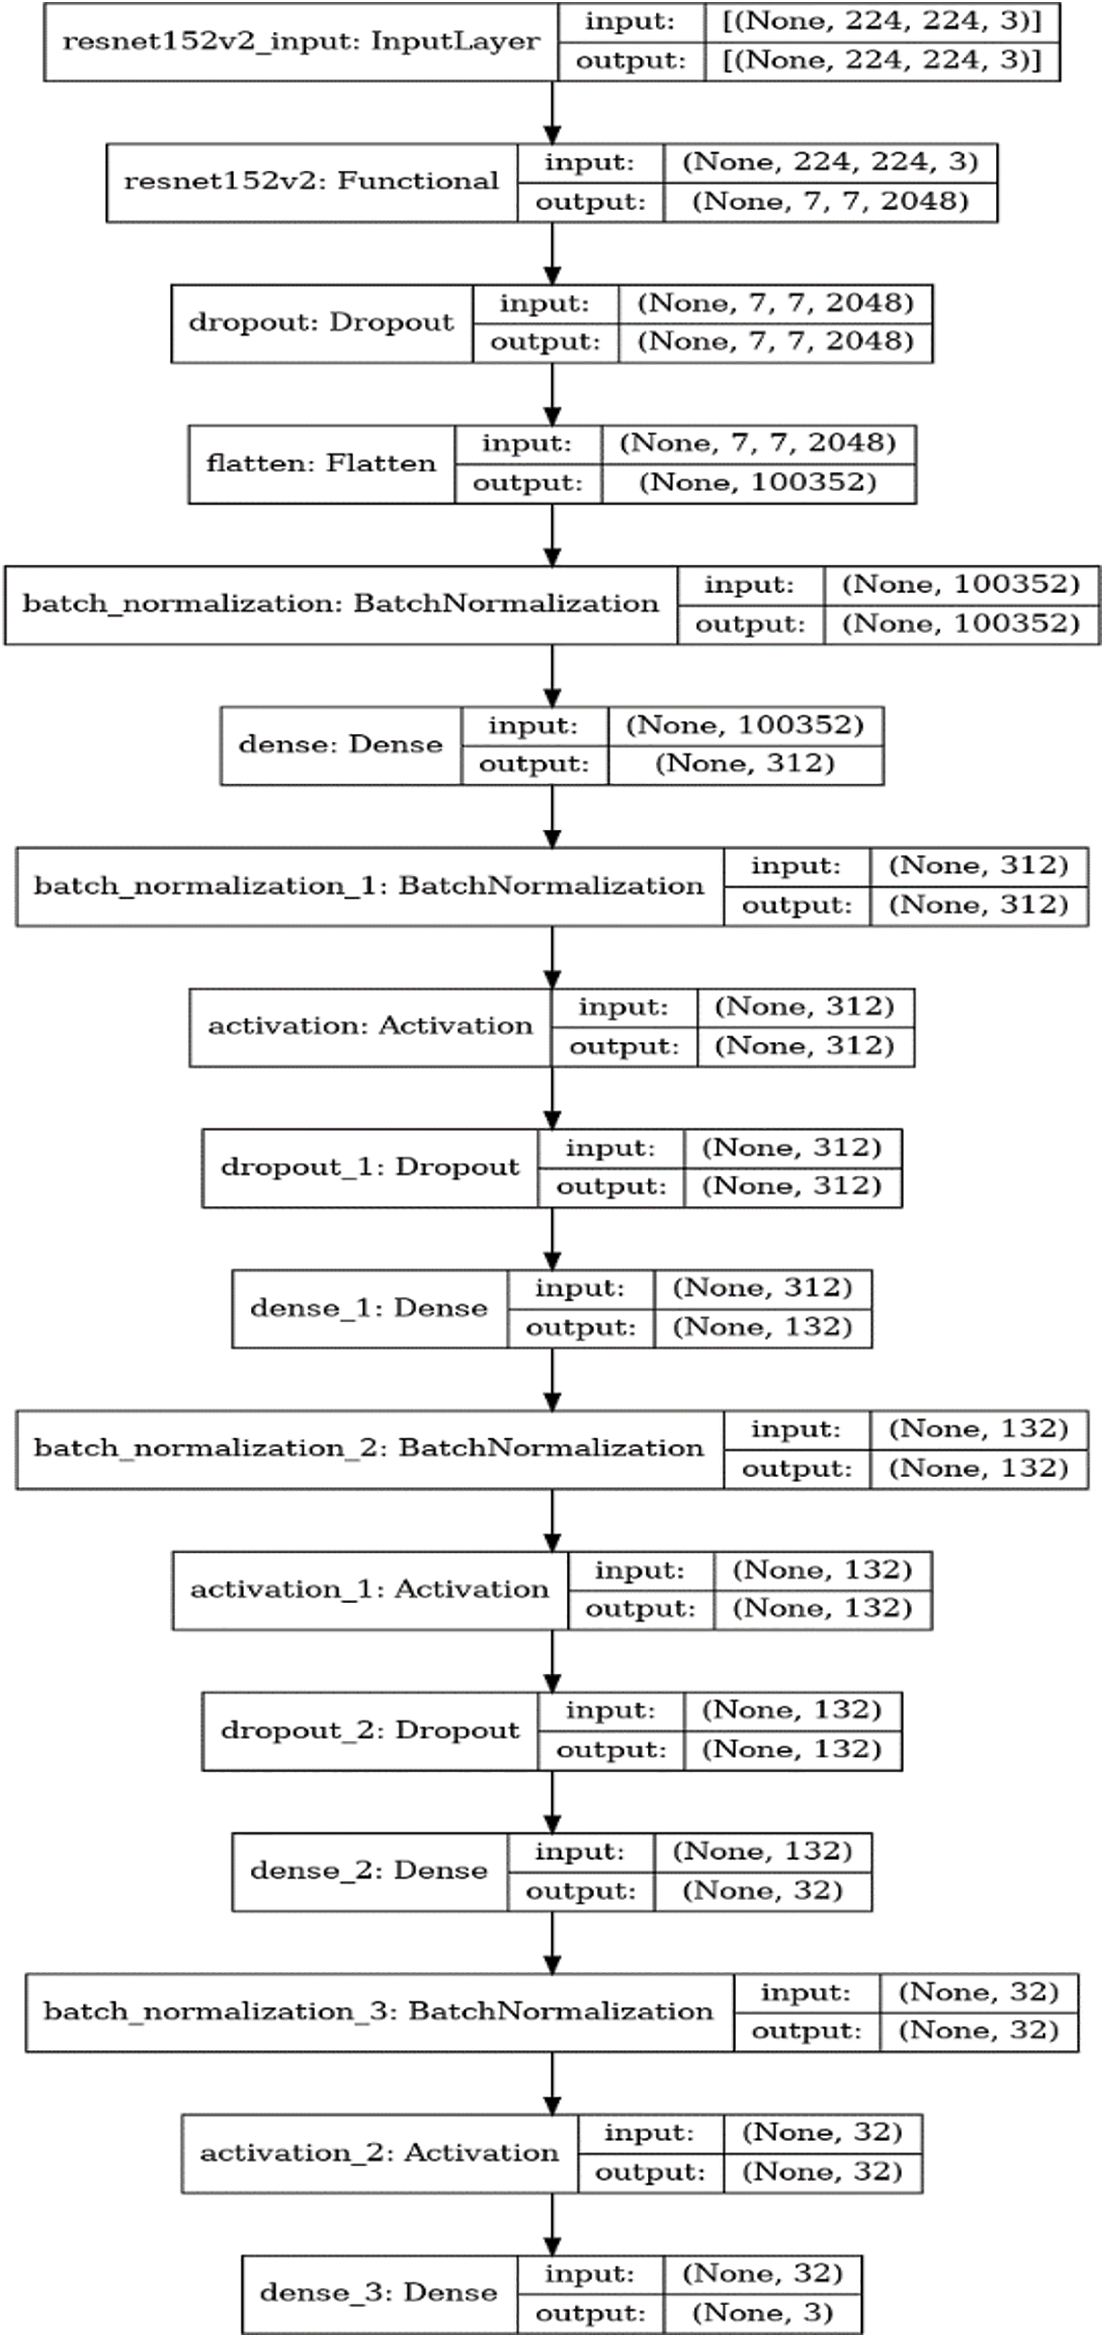
Figure 2: Architecture of the proposed model
Prior to training the extended ResNet architecture, the dataset was split in the ratio of 80:20. 80% of the images were used for training and 20% were used to test the accuracy of the model. The original dataset consisting of 3662 images and the up-sampled dataset consisting of 9025 (1805 in each class) were individually fed into this model which classified the data into the following classes: Class 0–No DR, Class 1–Mild DR, Class–2 Moderate, Class 3–Severe and Class 4–Proliferative. Furthermore, Adam was used as the optimizer, and SoftMax as the activation function in the output layer.
The dataset used in this paper belongs to the Asia Pacific Tele-Ophthalmology Society’s APTOS 2019 diabetic retinopathy categorization challenge [31]. The objective of this challenge was to create machine learning models that can autonomously filter fundus pictures for early identification of DR especially in rural regions where medical screening is complex, time-consuming and requires a lot of resources. The dataset comprises of 3662 retina pictures obtained from different clinics using fundus imagery from the Aravind Eye Hospital in India under a range of controlled circumstances. Table 1 summarizes the distribution of images in the APTOS dataset. The DR is evaluated by the clinician on a scale of 0 to 4. These fundus images were divided into five categories: no DR (Class 0), mild DR (Class 1), moderate DR (Class 2), severe DR (Class 3), and proliferative DR (Class 4). Fig. 3 illustrates eye images belonging to each stage of DR.
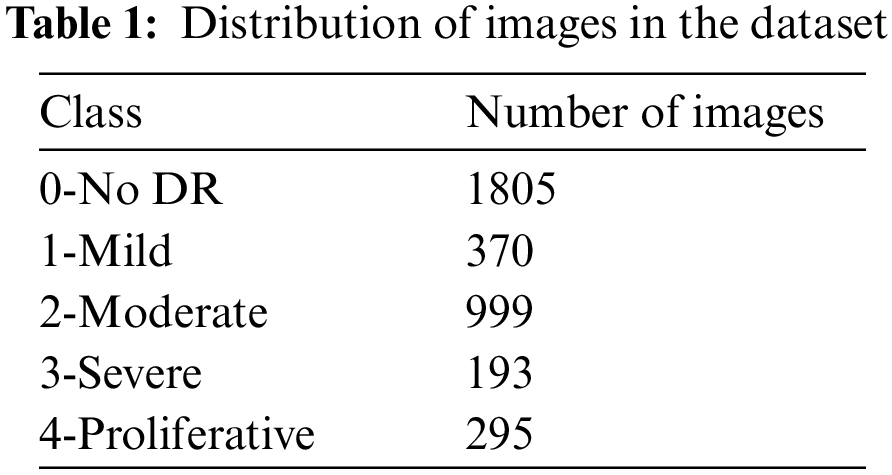
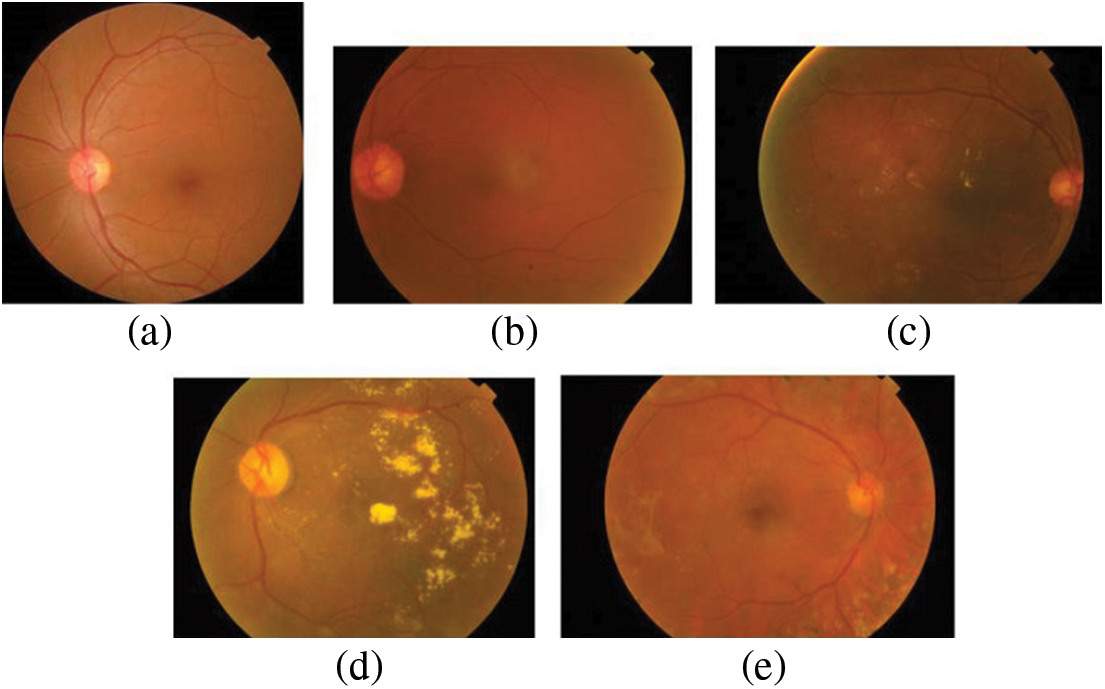
Figure 3: Images of the eye at each stage of DR. (a) No DR-Class 0, (b) Mild–Class 1, (c) Moderate–Class 2, (d) Severe–Class 3 and (e) Proliferative–Class 4
Previous efforts on the DR categorization problem may be divided into two groups-binary DR classification and stage-wise DR classification. In binary DR classification, patients are classified as having DR or not. The drawback with this technique is that even after determining that a patient has DR, we are unable to determine the severity of the illness. Hence, multiclass classification needs to be performed in order to determine the severity of the disease. In this study, 5 stages of DR were considered for classification i.e., no DR, mild DR, moderate DR, severe, and proliferative DR.
5.1 Addressing Dataset Imbalance Problem
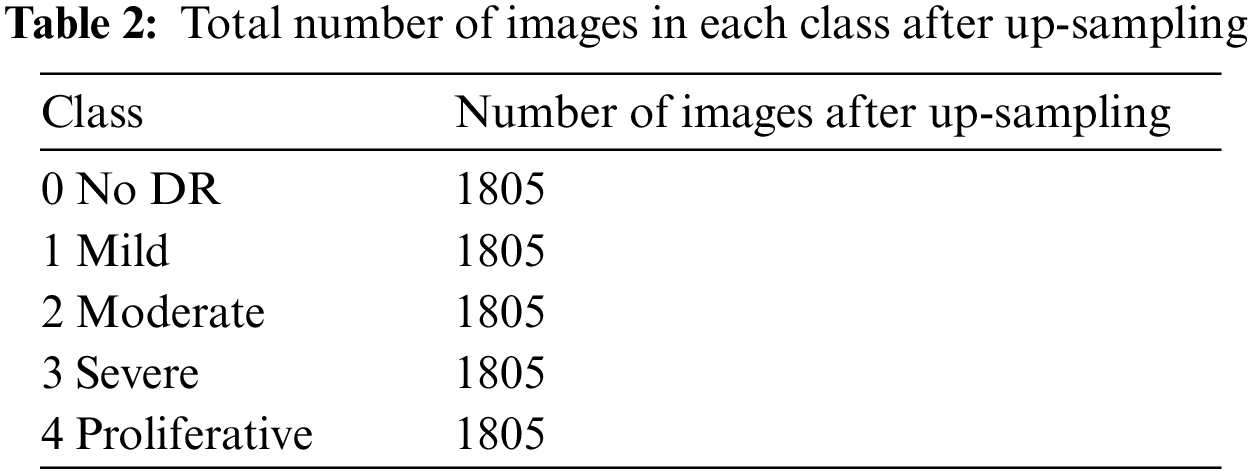
The APTOS dataset is imbalanced and highly skewed towards the No DR class (class 0), which had around 1805 images. This leads to high specificity at the expense of low sensitivity when predicting the output. The imbalance in the dataset was addressed by up sampling the dataset [32,33]. While up-sampling, images were synthetically augmented into respective classes with lower number of images to normalize the class-wise images. The normal and the up-sampled dataset was used to train the custom model. Table 2 summarizes the total number of images in each class after up-sampling.
The images in the APTOS dataset were taken using various cameras from different clinics and hence, they were not uniform. As a result, we used a variety of pre-processing techniques to improve the training process. The steps adopted in this paper have been listed down below:
• First the image was loaded and converted RGB as shown in Fig. 4.
• Next, positive and negative weighted Gaussian filter were combined to form a custom Gaussian based mask. Gaussian blur or Gaussian smoothing is used to blur the images using a Gaussian function [34]. This is used in order to remove noise from the images. Weights (5, −5) were used on the first mask and (−5, 5) on the second mask, these were then added together to form the custom mask which was applied to the fundus images. This has been illustrated in Figs. 5a to 5c.
• This image was then run through a RGB to RED function. This sets the green and blue channel of the image to zero, while only the red channel remains. As seen in (d), the areas of the original image (c) that were red are lighter in the red channel image. This means that areas that contribute more to the red color of the original image are lighter in the red channel's grayscale image. And the areas that contribute little or nothing at all are dark. As shown in Fig. 5d.
• This image was converted back to RGB scale. Finally, this image was used to train the model. This is displayed in Fig. 5e.
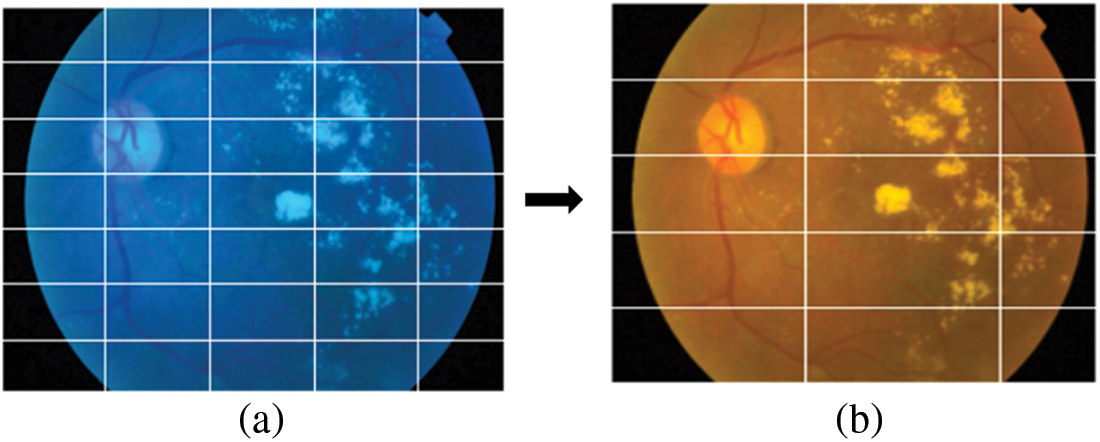
Figure 4: (a) The original image and (b) Image after converting to RGB
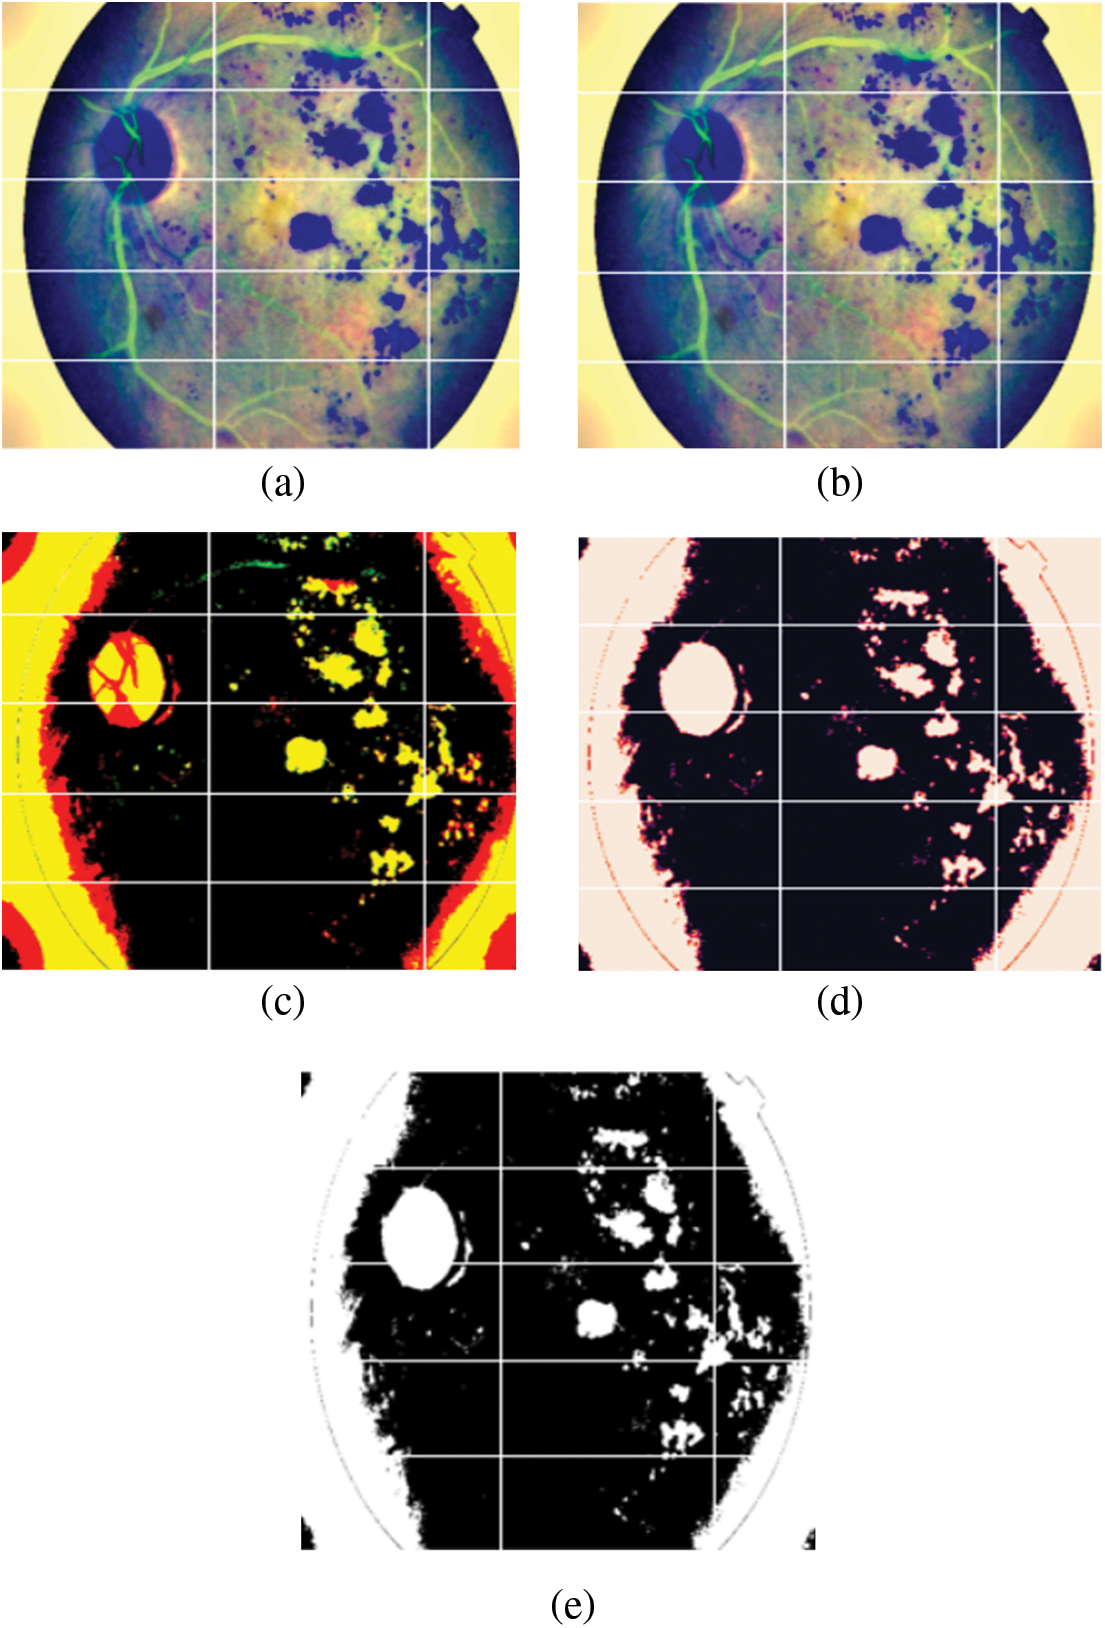
Figure 5: (a) Image after Gaussian blur with weights (−5, 5) was applied to the original image, (b) Image after Gaussian blur with weights (5, −5) was applied to the original image, (c) Image after (a) and (b) were added, (d) Image after applying RGB to Red function and (e) Final image after converting back to RGB
A convolutional neural network's invariant property indicates that it can categorize an item even if it is placed in a different location. Translation, size, perspective, lighting (or any other effect) have no effect on CNN [35]. Unseen data may be distorted when compared to the original data fed into the model, hence, to make it robust, data augmentation is a necessary step. In this study, the images were rescaled, horizontally flipped, vertically flipped, rotated, and shifted widthwise and height-wise before they were used for training.
The model was evaluated based on the final accuracy achieved as well as the class-wise F1 scores. The following metrics were used for this purpose: accuracy, F1 score, recall, precision, area under curve (AUC) and receiver operating characteristics curve (ROC). These results were then compared.
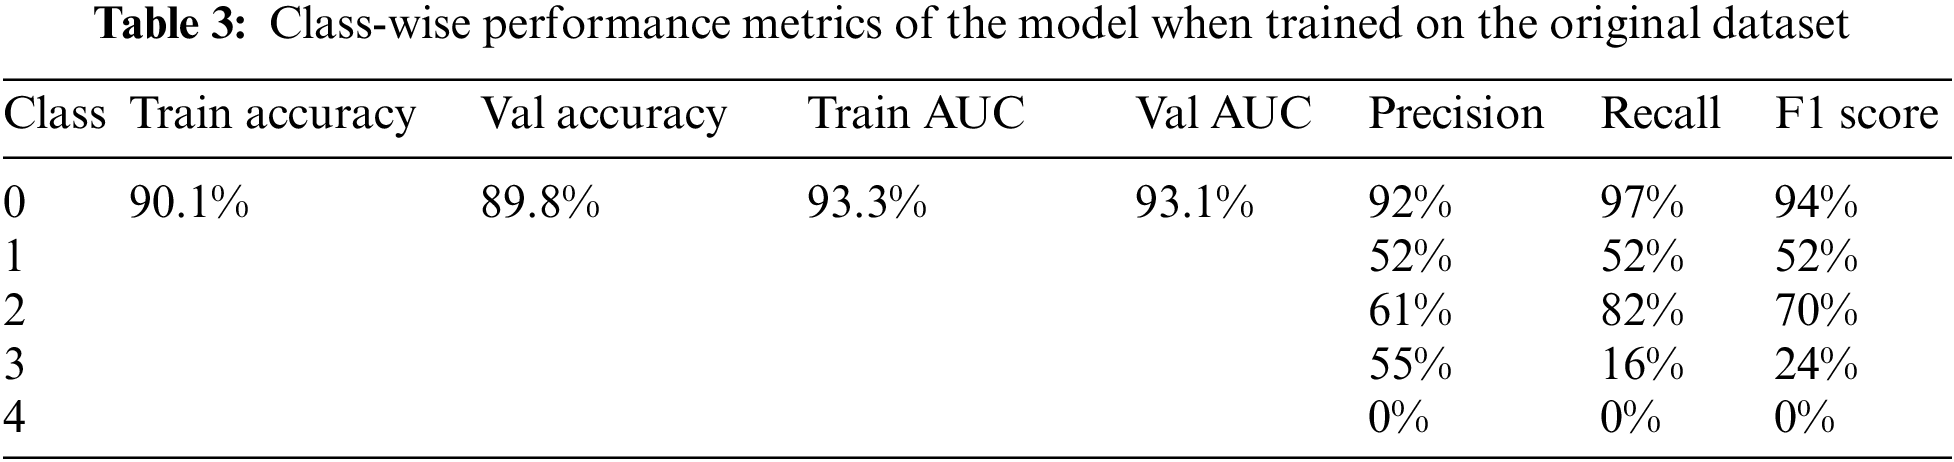
6.1 Results Achieved for Original Dataset
The model achieved an overall accuracy of 89.8% and an AUC of 93.1%. Classes 0, 1, and 2 performed better than classes 3 and 4 in terms of recall and F1 scores. This is due to the imbalance in the dataset, classes 3 and 4 had inadequate amounts of data for the model to train on. The accuracy, loss, ROC curve, and confusion matrix plots have been summarized in Fig. 6. Table 3 summarizes the class-wise performance of the model.
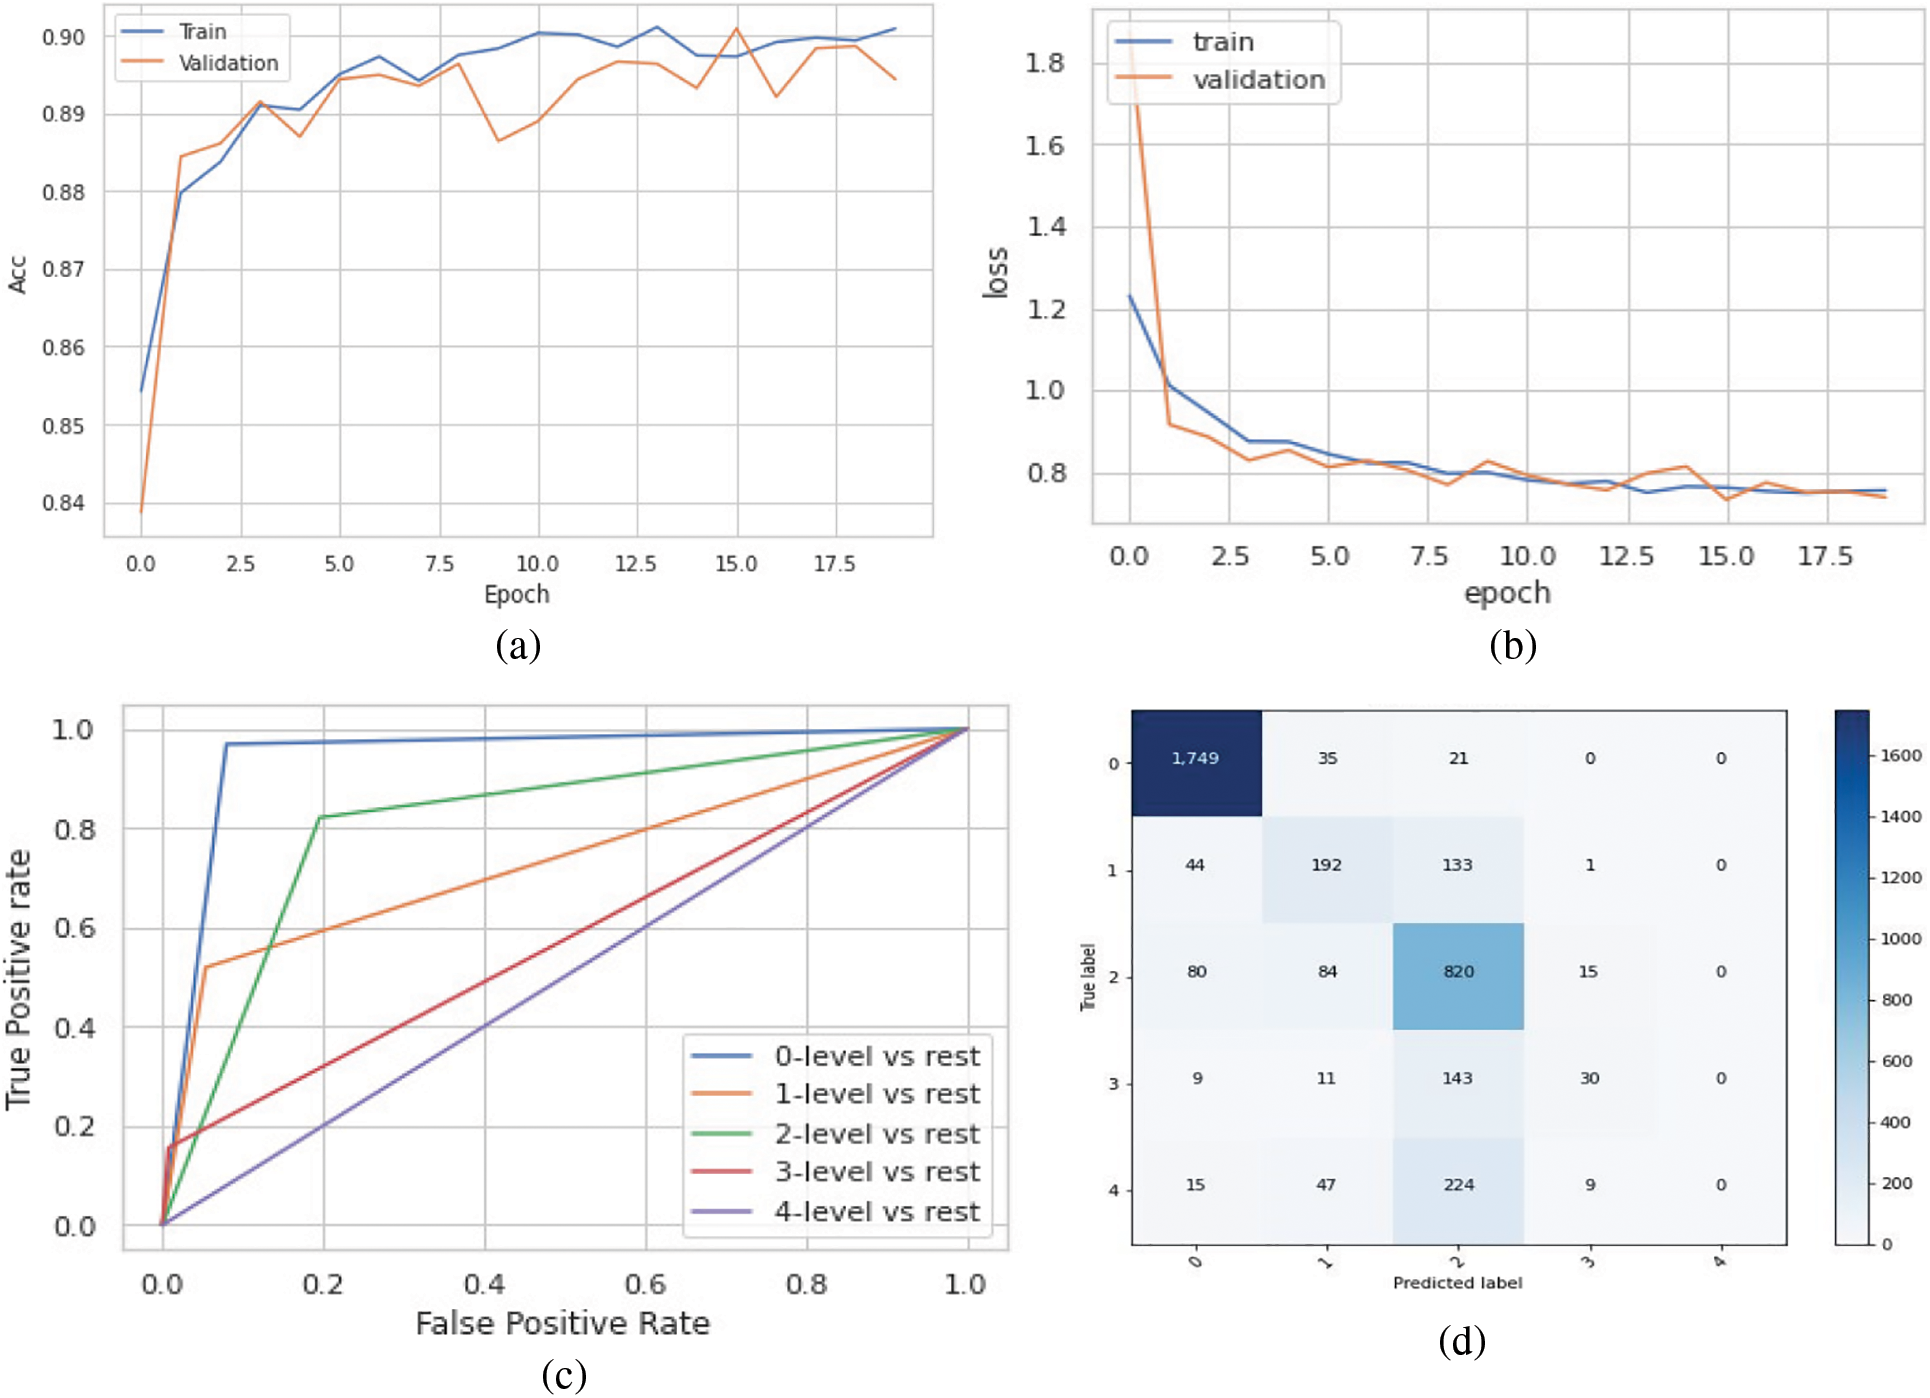
Figure 6: (a) Accuracy vs. epoch graph, (b) Loss vs. epoch graph, (c) ROC curve and (d) Confusion matrix for 5 class classification on the original dataset
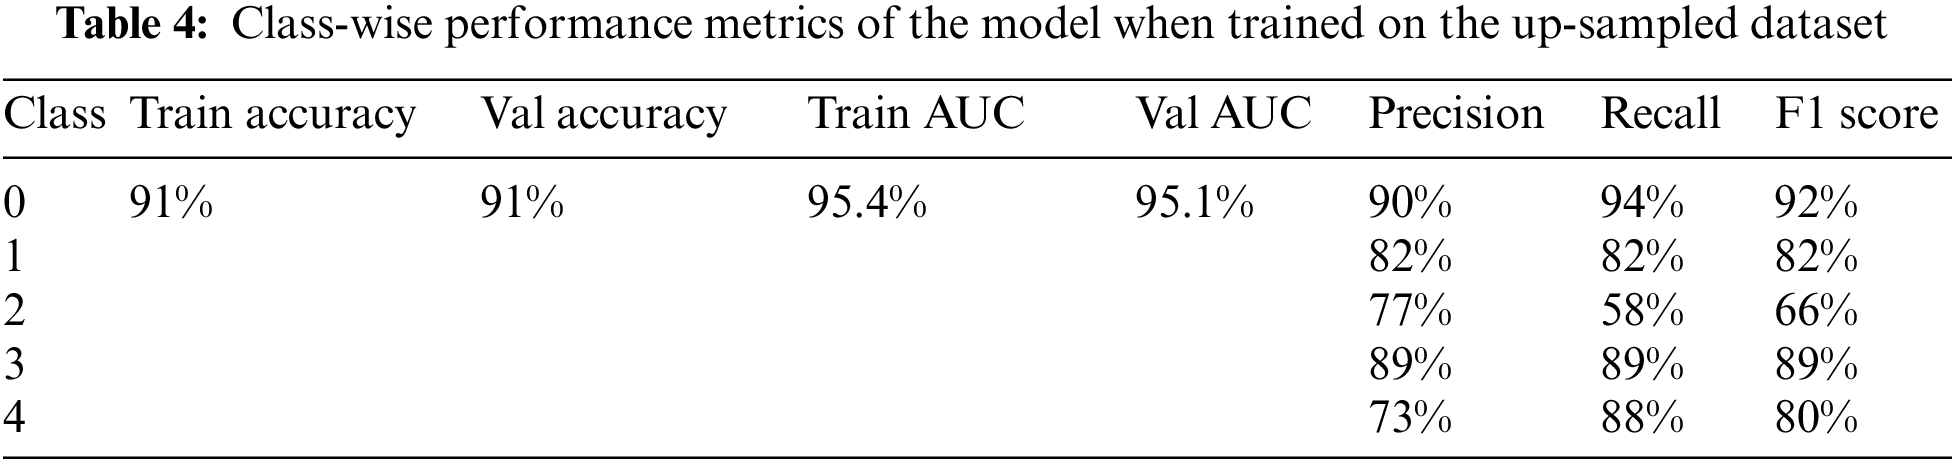
6.2 Results Achieved for Up-Sampled Dataset
The model was trained on the up-sampled dataset, which consisted of 1805 images in each class. When compared to the model’s performance on the original dataset, it achieved better results in terms of the overall accuracy of 91% and AUC of 95.1%. Furthermore, the class-wise performance had significantly improved for classes 3 and 4. The accuracy, loss, ROC curve, and confusion matrix plots have been summarized in Fig. 7. Table 4 summarizes the class-wise performance of the model.
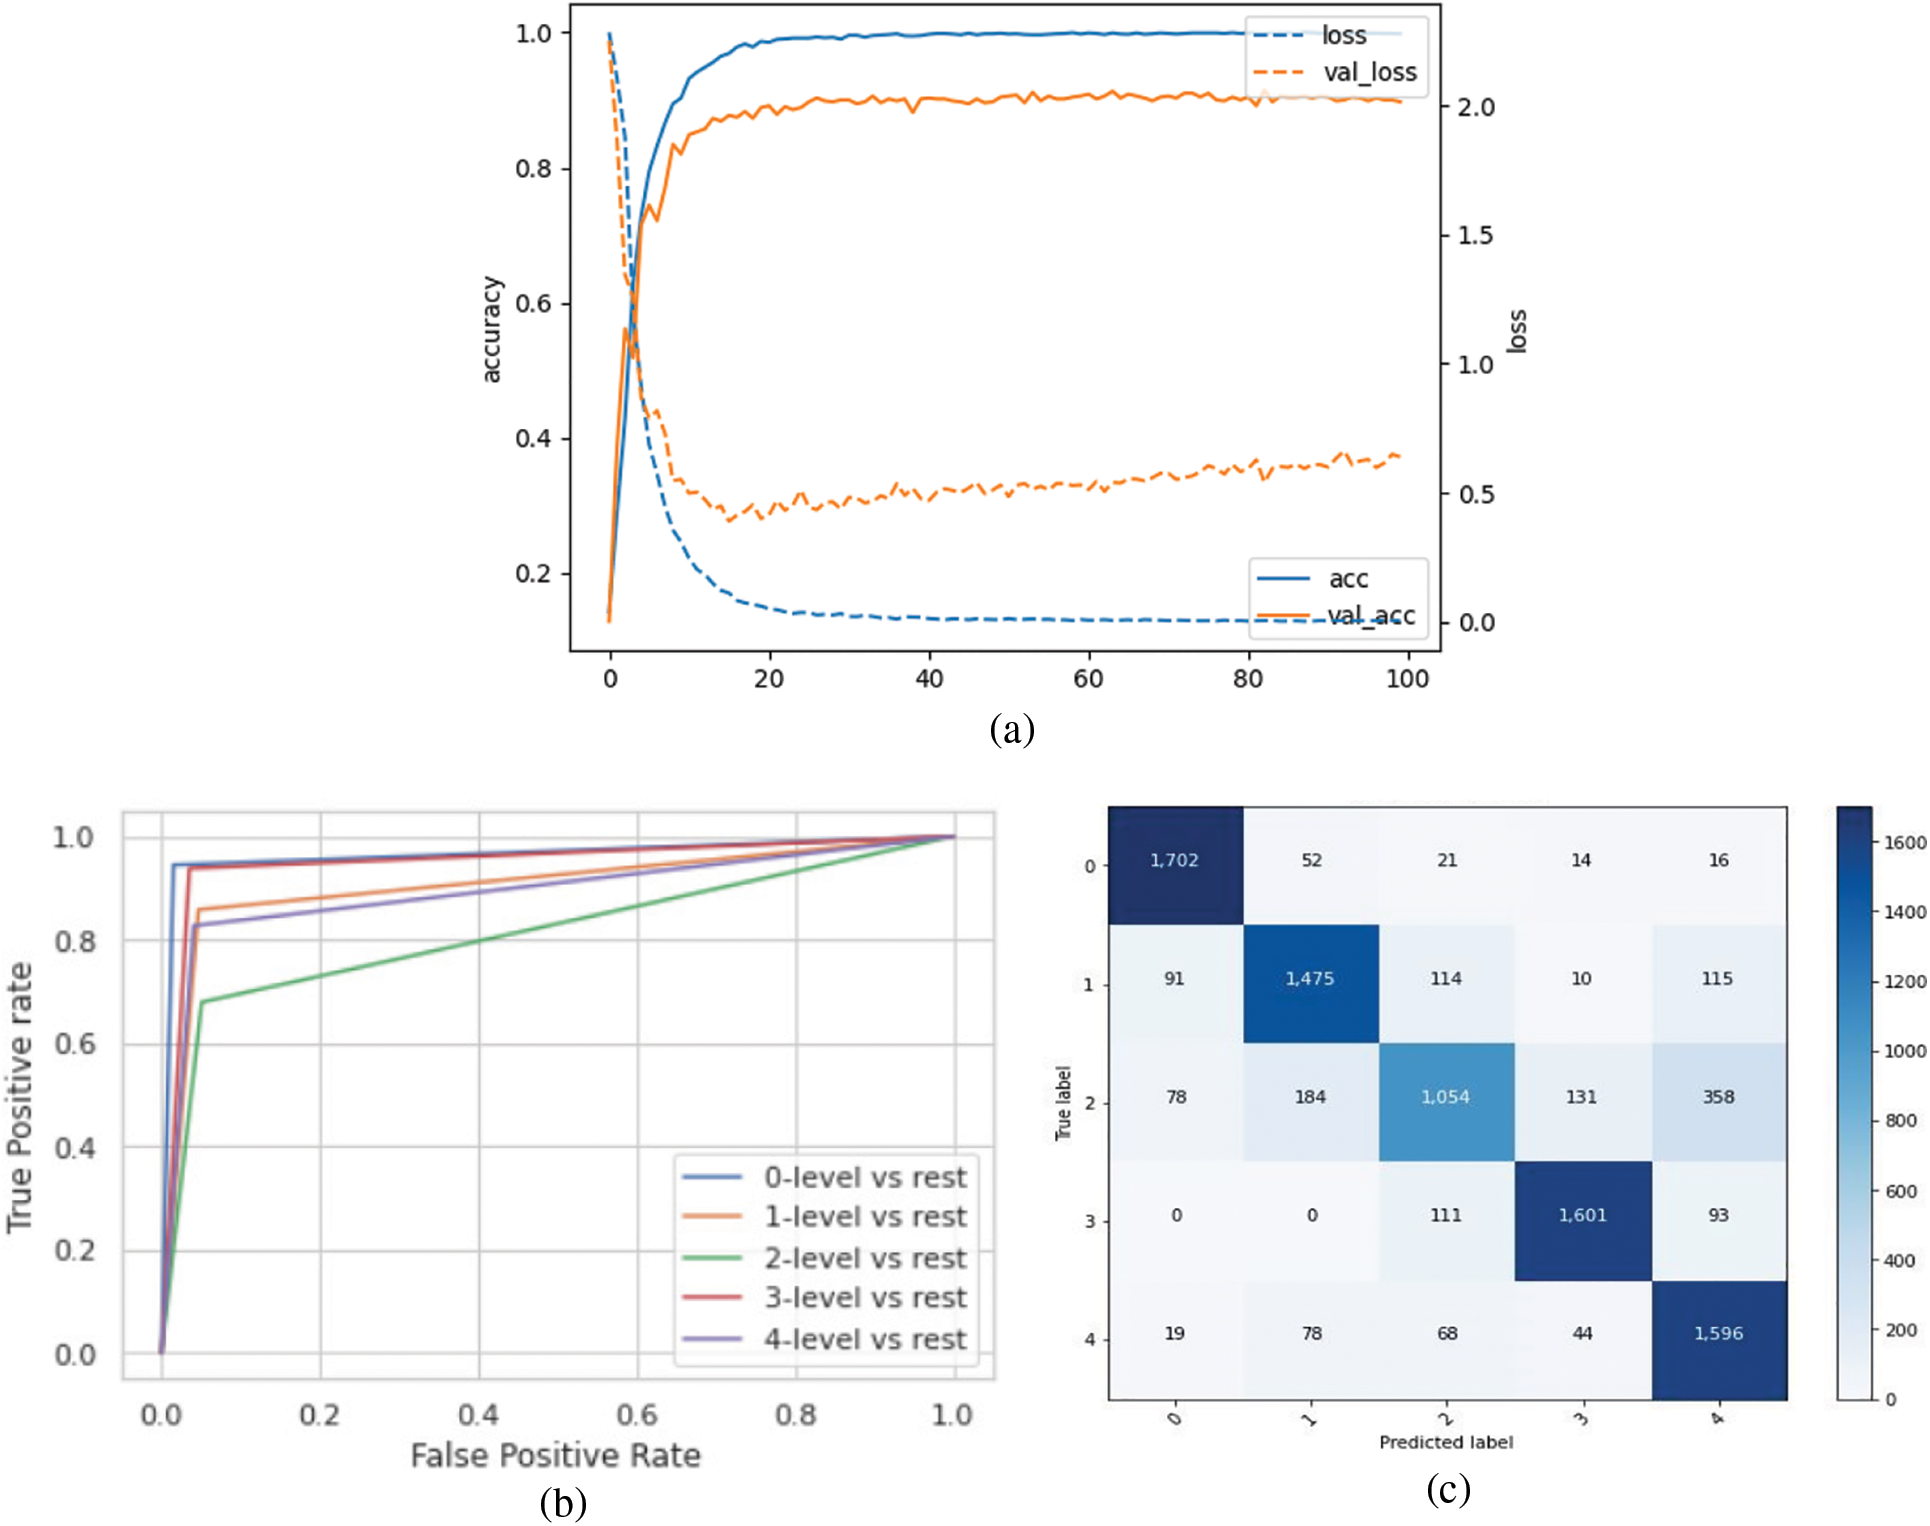
Figure 7: (a) Accuracy and loss vs. epoch graph, (b) ROC curve and (c) Confusion matrix for 5 class classification on the up-sampled dataset
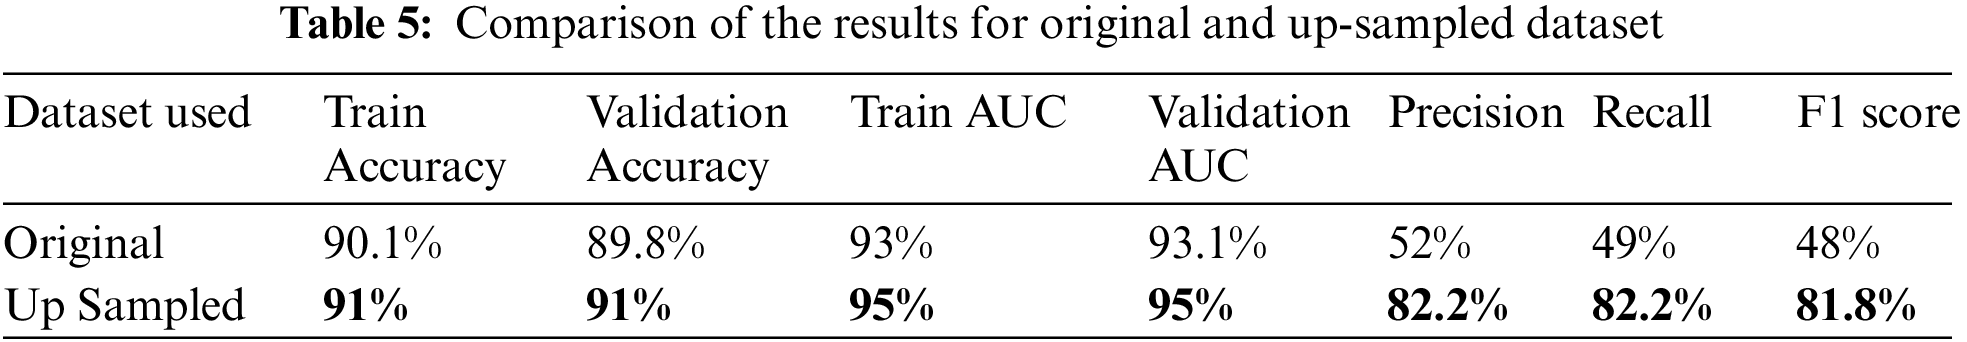
6.3 Comparing the Model Performance
The proposed model achieved a maximum accuracy and AUC of 91% and 95% respectively when trained on the test data. The overall precision, recall and F1 scores when trained on the up-sampled dataset were 82.2%, 82.2% and 81.8% respectively. Table 5 summarizes these results.
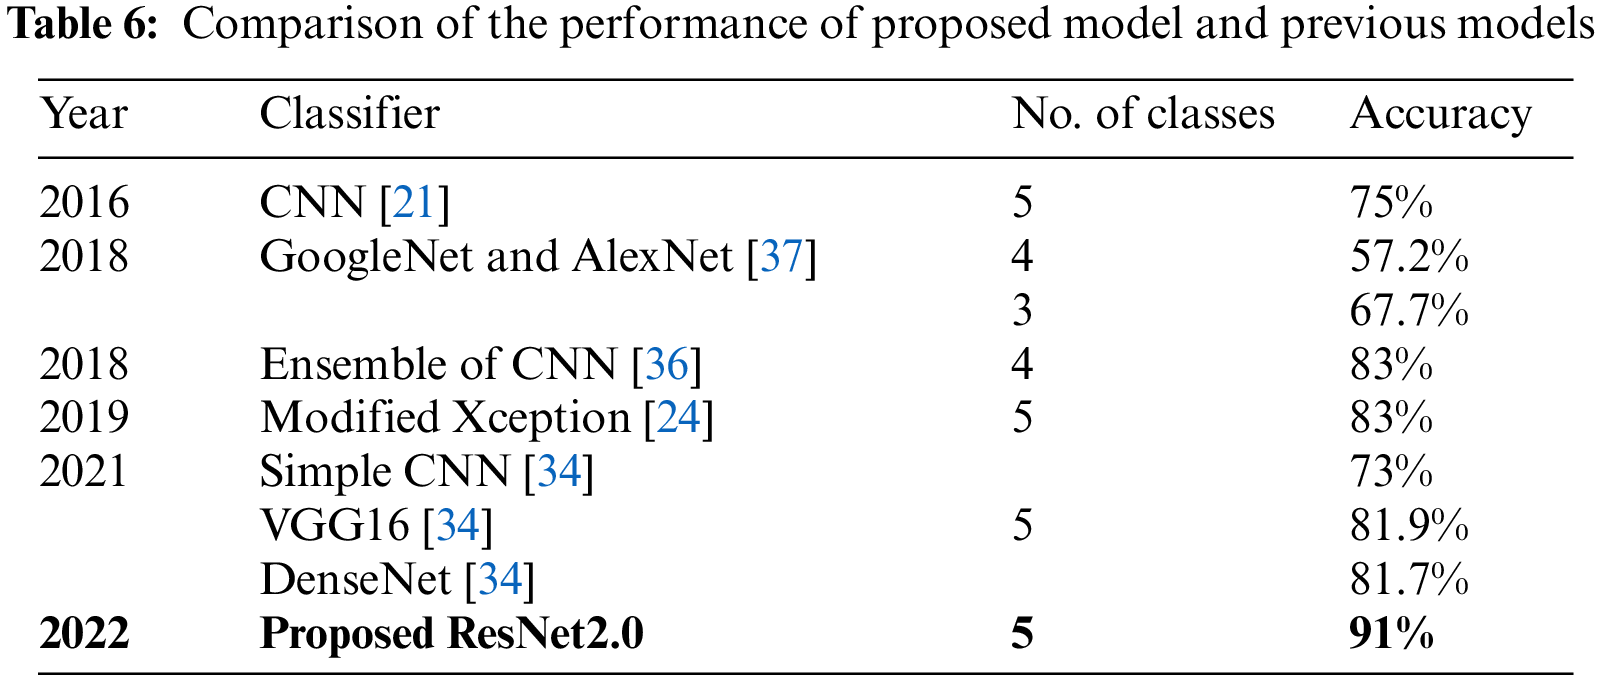
The proposed model was compared to the existing models, which has been summarized in Table 6. The comparison was done based on the maximum accuracy. The proposed model achieved an accuracy of 91% for five class classifications, outperforming the Simple CNN, VGG16 and DenseNet models used in [34] which had an accuracy of 81.7%. The proposed extended ResNet model performed around 10% better when compared to the Modified Xception model proposed in [24] and ensemble of CNN model [36].
In this study, we proposed an Extended ResNet model for the class-wise classification of Diabetic Retinopathy. For this purpose, the APTOS 2019 dataset was used, which consists of stage-wise DR fundus images, namely No DR, Mild DR, Moderate DR, Severe DR, and Proliferative DR. Due to the variability and randomness of the data, various pre-processing techniques like resizing the images, converting to RGB, etc., were used. A custom Gaussian-based mask was implemented by using negative and positive weighted Gaussian blur filters to remove the noise in the data. This was done to normalize the images. The imbalance in the dataset was addressed by up-sampling the classes with a lower number of images. The proposed model was built by modifying the ResNet152V2 architecture and adding additional layers. It was observed that up-sampling led to better performance of the model in terms of overall accuracy as well as class-wise performance. The maximum accuracy achieved was 91% and the AUC score was 95%. The class-wise F1 score for No DR was 92%, Mild DR was 82%, Moderate DR was 66%, Severe DR was 89%, and Proliferative DR was 80%. The model was hence able to detect DR at the initial stages of mild and moderate DR. Overall, it outperformed previously proposed Deep Learning models by 10%. For future research direction, a tailor-made DR detection product can be implemented to aid doctors. Another approach can be to reduce the complexity of the ResNet model while maintaining its ability to achieve excellent results. Furthermore, the training data set was limited; hence, extending the size might give better results.
Acknowledgement: The authors would like to thank the School of Computer Science and Engineering, and the Centre for Cyber Physical Systems Vellore Institute of Technology, Chennai for their constant support and motivation to carry out this research.
Funding Statement: The authors received no specific funding for this study.
Conflicts of Interest: The authors declare that they have no conflicts of interest to report regarding the present study.
References
1. A. Erciyas and N. Barışçı, “An effective method for detecting and classifying diabetic retinopathy lesions based on deep learning,” Computational and Mathematical Methods in Medicine, vol. 21, no. 12, pp. 13–26, 2021. [Google Scholar]
2. T. Shanthi and R. S. Sabeenian, “Modified alexnet architecture for classification of diabetic retinopathy images,” Computers Electrical Engineering, vol. 76, no. 1, pp. 56–64, 2019. [Google Scholar]
3. C. P. Wilkinson, “Proposed international clinical diabetic retinopathy and diabetic macular edema disease severity scales,” Ophthalmology, vol. 110, no. 9, pp. 1677–1682, 2003. [Google Scholar]
4. S. Haneda and H. Yamashita, “International clinical diabetic retinopathy disease severity scale,” Europe PMC, vol. 13, no. 2, pp. 50–60, 2015. [Google Scholar]
5. J. Beagley, L. Guariguata, C. Weil and A. A. Motala, “Global estimates of undiagnosed diabetes in adults,” Diabetes Research and Clinical Practice, vol. 103, no. 2, pp. 150–160, 2014. [Google Scholar]
6. T. J. Jebaseeli, C. A. D. Durai and J. D. Peter, “Segmentation of retinal blood vessels from ophthalmologic diabetic retinopathy images,” Computers Electrical Engineering, vol. 73, no. 1, pp. 245–258, 2019. [Google Scholar]
7. M. N. Ozieh, K. G. Bishu, C. E. Dismuke and L. E. Egede, “Trends in health care expenditure in U.S adults with diabetes: 2002–2011,” Diabetes Care, vol. 38, no. 10, pp. 1844–1851, 2015. [Google Scholar]
8. L. Guariguata, D. R. Whiting, I. Hambleton, J. Beagley, U. Linnenkamp et al., “Global estimates of diabetes prevalence for 2013 and projections for 2035,” Diabetes Research and Clinical Practice, vol. 103, no. 2, pp. 137–149, 2014. [Google Scholar]
9. M. R. K. Mookiaha, U. R. Acharya, C. K. Chua, C. M. Lim, E. Y. K. Ng et al., “Computer-aided diagnosis of diabetic retinopathy: A review,” Computers in Biology and Medicine, vol. 43, no. 12, pp. 2136–2155, 2013. [Google Scholar]
10. R. J. Winder, P. J. Morrow, I. N. McRitchie, J. R. Bailie and P. M. Hart, “Algorithms for digital image processing in diabetic retinopathy,” Computerized Medical Imaging and Graphics, vol. 33, no. 8, pp. 608–622, 2009. [Google Scholar]
11. Y. Lecun, L. Bottou, Y. Bengio and P. Haffner, “Gradient-based learning applied to document recognition,” Proc. IEEE, vol. 86, no. 11, pp. 2278–2324, 1998. [Google Scholar]
12. A. Krizhevsky, I. Sutskever and G. E. Hinton, “ImageNet classification with deep convolutional neural networks,” Communications of the ACM, vol. 60, no. 6, pp. 84–90, 2017. [Google Scholar]
13. J. Deng, W. Dong, R. Socher, L. -J. Li, K. Li et al., “ImageNet: A large-scale hierarchical image database,” in IEEE Conf. on Computer Vision and Pattern Recognition, Miami, FL, pp. 248–255, 2009. [Google Scholar]
14. E. Topol, Deep Medicine: How Artificial Intelligence Can Make Healthcare Human Again. New York, USA: Basic Books, pp. 400–410, 2019. [Google Scholar]
15. L. M. Prevedello, S. S. Halabi, G. Shih, C. C. Wu, M. D. Kohli et al., “Challenges related to artificial intelligence research in medical imaging and the importance of image analysis competitions,” Radiology: Artificial Intelligence, vol. 1, no. 1, pp. 815–831, 2019. [Google Scholar]
16. G. Wang, J. C. Ye, K. Mueller and J. A. Fessler, “Image reconstruction is a new frontier of machine learning,” IEEE Transactions on Medical Imaging, vol. 37, no. 6, pp. 1289–1296, 2018. [Google Scholar]
17. G. Haskins, U. Kruger and P. Yan, “Deep learning in medical image registration: A survey,” Machine Vision Applications, vol. 31, no. 1, pp. 8–17, 2020. [Google Scholar]
18. Y. Wang, S. Nazir and M. Shafiq, “An overview on analyzing deep learning and transfer learning approaches for health monitoring,” Computational and Mathematical Methods in Medicine, vol. 2021, no. 1, pp. 555–570, 2021. [Google Scholar]
19. W. M. Gondal, J. M. Köhler, R. Grzeszick, G. A. Fink and M. Hirsch, “Weakly-supervised localization of diabetic retinopathy lesions in retinal fundus images,” in Proc. IEEE Int. Conf. on Image Processing (ICIP), Beijing, China, pp. 2069–2073, 2017. [Google Scholar]
20. G. García, J. Gallardo, A. Mauricio, J. López and C. D. Carpio, “Detection of diabetic retinopathy based on a convolutional neural network using retinal fundus images,” in Int. Conf. on Artificial Neural Networks and Machine Learning–ICANN, Alghero, Italy, pp. 1516–1530, 2017. [Google Scholar]
21. H. Pratt, F. Coenen, D. M. Broadbent, S. P. Harding and Y. Zheng, “Convolutional neural networks for diabetic retinopathy,” Procedia Computer Science, vol. 90, no. 1, pp. 200–205, 2016. [Google Scholar]
22. H. Zhuang and N. Ettehadi, “Classification of diabetic retinopathy via fundus photography: Utilization of deep learning approaches to speed up disease detection,” Electrical Engineering and Systems Science, vol. 35, no. 2, pp. 112–125, 2021. [Google Scholar]
23. N. Tajbakhsh, J. Y. Shin, S. R. Gurudu, R. T. Hurst, C. B. Kendall et al., “Convolutional neural networks for medical image analysis: Full training or fine tuning?,” IEEE Transactions on Medical Imaging, vol. 35, no. 5, pp. 1299–1312, 2016. [Google Scholar]
24. S. H. Kassani, P. Hosseinzadeh Kassani, R. Khazaeinezhad, M. Wesolowski, K. Schneider et al., “Diabetic retinopathy classification using a modified Xception architecture,” in IEEE Int. Symp. on Signal Processing and Information Technology (ISSPIT), Ajman, UAE, pp. 73–91, 2019. [Google Scholar]
25. B. Tymchenko, P. Marchenko and D. Spodarets, “Deep learning approach to diabetic retinopathy detection,” Computers and Statistics, vol. 5, no. 1, pp. 199–212, 2021. [Google Scholar]
26. N. Sikder, M. S. Chowdhury, A. Shamim Mohammad Arif and A. -A. Nahid, “Early blindness detection based on retinal images using ensemble learning,” in Int. Conf. on Computer and Information Technology (ICCIT), Dhaka, Bangladesh, pp. 1–6, 2019. [Google Scholar]
27. Y. Zhou, B. Wang, L. Huang, S. Cui and L. Shao, “A benchmark for studying diabetic retinopathy: Segmentation, grading, and transferability,” IEEE Transactions on Medical Imaging, vol. 40, no. 3, pp. 818–828, 2021. [Google Scholar]
28. W. Rawat and Z. Wang, “Deep convolutional neural networks for image classification: A comprehensive review,” Neural Computation, vol. 29, no. 9, pp. 2352–2449, 2017. [Google Scholar]
29. A. Canziani, A. Paszke and E. Culurciello, “An analysis of deep neural network models for practical applications,” Computer Vision and Pattern Recognition, vol. 5, no. 2, pp. 457–464, 2017. [Google Scholar]
30. K. He, X. Zhang, S. Ren and J. Sun, “Deep residual learning for image recognition,” Computer Vision and Pattern Recognition, vol. 12, no. 2, pp. 135–142, 2015. [Google Scholar]
31. APTOS Blindness Detection, 2019. [Online]. Available: https://kaggle.com/c/aptos2019-blindness-detection. [Google Scholar]
32. M. R. Prusty, T. Jayanthi and K. Velusamy, “Weighted-SMOTE: A modification to SMOTE for event classification in sodium cooled fast reactors,” Progress in Nuclear Energy, vol. 100, no. 1, pp. 355–364, 2017. [Google Scholar]
33. V. P. K. Turlapati and M. R. Prusty, “Outlier-SMOTE: A refined oversampling technique for improved detection of COVID-19,” Intelligence-Based Medicine, vol. 3-4, no. 1, pp. 100023, 2020. [Google Scholar]
34. N. Shivsharanr and S. Ganorkar, “Predicting severity of diabetic retinopathy using deep learning models,” International Research Journal on Advanced Science Hub, vol. 3, no. 1, pp. 67–72, 2021. [Google Scholar]
35. T. Iesmantas and R. Alzbutas, “Convolutional capsule network for classification of breast cancer histology images,” Computer Vision and Pattern Recognition, vol. 15, no. 1, pp. 517–524, 2018. [Google Scholar]
36. A. Kori, S. S. Chennamsetty, M. S. K. P. and V. Alex, “Ensemble of convolutional neural networks for automatic grading of diabetic retinopathy and macular edema,” Computer Vision and Pattern Recognition, vol. 10, no. 4, pp. 1355–1360, 2018. [Google Scholar]
37. C. Lam, D. Yi, M. Guo and T. Lindsey, “Automated detection of diabetic retinopathy using deep learning,” AMIA Summits on Translational Science Proceedings, vol. 2018, no. 1, pp. 147–155, 2018. [Google Scholar]
Cite This Article
 Copyright © 2023 The Author(s). Published by Tech Science Press.
This work is licensed under a Creative Commons Attribution 4.0 International License , which permits unrestricted use, distribution, and reproduction in any medium, provided the original work is properly cited.
 Downloads
 Citation Tools