
 Submit a Paper
 Propose a Special lssue
 Open Access
ARTICLE

Enhanced E-commerce Fraud Prediction Based on a Convolutional Neural Network Model
1 Chenzhou Vocational Technical College, Chenzhou, 423000, China
2 Hunan University of Finance and Economics, Changsha, 410205, China
3 University Malaysia Sabah, Kota Kinabalu, 88999, Malaysia
* Corresponding Author: Ling Liu. Email:
Computers, Materials & Continua 2023, 75(1), 1107-1117. https://doi.org/10.32604/cmc.2023.034917
Received 01 August 2022; Accepted 08 December 2022; Issue published 06 February 2023
 View Full Text
 Download PDF
Abstract
The rapidly escalating sophistication of e-commerce fraud in recent years has led to an increasing reliance on fraud detection methods based on machine learning. However, fraud detection methods based on conventional machine learning approaches suffer from several problems, including an excessively high number of network parameters, which decreases the efficiency and increases the difficulty of training the network, while simultaneously leading to network overfitting. In addition, the sparsity of positive fraud incidents relative to the overwhelming proportion of negative incidents leads to detection failures in trained networks. The present work addresses these issues by proposing a convolutional neural network (CNN) framework for detecting e-commerce fraud, where network training is conducted using historical market transaction data. The number of network parameters reduces via the local perception field and weight sharing inherent in the CNN framework. In addition, this deep learning framework enables the use of an algorithmic-level approach to address dataset imbalance by focusing the CNN model on minority data classes. The proposed CNN model is trained and tested using a large public e-commerce service dataset from 2018, and the test results demonstrate that the model provides higher fraud prediction accuracy than existing state-of-the-art methods.Keywords
The explosive development of e-commerce has greatly increased the extent of e-commerce fraud to the point that it has become one of the major forms of financial fraud prevalent today. Therefore, the probability of online merchants encountering fraudulent transactions is increasing at an astounding rate. Accordingly, the detection of e-commerce fraud has become a particularly important component of fraud prevention [1].
Early on in the development of e-commerce, the small transaction volume and relatively simple information involved in e-commerce transactions enabled human experts to formulate basic rules based on relevant knowledge and experience, and then incorporate those rules within risk control engines. Accordingly, conventional rule-based methods have been widely developed for detecting fraudulent financial activities over the years. For example, Dharwa et al. applied feature engineering methods to train their rule-based models based on statistical analyses of the historical data of users in terms of transaction times [1–2], transaction completion times, and night transactions. However, the sophistication of e-commerce fraud has rapidly escalated in recent years, and this has greatly reduced the effectiveness of rule-based methods. This trend has increasingly led to the development of fraud detection methods based on data mining and machine learning.
A number of representative data mining and machine learning methods have been applied for detecting fraudulent activities within a number of settings. For example, Huang proposed a data mining method for detecting anomalous economic activities indicative of fraud [3]. Stanley et al. applied data mining to analyze and predict incidents of academic fraud based on Weibo data [4]. In terms of conventional machine learning approaches, Stanley and Miikkulainen sought to improve the neural network performance of machine learning frameworks by implementing an evolutionary algorithm for adapting the topology of neural networks and thereby improving their prediction capabilities [4]. Ding applied a back propagation (BP) neural network to identify fraudulent e-commerce suppliers [5]. Renjith proposed a model based on the support vector machine (SVM) for detecting fraudulent sellers in online marketplaces [6], where the model was trained using historical market transaction data. Fang et al. developed a fraud detection system that could adapt to changes in fraud patterns using dynamic risk features with feedback control to develop real-time archives [7]. He et al. of Ant Financial Services Group established an online, real-time transaction fraud detection system [8], denoted as TitAnt, which was able to predict transaction fraud within a few milliseconds. Nascimento et al. sought to detect credit card fraud within a telephone set using nine acoustic index features and two different classifiers [9], including those based on logistic regression and random forest (RF) machine learning methods, through vibrational entropy.
However, data mining and conventional machine learning approaches suffer from the sparsity of positive fraud incidents relative to the overwhelming proportion of negative incidents, and these imbalances lead to detection failures. Numerous approaches have been applied to address this issue. For example, Nanduri et al. applied machine learning and periodic network optimization based on available data to reduce e-commerce fraud, and their approach effectively addressed challenges associated with both dynamic fraud and fraud escalation [10]. Similarly, Nanduri et al. proposed two frameworks, including a current environment inference framework and a future environment inference framework, to address the issue of delays in the labeling of fraudulent e-commerce transactions under the inherently uncertain probabilistic decision environment [11]. Kurshan et al. provided a unique solution for detecting financial crimes using graph-based technology [12]. Shen et al. proposed a deep learning model composed of a long-short-term-memory (LSTM) network and the adaptive boosting (AdaBoost) algorithm for evaluating credit risk and applied an improved synthetic minority oversampling technique (SMOTE) to address dataset imbalances effectively [13]. Bekirev et al. proposed the Financial Service scenario Deep learning based Behavior data representation method for Clustering (FinDeepBehaviorCluster) approach for detecting fraudulent e-commerce transactions using unstructured behavioral sequence data [14]. Wassan et al. evaluated the detection performances of fraudulent transaction detection methods based on various machine learning algorithms [15], including SVM, k-nearest neighbors clustering, RF, decision tree (DT), and a multilayer perceptron (MLP) network, when applied to large e-commerce and e-banking datasets, and the method based on the MLP network attained the highest precision of 97%. Finally, the problems associated with dataset imbalances in e-commerce transactions were explicitly addressed by Kanika et al. where a novel loss function was applied to focus the model learning more on the minority class of fraudulent transactions [16].
However, the above-discussed machine learning approaches tend to suffer from an excessively high number of network parameters, which decreases the efficiency and increases the difficulty of training the network, while simultaneously leading to network overfitting. Yan addressed this issue, and demonstrated the successful application of a convolutional neural network (CNN) for implementing peer-to-peer (P2P) fraud detection in online loan credit transactions [17]. Here, a CNN is a widely used deep neural network model [18]. These deep learning models include a local perception field and weight-sharing characteristics that can reduce the complexity of the model by decreasing the number of connections between the various layers of the network [19]. However, to the authors’ best knowledge, no effort has been made to address the problem of dataset imbalance when applying a CNN framework for detecting fraudulent e-commerce transactions.
1.3 Contributions of Current Research
This paper addresses the above-discussed limitations in past efforts to apply machine learning to detect fraudulent e-commerce transactions by combining a CNN framework with the previously proposed algorithmic-level approach to focus the model learning more on the minority class of fraudulent transactions [16]. The proposed CNN model is trained and tested using a large public e-commerce service dataset from 2018, and the test results are compared with those obtained using conventional approaches, including those based on logistic, SVM, and RF models. The results demonstrate that the proposed model provides a fraud prediction accuracy rate of 83.60%, which is greater than all existing state-of-the-art methods.
2 Convolutional Neural Network Model
The standard CNN model was developed according to much earlier work on the concept of the local receptive field conducted in 1959 by Hube et al. [20]. The basic CNN structure is illustrated in Fig. 1. A CNN consists of an input layer, a combination of n convolutional layers and pooling layers, and a fully connected multilayer perceptron classifier. In any convolutional layer, a neuron connects only to some of its neighboring neurons, and a convolution kernel is convolved along input features to provide responses denoted as feature maps.
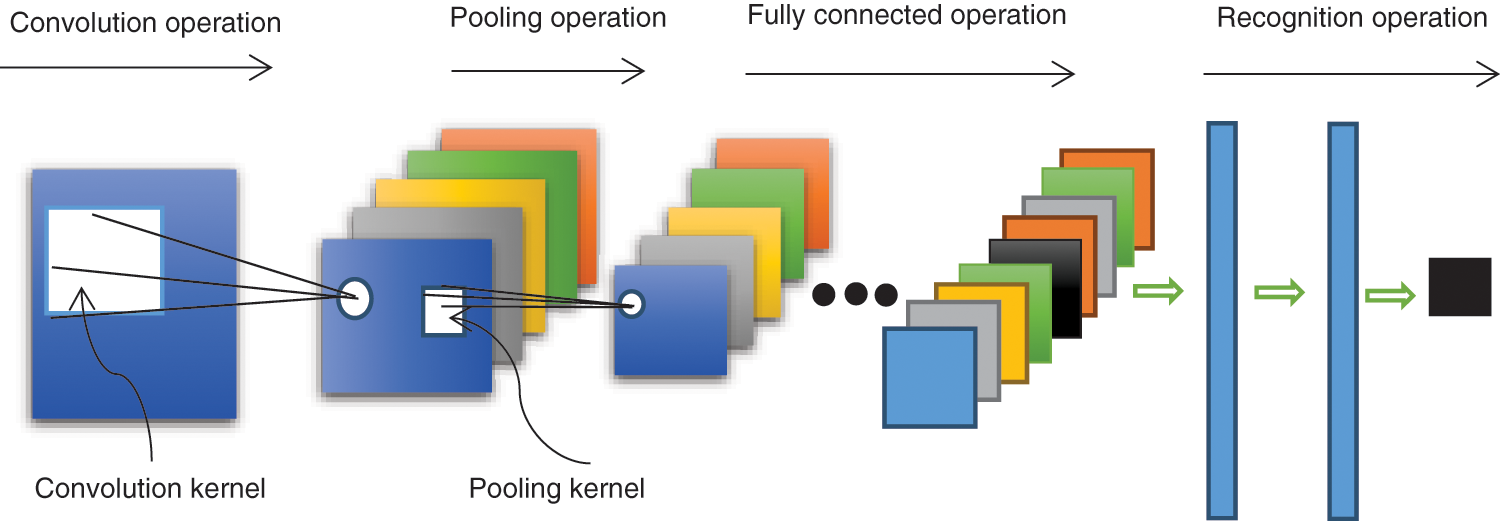
Figure 1: Schematic illustrating a standard CNN model structure
The configuration of neuron connections under a fully-connected condition is illustrated in Fig. 2. In the local connection graph, if each neuron connects to only 10 × 10 = 100-pixel values, then the weight data associated with those connections represent 1,000,000 × 100 parameters. In contrast, the configuration of neuron connections under a partially-connected condition is illustrated in Fig. 3, where those 100-pixel values correspond to only 10 × 10 = 100 parameters, which is reduced to one ten-thousandth of the original number of parameters.
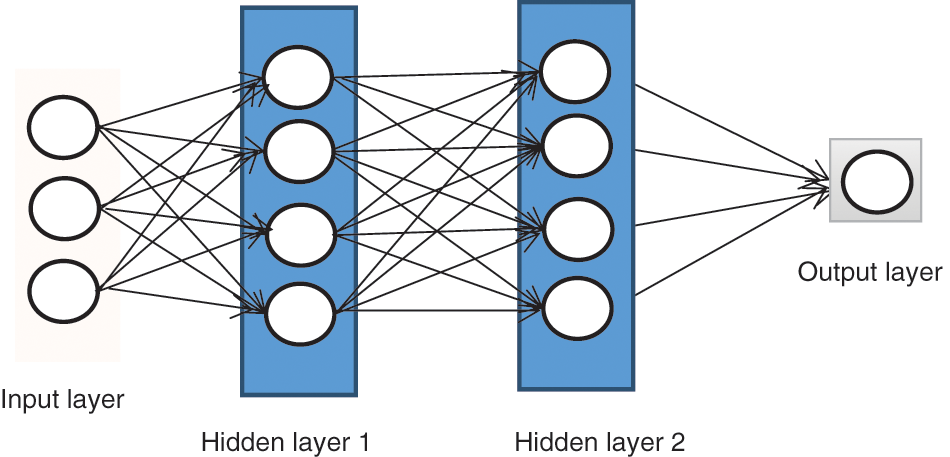
Figure 2: Full connection
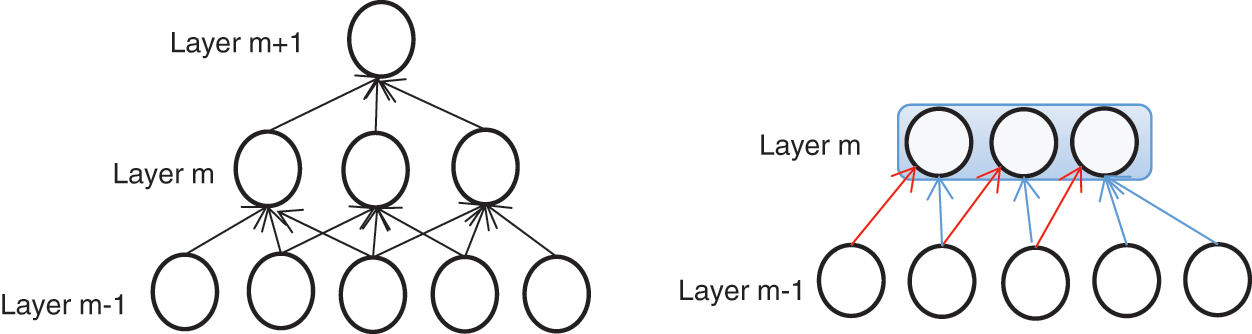
Figure 3: Partial connection
The convolution operation with a 3 × 3 kernel applied to a 5 × 5 pixel image section is illustrated in Fig. 4. As can be seen in the figure, each application of the convolution kernel filters out the part of the image that meets the conditions (the larger the activation value, the more qualified it is). However, the number of parameters remaining after applying the convolution operation is still too many. Therefore, the weight-sharing process continues. In the local connections illustrated in Fig. 3, each neuron includes 100 parameters. However, 1,000,000 neurons would still only include 100 parameters if the parameters of all neurons were equal. In this case, the statistical properties extracted for any section of the image by the convolution operation would be the same as those extracted for all the other sections. Therefore, any features learned in any section can also be applied in any other section. Convolution at any position on the image can obtain the activation values of different features.
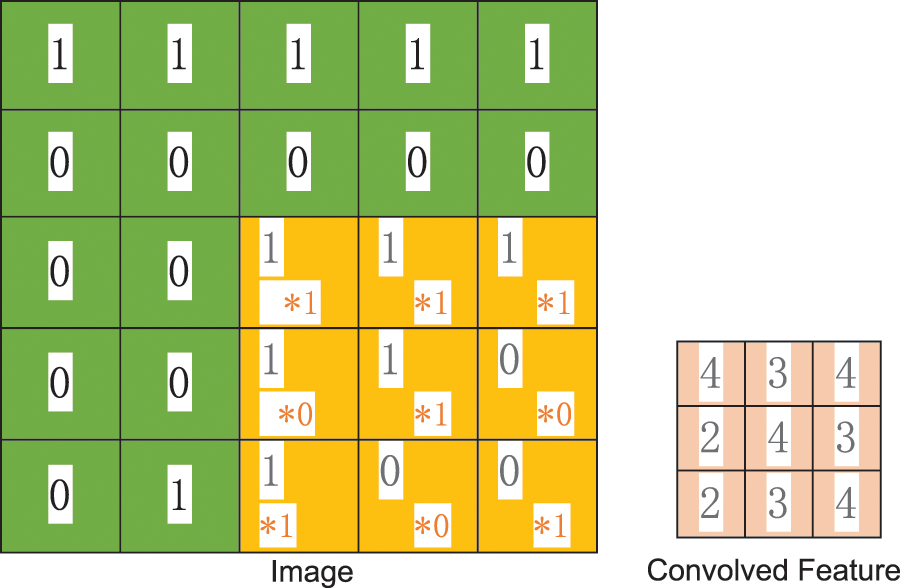
Figure 4: Convolution screening process
2.3 Multiple Convolution Kernels
Under the above-described conditions when each neuron includes only 100 parameters, the convolution process involves only a single 10 × 10 convolution kernel. Obviously, the feature extraction obtained under this condition is not sufficient to support accurate model predictions. This is addressed by adopting multiple convolution kernels, where each kernel is capable ostensibly of extracting a unique feature. This process is illustrated in Fig. 5 for four convolution kernels. As can be seen, each convolution kernel generates another image, which can be regarded as a different channel from the original image.
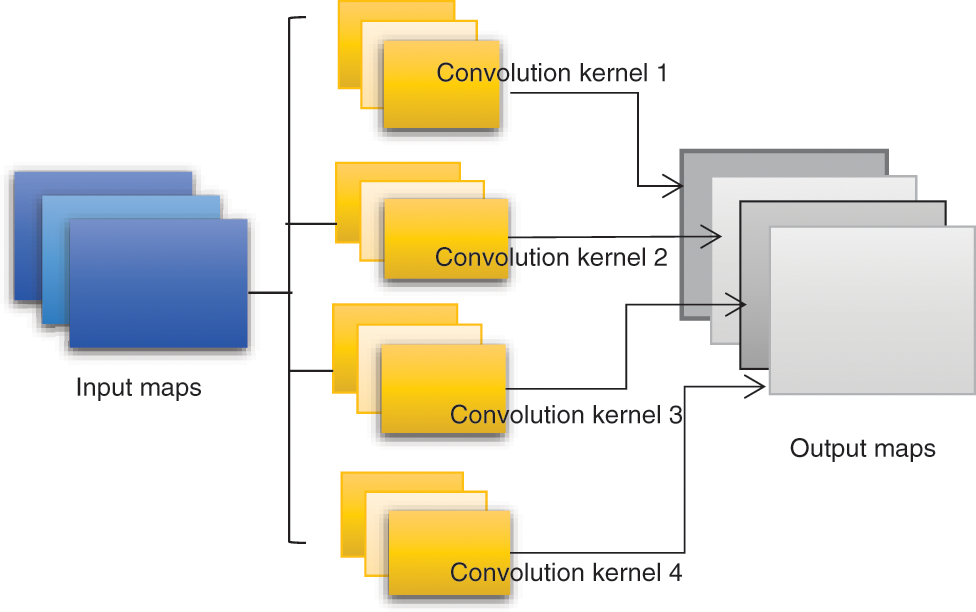
Figure 5: Multiple convolution kernels
The convolution operation obtaining two channels via the convolution of four channels is illustrated in Fig. 6. Focusing on section w0, the value at position (i, j) of w0 is obtained by adding the convolution results generated at that position on all four channels, and this value is then passed through the following activation function.
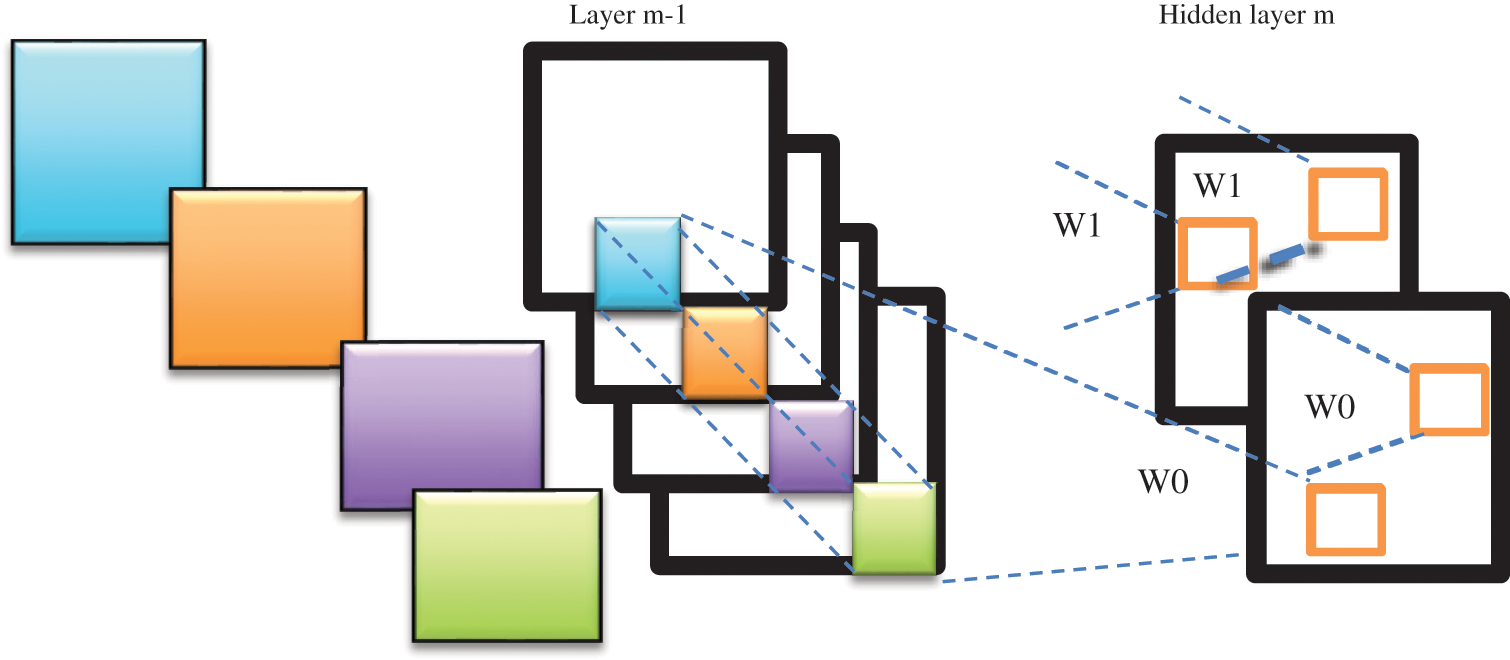
Figure 6: Convolution operation on four channels
This non-linear activation function theoretically enables the CNN model to fit any function. Based on this discussion, the final number of parameters is the product of the original 4 channels, the 2 resulting channels, and the 2 × 2 = 4 pixel convolution kernels, for a total of 4 × 2 × 4 = 32 parameters.
2.4 Multiple Convolutional Layers
The features learned by a single convolutional layer typically represent only local characteristics. Therefore, multiple convolutional layers have generally been employed in practical CNN applications, where the extracted features attain increasingly global characteristics with an increasing number of convolutional layers, and then the fully connected layer is used for training.
3 Empirical Results and Analysis
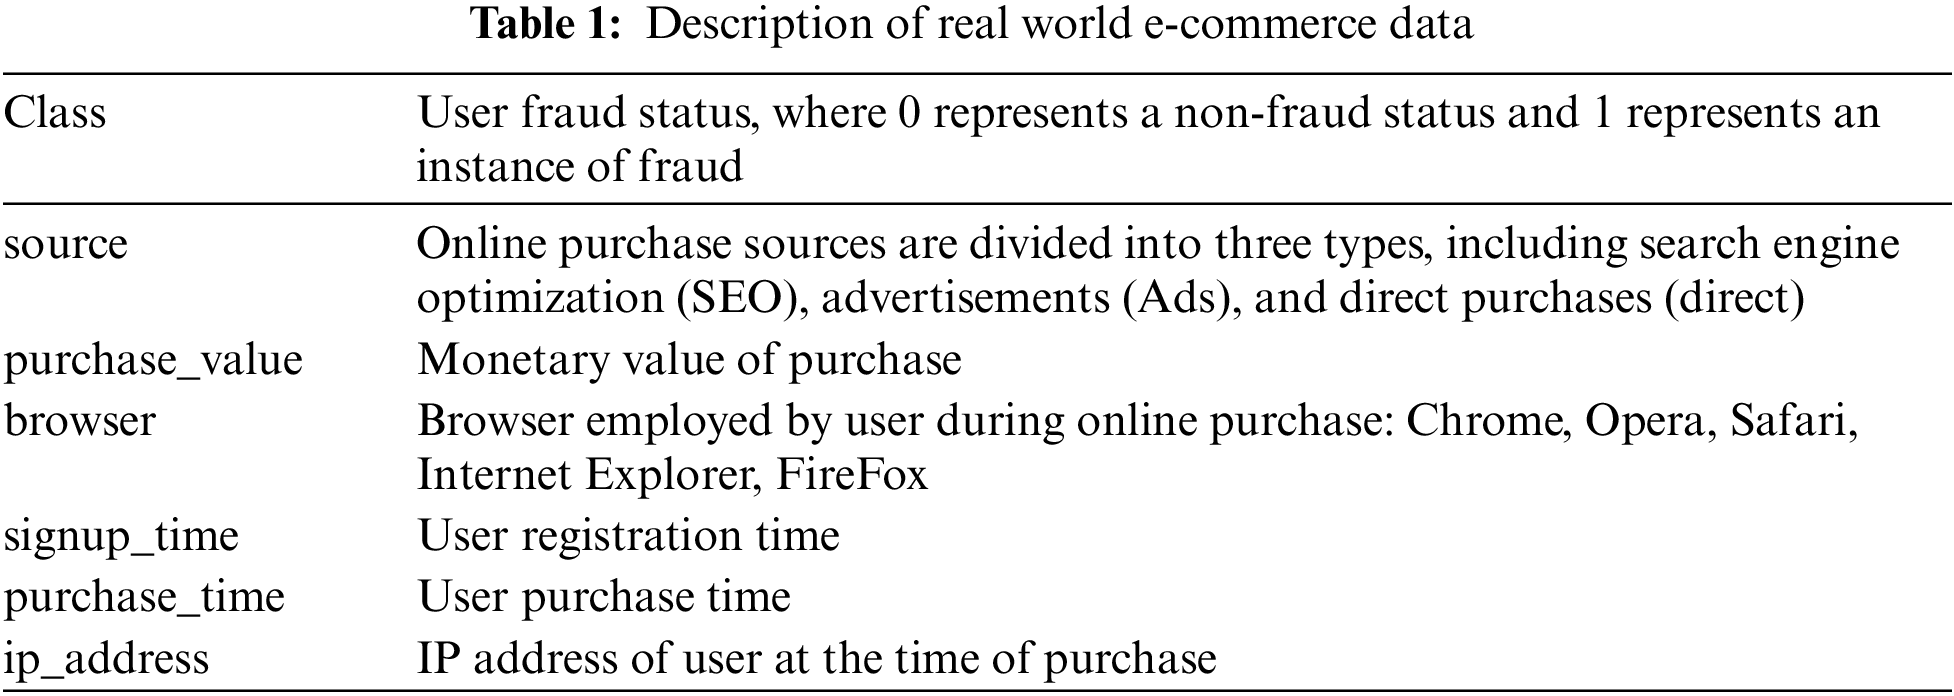
Real-world, open-source e-commerce service data from 2018 was obtained from the Kaggle website. This represents a total of 151,113 complete data samples. Table 1 lists the primary variables included within each data sample.
The values X in each data sample are first standardized to a variance of 1 to improve their comparability by applying the z-score standardization method as follows.
Where X is the individual observation value, and μ is the overall average, δ is the population standard deviation. The dataset imbalance issue is initially addressed by subjecting the data samples to random undersampling, thereby generating a greater balance between data samples with class values of 0 and 1. This process decreased the total number of data samples from 151,113 to 50,940. Finally, the data samples are randomly shuffled to ensure that the data samples employed during the training, testing, and validation operations are more representative of all the available datasets to the population.
3.1.3 Training, Validation and Testing Sets
The preprocessed data samples are assembled into training, validation, and testing datasets according to the ratio 7:1:1. Therefore, the training dataset included 39,620 data samples and the validation and testing datasets included 5,660 data samples each. Both the validation and testing datasets included 634 data samples in the fraudulent class (i.e., class = 1). Here, the samples in the training dataset are naturally used for training the proposed CNN model, as well as the other models considered. Meanwhile, the samples in the validation dataset were used for parameter tuning or model optimization, and the samples in the testing dataset were used to evaluate the prediction effect of the proposed CNN model, and those of the other models considered.
The CNN model employed in the empirical analyses adopted the classic LeNet-5 and GoogLeNet architectures, and the model is illustrated schematically in Fig. 7. The data samples include user behavior records and basic user attributes, which are respectively converted into matrices and vectors, and input to the CNN. The global average pooling and rasterization of the convolutional layers and pooling layers are conducted in layer X, and the prediction results are output through the multilayer perceptron N.
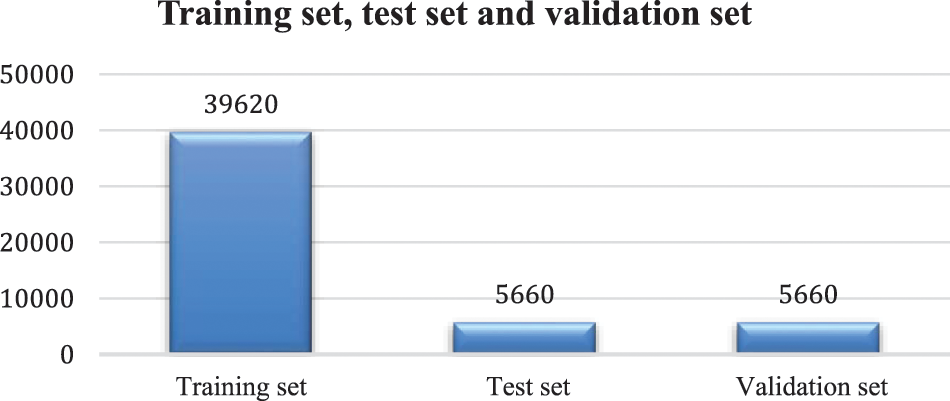
Figure 7: Training set, test set and validation set
The details of the convolutional layers are given as follows. The characteristics of each user's behavior at different points in time are extracted in the first convolutional layer (C1) by means of 32 convolution kernels with a size of 7 × 7. The first convolutional layer is followed by a 3 × 3 maximum pooling layer (S1), which provides secondary feature extraction, where each neuron gathers only locally accepted domains. The first maximum pooling layer is then connected to the second convolution layer (C2), which again applies 32, 7 × 7 convolution kernels with the purpose of further extracting the characteristics of each user's behavior at different points in time. The second convolutional layer is then connected to a 2 × 2 maximum pooling layer (S2). Finally, S2 is connected to a third convolution layer (C3), which also applies 32, 7 × 7 convolution kernels to further extract the characteristics of each user’s behavior.
3.2.2 Preliminary Forecast Results
The CNN model was trained using the training dataset. The significant parameters adopted in the training process include the learning rate, which refers to the size of the update network weight in the optimization algorithm, and the number of iterations, which refers to the number of times the entire training dataset is input to the neural network during the training process. In addition, the batch size is an equally important parameter. As preliminary settings, a number of iterations of 29, a batch size of 40, and an activation function (1) was applied in the convolutional layer and fully connected layer. By using the model shown in Fig. 8, the value of the loss function decreased to 0.362 after repeated training cycles. Then, the testing dataset was input to the trained CNN model, and the preliminary prediction results are listed in Table 2.
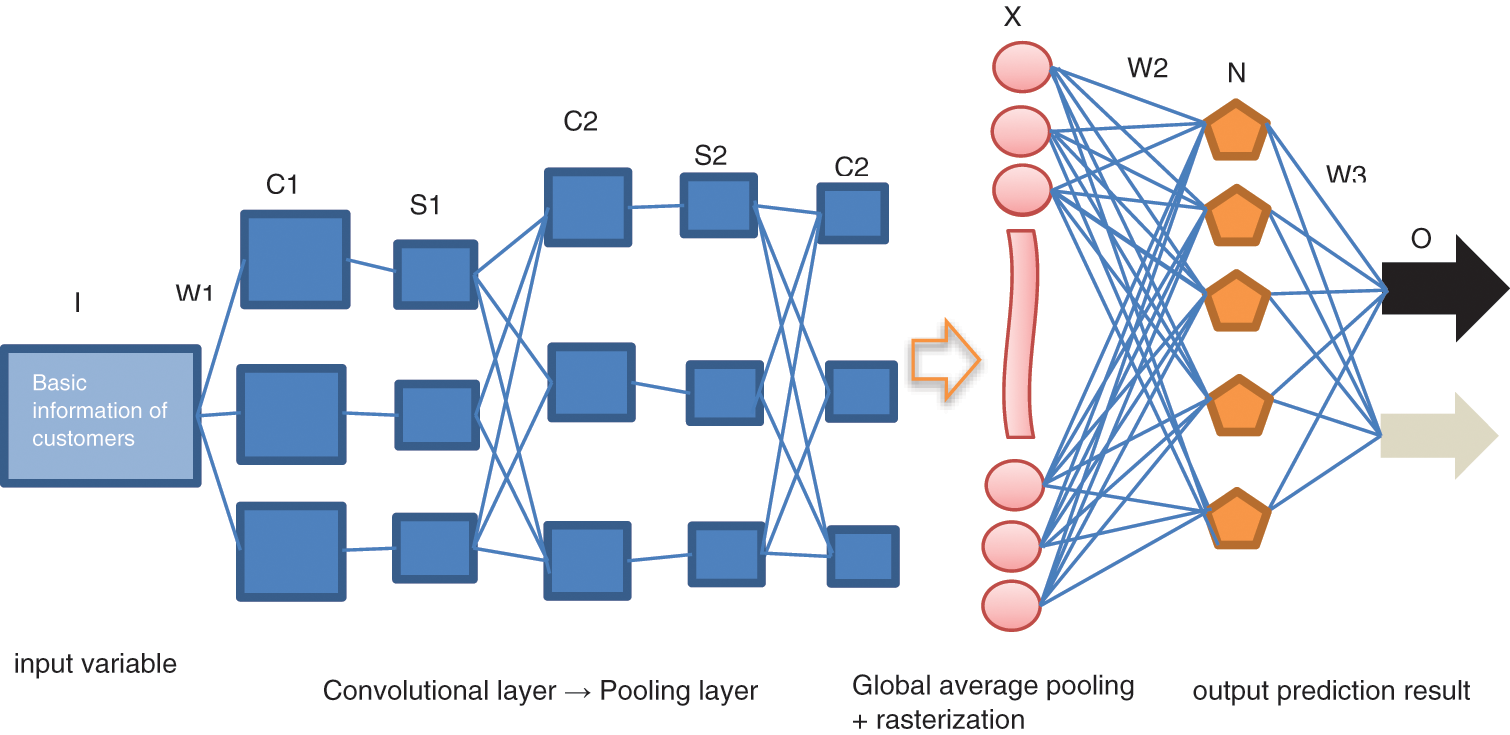
Figure 8: E-commerce fraud prediction model structure based on CNN
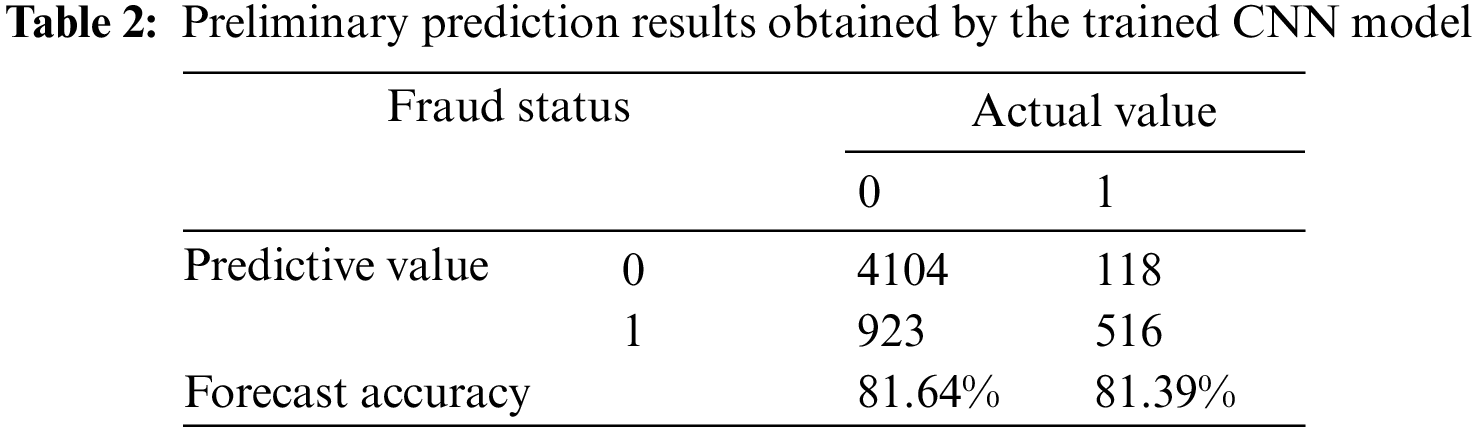
According to the results, it can be seen that the CNN model obtained a prediction accuracy of 81.64% for true negative (TN) samples (i.e., non-fraud status), while an accuracy of 81.39% was obtained for true positive (TP) samples. In addition, the results yielded a false positive (FP) rate of 18.36% and a false negative (FN) rate of 18.61%. Overall, the preliminary forecast results basically meet the expected requirements.
The prediction effect of the trained CNN obtained for the validation dataset was then optimized to determine the optimal training parameters. Accordingly, the CNN model was retrained at a learning rate of 0.01, a number of iterations set at 25, and a batch size of 40, while the rectified linear (ReLU) function was applied as the activation function in the convolutional layer, and the sigmoid function was the activation function applied in the fully connected layer. The loss function value obtained at each iteration of the training process is presented in Fig. 9. We note that the loss function value decreased to 0.336 under the optimized training process. The prediction results obtained by the optimized CNN model are listed in Table 3.
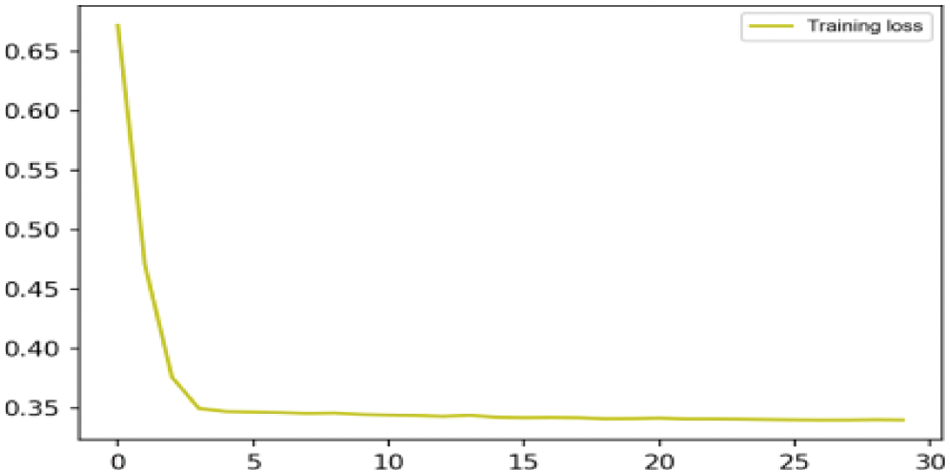
Figure 9: Preliminary prediction result loss value
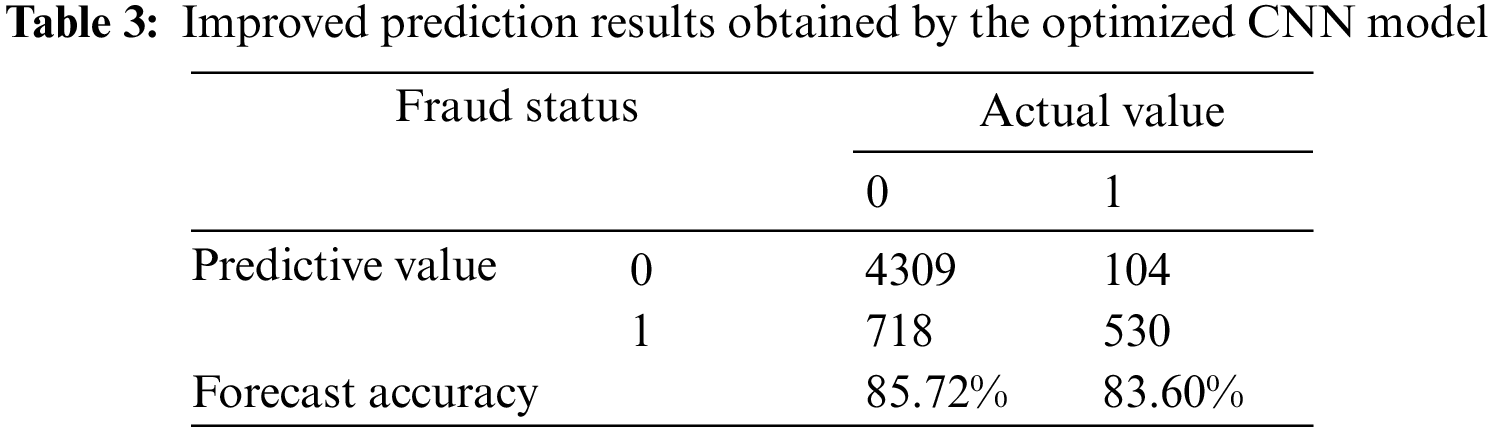
It can be seen from the prediction results that the optimized CNN model obtained considerably improved prediction accuracies of 85.72% for TN samples and 83.60% for TP samples, while the results yielded FP and FN rates of 14.28% and 16.40%, respectively.
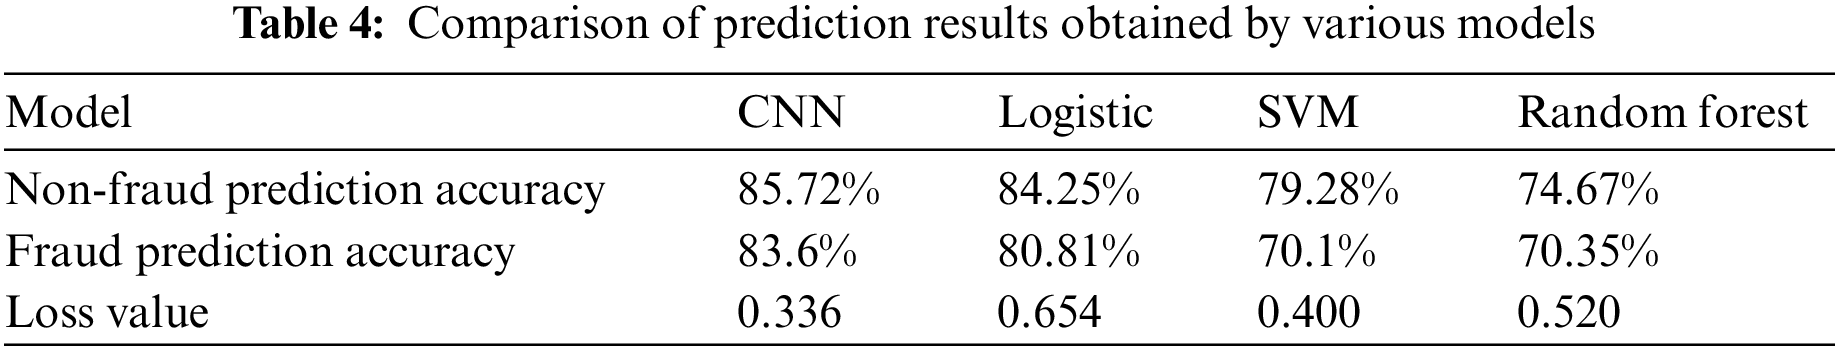
The prediction results obtained for the conventional logistic, SVM, and RF models are listed in Table 4 along with the results presented in Table 3 for the proposed CNN model. We note that the TN prediction accuracy of the CNN model is less than 2% better than the logistic model, which was the next highest-performing model considered. However, the accuracy of predicting normal conditions is of no interest when conducting fraud risk assessment in e-commerce settings. Here, the key issue is accurately detecting actual incidences of fraud. Therefore, the fact that the TP prediction accuracy of the CNN model is 3.4% better than the logistic model represents a substantial improvement. Moreover, this means that the proposed CNN model predicted 19 more instances of fraud than the logistic model out of the 643 total incidences in the testing dataset. As such, the use of the CNN model represents considerable financial savings over the use of a conventional fraud detection method. CNN model is the state-of-the-art result model.
The present work addressed the excessively high number of parameters involved with conventional network approaches for detecting fraudulent activities in an e-commerce setting, and further addressed the problem of dataset imbalance by combining a CNN framework with an algorithmic-level approach to focus model learning more on the minority class of fraudulent transactions. The proposed CNN model was trained, optimized, and tested using 50,940 real-world e-commerce service data samples. In addition, the prediction results were compared with those obtained using conventional approaches, including those based on logistic, SVM, and RF models. The results demonstrated that the proposed model provides a fraud prediction accuracy rate of 83.60%, which is at least 3.4% greater than all the existing state-of-the-art methods considered. A key issue that remains to be addressed involves the application of fraud prediction methods to new users for which no past features are available (i.e., the cold start problem). This is a particularly significant problem for CNN-based methods because the input data required for training the model is unavailable for a new user. The prospect of introducing extensions to the CNN model to address this issue will be investigated in future work.
Acknowledgement: We thank Letpub (https://www.letpub.com) for linguistic assistance and pre-submission expert review.
Funding Statement: This work was supported by the National Natural Science Foundation of China (No. 72073041, No. 61903131); 2020 Hunan Provincial Higher Education Teaching Reform Research Project (Nos. HNJG–2020–1130, HNJG–2020–1124); and 2020 General Project of Hunan Social Science Fund (No. 20B16). Outstanding Youth of Department of Education of Hunan Province (No. 20B096) and the China Postdoctoral Science Foundation (No. 2020M683715).
Conflicts of Interest: The authors declare that they have no conflicts of interest to report regarding the present study.
References
1. N. D. Jyotindra and A. R. Patel, “A data mining with hybrid approach based transaction risk score generation model (TRSGM) for fraud detection of online financial transaction,” International Journal of Computer Applications, vol. 16, no. 1, pp. 18–25, 2011. [Google Scholar]
2. S. Panigrahi, A. Kunduet, S. Sural and A. K. Majumdar, “Credit card fraud detection: A fusion approach using Dempster–Shafer theory and Bayesian learning,” Information Fusion, vol. 10, no. 4, pp. 354–363, 2009. [Google Scholar]
3. K. Kanika, J. Singla, A. K. Bashir, Y. Nam, N. U. Hasan et al., “Handling class imbalance in online transaction fraud detection,” Computers, Materials & Continua, vol. 70, no. 2, pp. 2861–2877, 2022. [Google Scholar]
4. K. O. Stanley and R. Miikkulainen, “Evolve the neural network by enhancing the T topology,” Evolutionary Computation, vol. 10, no. 2, pp. 99–127, 2002. [Google Scholar]
5. H. Zhou, G. Sun, S. Fu, X. Fan, W. Jiang et al., “A distributed approach of big data mining for financial fraud detection in a supply chain,” Computers, Materials & Continua, vol. 64, no. 2, pp. 1091–1105, 2020. [Google Scholar]
6. S. Renjith, “Detection of fraudulent sellers in online marketplaces using support vector machine approach,” International Journal of Engineering Trends and Technology, vol. 57, no. 1, pp. 48–53, 2018. [Google Scholar]
7. Y. Fang, Y. Zhang and C. Huang, “Credit card fraud detection based on machine learning,” Computers, Materials & Continua, vol. 61, no. 1, pp. 185–195, 2019. [Google Scholar]
8. S. He, J. Zheng, J. Lin, T. Tang, J. Zhao et al., “Classification-based fraud detection for payment marketing and promotion,” Computer Systems Science and Engineering, vol. 35, no. 3, pp. 141–149, 2020. [Google Scholar]
9. D. C. Nascimento, B. Barbosa, A. M. Perez and D. O. Caires, “Risk management in e-commerce-a fraud study case using acoustic analysis through its complexity,” Entropy, vol. 21, no. 11, pp. 1–12, 2019. [Google Scholar]
10. J. Nanduri, Y. Jia and A. Oka, “Microsoft uses machine learning and optimization to reduce e-commerce fraud,” INFORMS, vol. 50, no. 1, pp. 64–79, 2020. [Google Scholar]
11. J. Nanduri, Y. Jia, A. Oka, J. Beaver and Y. W. Liu, “Microsoft uses machine learning and optimization to reduce E-Commerce fraud,” INFORMS Journal on Applied Analytics, vol. 50, no. 1, pp. 64–79, 2020. [Google Scholar]
12. E. Kurshan and H. Shen, “Graph computing for financial crime and fraud detection: Trends, challenges and outlook,” International Journal of Semantic Computing, vol. 14, no. 4, pp. 565–589, 2020. [Google Scholar]
13. F. Shen, X. Zhao, G. Kou and F. E. Alsaadi, “A new deep learning ensemble credit risk evaluation model with an improved synthetic minority oversampling technique,” Applied Soft Computing, vol. 98, no. 1, pp. 106–122, 2021. [Google Scholar]
14. A. S. Bekirev, V. V. Klimov and M. V. Kuzin, “Payment card fraud detection using neural network committee and clustering,” Neural Networks, vol. 24, no. 2, pp. 193–200, 2015. [Google Scholar]
15. S. Wassan1, C. Xi1, N. Jhanjhi and H. Raza, “A smart comparative analysis for secure electronic websites,” Computers, Materials & Continua, vol. 30, no. 1, pp. 187–199, 2021. [Google Scholar]
16. S. Kanika, S. Jimmy, A. K. Bashir, Y. Nam and N. U. Hasan, “Handling class imbalance in online transaction fraud detection,” Computers, Materials & Continua, vol. 70, no. 2, pp. 2861–2877, 2022. [Google Scholar]
17. H. Li, S. Zhuang and Y. Ma, “Benign and malignant classification of mammogram images based on deep learning,” Biomedical Signal Processing and Control, vol. 51, no. 3, pp. 347–354, 2019. [Google Scholar]
18. Z. Feiyan, J. Linpeng and D. Jun, “Review of convolutional neural network research,” Journal of Computer Science, vol. 40, no. 6, pp. 23–35, 2017. [Google Scholar]
19. A. Krizhevsky, I. Sutskever and G. E. Hinton, “ImageNet classification with deep convolutional neural networks,” Communications of the ACM, vol. 60, no. 6, pp. 1–9, 2017. [Google Scholar]
20. D. H. Hube and T. N. Wiesel, “Early exploration of the visual cortex,” Neuron, vol. 20, no. 3, pp. 401–412, 1998. [Google Scholar]
Cite This Article
 Copyright © 2023 The Author(s). Published by Tech Science Press.
This work is licensed under a Creative Commons Attribution 4.0 International License , which permits unrestricted use, distribution, and reproduction in any medium, provided the original work is properly cited.
 Downloads
 Citation Tools