
 Submit a Paper
 Propose a Special lssue
 Open Access
ARTICLE

Optimal Hybrid Deep Learning Enabled Attack Detection and Classification in IoT Environment
College of Computing and Information Technology, Shaqra University, Sharqa, Saudi Arabia
* Corresponding Author: Fahad F. Alruwaili. Email:
Computers, Materials & Continua 2023, 75(1), 99-115. https://doi.org/10.32604/cmc.2023.034752
Received 26 July 2022; Accepted 20 October 2022; Issue published 06 February 2023
 View Full Text
 Download PDF
Abstract
The Internet of Things (IoT) paradigm enables end users to access networking services amongst diverse kinds of electronic devices. IoT security mechanism is a technology that concentrates on safeguarding the devices and networks connected in the IoT environment. In recent years, False Data Injection Attacks (FDIAs) have gained considerable interest in the IoT environment. Cybercriminals compromise the devices connected to the network and inject the data. Such attacks on the IoT environment can result in a considerable loss and interrupt normal activities among the IoT network devices. The FDI attacks have been effectively overcome so far by conventional threat detection techniques. The current research article develops a Hybrid Deep Learning to Combat Sophisticated False Data Injection Attacks detection (HDL-FDIAD) for the IoT environment. The presented HDL-FDIAD model majorly recognizes the presence of FDI attacks in the IoT environment. The HDL-FDIAD model exploits the Equilibrium Optimizer-based Feature Selection (EO-FS) technique to select the optimal subset of the features. Moreover, the Long Short Term Memory with Recurrent Neural Network (LSTM-RNN) model is also utilized for the purpose of classification. At last, the Bayesian Optimization (BO) algorithm is employed as a hyperparameter optimizer in this study. To validate the enhanced performance of the HDL-FDIAD model, a wide range of simulations was conducted, and the results were investigated in detail. A comparative study was conducted between the proposed model and the existing models. The outcomes revealed that the proposed HDL-FDIAD model is superior to other models.Keywords
The rapid progression of the Internet of Things (IoT) phenomenon in industrial sectors has increased the susceptibility of crucial network structures to severe cyber-attacks. The Industrial IoT (IIoT) environment helps resolve several intractable problems in the industry by providing real-time response systems and permitting the self-controlling systems to function separately [1]. To ensure an effective roll-out of the IIoT applications, it is important to investigate the security problems in detail and overcome them. To be specific, it is highly complex to detect stealthy assaults like False Data Injection Attacks (FDIA) on Predictive Maintenance (PdM) mechanisms because of the nature of the attack [2]. In False Data Injection Attack (FDIA), an attacker stealthily negotiates the dimensions from the IoT sensors. Likewise, the manipulated sensor dimensions evade the sensor’s fundamental ‘faulty data’ recognition system and proliferate to hide the resultant values of the sensors. ‘False Data Injection’ (FDI) attack is a type of major assault that can affect these mechanisms. In general, the FDI attacks cause severe issues in industrial structures. It corrupts the sensor dimensions to deceive the assaulted industrial platform [3].
The FDI assaults are applied by intruding on the data processing programs, sensors, and sensor communication structures. These attacks tend not to showcase their effects on the PdM mechanism [4]. However, the attack proliferates from the sensor to the Machine Learning (ML) part of the PdM mechanism and misleads the network by predicting the deferred asset failure or maintaining the interval. This mechanism tends to incur heavy losses in terms of human lives, and at times, it also results in the unintended failure of dangerous applications [5]. With the help of the latest DL approaches, the engine can forecast its future demands, execute adjustments, and save about 15% of fuel usage. But, the susceptibility of the sensor attacks towards these ML-related and IoT engines is considered a crucial challenge [6]. The existing sensor attack recognition solutions in the Cyber-Physical Systems (CPS) and IoT fields are inadequate to address this problem. This is attributed to the fact that whenever such traditional systems are positioned separately among the millions of sensors, it suffers from scalability issues and source overhead since several IoT networks face constraint in terms of energy [7].
The FDIAs tend to harm the external elements, resulting in enormous economic loss and life-threatening cases [8]. Thus, it becomes necessary to detect and prevent the FDIAs in any serious structure [9]. Several prevailing solutions are either theoretical or only implement the methods in cyberspace, like Intrusion Prevention Systems (IPS) that are generally utilized for protecting traditional computer networks. The existing methods lack specific security properties and cannot handle critical infrastructure, high rate of events, the requirement for real-time detection and interaction requirement, a pro-active defense, and a complicated cyber and physical interface [10]. In this background, the current research work attempts to overcome the issues with the help of ML approaches to detect injection attacks.
1.1 Existing FDI Detection Approaches
Aboelwafa et al. [11] proposed a new approach for FDI attack recognition with the help of Auto Encoders (AEs). It exploited the sensor information about time and space, and the proposed method excelled in classifying the falsified data. In addition, the falsified data was also cleaned with the help of the Denoising Autoencoders (DAEs). The performance was estimated to demonstrate the proposed approach’s achievement in identifying the FDI attacks. It also considerably demonstrated a Support Vector Machine (SVM)-based method to achieve a similar goal. Alromih et al. [12] examined a Randomized Watermarking Filtering Scheme (RWFS) for IoT applications, offering an en-route filter to remove the injected data at an initial communication phase. The injected data were filtered based on a watermark applied in the original information and embedded directly from arbitrary places throughout the packet payload. This mechanism utilized the Homomorphic Encryption approaches to conceal the reported measurement in several adversaries.
In literature [13], a Hybrid GSW (Gentry, Sahai, and Waters) and DM (Ducas and Micciancio)-related Fully Homomorphic Encryption (HGSW–DM–FHE) approach was presented to control the FDIA in privacy-preserving data aggregation in the fog computing environment. The presented HGSW–DM–FHE method was found to be extremely fault-tolerant, and the data aggregation procedure in another device did not impact even in the case of the failure of fog devices. Moudoud et al. [14] introduced a hierarchical structure to secure the 5G-enabled IoT networks and a security method to forecast and recognize FDIA and DDoS attacks. The presented security approach was developed based on the Markov stochastic procedure. The method tracked every network device’s performance and utilised a range-based behaviour-sifting policy. Wang et al. [15] examined a DL-related Locational Detection (DLLD) structure to find the particular places of FDIA on a real-time basis. The DLLD structure was developed by combining the Convolutional Neural Network (CNN) with a typical Bad Data Detector (BDD). The BDD was utilized to remove the minimum quality data. The modified CNN was utilized for multi-label classification to capture the inconsistency and co-occurrence dependencies from the power flow measurement because of potential attacks.
The current research article develops a Hybrid Deep Learning to Combat Sophisticated False Data Injection Attacks detection (HDL-FDIAD) in the IoT environment. The presented HDL-FDIAD model exploits the Equilibrium Optimizer-based Feature Selection (EO-FS) technique to select the optimal subset of features. Moreover, the Long Short-Term memory with Recurrent Neural Network (LSTM-RNN) model is utilized for classification. At last, the Bayesian Optimization (BO) algorithm is employed as a hyperparameter optimizer in this study. To validate the enhanced performance of the proposed HDL-FDIAD model, a wide range of simulations was conducted, and the results were investigated under different measures.
The current research article proposes a novel HDL-FDIAD model to determine the FDI attacks in the IoT environment. The HDL-FDIAD model exploits the EO-FS technique to select the optimal subset of features. Moreover, the BO with LSTM-RNN model is also utilized for classification. Fig. 1 illustrates the block diagram of the proposed HDL-FDIAD approach.
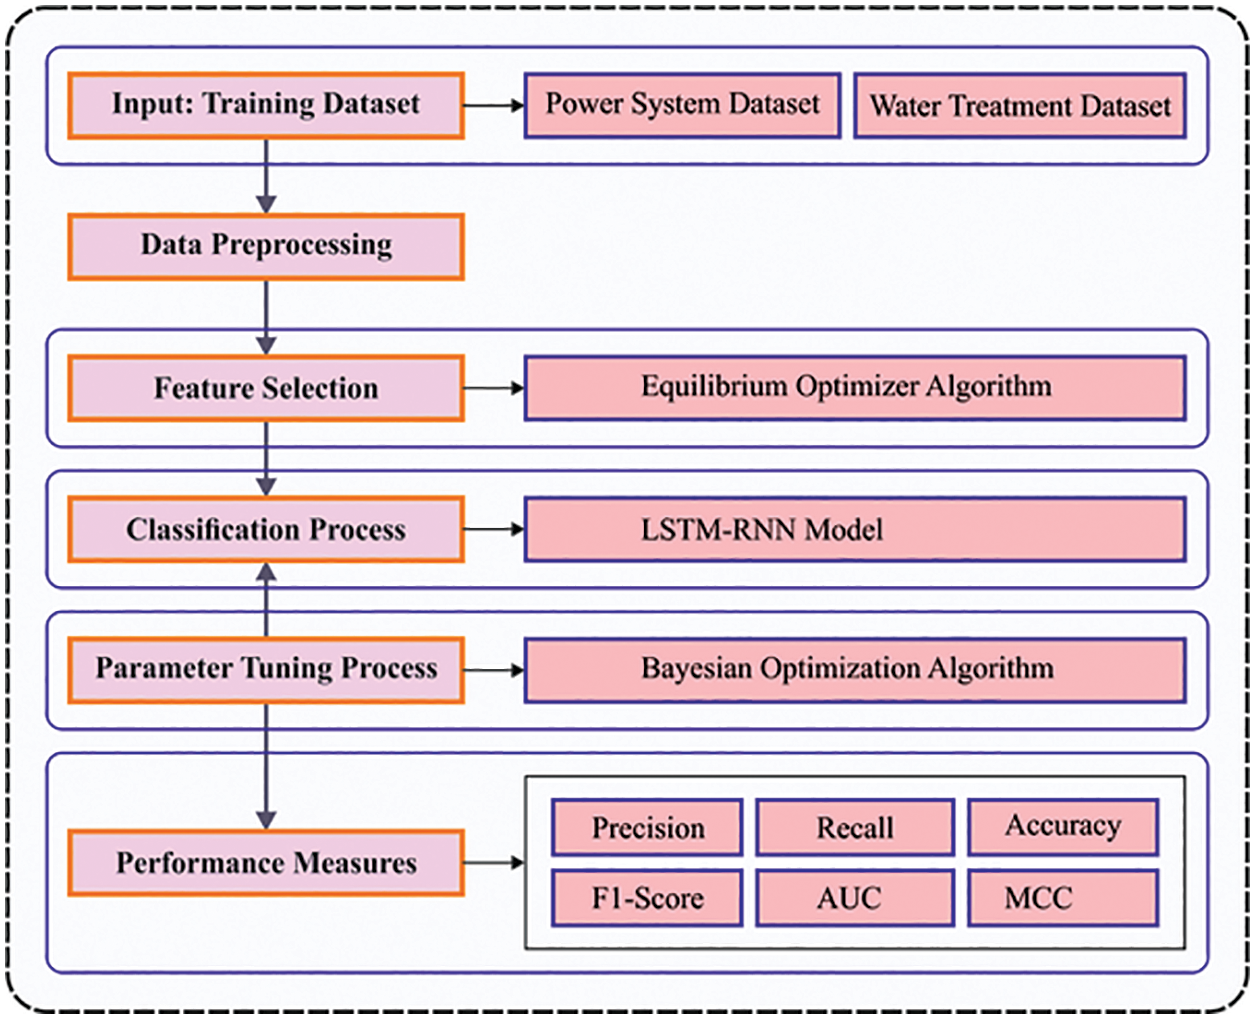
Figure 1: Block diagram of the HDL-FDIAD approach
2.1 Feature Subset Selection Process
The HDL-FDIAD model exploits the EO-FS technique to select the optimal subset of features. EO is a dynamic mass balance approach that functions to control the volume of the data [16]. An arithmetical expression is applied in this stage to characterize the mass balance and describe the focus of the non-reactive components in a dynamic controlled environment. Further, this expression functions with different strategies with source and sink variations. The whole theoretical description of the EO phase is described herewith. An arbitrary population is initialized through uniform distribution of the numbers based on the particle amount and dimension in the searching area, as given below.
In Eq. (1),
During the evolution process, the initialized particle upgrades the concentration from the primary generation based on
In Eq. (3), t denotes the iterative count
In Eq. (4),
In this expression,
The generation rate in the EO approach is applied as a time function to improve the exploitation phase. The first-order exponential decay procedure from the multi-purpose generative method is defined herewith.
In Eq. (7),
Now,
Here
The upgraded equation has an equilibrium concentration, a global search and a local search to accomplish the exact solutions. The fitness function of the EO-FS method assumes the classification accuracy and the number of selected features. It increases the classification accuracy and reduces the set size of the selected features. Thus, the subsequent fitness function is utilized to evaluate the individual solutions, as displayed in Eq. (12).
Here, ErrorRate refers to the classification error rate calculated with the selected features’ help.
2.2 FDI Detection and Classification Process
In this stage, the LSTM-RNN model is utilized for the purpose of classification. Generally, a Feedforward Neural Network (FFNN) can be defined below [17].
In the classification module, Y represents a set of classes. CNN is a kind of FFNN and is employed to perform semantic segmentation, image classification and the target recognition process. Unlike other NNs, the CNN mechanism contains convolution and pooling layers. The convolution layer aims to extract the local features of the input dataset. Fig. 2 demonstrates the framework of the LSTM method.
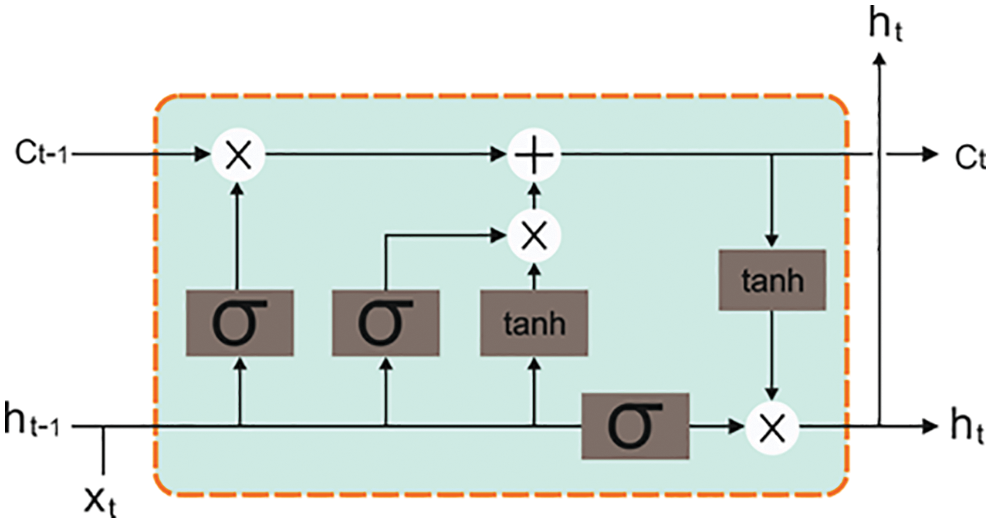
Figure 2: Structure of the LSTM approach
Conv. is a convolution layer, whereas
Pool is a pooling layer, Whereas
The fully-connected layer is an FC layer, whereas Softmax denotes one
LSTM is one LSTM layer.
2.3 Hyperparameter Tuning Process
At last, the BO algorithm is employed as a hyperparameter optimizer in this study. It is a sequential method used for the optimization of the black-box function
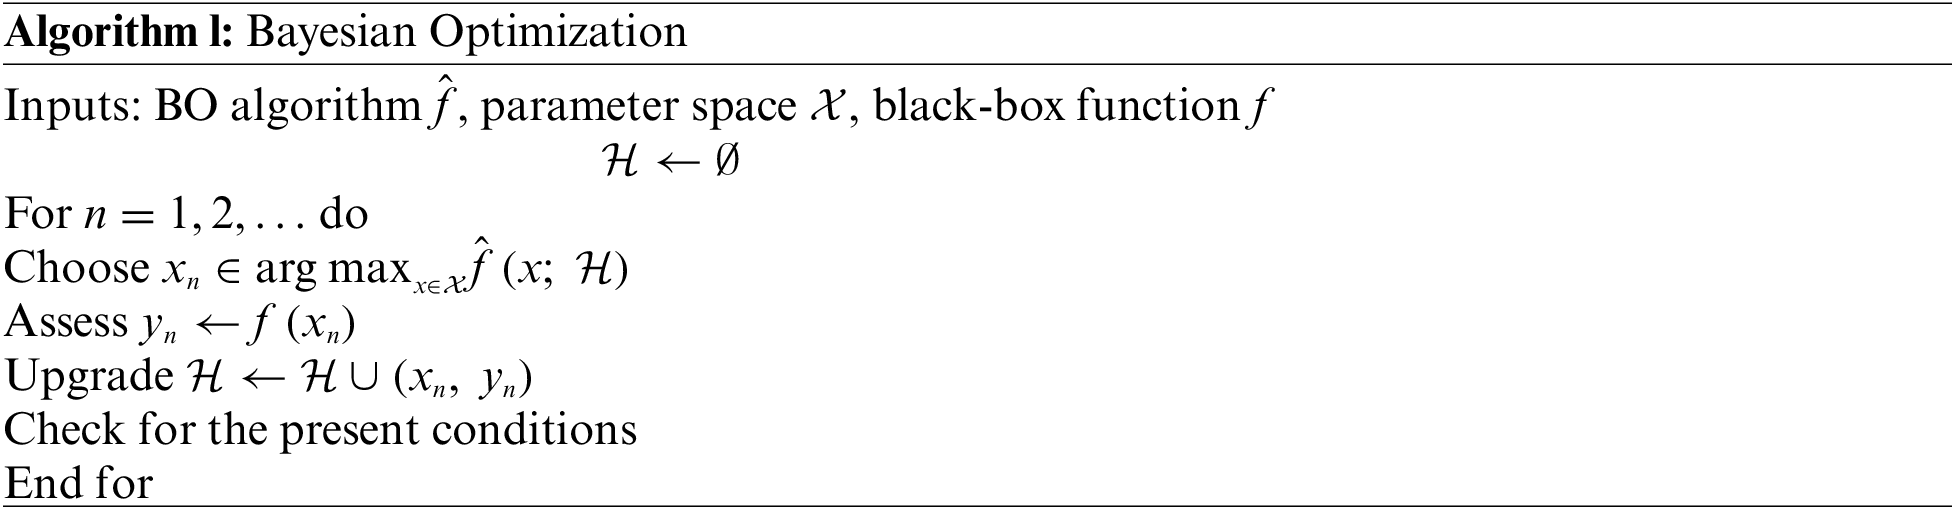
:
In this section, the FDI attack detection performance of the proposed HDL-FDIAD model was validated using two datasets, namely, power system dataset and water treatment dataset. The first power system dataset holds 22,714 samples under normal class and 9,582 samples under FDIA class. Similarly, the water treatment dataset includes 395,298 samples under normal and 54,621 samples under FDIA class. The HDL-FDIAD model selected a set of 128 features and 84 features from the databases under study. Table 1 illustrates the details of both datasets.
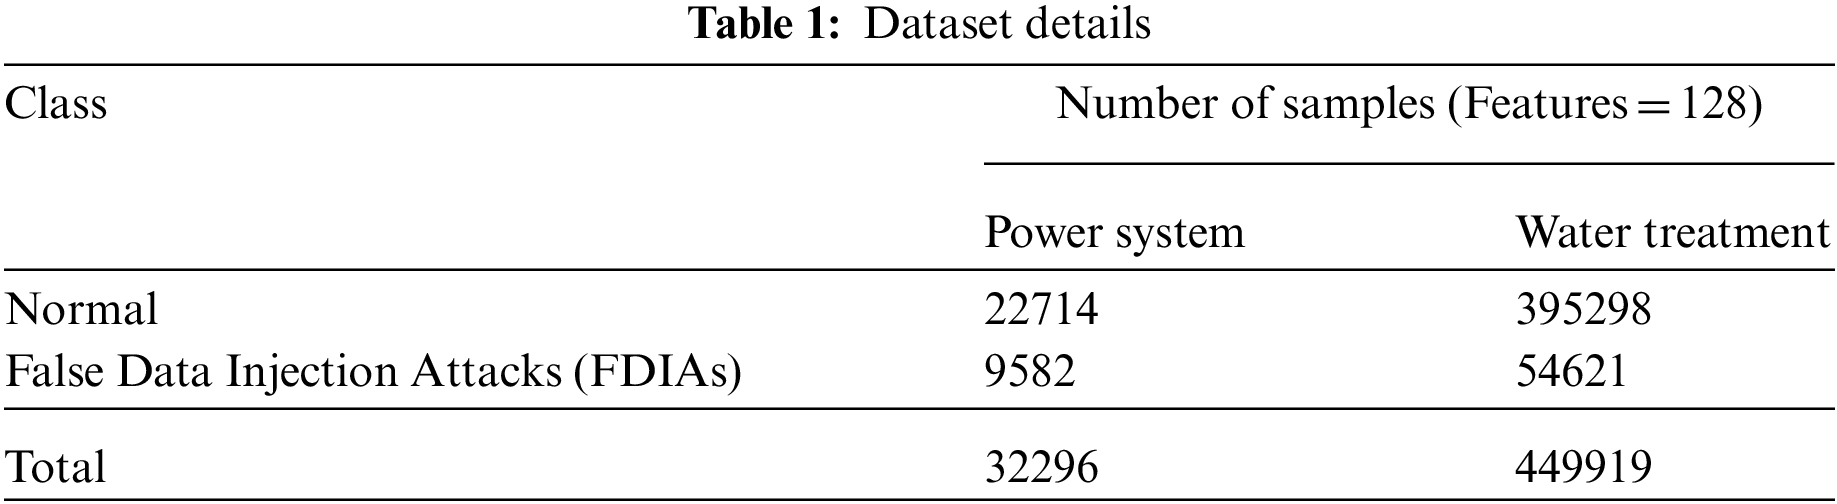
Table 2 and Fig. 3 show the results offered by the HDL-FDIAD model and other existing models on power dataset [19]. The experimental outcomes confirm that the proposed HDL-FDIAD model gained effectual outcomes on both the class labels. With respect to
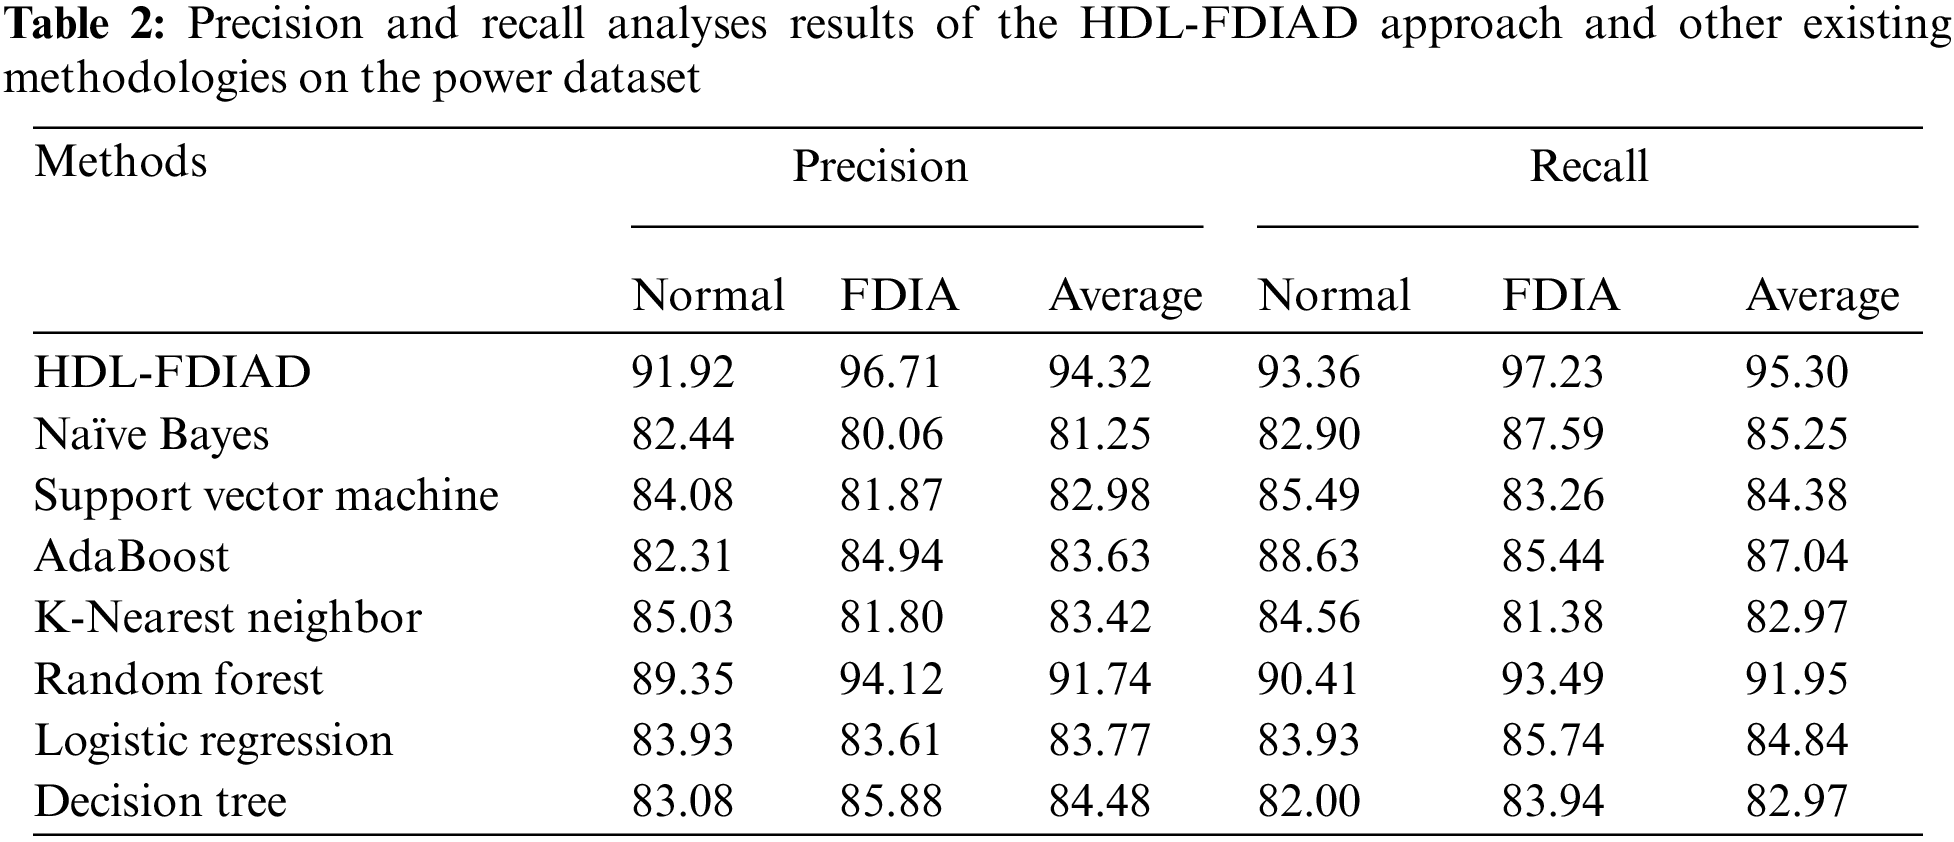
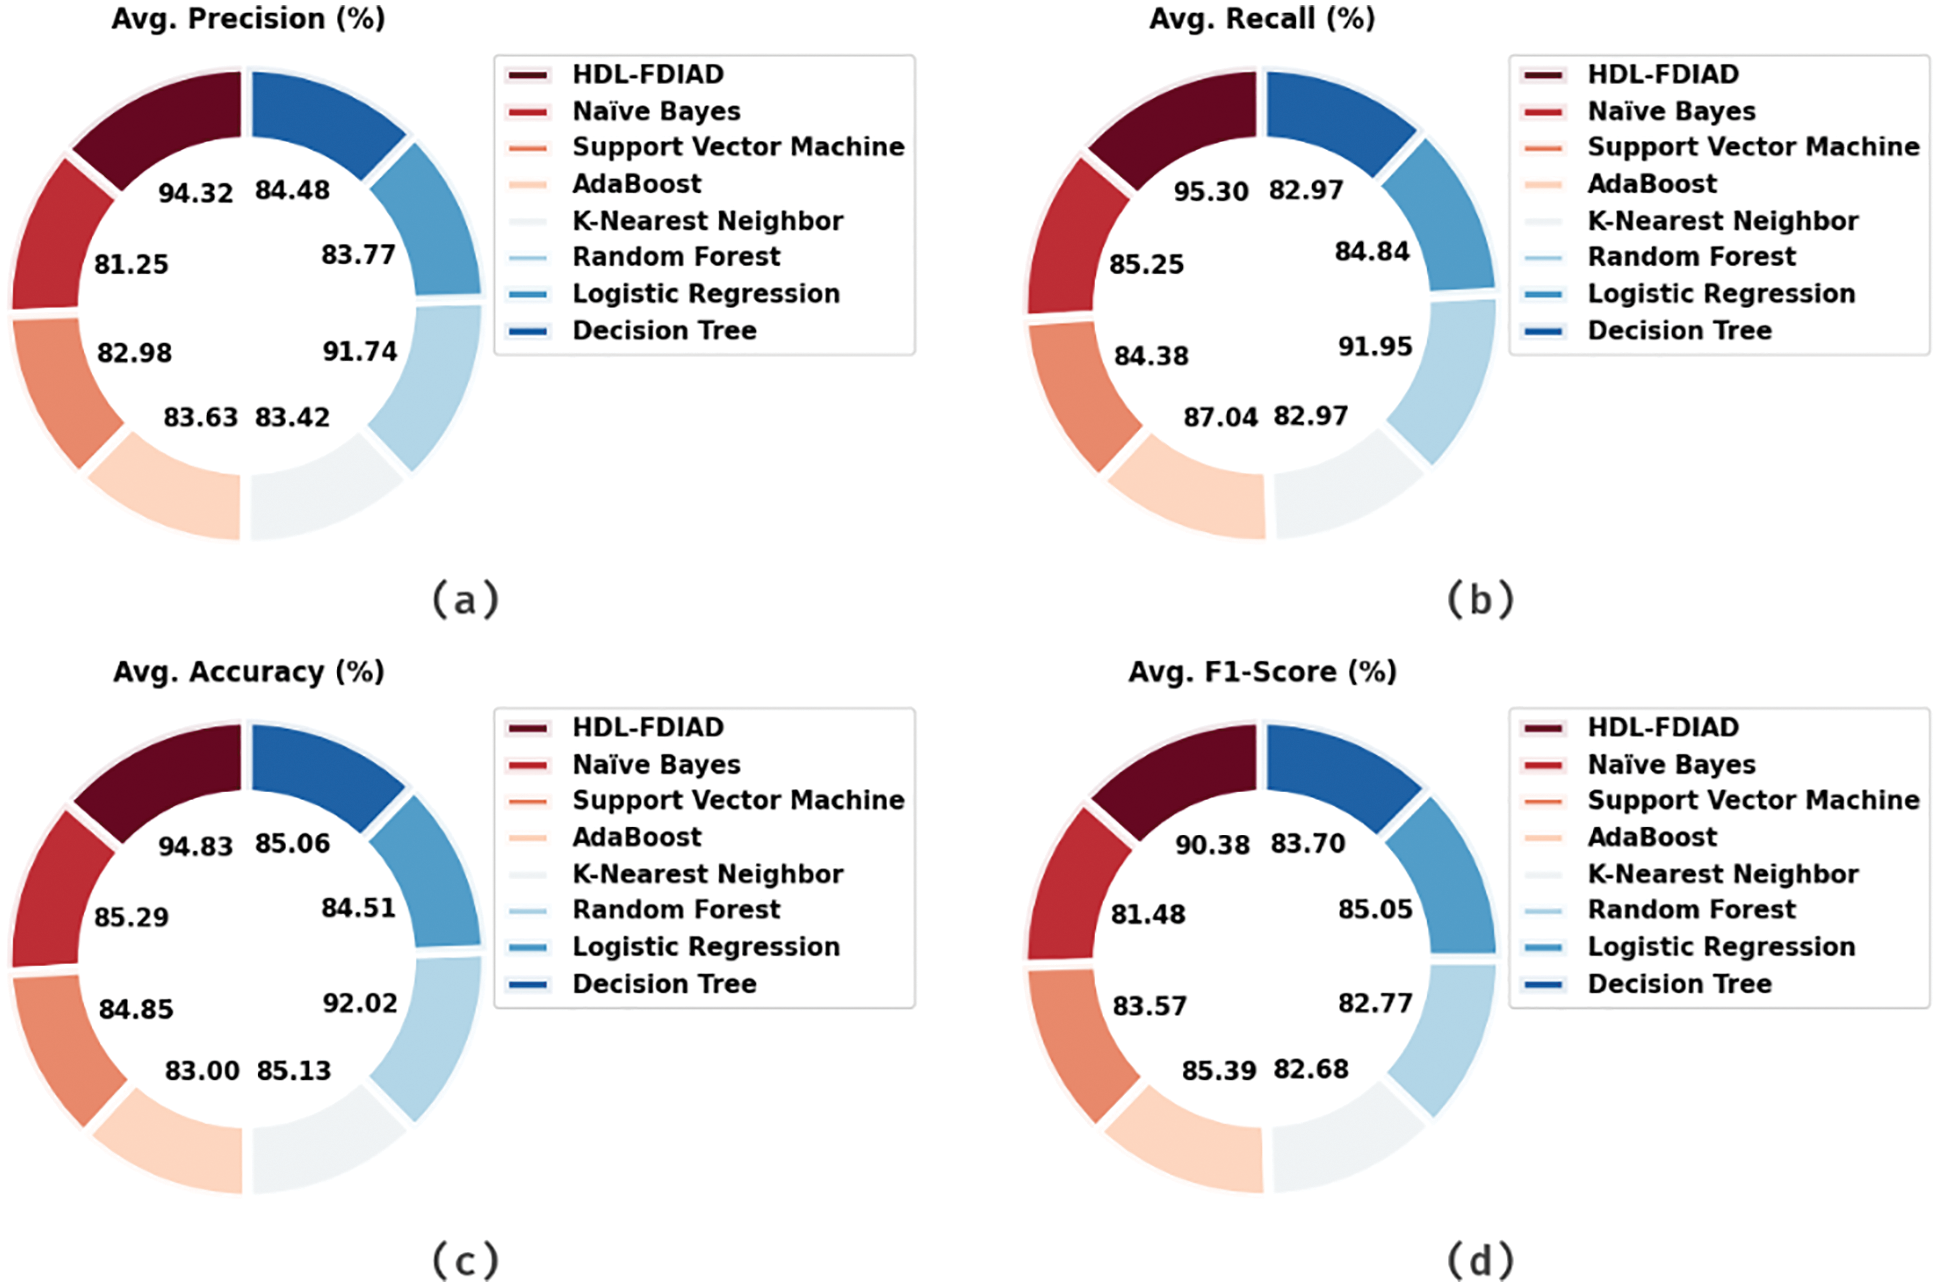
Figure 3: Average analysis results of the HDL-FDIAD approach on power dataset (a)
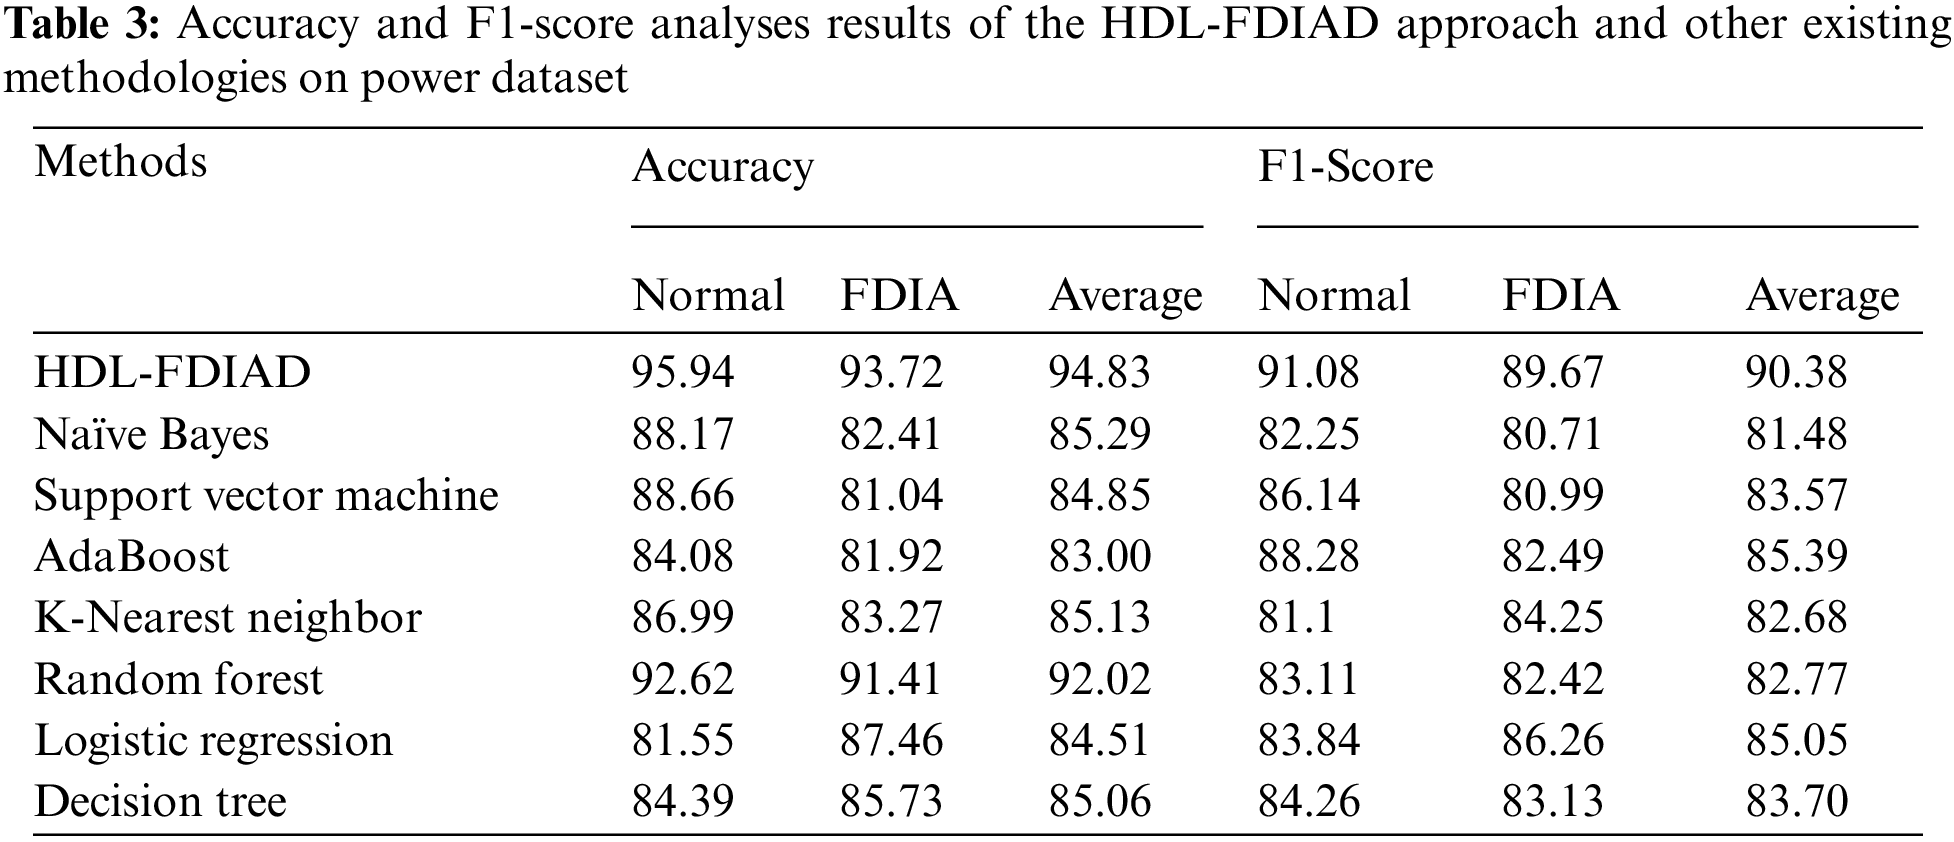
Table 3 portrays the results of the proposed HDL-FDIAD model and other existing models on the power dataset. The experimental outcomes infer that the proposed HDL-FDIAD method attained the effectual outcomes on both the class labels. In terms of
Both Training Accuracy (TA) and Validation Accuracy (VA) values, acquired by the proposed HDL-FDIAD method on Power Dataset, are shown in Fig. 4. The experimental outcomes infer that the HDL-FDIAD method achieved the maximal TA and VA values, whereas the VA values were higher than the TA values.
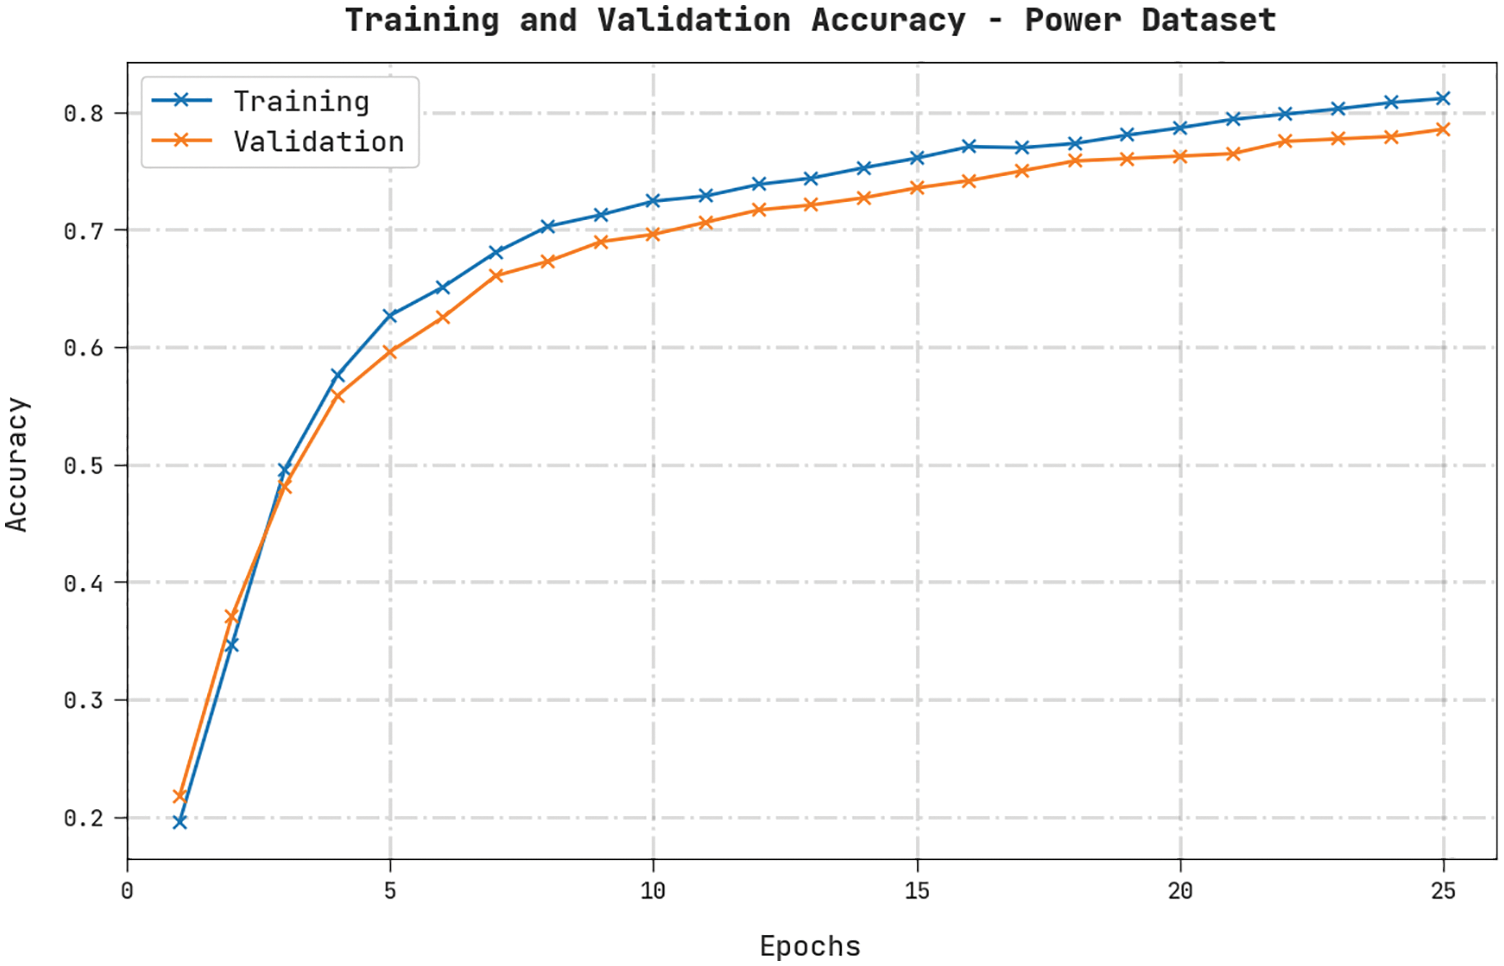
Figure 4: TA and VA analyses results of the HDL-FDIAD approach on the power dataset
Both Training Loss (TL) and Validation Loss (VL) values, achieved by the HDL-FDIAD approach on Power Dataset, are exhibited in Fig. 5. The experimental outcomes denote that the HDL-FDIAD algorithm established the least TL and VL values while the VL values were lesser than the TL values.
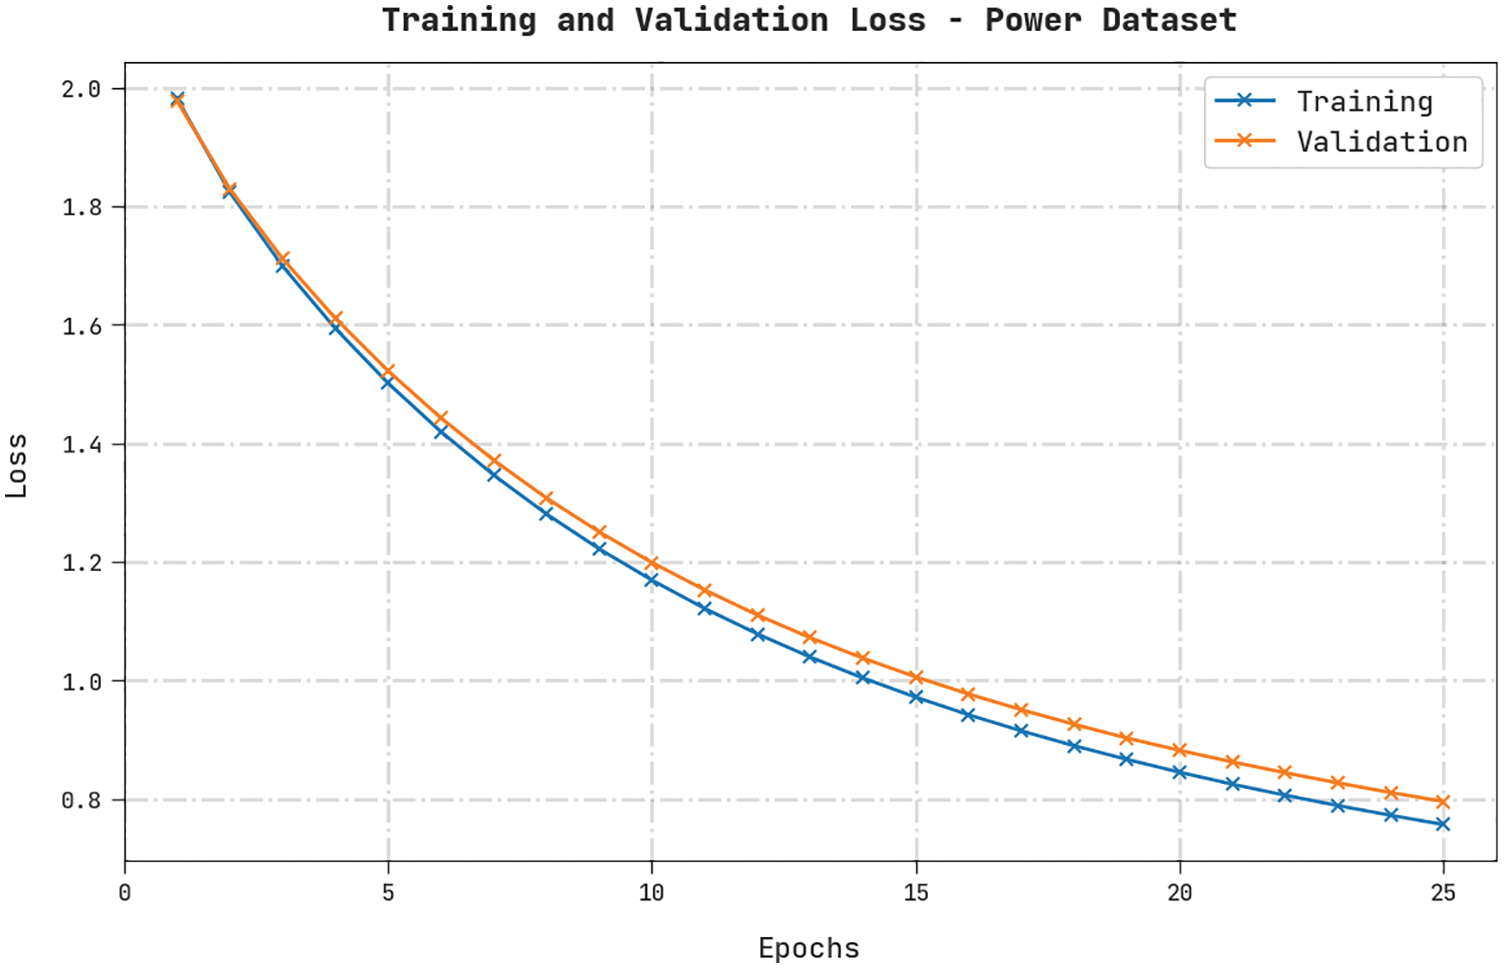
Figure 5: TL and VL analyses results of the HDL-FDIAD approach on power dataset
A clear precision-recall analysis was conducted on the HDL-FDIAD method using the Power Dataset and the results are displayed in Fig. 6. The figure denotes that the HDL-FDIAD method produced enhanced precision-recall values under all the classes.
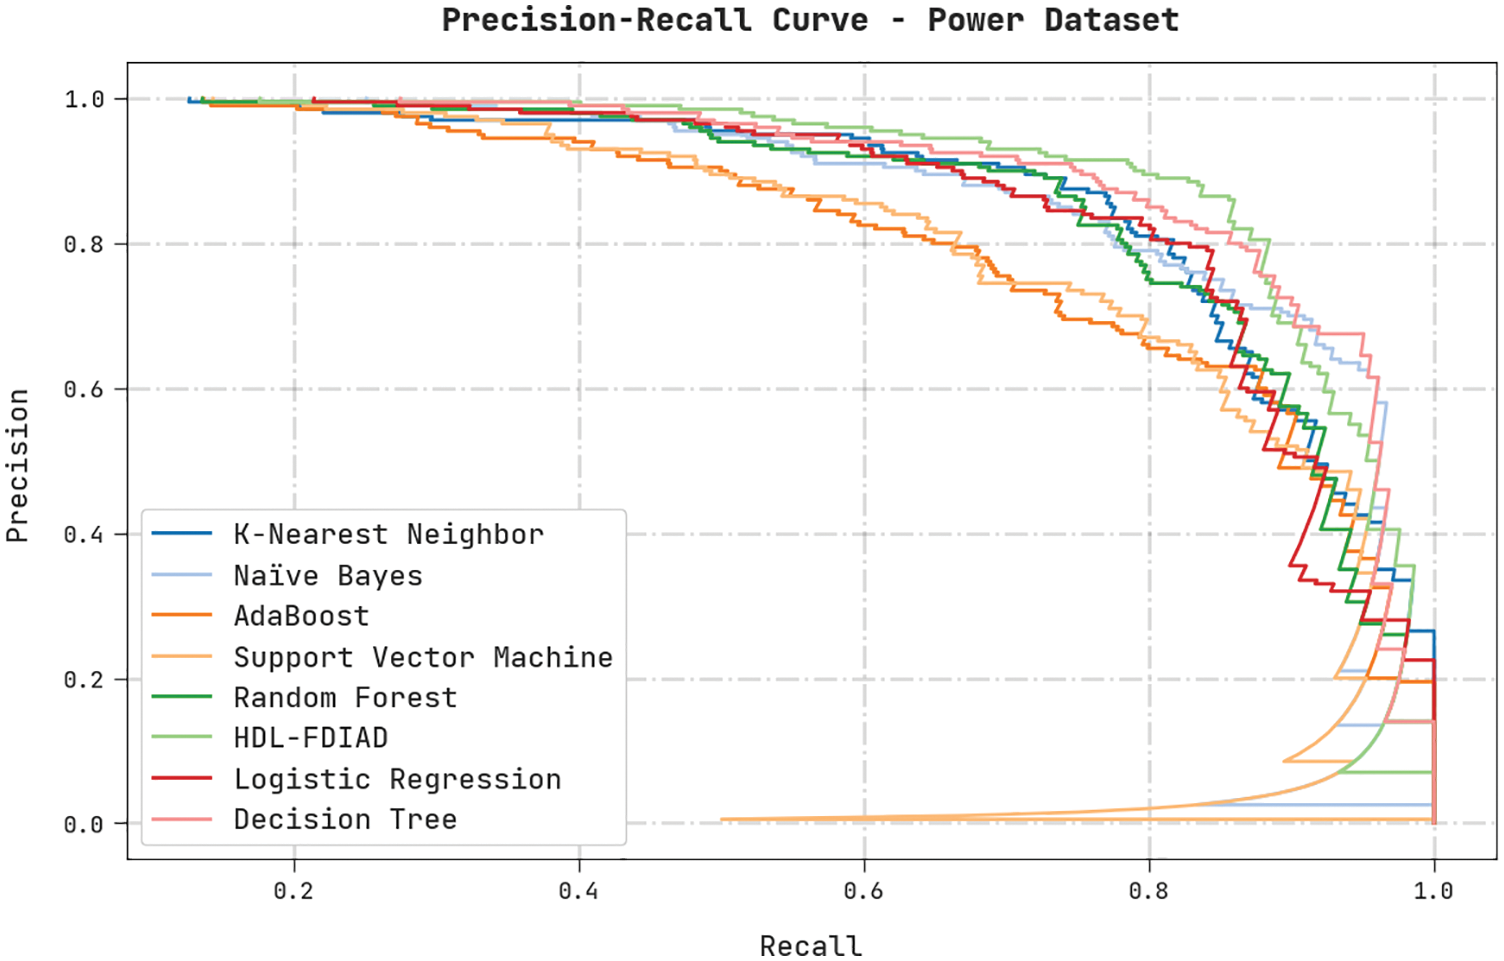
Figure 6: Precision-recall analysis results of the HDL-FDIAD approach on power dataset
A brief ROC analysis was conducted on the HDL-FDIAD methodology using the Power Dataset, and the results are shown in Fig. 7. The results signify that the HDL-FDIAD approach established its ability in categorizing the Power dataset under distinct classes.
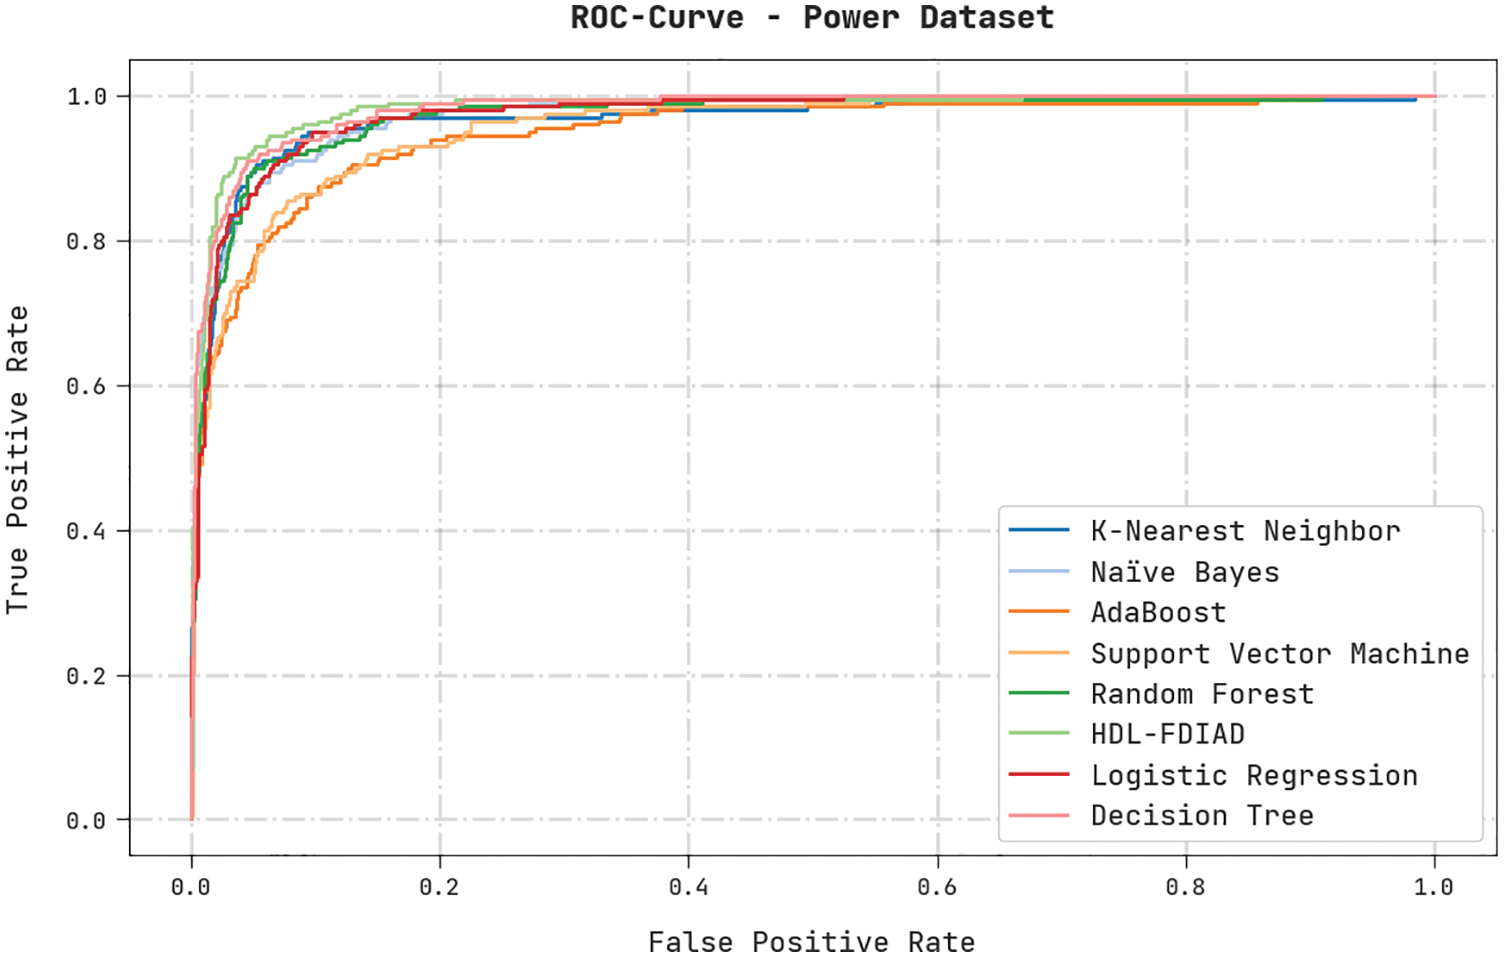
Figure 7: ROC analysis results of the HDL-FDIAD approach on power dataset
Table 4 and Fig. 8 show the results rendered by the proposed HDL-FDIAD model and other existing models on the Water Treatment dataset. The experimental outcomes confirm that the proposed HDL-FDIAD model reached the effectual outcomes on both the class labels. With respect to
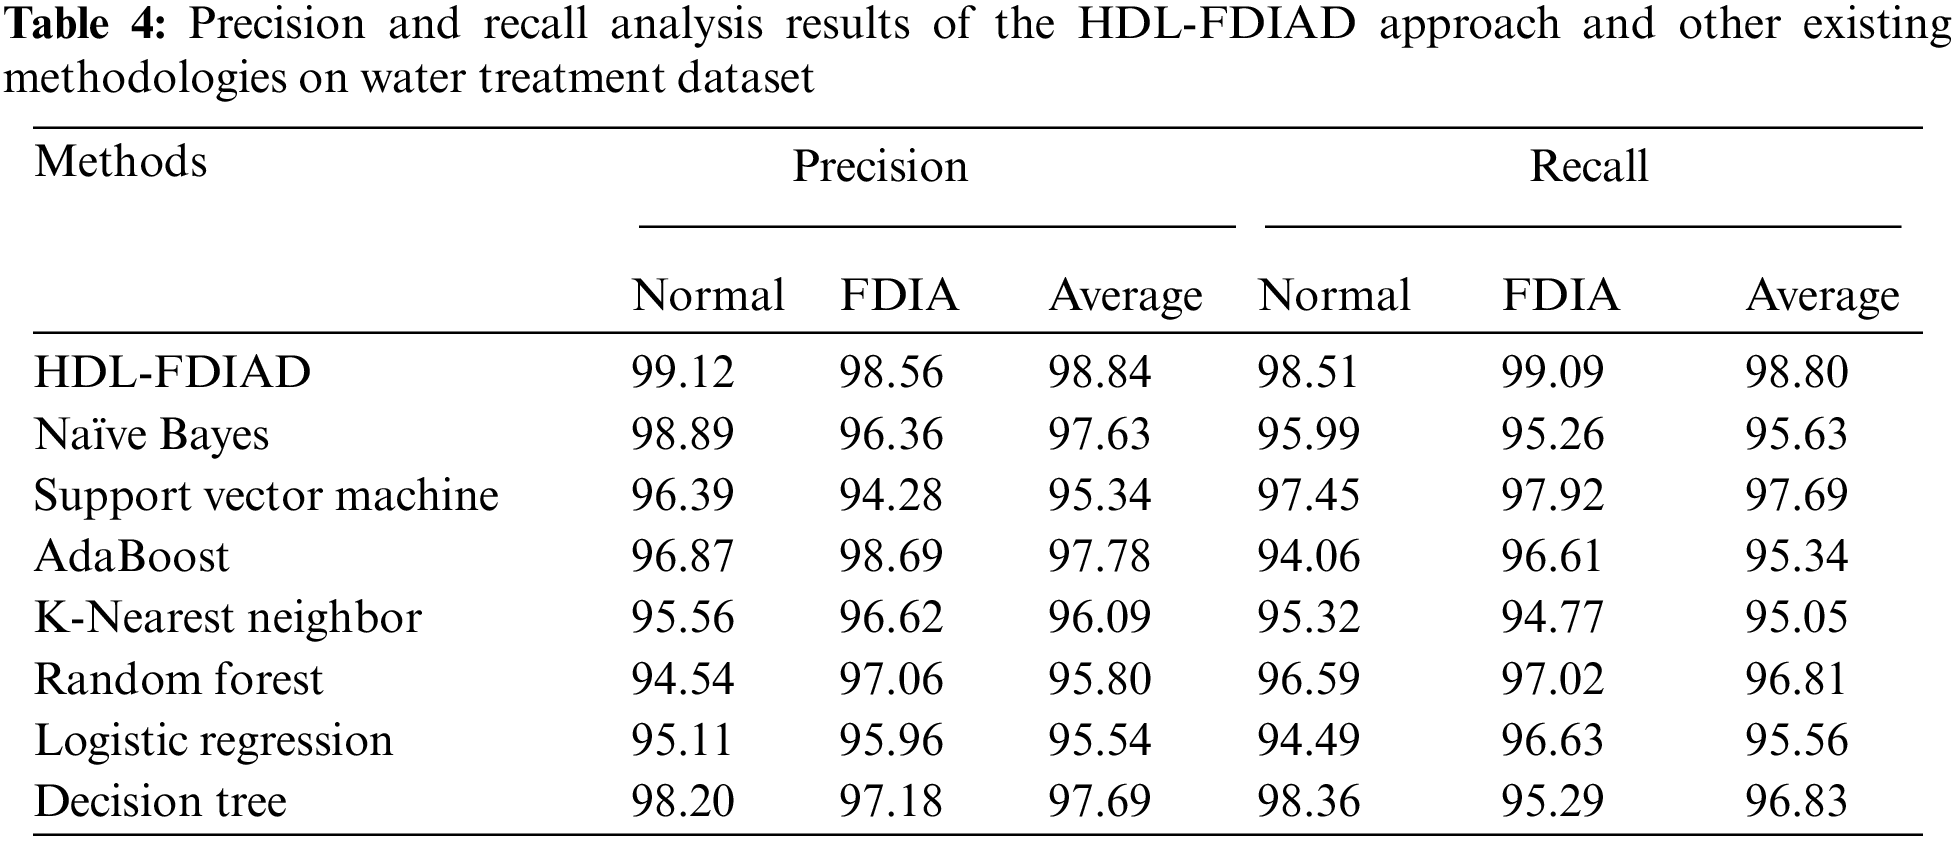
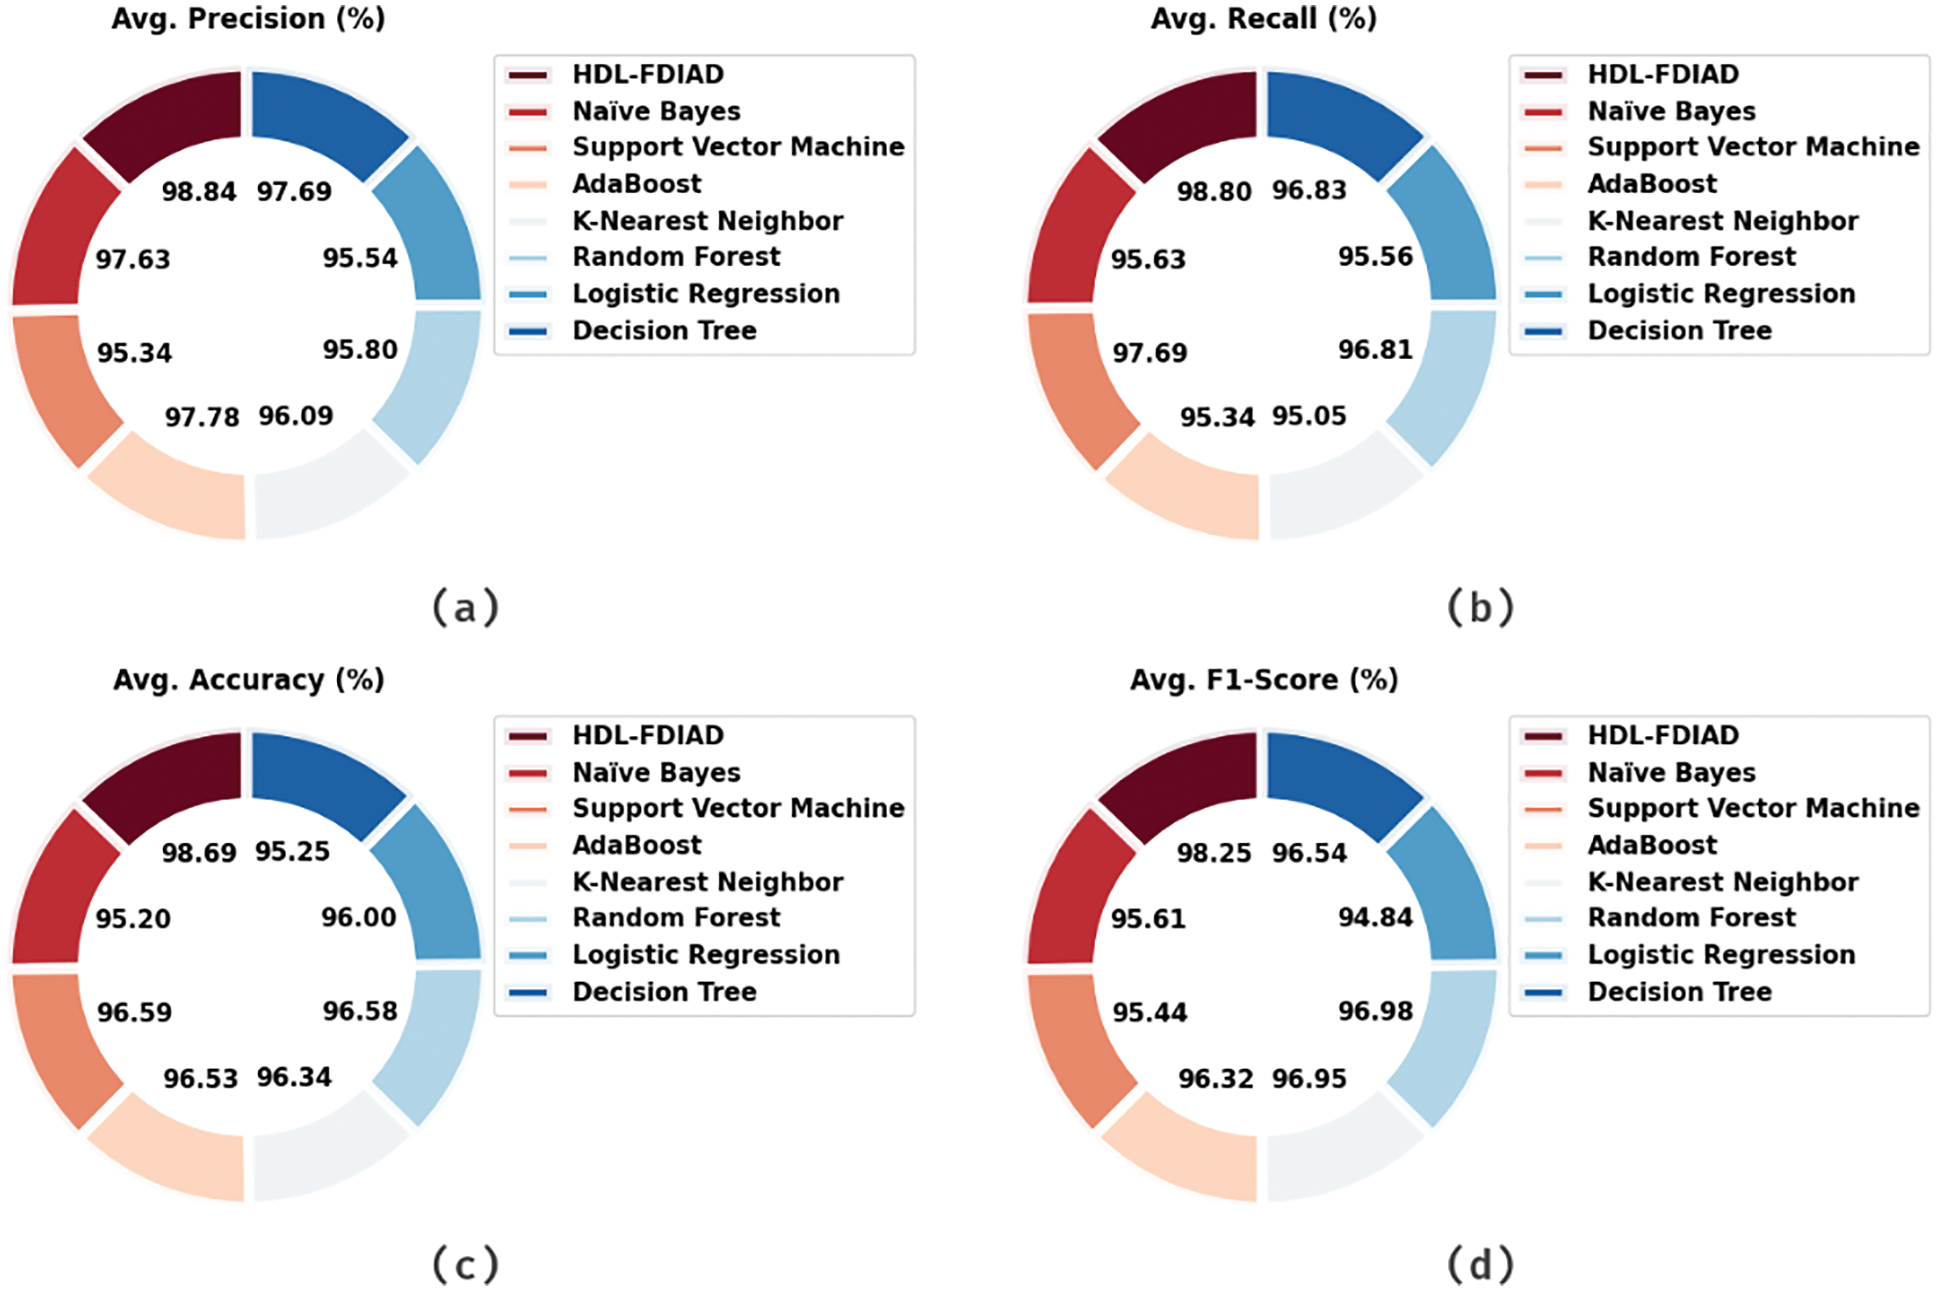
Figure 8: Average analysis results of the HDL-FDIAD approach on water treatment dataset (a)
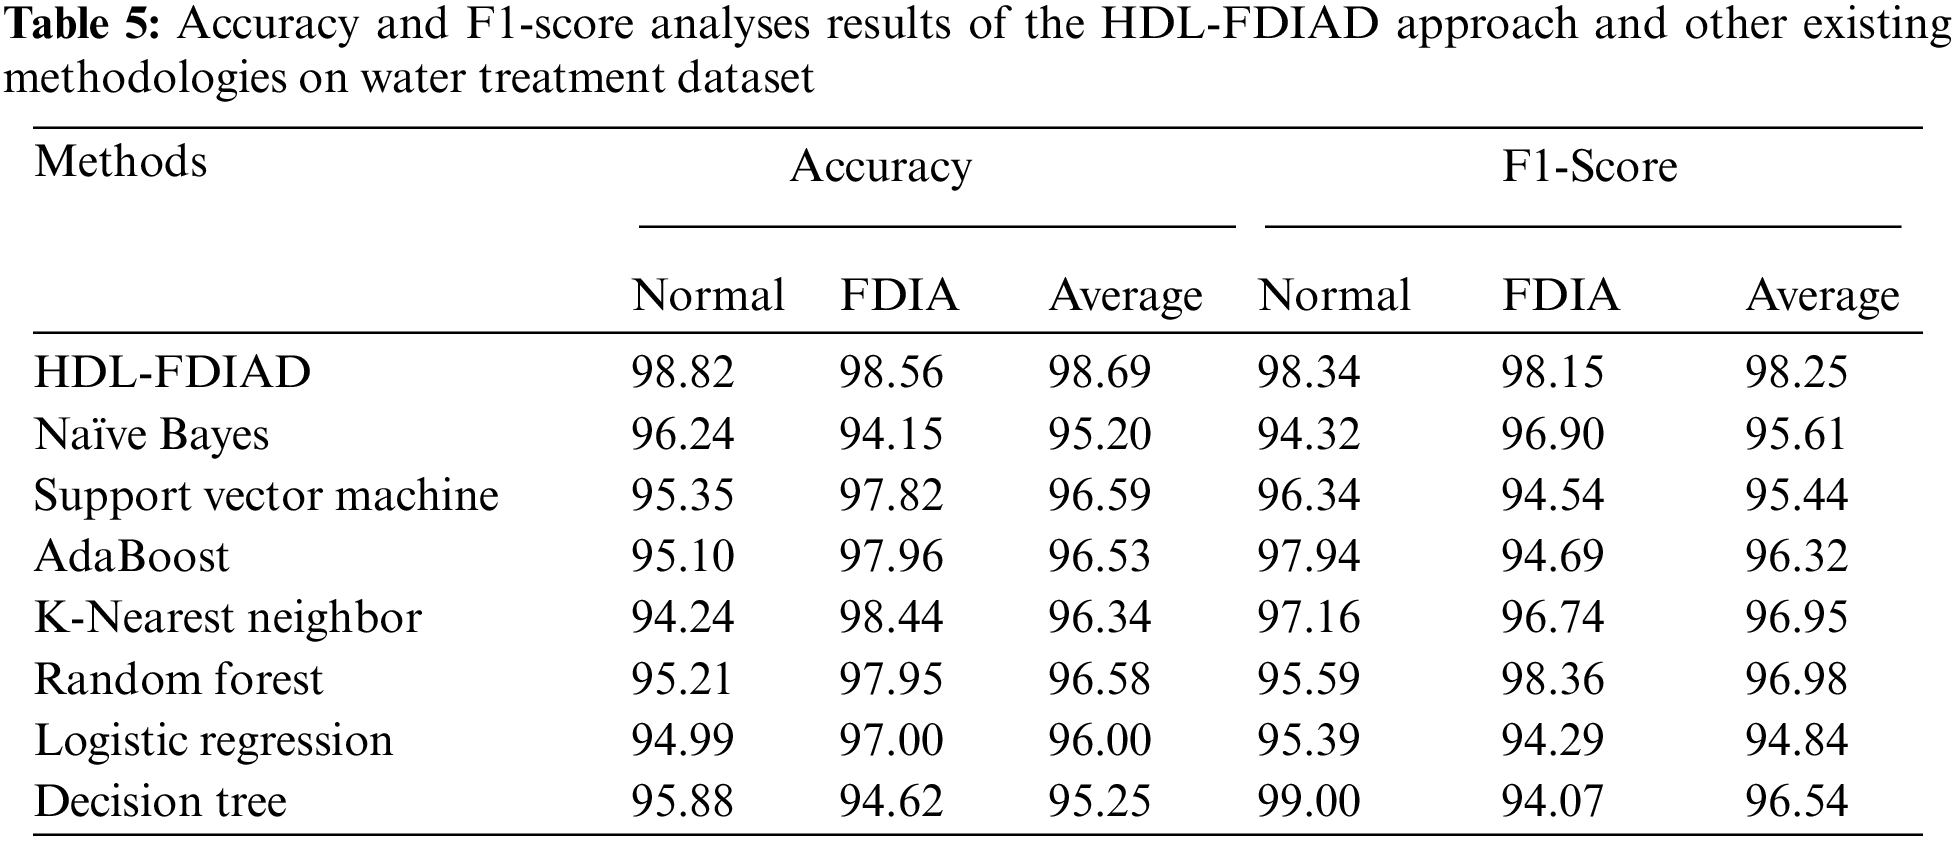
Table 5 displays the results attained by the HDL-FDIAD method and other existing models on Water Treatment dataset. The experimental outcomes confirm that the HDL-FDIAD model obtained the effectual outcomes on both the class labels. With respect to
Both TA and VA values, obtained by the HDL-FDIAD method on Water Treatment Dataset, are demonstrated in Fig. 9. The experimental outcomes denote that the HDL-FDIAD technique achieved the maximal TA and VA values. In contrast, the VA values were higher than the TA values.
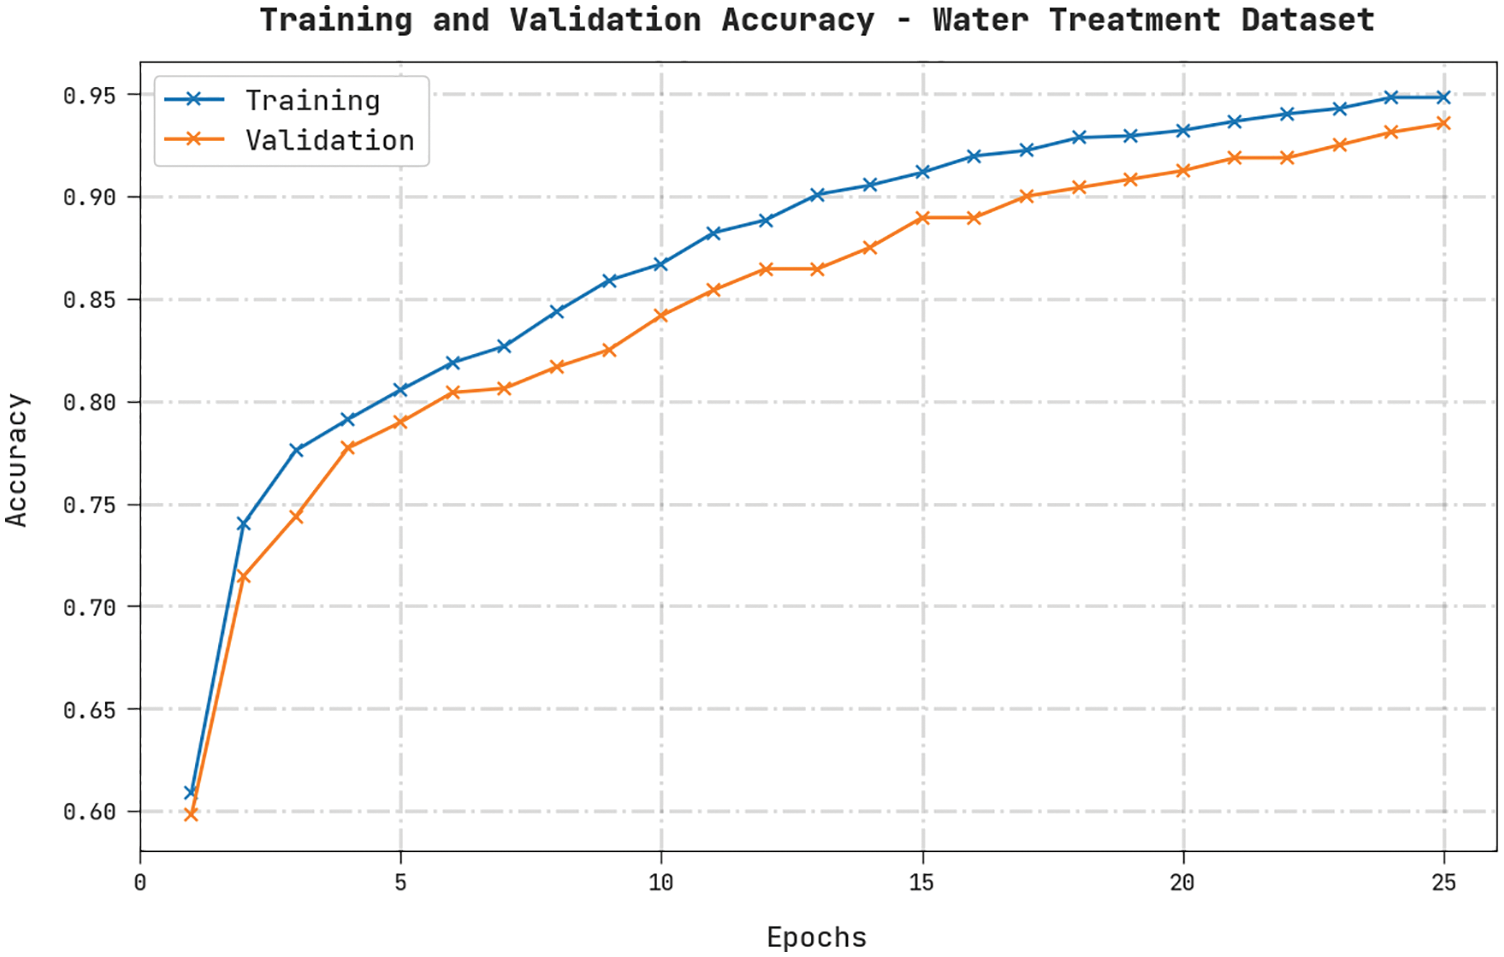
Figure 9: TA and VA analyses results of the HDL-FDIAD approach on water treatment dataset
Both TL and VL values, achieved by the HDL-FDIAD approach on Water Treatment Dataset, are established in Fig. 10. The experimental outcomes imply that the proposed HDL-FDIAD algorithm exhibited the least TL and VL values. In contrast, the VL values were lesser than the TL values.
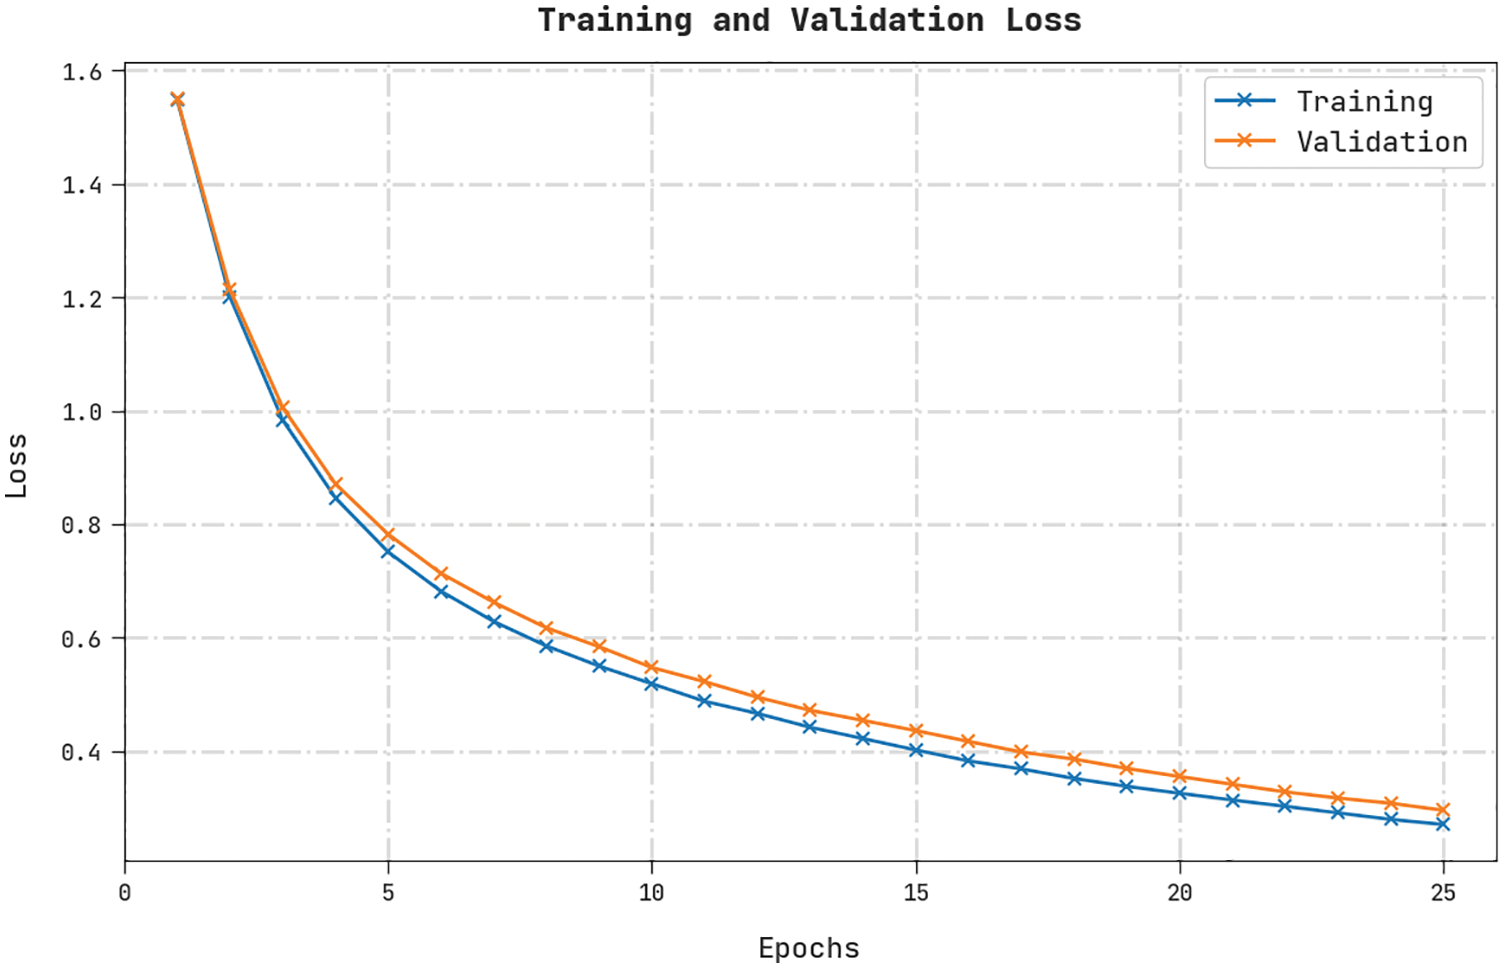
Figure 10: TL and VL analyses results of the HDL-FDIAD approach on water treatment dataset
A clear precision-recall analysis was conducted on the HDL-FDIAD method using the Water Treatment Dataset, and the results are portrayed in Fig. 11. The figure denotes that the HDL-FDIAD methodology achieved enhanced precision-recall values under all the classes.
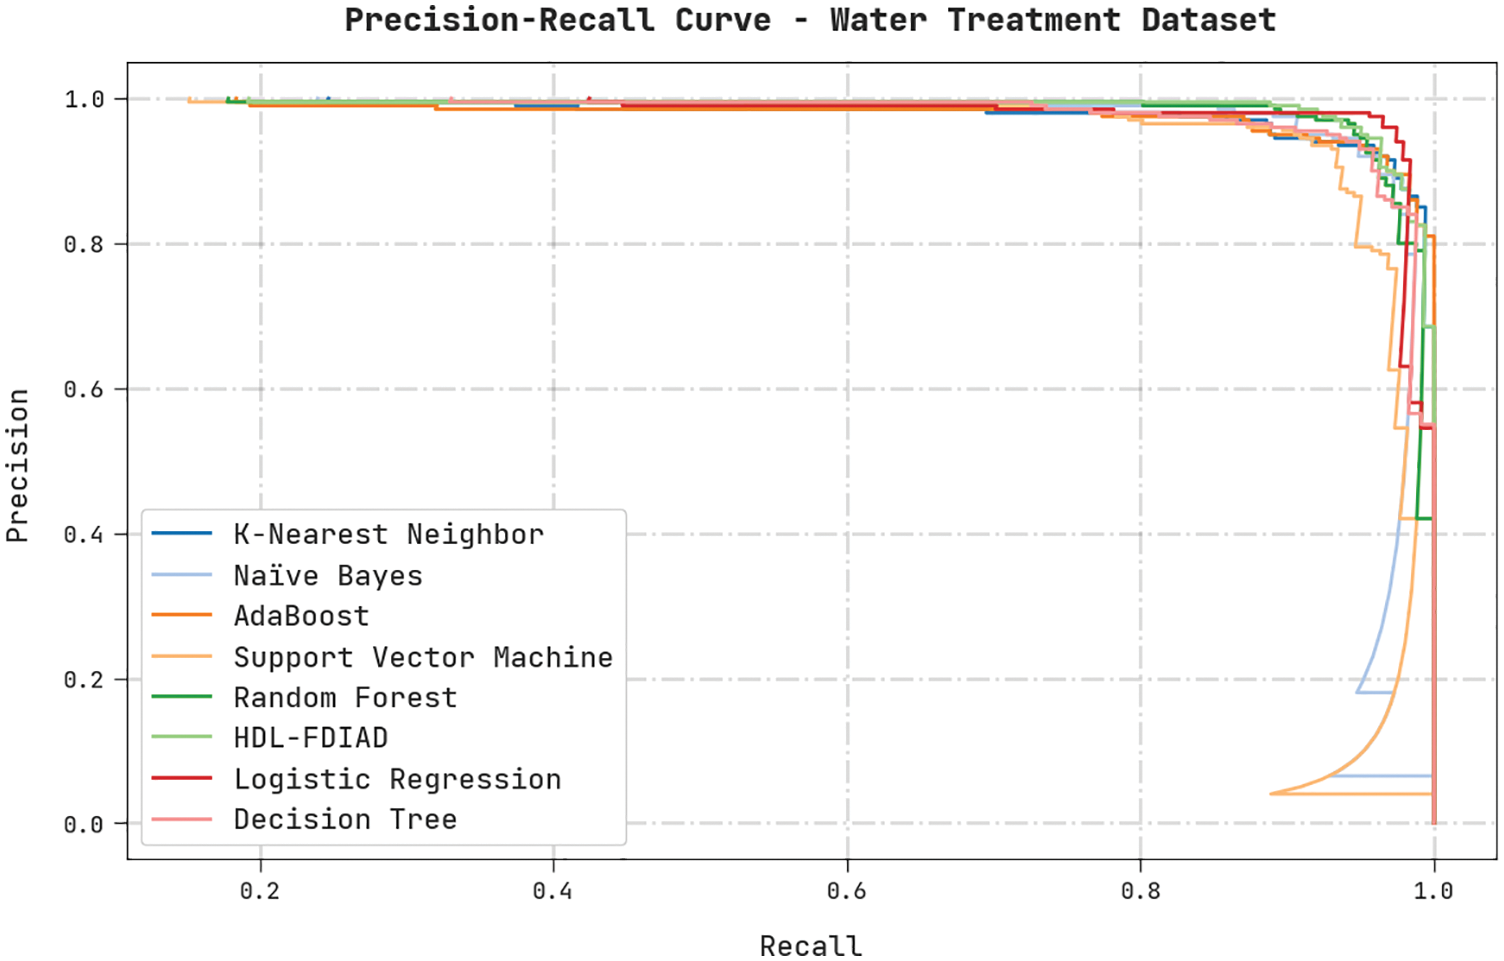
Figure 11: Precision-recall analysis results of the HDL-FDIAD approach on water treatment dataset
A brief ROC analysis was conducted on the HDL-FDIAD method using the Water Treatment Dataset, and the results are shown in Fig. 12. The results indicate that the HDL-FDIAD method established its ability to categorise the Water Treatment dataset under distinct classes.
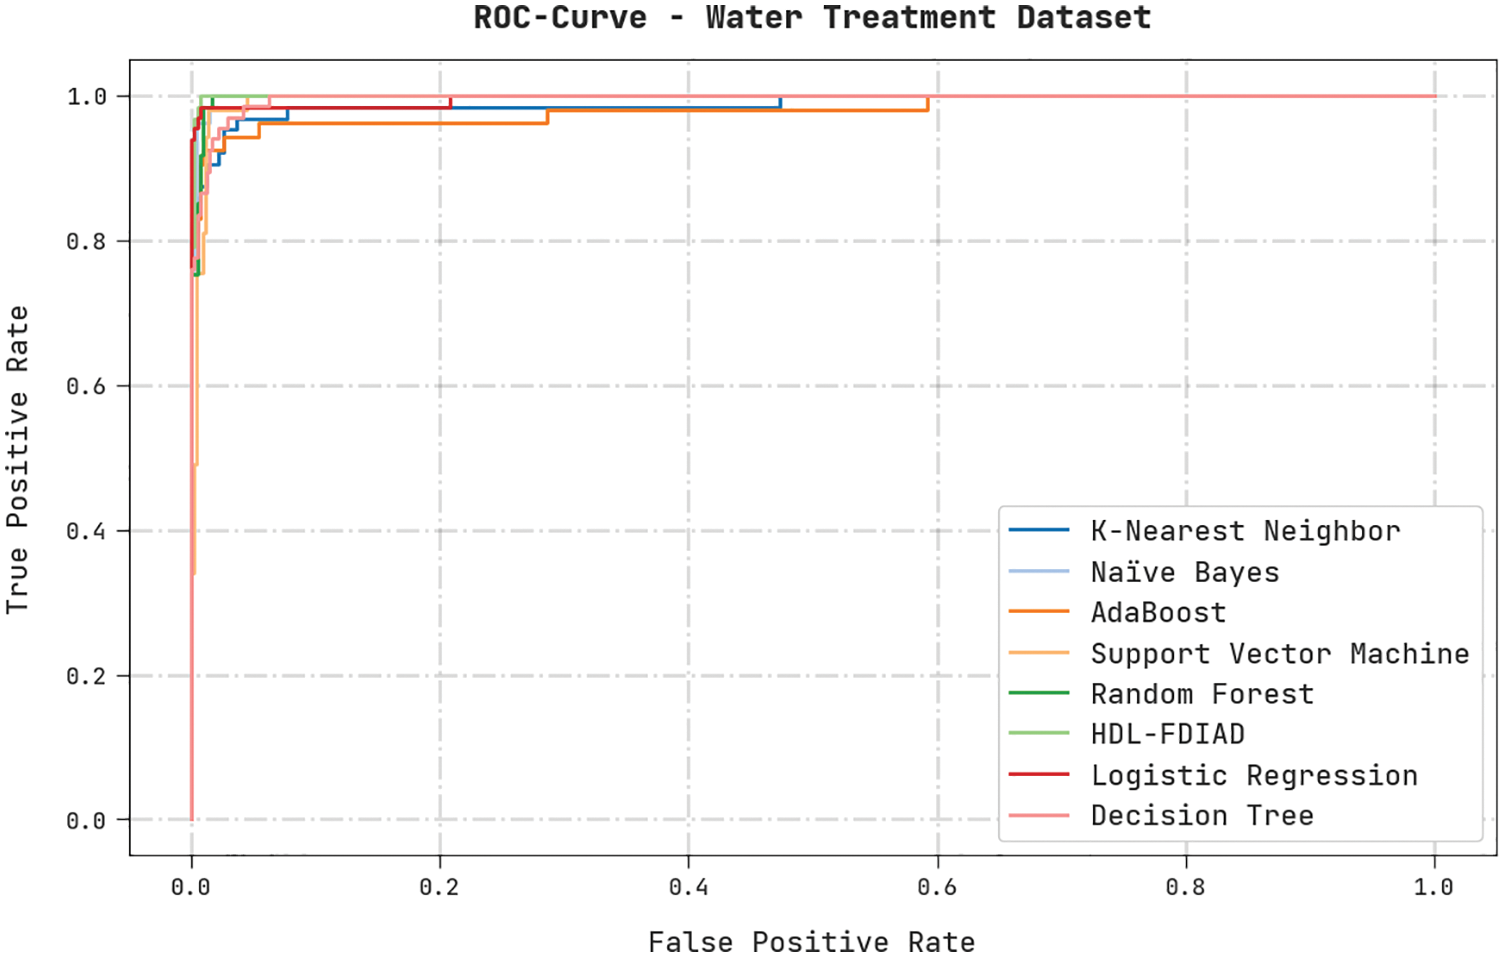
Figure 12: ROC analysis results of the HDL-FDIAD approach on water treatment dataset
The current research article has developed a novel HDL-FDIAD model to determine FDI attacks in the IoT environment. The HDL-FDIAD model exploits the EO-FS technique to select the optimal subset of features. Moreover, the LSTM-RNN model is utilized for the purpose of classification. At last, the BO algorithm is employed as a hyperparameter optimizer in this study. To validate the enhanced performance of the HDL-FDIAD model, a wide range of simulations was conducted, and the results were investigated in detail. The comparative study outcomes confirmed that the proposed HDL-FDIAD model is superior to other techniques. Thus, the HDL-FDIAD technique can be exploited to identify the FDI attacks in the IoT environment. In the future, the HDL-FDIAD model can be extended to cloud and fog computing environments too.
Funding Statement: The author received no specific funding for this study.
Conflicts of Interest: The authors declare that they have no conflicts of interest to report regarding the present study.
References
1. Y. Zhang, J. Zhao, D. Zheng, K. Deng, F. Ren et al., “Privacy-preserving data aggregation against false data injection attacks in fog computing,” Sensors, vol. 18, no. 8, pp. 2659, 2018. [Google Scholar]
2. C. Yang, L. Feng, H. Zhang, S. He and Z. Shi, “A novel data fusion algorithm to combat false data injection attacks in networked radar systems,” IEEE Transactions on Signal and Information Processing Over Network, vol. 4, no. 1, pp. 125–136, 2018. [Google Scholar]
3. N. N. Tran, H. R. Pota, Q. N. Tran and J. Hu, “Designing constraint-based false data-injection attacks against the unbalanced distribution smart grids,” IEEE Internet Things Journal, vol. 8, no. 11, pp. 9422–9435, 2021. [Google Scholar]
4. X. Wang, X. Luo, Y. Zhang and X. Guan, “Detection and isolation of false data injection attacks in smart grids via nonlinear interval observer,” IEEE Internet Things Journal, vol. 6, no. 4, pp. 6498–6512, 2019. [Google Scholar]
5. A. Chattopadhyay and U. Mitra, “Security against false data-injection attack in cyber-physical systems,” IEEE Transactions on Control of Network Systems, vol. 7, no. 2, pp. 1015–1027, 2020. [Google Scholar]
6. D. Huang, X. Shi and W. A. Zhang, “False data injection attack detection for industrial control systems based on both time-and frequency-domain analysis of sensor data,” IEEE Internet of Things Journal, vol. 8, no. 1, pp. 585–595, 2021. [Google Scholar]
7. J. Tian, B. Wang, T. Li, F. Shang, K. Cao et al., “TOTAL: Optimal protection strategy against perfect and imperfect false data injection attacks on power grid cyber–physical systems,” IEEE Internet of Things Journal, vol. 8, no. 2, pp. 1001–1015, 2021. [Google Scholar]
8. X. Wang, X. Luo, M. Zhang, Z. Jiang and X. Guan, “Detection and isolation of false data injection attacks in smart grid via unknown input interval observer,” IEEE Internet of Things Journal, vol. 7, no. 4, pp. 3214–3229, 2020. [Google Scholar]
9. R. Liu, H. M. Mustafa, Z. Nie and A. K. Srivastava, “Reachability-based false data injection attacks and defence mechanisms for cyberpower system,” Energies, vol. 15, no. 5, pp. 1754, 2022. [Google Scholar]
10. V. P. Srinivasan, K. Balasubadra, K. Saravanan, V. S. Arjun and S. Malarkodi, “Multi label deep learning classification approach for false data injection attacks in smart grid,” KSII Transactions on Internet and Information Systems, vol. 15, no. 6, pp. 2168–2187, 2021. [Google Scholar]
11. M. M. N. Aboelwafa, K. G. Seddik, M. H. Eldefrawy, Y. Gadallah and M. Gidlund, “A machine-learning-based technique for false data injection attacks detection in industrial IoT,” IEEE Internet of Things Journal, vol. 7, no. 9, pp. 8462–8471, 2020. [Google Scholar]
12. A. Alromih, M. A. Rodhaan and Y. Tian, “A randomized watermarking technique for detecting malicious data injection attacks in heterogeneous wireless sensor networks for internet of things applications,” Sensors, vol. 18, no. 12, pp. 4346, 2018. [Google Scholar]
13. A. Amuthan and R. Sendhil, “Hybrid GSW and DM based fully homomorphic encryption scheme for handling false data injection attacks under privacy preserving data aggregation in fog computing,” Journal of Ambient Intelligence and Humanized Computing, vol. 11, no. 11, pp. 5217–5231, 2020. [Google Scholar]
14. H. Moudoud, L. Khoukhi and S. Cherkaoui, “Prediction and detection of FDIA and DDoS attacks in 5G enabled IoT,” IEEE Network, vol. 35, no. 2, pp. 194–201, 2021. [Google Scholar]
15. S. Wang, S. Bi and Y. J. A. Zhang, “Locational detection of the false data injection attack in a smart grid: A multilabel classification approach,” IEEE Internet of Things Journal, vol. 7, no. 9, pp. 8218–8227, 2020. [Google Scholar]
16. D. T. A. Hamied, A. M. Shaheen, W. A. Salem, W. I. Gabr and R. A. El-sehiemy, “Equilibrium optimizer based multi dimensions operation of hybrid AC/DC grids,” Alexandria Engineering Journal, vol. 59, no. 6, pp. 4787–4803, 2020. [Google Scholar]
17. B. B. Sahoo, R. Jha, A. Singh and D. Kumar, “Long short-term memory (LSTM) recurrent neural network for low-flow hydrological time series forecasting,” Acta Geophysica, vol. 67, no. 5, pp. 1471–1481, 2019. [Google Scholar]
18. Y. Zhang, D. W. Apley and W. Chen, “Bayesian optimization for materials design with mixed quantitative and qualitative variables,” Scientific Reports, vol. 10, no. 1, pp. 4924, 2020. [Google Scholar]
19. A. Kumar, N. Saxena, S. Jung and B. J. Choi, “Improving detection of false data injection attacks using machine learning with feature selection and oversampling,” Energies, vol. 15, no. 1, pp. 212, 2021. [Google Scholar]
Cite This Article
 Copyright © 2023 The Author(s). Published by Tech Science Press.
This work is licensed under a Creative Commons Attribution 4.0 International License , which permits unrestricted use, distribution, and reproduction in any medium, provided the original work is properly cited.
 Downloads
 Citation Tools