
 Submit a Paper
 Propose a Special lssue
 Open Access
ARTICLE

LexDeep: Hybrid Lexicon and Deep Learning Sentiment Analysis Using Twitter for Unemployment-Related Discussions During COVID-19
1 Institute for Big Data Analytics and Artificial Intelligence, Universiti Teknologi MARA (UiTM), Shah Alam, Malaysia
2 College of Computer and Information Sciences, Princess Nourah bint Abdulrahman University, Riyadh, Saudi Arabia
3 Faculty of Computer and Mathematical Sciences, Universiti Teknologi MARA (UiTM), Shah Alam, Malaysia
* Corresponding Authors: Azlinah Mohamed. Email: ; Hadil Shaiba. Email:
Computers, Materials & Continua 2023, 75(1), 1577-1601. https://doi.org/10.32604/cmc.2023.034746
Received 26 July 2022; Accepted 14 December 2022; Issue published 06 February 2023
 View Full Text
 Download PDF
Abstract
The COVID-19 pandemic has spread globally, resulting in financial instability in many countries and reductions in the per capita gross domestic product. Sentiment analysis is a cost-effective method for acquiring sentiments based on household income loss, as expressed on social media. However, limited research has been conducted in this domain using the LexDeep approach. This study aimed to explore social trend analytics using LexDeep, which is a hybrid sentiment analysis technique, on Twitter to capture the risk of household income loss during the COVID-19 pandemic. First, tweet data were collected using Twint with relevant keywords before (9 March 2019 to 17 March 2020) and during (18 March 2020 to 21 August 2021) the pandemic. Subsequently, the tweets were annotated using VADER (lexicon-based) and fed into deep learning classifiers, and experiments were conducted using several embeddings, namely simple embedding, Global Vectors, and Word2Vec, to classify the sentiments expressed in the tweets. The performance of each LexDeep model was evaluated and compared with that of a support vector machine (SVM). Finally, the unemployment rates before and during COVID-19 were analysed to gain insights into the differences in unemployment percentages through social media input and analysis. The results demonstrated that all LexDeep models with simple embedding outperformed the SVM. This confirmed the superiority of the proposed LexDeep model over a classical machine learning classifier in performing sentiment analysis tasks for domain-specific sentiments. In terms of the risk of income loss, the unemployment issue is highly politicised on both the regional and global scales; thus, if a country cannot combat this issue, the global economy will also be affected. Future research should develop a utility maximisation algorithm for household welfare evaluation, given the percentage risk of income loss owing to COVID-19.Keywords
The COVID-19 pandemic has spread globally, causing financial instability in many countries and reductions in the per capita income. It has been speculated that the severity of the current situation has created the greatest global economic slump since World War II [1]. Economic activity in advanced economies was anticipated to decline by 7% in 2020, whereas emerging markets and developing economies were expected to experience a reduction of 2.5%, resulting in major financial difficulties [2]. This would cause per capita incomes to plunge and millions of people to fall into poverty [1]. This study focuses on the financial crisis faced by household members and the resulting decreased income expectations owing to lockdown measures. The increasing future uncertainty may indicate higher unemployment during the COVID-19 pandemic. This study shares various insights into the ratios of different unemployment rates before and during COVID-19 by analysing opinions and discussions on social media.
Sentiment analysis can be divided into several techniques, among which the most widely used are the lexicon-based, machine learning (ML), deep learning (DL), and hybrid approaches. In the unsupervised lexicon-based approach, the pre-built lexicon dictionary contains words or lexical features that have been tagged with their semantic orientation as either positive, neutral, or negative, which are subsequently compared to the words of a given text [3]. The most frequently used lexicon libraries for financial sentiment analysis include the Opinion Lexicon and Multi-Perspective Question Answering Subjectivity Lexicon [4]. Valence Aware Dictionary for sEntiment Reasoning (VADER) is another lexicon library that has been specifically designed to categorise sentiments in social media-related data. VADER achieved a state-of-the-art accuracy of 94% on financial texts from the StockTwits social network [5].
The supervised ML-based approach uses statistical methods along with input labels for the effective identification of word features that can enable a distinction between positive and negative sentiments [6]. Most studies have employed traditional ML techniques such as the support vector machine (SVM), naïve Bayes (NB), and logistic regression (LR) with different feature extraction methods, which have largely been demonstrated to achieve better performance than lexicon-based approaches [7]. An SVM outperformed both NB and LR when it was tested against the StockTwits dataset [5]. However, data sparsity problems have arisen from the use of lower-order n-grams, resulting in an inability to retain the word order of a sentence. Thus, DL methods have been developed to overcome this limitation by integrating multiple layers of nonlinear feature extraction and transformation units [8]. The most popular methods for performing financial sentiment analysis tasks include convolutional neural networks (CNNs), recurrent neural networks (RNNs), and long short-term memory (LSTM) [4]. However, no comparisons exist of different methods for handling data sparsity while retaining the word order. Henceforth, this paper describes different word embedding techniques and presents the classification accuracy of these DL methods.
This study explored social trend analytics using sentiment analysis techniques with social media to capture the risk of income loss among households during the COVID-19 pandemic. Comparative evaluations were performed on various ML approaches, with annotations using VADER owing to its greater performance accuracy with financial texts. The strength of each technique and the hybrid DL techniques were investigated to enhance the performance further. First, tweet data were collected through the Twitter Intelligence Tool (Twint) using relevant keywords (e.g., Malaysia unemployment). The data duration was separated into pre-pandemic period tweets from before the Movement Control Order (MCO) from 19 March 2019 to 17 March 2020 and those sent during the MCO period from 18 March 2020 to 21 August 2021. Subsequently, the tweets were processed to obtain their semantic orientations using VADER, and they were later used as training data in ML classifiers. The performance of several DL classifiers was compared with that of an SVM. The SVM was used as a benchmark method because its linear kernel has been shown to perform better than other kernel types for many domains [9]. The research questions for this study were used to test the hypothesis that unemployment sentiment using social media had a significant impact on the economy during COVID-19. These questions also relate to the sentiment classification performance tests of the hybrid sentiment analysis approach with various DL techniques and traditional ML techniques.
Research Questions
• RQ1: Which effects does word embedding have on the sentiment classification performance?
• RQ2: How do various sentiment analysis approaches using LexDeep models compare with the traditional method (SVM) in the context of unemployment tweet classification?
• RQ3: Did unemployment rise significantly during COVID-19?
Hence, the contributions of this study are as follows:
• We propose LexDeep models over a classical ML classifier to perform sentiment analysis tasks for unemployment sentiments during and before the COVID-19 pandemic in Malaysia, Saudi Arabia, and globally.
• We added an embedding layer to the proposed approach to demonstrate the effects of word embedding on the sentiment classification performance.
• We calculated the ratios between the negative and positive sentiments for each dataset. These ratios were used to compute the differences during and before the COVID-19 pandemic to show the unemployment rate and to discuss economic stability in Malaysia, Saudi Arabia, and globally.
The remainder of this paper is divided into four sections. A discussion of the advantages and limitations of previous research studies is presented in Section 2. Section 3 outlines the retrieved datasets and the implementation steps of the sentiment analysis approaches. Section 4 presents the findings that were obtained through experimentation with classifiers, as well as a performance comparison with traditional ML techniques. This section also outlines the ratio of differences between the analysed unemployment tweets, and discusses reports on unemployment and economic stability. Finally, Section 5 summarises the findings and contributions of this study.
Twitter generates a considerable amount of data that can be analysed to gain valuable insights using sentiment analysis. Sham et al. [10] presented the use of the lexicon-based, ML, and hybrid approaches for climate change sentiment analysis. Their study indicated that lemmatisation improved the performance of both the ML and hybrid approaches, whereas the feature extraction technique Term Frequency and Inverse Document Frequency (TF-IDF) improved the performance of LR classifiers. A study by Wunderlich et al. [11] focused on the use of lexicon-based sentiment analysis in sport, specifically from tweets relating to top football matches, resulting in the analysis of 10,000 selected tweets that were manually and automatically annotated and categorised into “positive”, “negative”, “neutral”, or “nonsense”. The results indicated that lexicon-based sentiment analysis can accurately categorise sports tweets and answer many sports-related questions, such as those of sports economics. Social media analysis has not only focused on Twitter data. A study by [12] used news articles, blogs, and Twitter data to predict the unemployment rate in Korea. The dataset covered social and public opinions on unemployment. The authors could reduce the error rate resulting from the Google Index-based model by a 27.9% mean absolute error.
Unemployment can affect the psychological state of an individual, with extreme cases leading to suicide attempts. Therefore, many researchers have focused on understanding the causes of unemployment. Employment may be affected by several factors. The author of [13] attempted to analyse people's feelings regarding the influence of technology on employment, followed by the use of an NB classifier to categorise the analysed sentiments. According to [13], 65% of individuals were concerned about the influence of technology on employment and technical progress; as a result, new skills were acquired to address new employment challenges. According to this study, an important factor that could affect the quality of the results was the selection of relevant keywords. One means of selecting keywords is to trawl reliable world reports that are associated with jobs. In this study, the data were pre-processed and the TF-IDF method was used to transform them into word vectors. The data included 1,074 tweets, among which 974 tweets were used for training and the remaining data were used for testing. The classification results showed that the NB outperformed the SVM, achieving 87.18% and 82.05% accuracy, respectively.
The study in [14] focused on the influence of the pandemic in Italy, which was among the countries most affected by COVID-19. The resulting lockdown under the MCO caused social, environmental, and economic changes. The regions were often affected differently because of the socioeconomic gaps between them. According to [14], the southern region and islands had the highest unemployment rates in Italy, whereas the economic status of the central and northern regions was higher. The average unemployment rates in the south, islands, north, and centre during COVID-19 were 16.8%, 16.2%, 5.7%, and 8%, respectively. This study analysed sentiments in pandemic-related tweets in 10 different Italian cities by comparing various regional indices and focusing on the emotions of fear, anger, and joy. A total of 4,227,882 English and Italian COVID-19-related posts between 2 March 2020 and 15 June 2020 were selected. Keywords relating to the pandemic were used to gather data and the sentiments were determined based on the NRC Emotion Lexicon. An everyday measure of the three emotions was calculated to study the emotions in relation to the number of COVID-19 cases and various socioeconomic features, such as the political decisions that were made during different phases. The results demonstrated that the trends involving the different emotions varied across regions, but they correlated with various events and lockdown policy phases.
To the best of our knowledge, few studies have focused on analysing tweets to determine how COVID-19 has affected unemployment rates. One example is a comparative study by [15] involving Nigeria, South Africa, and Canada, which have different income levels. The study employed the Phillips curve to analyse publicly available data, tweets, and Google searches relating to economic changes between the periods before and during COVID-19. The authors compared different national responses and near-future predicted responses to the economic crisis due to the pandemic. Owing to the rapid changes and to identify the spikes that occurred during the pandemic, the study evaluated unemployment and inflation rates monthly. The keywords that were used to gather data included “unemployed”, “employed”, and the Google Mobility Index. A total of 24,421 tweets were obtained during these two periods. The sentiment analysis model was based on Bidirectional Encoder Representations from Transformers (BERT). The BERT approach was used to measure unemployment rates in South Africa and Nigeria, as each country lacked monthly rates. In total, 3,600 tweets were manually labelled and divided into 2,000 for training, 800 for testing, and 800 for cross-validation. The Phillips curve revealed that, during the COVID-19 pandemic, the unemployment rate of Nigeria surged, surpassing that of South Africa. A comparison of previous and current years indicated that unemployment rates in all three countries increased between 2020 and 2021. The findings also suggested that Canada could manage its unemployment rate.
A survey in [4] reviewed the sentiment analysis work that was undertaken in the financial sector. Financial sentiment analysis studies are based on the lexicon, traditional ML, and DL models that are used to work with financial texts. The most frequent sources of financial data include social media and news, whereas other data sources include company disclosures, such as annual reports. Some researchers use publicly available financial data, whereas others collect financial data. The use of different data sources has been demonstrated to enhance the sentiment analysis results, such as when micro-blogs are used with news text. Different factors are crucial for text analysis. For example, the use of various news sources rather than focusing on one can produce better text analysis. One drawback of depending on sentiment lexicons is the possibility that they miss the context of some text and produce less accurate results, which depends on the dictionary that is used in the analysis. The identification of the polarity of financial tweets using traditional ML models has produced promising results. The ML application mentioned in [6] was based on stock tweets. Some studies have combined traditional ML techniques with lexicon-based techniques to improve the results. One drawback of ML is that it misses the order of the text and location of words. Thus, DL techniques have been used to overcome this problem. The most frequently used word embedding techniques are Word2Vec and Global Vector (GloVe), whereas the most frequently used DL techniques are CNNs, RNNs, and LSTM. Some textual data include a variety of sentiments; therefore, attention mechanism techniques are required to produce better results.
A financial sector application that used an ensemble approach to integrate sentiment analysis (based on finance-specific dictionaries) and topic detection (based on latent Dirichlet allocation) was presented in [16]. The integrated model predicted 15 major US stocks 24 h ahead using a deep neural network (DNN). The DNN was used to overcome the limitations of state-of-the-art approaches. Financial news was gathered from www.reuters.com between 2012 and 2017. The model, which was built between 2012 and 2016, was tested in 2017. The performance of the suggested stock movement prediction model demonstrated that the integration of sentiment analysis and topic detection produced better results and that the DNN surpassed traditional ML methods.
The study in [5] investigated the efficacy of combining a collection of expert opinions (sentiments) on stock movements based on lexicon methods. StockTwits posts of experts, which included their opinions on different stocks, were gathered from January 2015 to June 2016. The posts of leading experts were analysed using the VADER, SentiWordNet, and TextBlob sentiment lexicons to determine their views on certain stocks. The results revealed that VADER was the best-performing model, and it outperformed traditional ML techniques such as SVM and NB. In another study [8], DL models were used instead of lexicon-based methods to predict stock movements based on the sentiments expressed in expert posts on StockTwits. LSTM, doc2vec, and CNNs were deployed to test the proposed approach. The data were collected between January 2015 and June 2015. The chi-squared, ANOVA, and mutual information feature filtering methods were employed to improve the results. The results demonstrated that the DL models could successfully predict stock movements and the CNN outperformed the other models (LR, LSTM, and doc2vec).
This section discusses the LexDeep sentiment analysis process, which consists of data collection, data pre-processing, data labelling, the application of different types of word embedding techniques, and classifiers to evaluate the performance. The following subsections are divided accordingly and the components are presented in Fig. 1.
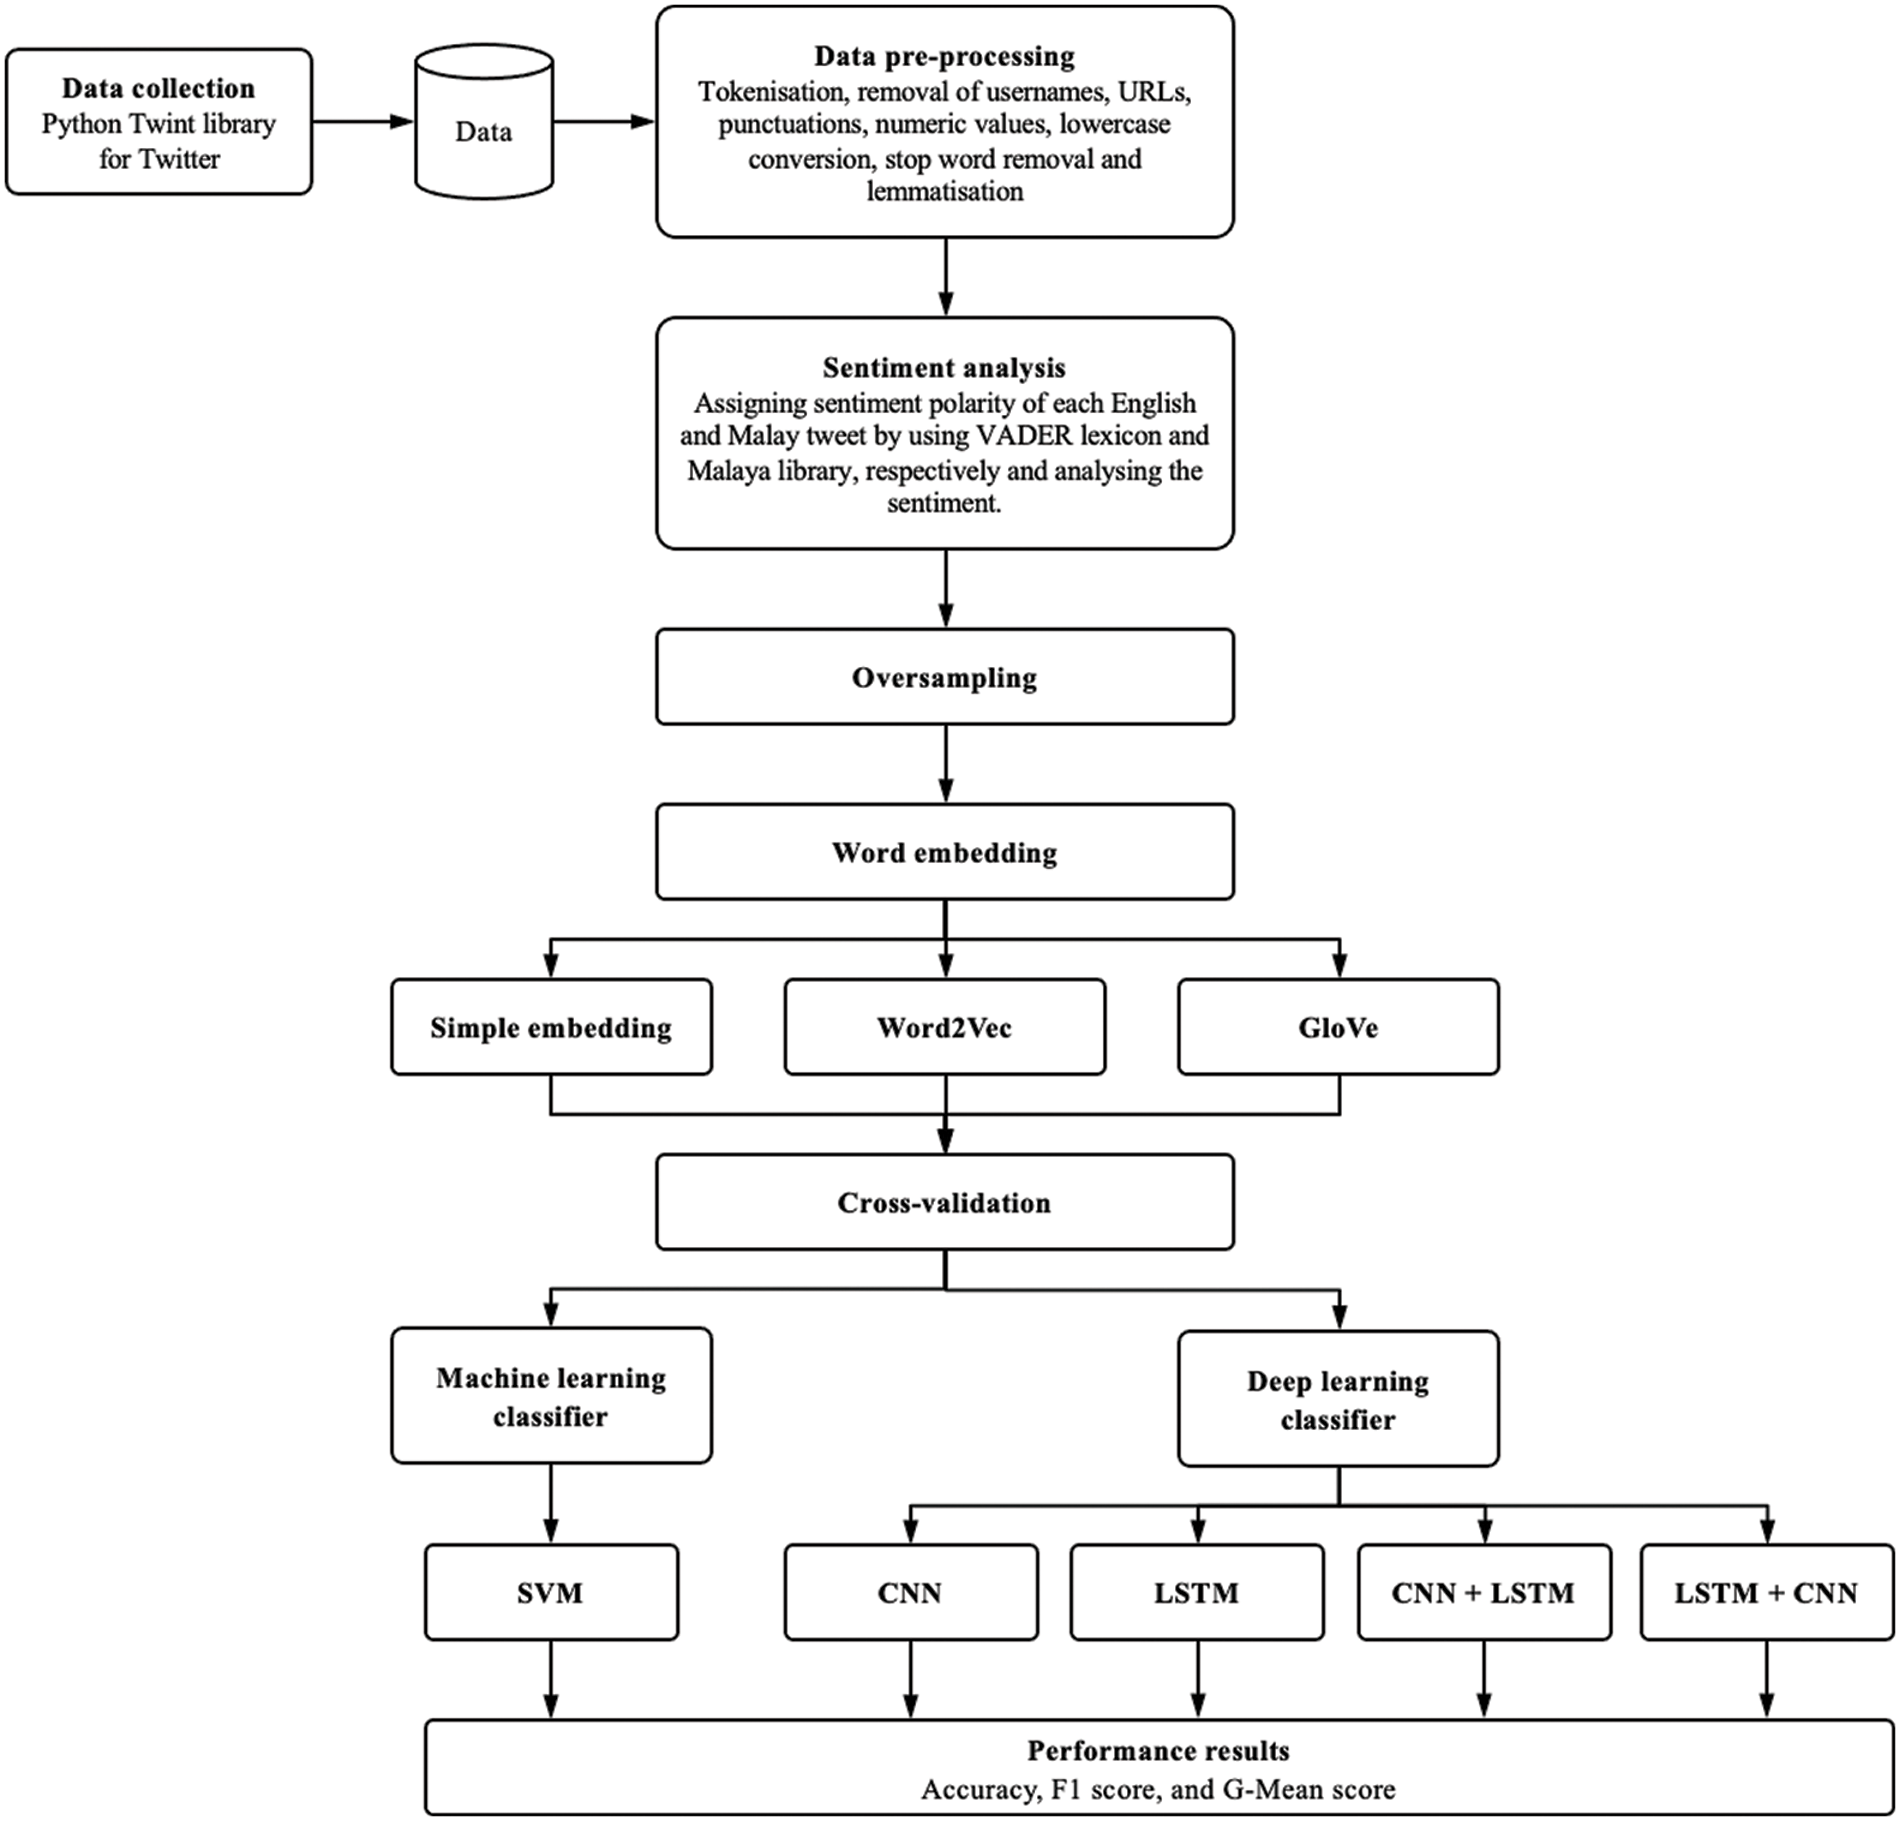
Figure 1: Proposed LexDeep sentiment analysis process flow
The collection of data from Twitter was conducted via Twint using relevant keywords (e.g., Malaysia unemployment). Two different datasets were queried to characterise the evolution of discussions on unemployment before and during the COVID-19 pandemic. The data included tweets that were collected between 18 March 2019 and 18 March 2020, indicating the period before the pandemic, and those from 19 March 2020 onwards, indicating the period during the pandemic following the start of the MCO.
The tweets were pre-processed prior to further analysis, which included tokenisation, removing usernames, URLs, punctuation, and numeric values, and converting emojis into text. Thereafter, the tweets were converted into lowercase tweets before the stop words were removed from the NLTK library. The stop word list was augmented with keywords that were used to query the data. Finally, lemmatisation was performed to convert the words into their base form. The two pre-processed datasets were stored separately as a .csv file.
3.3 Proposed Hybrid Sentiment Analysis Approach (LexDeep)
The proposed LexDeep approach consists of three main parts: a lexicon-based approach, an embedding layer, and a DL method.
The tweets were analysed for sentiments using the VADER lexicon, which can be accessed through the NLTK library. VADER returned metric values containing negative, neutral, positive, and compound scores for all tweets, which were normalised between −1 and +1. The compound score was used to determine the sentiment polarity of the tweet based on the standard threshold of 0.05, whereby a compound score greater than the threshold value was labelled as positive and vice versa. Meanwhile, a compound score between −0.05 and +0.05 was regarded as neutral. These labels were used as the target class in the supervised ML and DL classifiers. The obtained polarity was analysed to uncover the sentiments of the masses regarding unemployment.
To avoid classification bias within the imbalanced datasets, random oversampling of the minority class (positive sentiments) was conducted until it reached the same count as that of the majority class (negative sentiments).
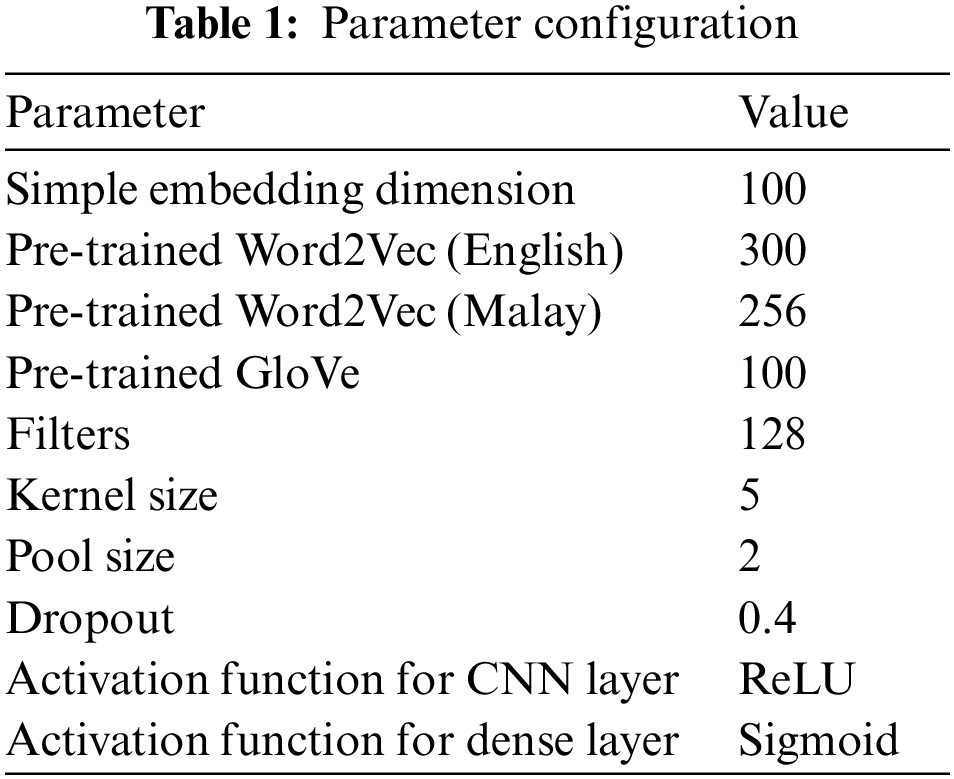
The embedding layer included the implementation of different word representations for text analysis. These methods were tested to demonstrate the improvement in the performance of the classifiers. The simple embedding method was trained on the dataset itself, and pre-trained embeddings, namely GloVe and Word2Vec, were also used in the experiments. Pre-trained models are trained to solve similar problems to save time and improve efficiency. GloVe embedding (“glove-twitter-100”) with a dimension of 100 was retrieved through downloads from the Gensim library. This embedding was trained on two billion tweets from Twitter containing 27 billion tokens and a vocabulary of 1.2 million items. Word2Vec embedding (“word2vec-google-news-300”) with a dimension of 300 was also retrieved from the Gensim library. It was trained on the Google News corpus containing approximately 100 billion words. For the Malay datasets, Word2Vec embedding with a dimension of 256 was retrieved from the Malaya library. It had been trained on the Twitter and Instagram corpora, and contained a vocabulary of 1.3 million items. The embedding represented the list of words in the corpus as vectors that could be used as input into the DL algorithms to build the classification models. These embeddings are commonly used in many instances and have produced favourable results [17–19].
In this study, the LexDeep models were built using four DL techniques: CNN, LSTM, CNN-LSTM, and LSTM-CNN.
• CNN
CNNs have been widely recognised for their ability to learn the local features of a multidimensional field. The basic architecture of the CNN that was used in this study comprised embedding layers in which the multidimensional representation of the data was fed into the model. The convolutional layer consisted of a size 128 filter, size five kernel, and ReLU activation function. These filters learned the features of the data. The output that was obtained from the convolutional layer iwas transferred to the max pooling layer, where these features were compressed to extract only the main features and to remove unnecessary or redundant information from the convolutional feature map. The max pooling layer was selected because the most influential features in ultimately determining the final sentiment classification are typically only several words in a sentence [20]. A dropout layer followed, with a probability of 0.4 to avoid model overfitting. A dropout rate of 0.4 yielded the highest accuracy for a hybrid CNN-RF when tested with 3,000 product reviews [21]. Finally, the fully connected layer converted the input feature matrix into the interval [0, 1], where a value of 0 or 1 indicated that the tweet was negative or positive, respectively. The characteristics of structured and organised sentences served as the basis for the intuition of the CNN, as they could reveal important features, regardless of the positions of the words in the texts.
• LSTM
LSTM, which is a type of RNN, can retain information for a given period; however, the RNN becomes deficient when the data have longer dependencies. The three LSTM gates are the input gate, which controls the input of new information into the memory, the forget gate, which controls how long certain information is held in the memory, and the output gate, which controls how the activation function will be triggered based on the amount of information that is stored in the memory. As LSTM can retain the memory of what it has read previously, it has a superior ability to understand the input.
• Combination of LSTM and CNN
The CNN layer can be combined with the LSTM layer to produce either the CNN-LSTM or LSTM-CNN model, depending on which layer is trained first. The intuition behind the CNN-LSTM combination is that the CNN convolutional layer extracts the local features, whereas the LSTM layer learns the long-term dependencies of those features owing to its memory unit.
Meanwhile, for the LSTM-CNN combination, the LSTM layer generates new encoding that contains the information of the initial and previous tokens from the input vector; subsequently, the CNN layer extracts the local features therefrom [17]. A dropout layer with a consistent probability of 0.4 was added before and after the LSTM layer in the CNN-LSTM model. The dropout layer in the LSTM-CNN model was added immediately after the LSTM but before feeding the matrix into the CNN to prevent the algorithm from overfitting.
The maximum dimension of the padding was set to 100; therefore, if the tweet length was smaller than this value, a series of 0 would be added, which could lead to a sparse dimension. All models employed adaptive moment estimation (the Adam optimiser), which was designed specifically for training DNNs by determining the individual learning rates for each parameter. Meanwhile, the sentiment polarity of the tweets was generated using the dense layer, which acted as a fully connected layer with a sigmoid activation function. The cost function of all DL models was set to binary cross-entropy, which compares the predicted probabilities with the actual output. These could be either 0 or 1, indicating a negative or positive sentiment, respectively. This cost function penalised any predicted probabilities that diverged from the expected output. The configuration of each parameter is presented in Table 1.
In this study, an SVM was selected as the baseline. The main objective of an SVM is to determine the hyperplane with the maximum margin or distance between support vectors. This hyperplane forms the basis of the boundary between sentiment classes, which are positive, neutral, and negative. A key parameter during training is the kernel, which projects the support vectors from low- to high-dimensional space. The linear kernel has been demonstrated to yield higher performance than other kernel types [9]. The feature extraction technique that was used when training the SVM was TF-IDF, which compares the words in a document and their relevance within the overall document.
3.4 Evaluation Measurements and Cross-Validation
The accuracy, F1 score, and G-mean score were recorded for the training of each model. A low score for the performance metric indicates poor performance of the DL model in the sentiment classification. The shuffling of the training data during cross-validation prevented the influence of the sample position within the dataset during the learning process.
This section presents the experimental results, interpretation, and conclusions drawn for each approach. This subsection begins with the lexicon approach, followed by the results of the various DL classifiers. Subsequently, their performance compared to that of a traditional ML approach, namely the SVM. Finally, a discussion of the findings is presented.
Eight datasets specifying three different geographical regions were obtained through the previously defined data collection process and were compiled into separate .csv files. Each file was checked for any duplications before sentiment polarity detection was performed. The Malaya library and VADER lexicon were used for the automatic annotation of the Malay and English texts, respectively. As both modules consider several characteristics of the input texts, no data pre-processing was conducted in advance because this could affect the final sentiment polarity output of both modules. Furthermore, the Malaya module was trained on standard Malay, which included social media texts, so no language detection was conducted with Manglish texts. Using VADER, every word in each sentence was analysed and matched with the words that were available in this lexicon to yield the compound score. Therefore, any non-English words were skipped and the overall compound score was unaffected.
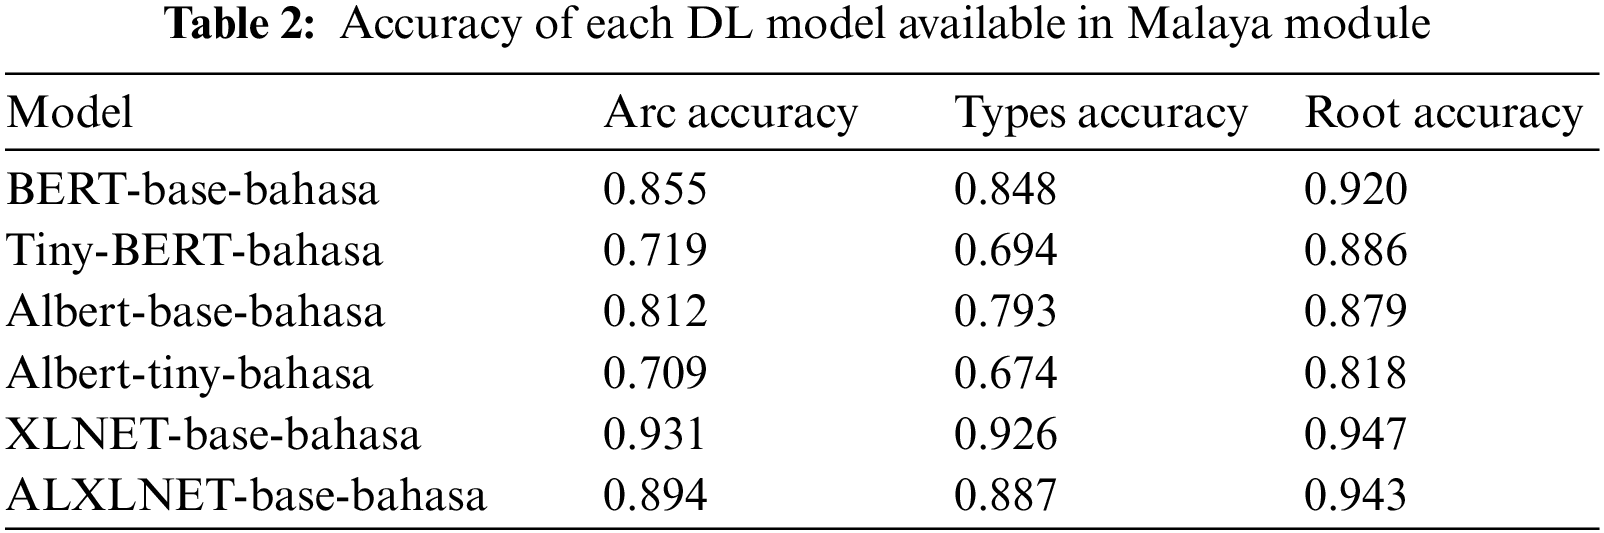
4.1.1 Malaya Sentiment Analysis Module
The Malaya sentiment analysis module designed by the authors of [22] is a natural language toolkit library that was developed for Bahasa Malaysia using DL TensorFlow. Several pretrained Transformer encoder models are available for use, and their performances are listed in Table 2. Tiny-BERT-bahasa was selected as the sentiment polarity detection model for the Malaysia Unemployment (Malay) datasets owing to its more accurate and efficient processing capability compared to other DL models. The output of this sentiment module was “negative”, “neutral”, or “positive”. However, any texts labelled “neutral” were discarded from further analysis. BERT, which is a DL model that was developed by Google in 2018, was pre-trained on a large corpus using the next-sentence prediction and masked language modelling methods. BERT is regarded as a state-of-the-art sentiment classification approach because it can be fine-tuned to suit sentiment classification tasks. Therefore, it does not require a large training corpus [23].
4.1.2 Sentiment Polarity Distribution
As indicated in Table 3, the sentiment polarity distribution for each dataset was grouped based on the periods before and during the MCO period. Tweets with neutral sentiments were removed prior to the analysis as they did not contribute to the overall sentiment on unemployment. Among the 28,622 tweets in the global datasets, 35 contained the keywords “KSA”, which represents the Kingdom of Saudi Arabia, or “Saudi”, whereas six contained the keyword “Malaysia”, meaning that these tweets could be present in the Malaysia and Kingdom of Saudi Arabia (KSA) datasets as well as the global datasets simultaneously. However, because of their insignificant percentage, they did not affect the sentiment outcome that was recorded for either country.
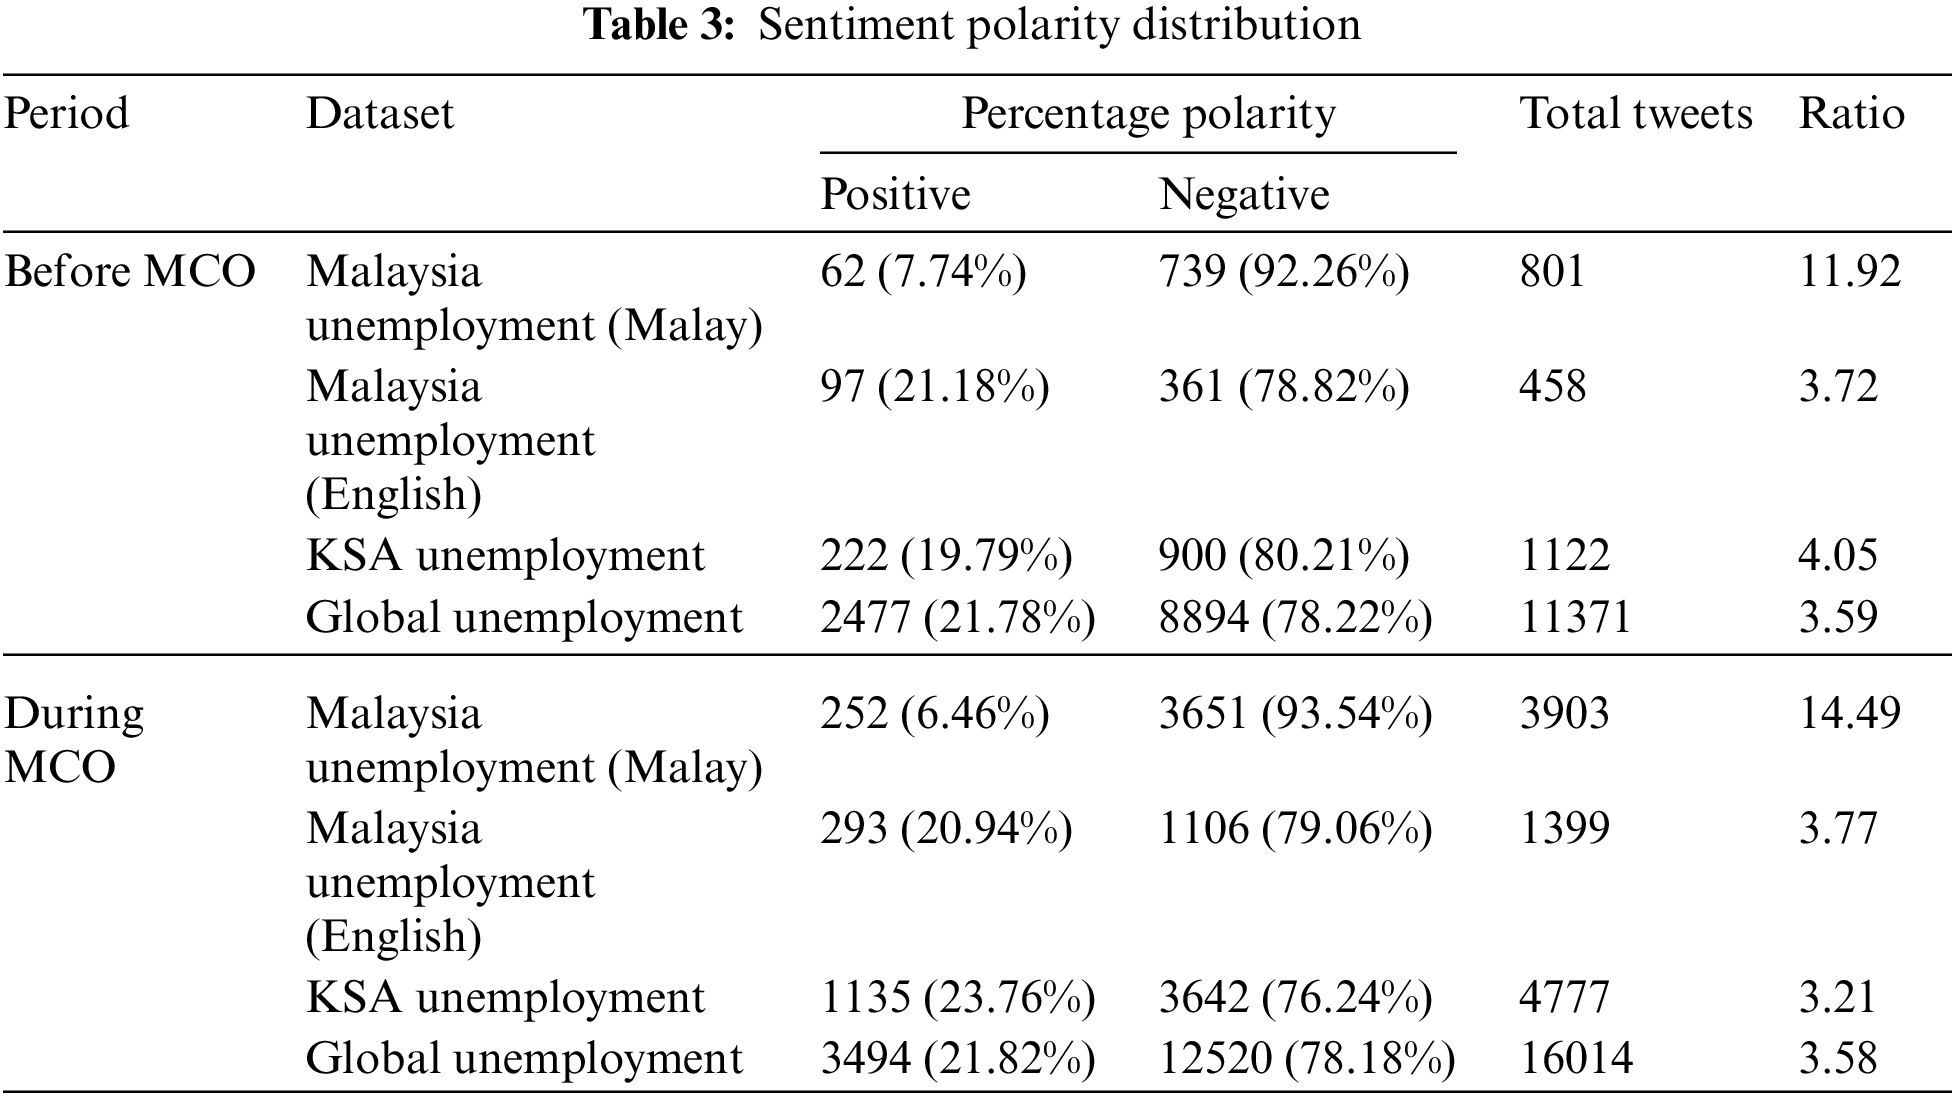
In general, the total number of tweets in the datasets during the MCO period exceeded the number in the corresponding datasets before the MCO period, indicating that slightly more people voiced their unemployment concerns during the MCO period. It can be observed that negative sentiments dominated the positive and neutral polarities for each dataset. In this study, the sentiments of Malaysians, Saudi Arabians, and the global population were examined for the period between 18 March 2019 and 21 August 2021. The sentiment analysis highlighted that the general sentiments towards unemployment-related discussions were negative in all regions, even before the COVID-19 pandemic affected the world.
The ratios between the negative and positive sentiments were calculated for each dataset, followed by the differences between the periods before and during the MCO. Eqs. (1) and (2) were used for the calculations:
The Malay and English datasets from Malaysia indicated an increase in the ratio between the negative and positive tweets, especially the former: 2.57 times more negative tweets were identified during the MCO period than before the MCO period, as shown in Table 4. However, the KSA dataset revealed a decrease in the ratio, with 0.84 times more positive tweets. This indicates that people in the latter country generally adopted a more positive outlook on unemployment during the MCO period than before it.
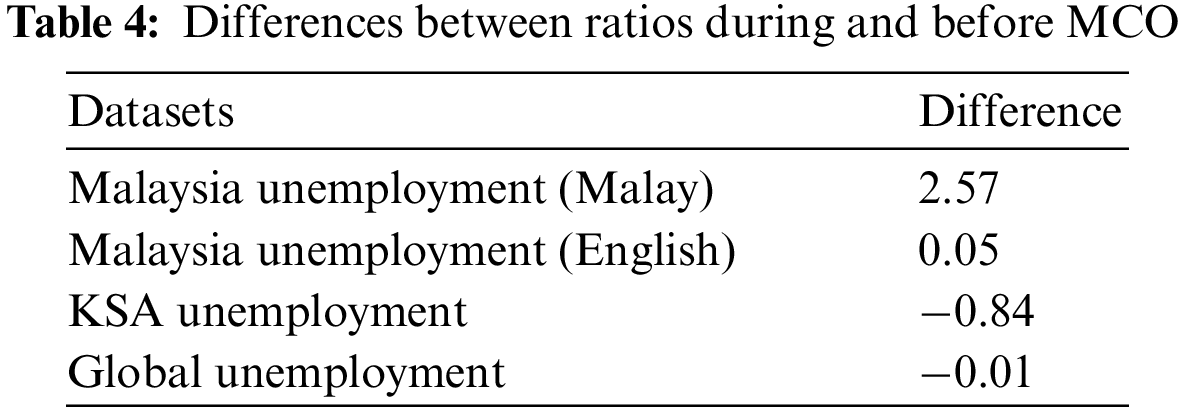
An insignificant change of 0.04% was evident in the negative sentiments of the global population, which means that unemployment-related discussions on the global scale did not represent people from a specific region or country. The unemployment issue is highly politicised on both the regional and global scales. If a country cannot combat this issue, its global economy will also be affected.
With reference to the imbalanced sentiment polarity distribution presented above, various experiments were conducted before the classification process to ascertain the optimum threshold values for the numbers of epochs and folds.
As the Malaysia Unemployment During MCO (Malay) dataset was highly imbalanced, with a negative-to-positive tweet ratio of 15.40:1, several experiments were conducted to determine the threshold values for the number of epochs and number of folds. The first experiment tested the optimum number of folds and was performed by training all of the DL models; that is, CNN, CNN-LSTM, LSTM, and LSTM-CNN, with different embeddings, namely simple embedding and pre-trained Word2Vec. With a constant number of 10 epochs, the results indicated that when increasing the number of folds in the cross-validation from two to five, the performance of all DL models improved. However, when the number of epochs was set to five, no improvement was observed in the performance of either LSTM or LSTM-CNN. The number of k-folds in the cross-validation was set to two, which is equivalent to a single train-test split. Furthermore, increasing the number of folds from two to five doubled the training time for the latter.
The second experiment tested the optimum number of epochs by maintaining the number of folds constant at five. The results indicated that when increasing the number of epochs from five to 10, the performance of all DL models improved. However, when the number of epochs reached 20, several models started to exhibit signs of overfitting by generating poorer performance. For example, when the model was trained using simple embedding and a constant number of five k-folds was maintained, the CNN and LSTM-CNN exhibited poorer performance when the number of epochs was 20 compared to when it was 10. The “learning rates” differed for each model, in that overfitting could occur sooner when the number of epochs increased. In general, increasing the numbers of folds and epochs improved the performance of the CNN and CNN-LSTM models.
For the models that exhibited improved performance when the number of epochs was 20, the G-mean scores increased only slightly between 10 and 20 epochs compared to those between five and 10 epochs. For example, the CNN with pre-trained Word2Vec embedding yielded a 4.02% higher G-mean score between 10 and 20 epochs compared to a 9.56% increase between five and 10 epochs. For this reason (this marginal increase in performance), together with the possibility of overfitting when 20 epochs were used, further experiments with other datasets excluded 20 epochs as a parameter. Another reason for discarding 20 epochs was to cater for a longer training time without significantly affecting the model performance. The optimum number of epochs and k-folds for the CNN, CNN-LSTM, LSTM, and LSTM-CNN using simple embedding aligned with the numbers that were obtained using pre-trained Word2Vec. For example, the optimum epoch and k-fold numbers were 10 and five for the CNN when it was trained using simple embedding and pre-trained Word2Vec, respectively. The same optimum values were identified for all other DL models. Thus, only the CNN with simple embedding was used to determine the configuration of epochs and k-folds for all DL models of the other datasets, as shown in Table 5.
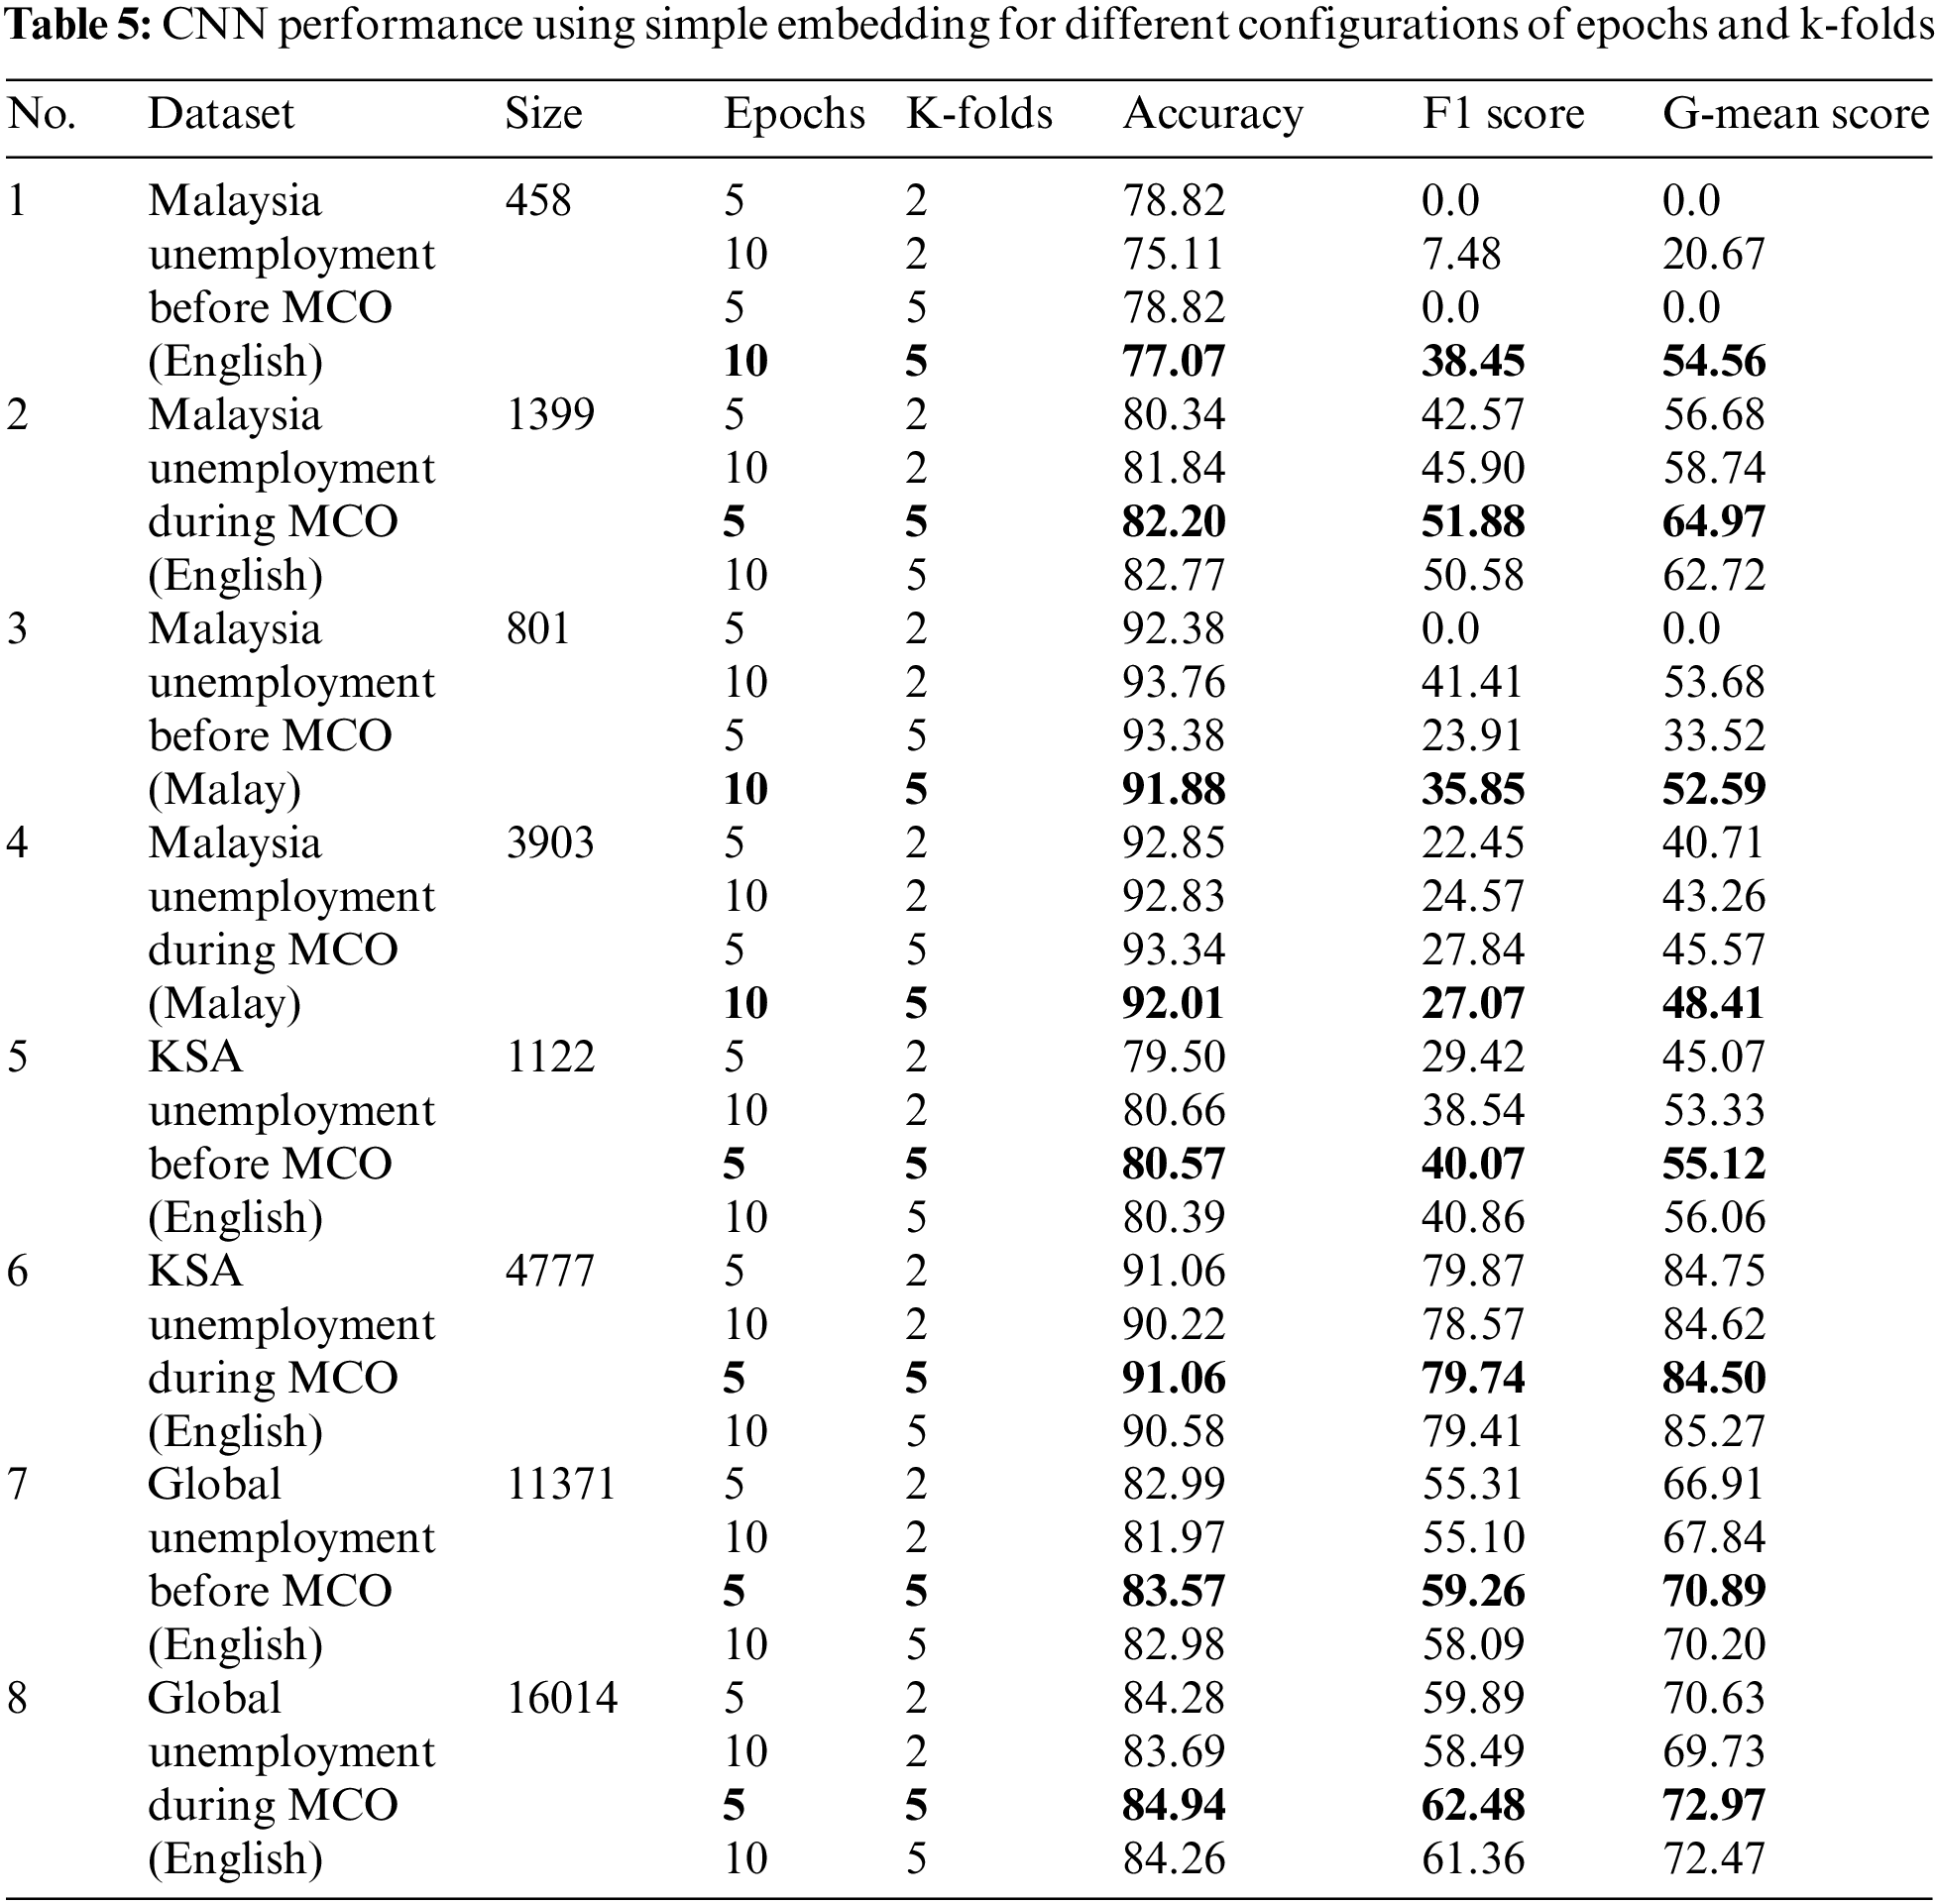
Therefore, an experiment to determine the best configuration was conducted by varying the initial five epochs and increasing the number to 10, together with a change from two to five k-folds. The configurations of the epoch and k-fold numbers that were used for each dataset are summarised (and are indicated in bold font) in Table 5. The accuracy performances, which were considered as the appropriate configuration for each dataset, were compounded with the performances of the F1 and G-mean scores. These highlighted epochs and k-folds were used in later experiments with each DL classifier.
4.2.2 Performance of Each DL Classifier for Each Dataset
With reference to Table 6, the best-performing DL model that had been trained using simple embedding, pre-trained GloVe, or Word2Vec for the Malaysia Unemployment Before MCO (English) dataset was the CNN, with G-mean scores of 93.88%, 93.97%, and 94.29%, respectively. For both pre-trained GloVe and Word2Vec, the worst-performing deep learning model was LSTM, whereas the worst performance for simple embedding was attained by LSTM-CNN. Furthermore, DL models such as the CNN and CNN-LSTM, which were trained using pre-trained Word2Vec, outperformed their counterparts that used either simple embedding or pre-trained GloVe.
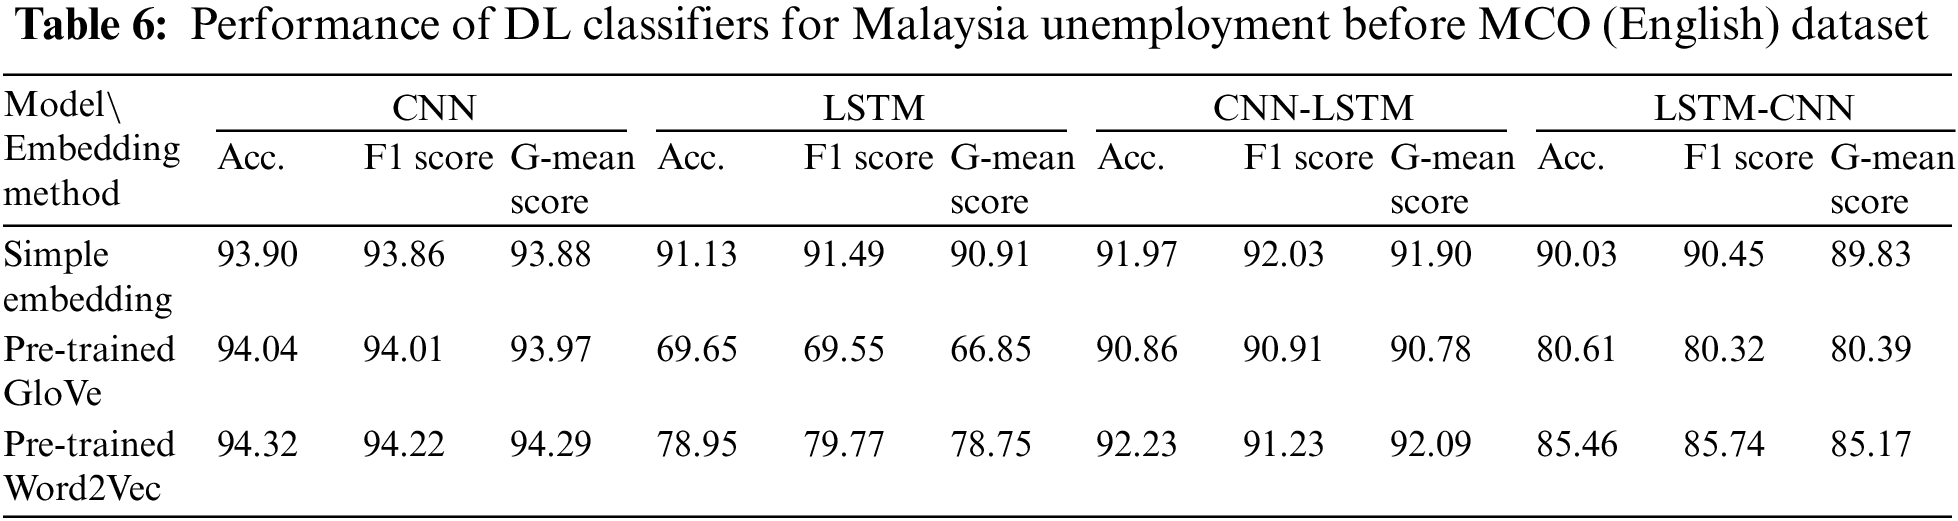
Table 7 indicates that the best-performing DL model that was trained using simple embedding or pre-trained Word2Vec for the Malaysia Unemployment During MCO (English) dataset was the CNN-LSTM, with G-mean scores of 95.57% and 94.18%, respectively. The best performance for pre-trained GloVe was attained by the CNN, with a G-mean score of 93.05%. The worst-performing DL model for all embeddings was LSTM. Furthermore, the DL models that were trained using either simple embedding or pre-trained Word2Vec outperformed their model counterparts that used pre-trained GloVe for embedding. One noteworthy observation is the breakdown (in terms of performance) of both LSTM and LSTM-CNN when they were trained using GloVe and Word2Vec embedding.
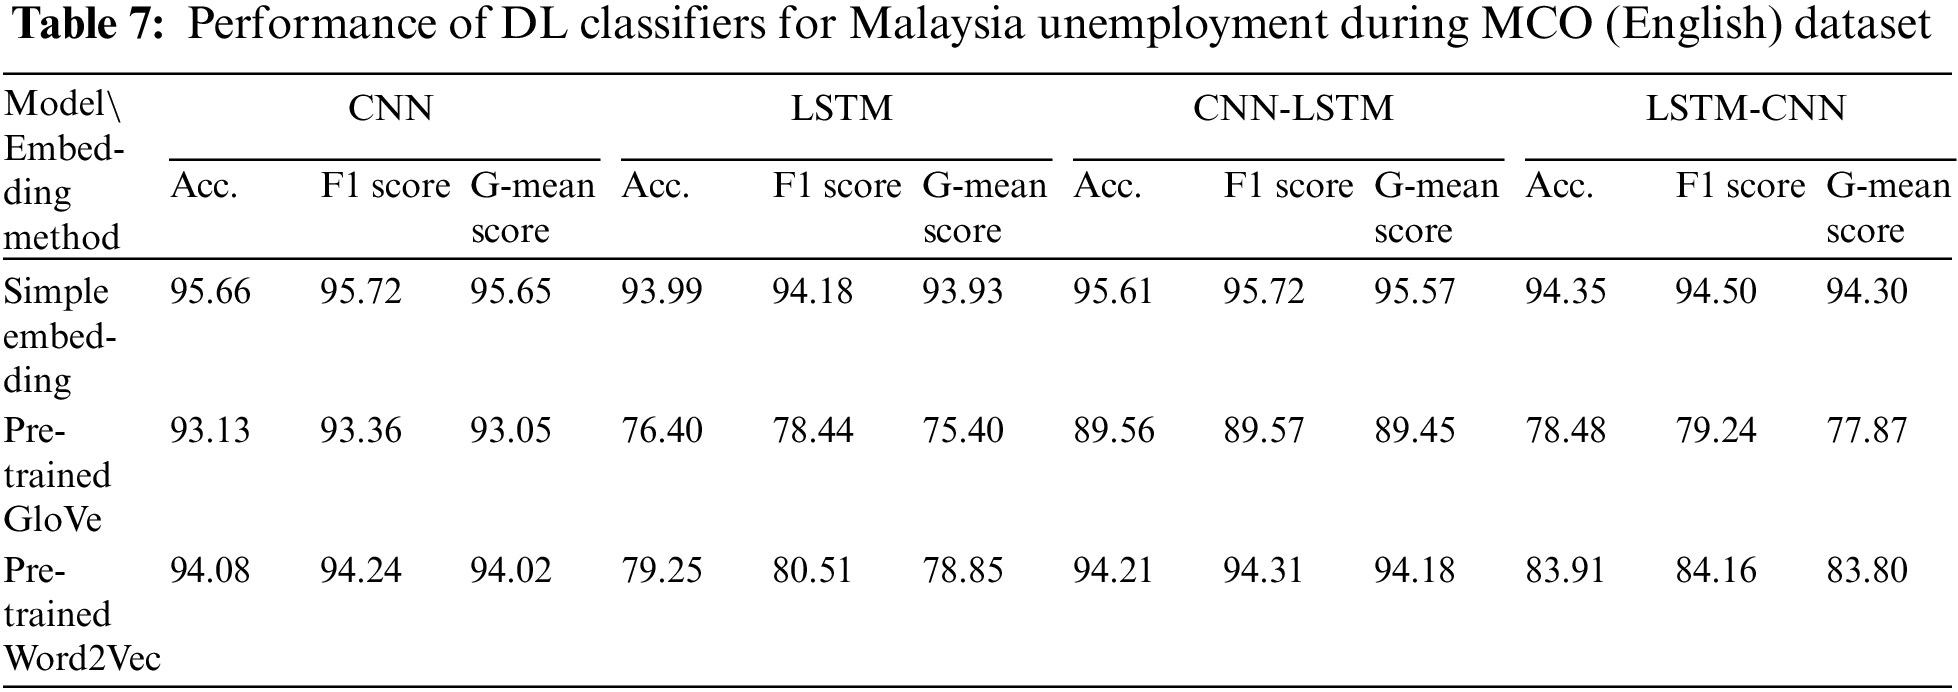
Table 8 shows that the best-performing DL model that was trained using simple embedding for the Malaysia Unemployment Before MCO (Malay) dataset was the CNN, with a G-mean score of 98.78%. The best performance for pre-trained Word2Vec was attained by the CNN-LSTM, with a G-mean score of 98.64%. For simple embedding, the worst performing DL model was the CNN-LSTM, whereas the worst performance for pre-trained Word2Vec was attained by LSTM. Furthermore, the DL models that were trained using simple embedding outperformed the corresponding models that used pre-trained Word2Vec as the embedding for both LSTM and LSTM-CNN. However, comparable results were obtained for these embeddings when they were used to train the CNN and CNN-LSTM models.
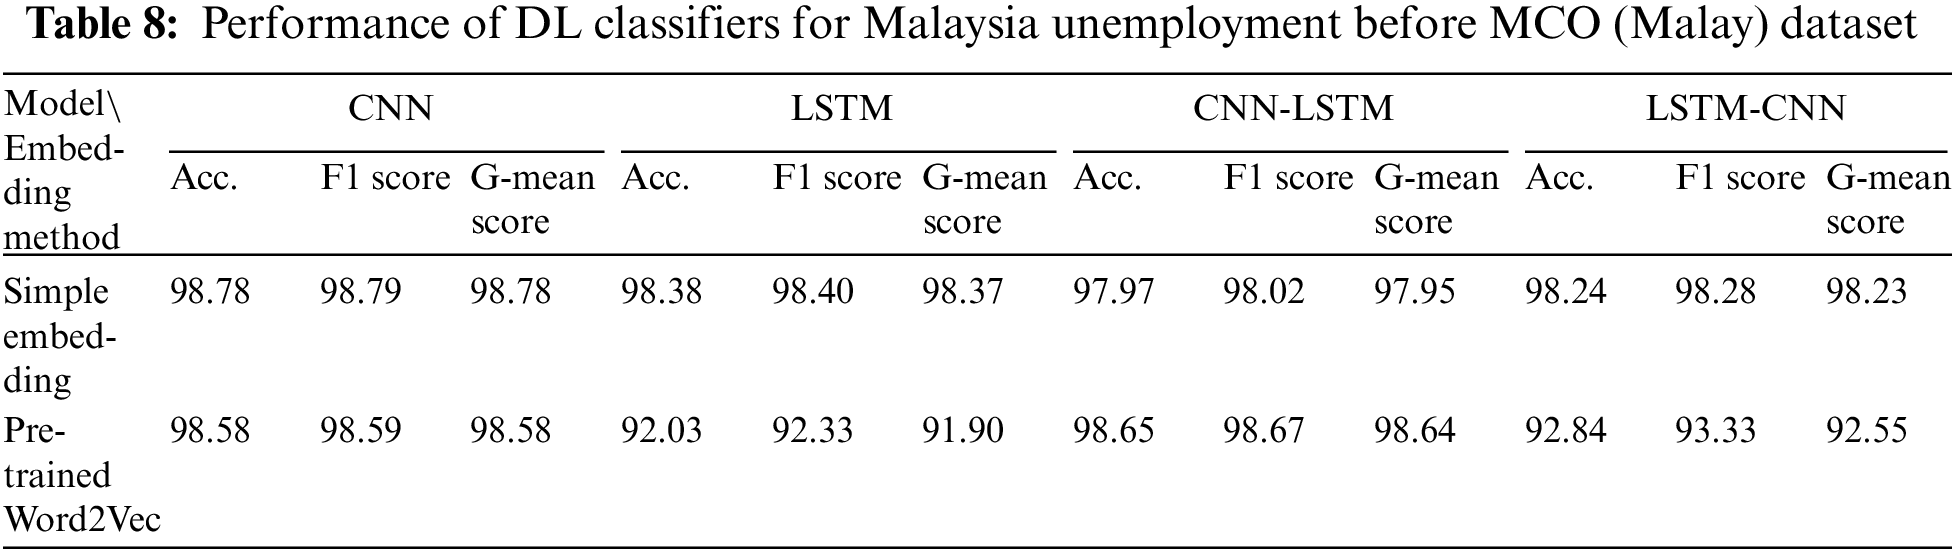
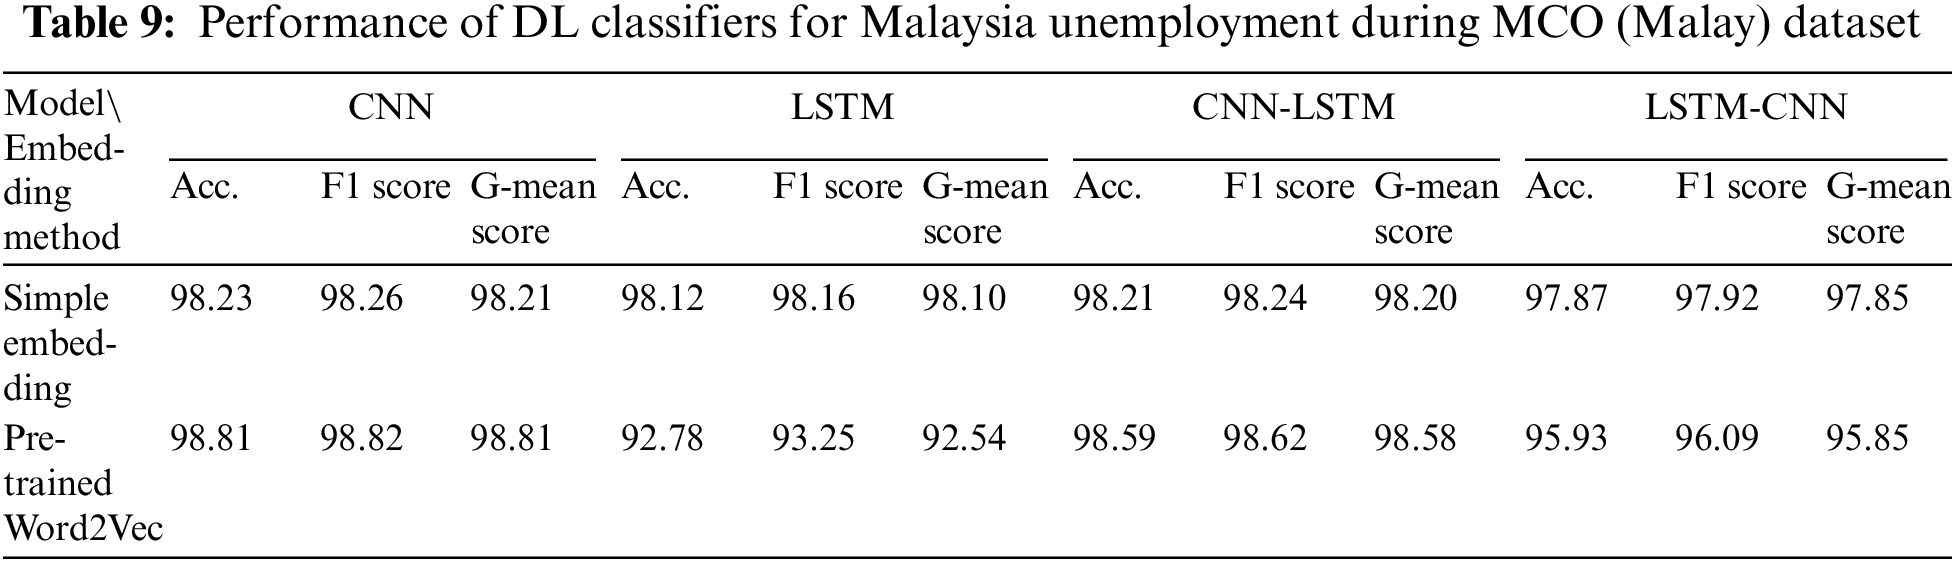
Table 9 shows that the best-performing DL model that was trained using both simple embedding and pre-trained Word2Vec for the Malaysia Unemployment During MCO (Malay) dataset was the CNN, with G-mean scores of 98.21% and 98.81%, respectively. For simple embedding, the worst-performing DL model was LSTM-CNN, whereas the worst performance for pre-trained Word2Vec was attained by LSTM. Only a slight decrease in performance was identified when pre-trained Word2Vec was used instead of simple embedding for training both LSTM and LSTM-CNN. Meanwhile, for the CNN and CNN-LSTM, the use of pre-trained Word2Vec improved the performance compared to when simple embedding was used.
The best-performing DL model that was trained using both pre-trained GloVe and Word2Vec for the KSA Unemployment Before MCO dataset was the CNN, with G-mean scores of 92.16% and 93.23%, respectively (Table 10). The best performance for simple embedding was attained by the CNN-LSTM, with a G-mean score of 95.59%. Furthermore, the same DL model (LSTM) yielded the worst performance for each embedding used; that is, simple embedding, pretrained GloVe, and Word2Vec. The results also revealed that pre-trained Word2Vec was more effective than pre-trained GloVe for all DL models. Only a slight decline in performance was observed when the embedding was switched from pre-trained Word2Vec to pre-trained GloVe.
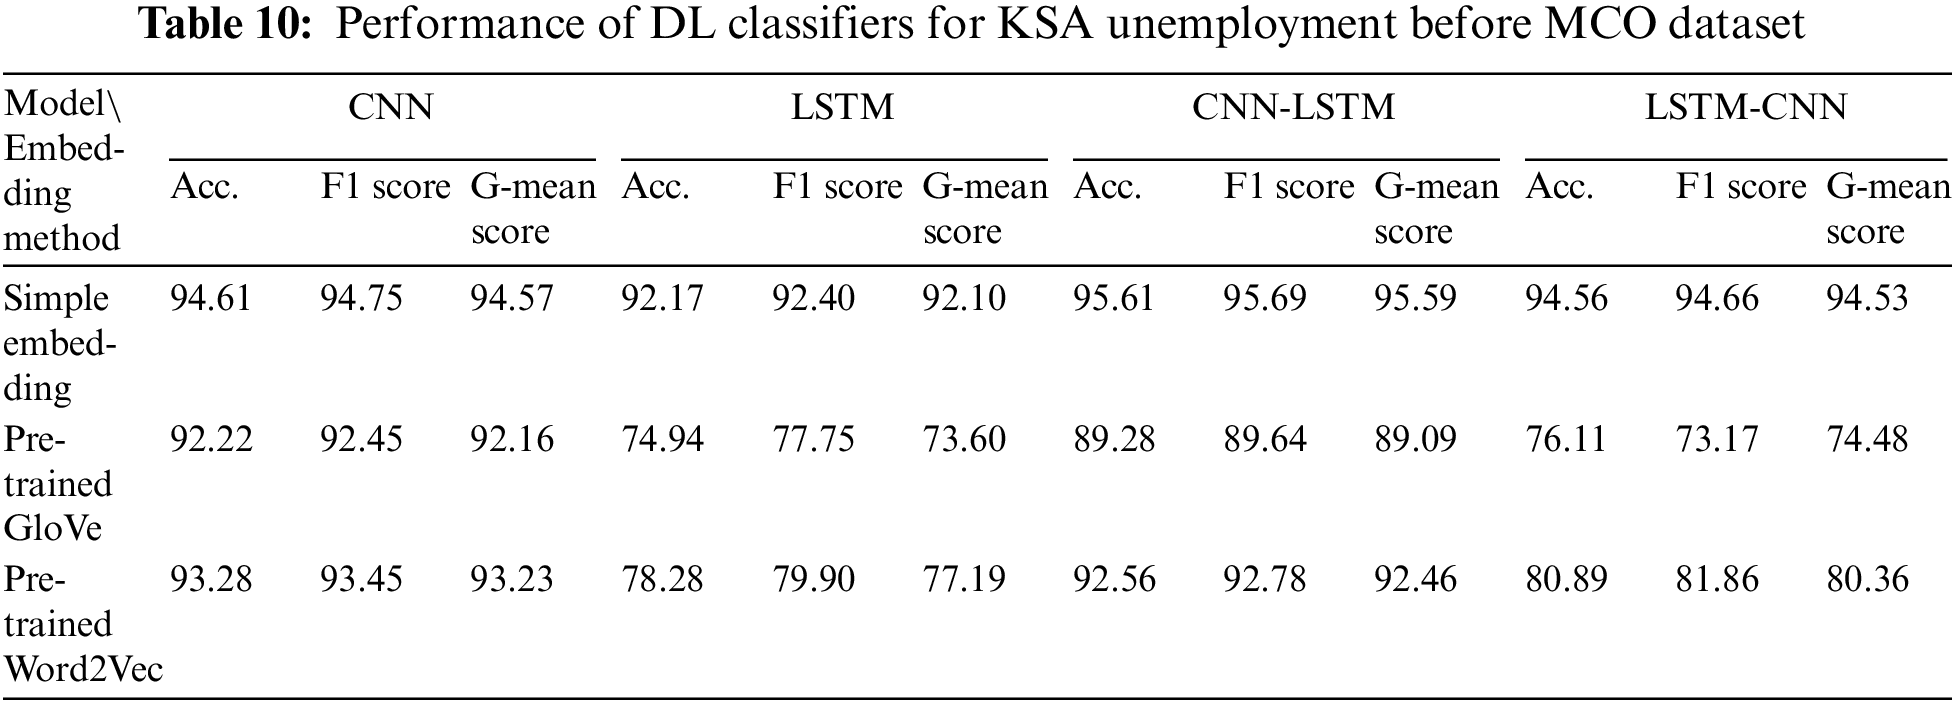
Table 11 reveals that the best-performing DL model that was trained using any of the three embeddings (simple embedding, pre-trained GloVe, and Word2Vec) for the KSA Unemployment During MCO dataset was the CNN, with G-mean scores of 96.97%, 96.85%, and 97.19%, respectively. Furthermore, LSTM yielded the worst performance for the same three embeddings. The results show that pre-trained Word2Vec performed slightly better than pre-trained GloVe for all DL models, whereas both embeddings underperformed compared to the simple embedding.
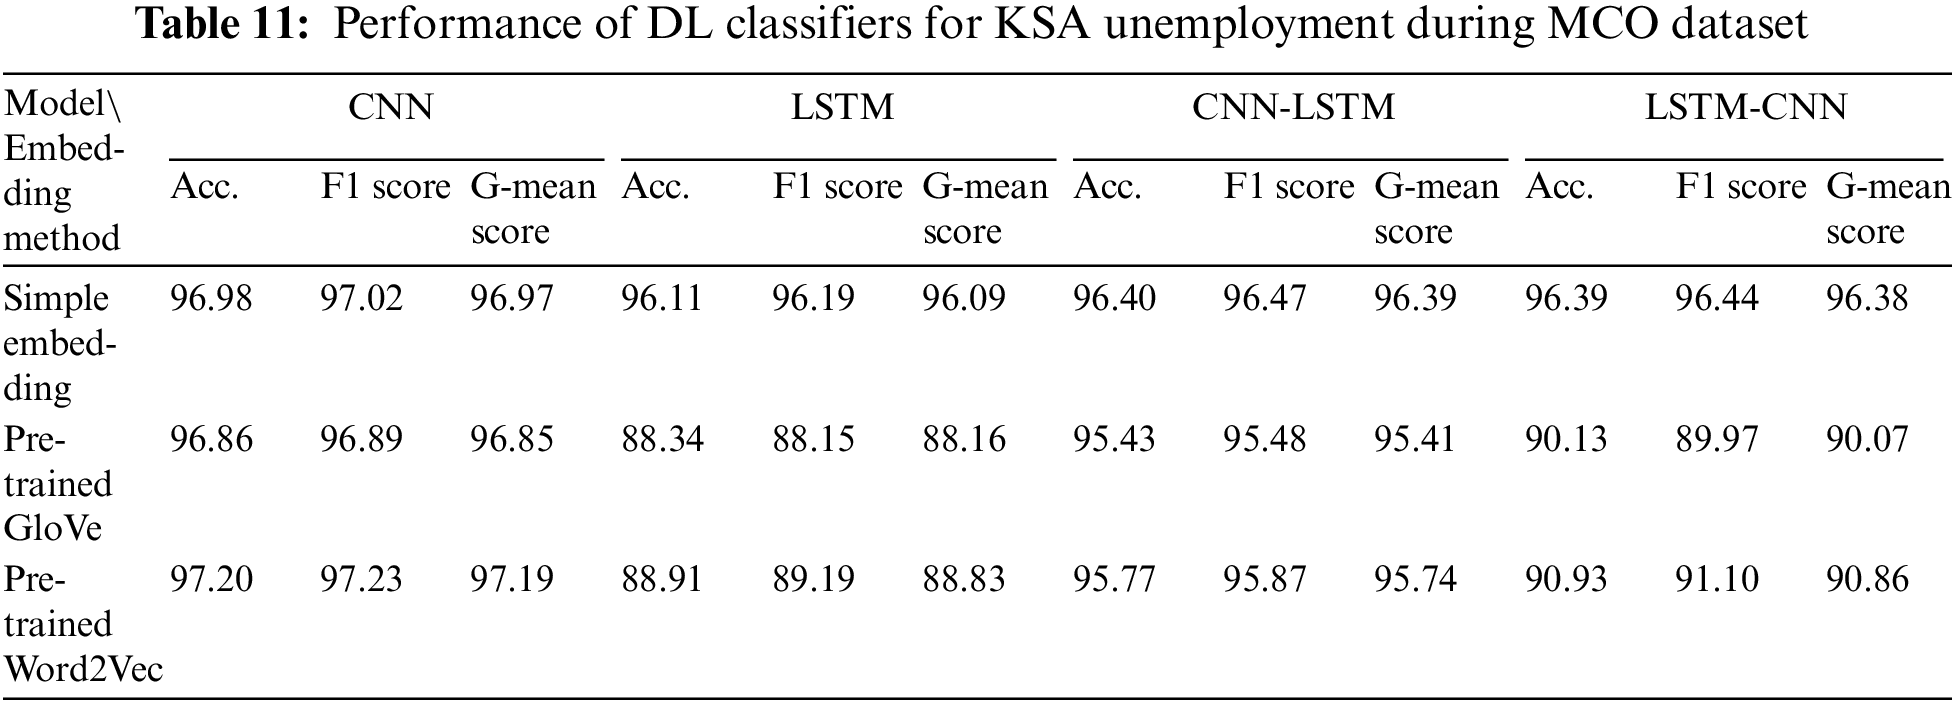
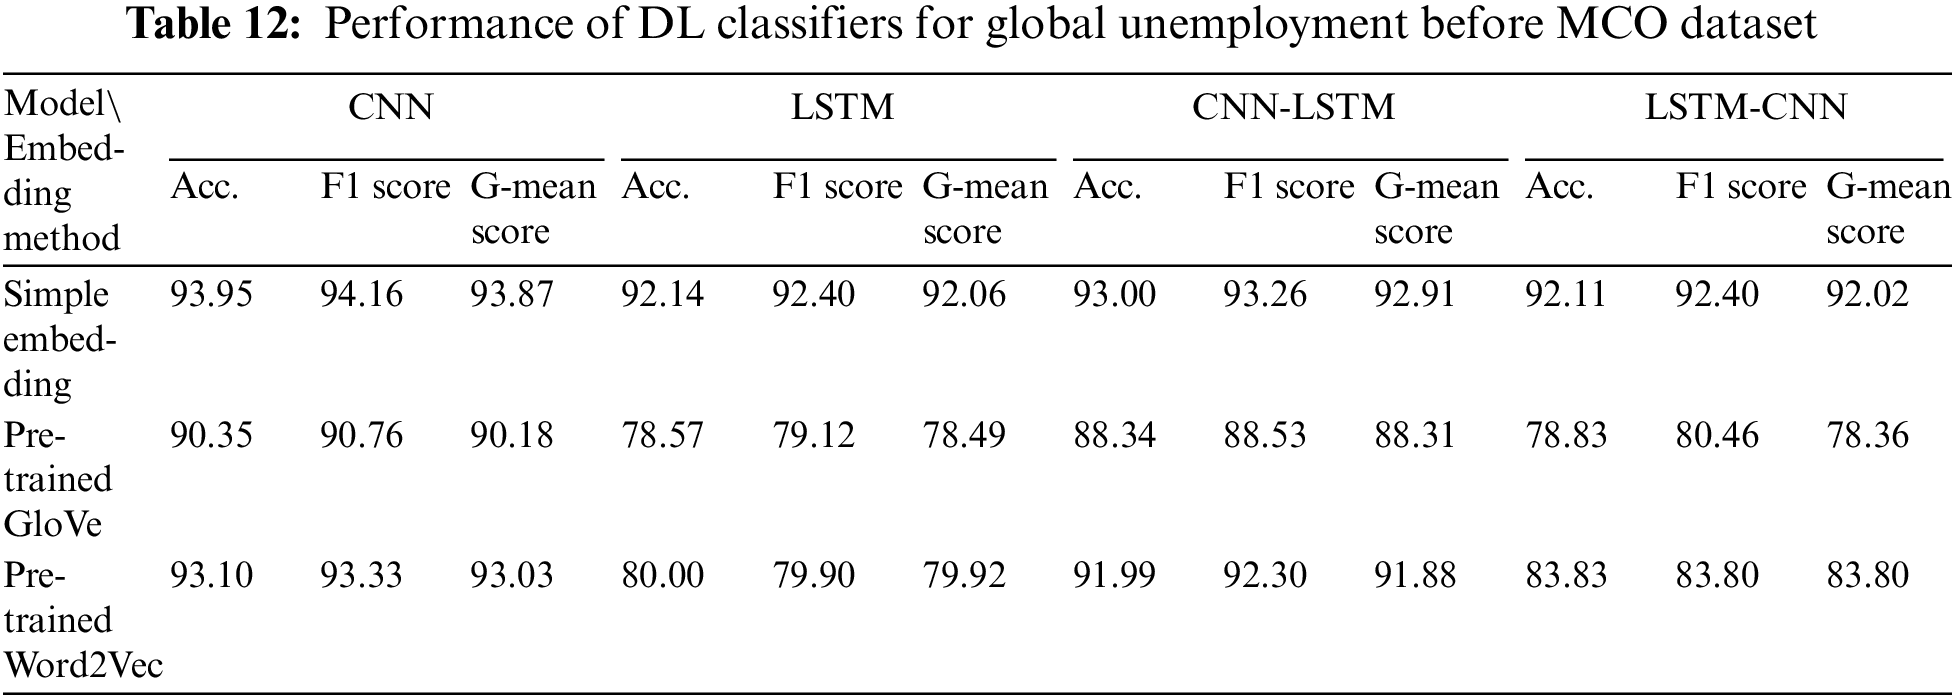
Table 12 shows that the best-performing DL model that was trained using any of the three embeddings (simple embedding, pre-trained GloVe, and Word2Vec) for the Global Unemployment Before MCO dataset was the CNN, with G-mean scores of 93.87%, 90.18%, and 93.03%, respectively. Furthermore, LSTM-CNN yielded the worst performance for each of the three embeddings used. The results demonstrated a significant improvement in the performance of LSTM and LSTM-CNN once they had been trained using either pre-trained GloVe or Word2Vec compared to when simple embedding was used.
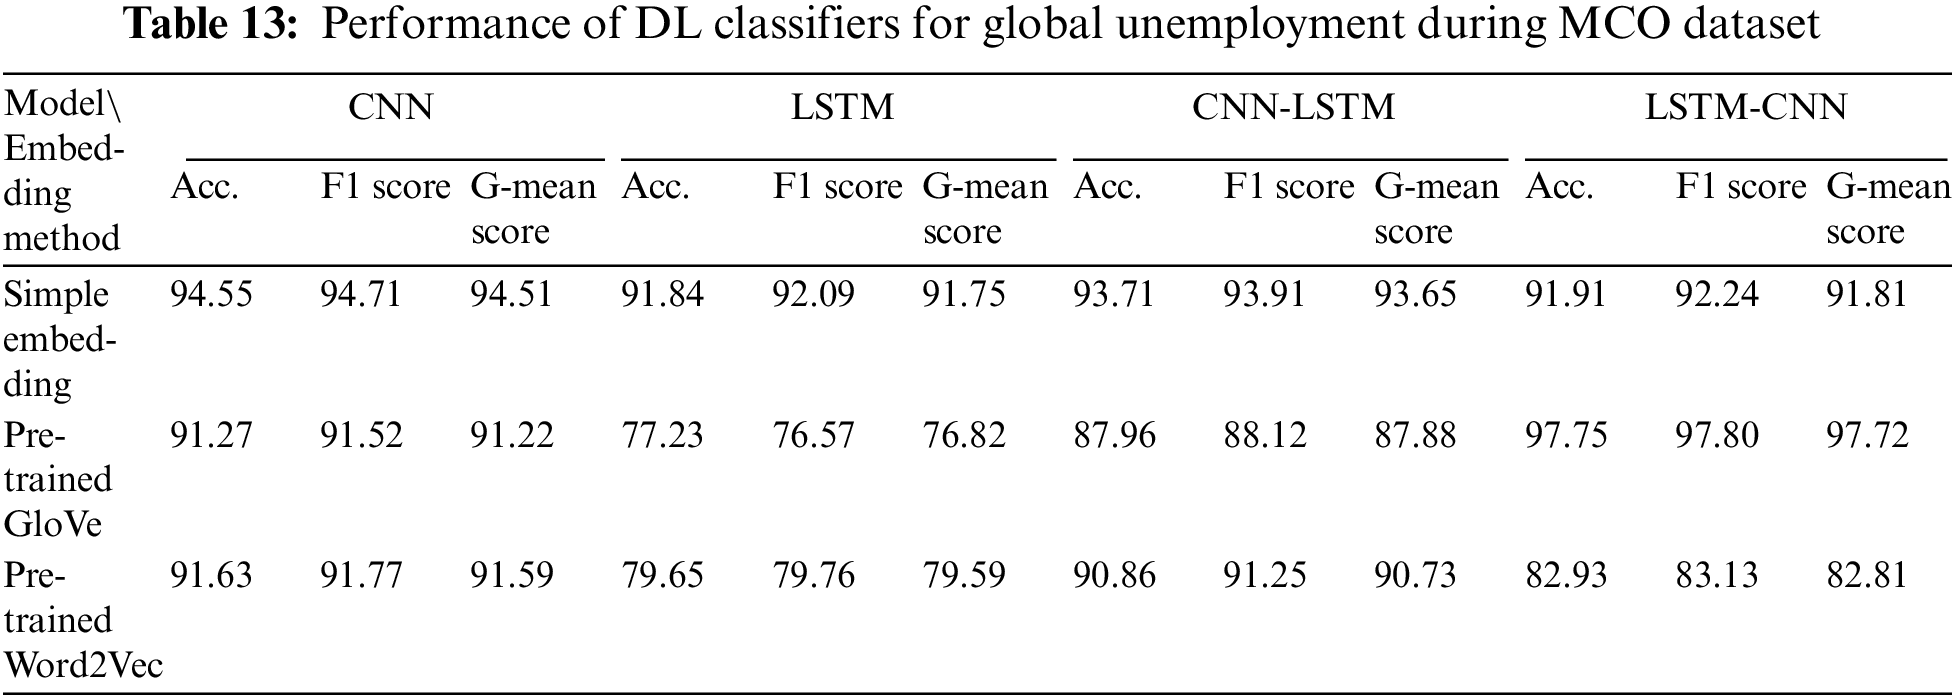
Finally, Table 13 indicates that the best-performing DL model that was trained using pre-trained GloVe for the Global Unemployment During MCO dataset was LSTM-CNN, with a G-mean score of 97.72%. The best performance for simple embedding and pre-trained Word2Vec was attained by the CNN, with G-mean scores of 94.51% and 91.59%, respectively. The worst-performing DL model for all embeddings was LSTM.
The following discussion is divided into summaries of the comparisons between the various DL models, benchmark performances against the DL classifiers, and ratio calculations for the sentiment polarity in relation to unemployment.
4.3.1 RQ1 Answer: Effect of Word Embedding Approaches on Performance of DL Classifiers
The results of training the different DL models are presented in this section. For most datasets, either the CNN or CNN-LSTM achieved the best performance in terms of the accuracy, F1 scores, and G-mean scores, compared to LSTM or LSTM-CNN (Figs. 2 to 4). The CNN outperformed LSTM for most datasets; therefore, the former would be superior to the latter in the investigation of unemployment-related tweets. The addition of an LSTM layer on top of the CNN layer improved the performance compared with that when using only a CNN layer. The same was true for using a CNN layer on top of the LSTM layer compared to using only the LSTM layer. These results indicate that the performance could be improved by combining the two CNN and LSTM layers. The CNN model could extract the local features, whereas LSTM could learn the long-term dependencies of these features. However, in this study, the ordering of LSTM on top of the CNN, rather than the CNN on top of LSTM, was demonstrated to perform better. This confirmed that layer ordering affects the performance of the models [17].
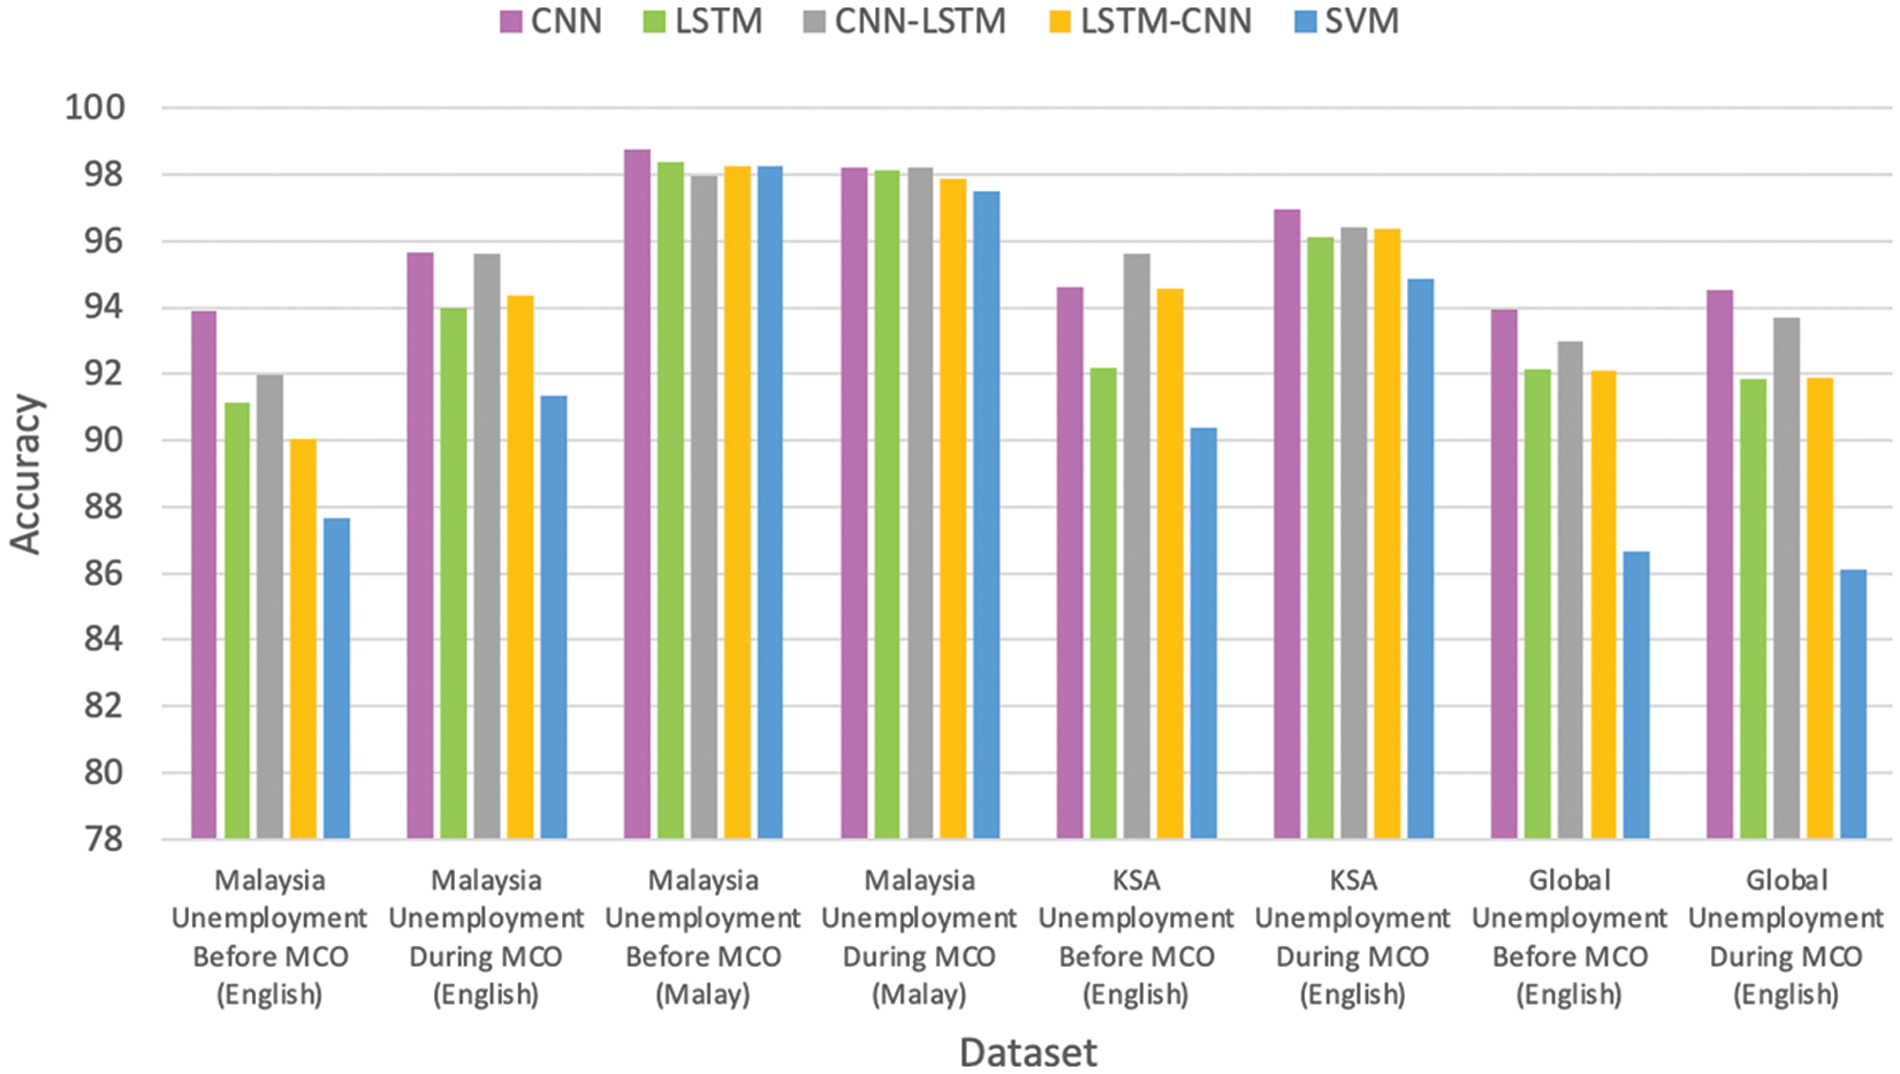
Figure 2: Comparison between LexDeep classifiers and SVM in terms of accuracy
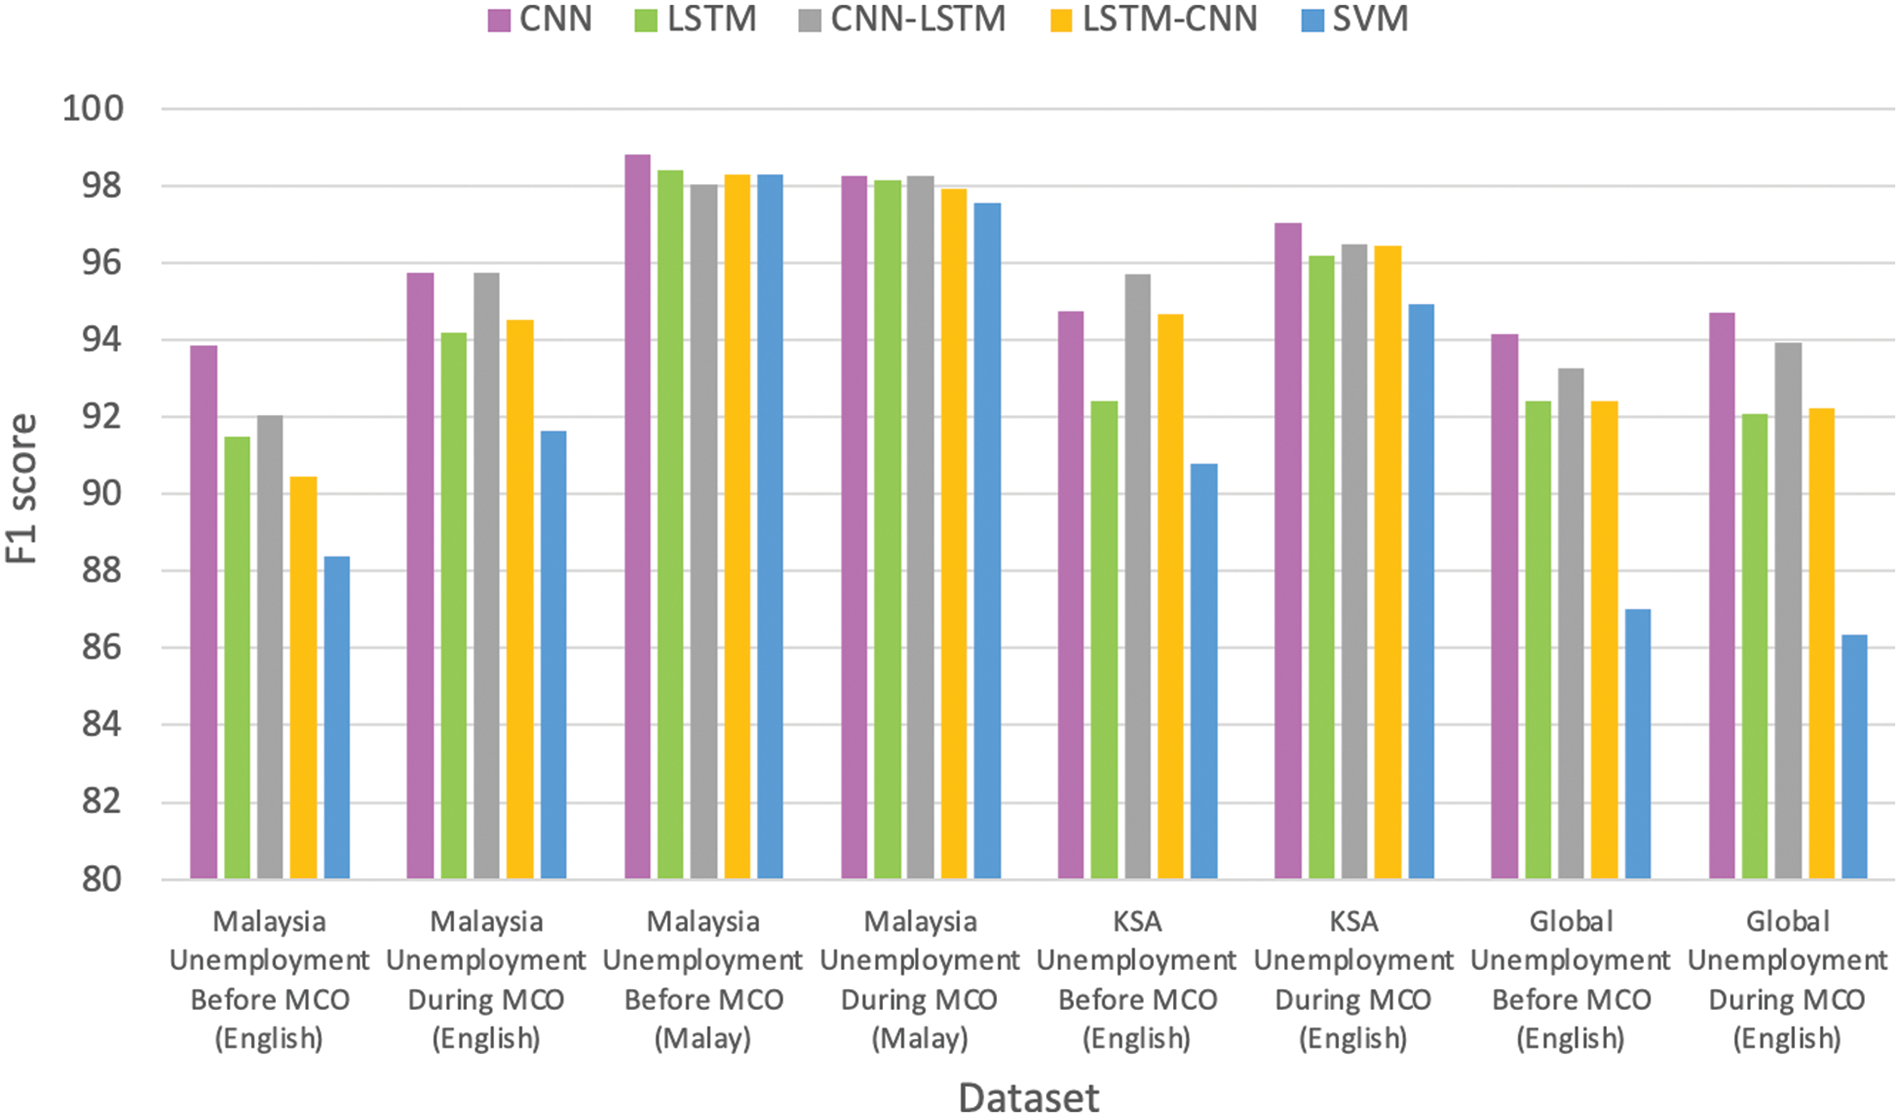
Figure 3: Comparison between LexDeep classifiers and SVM in terms of F1 score
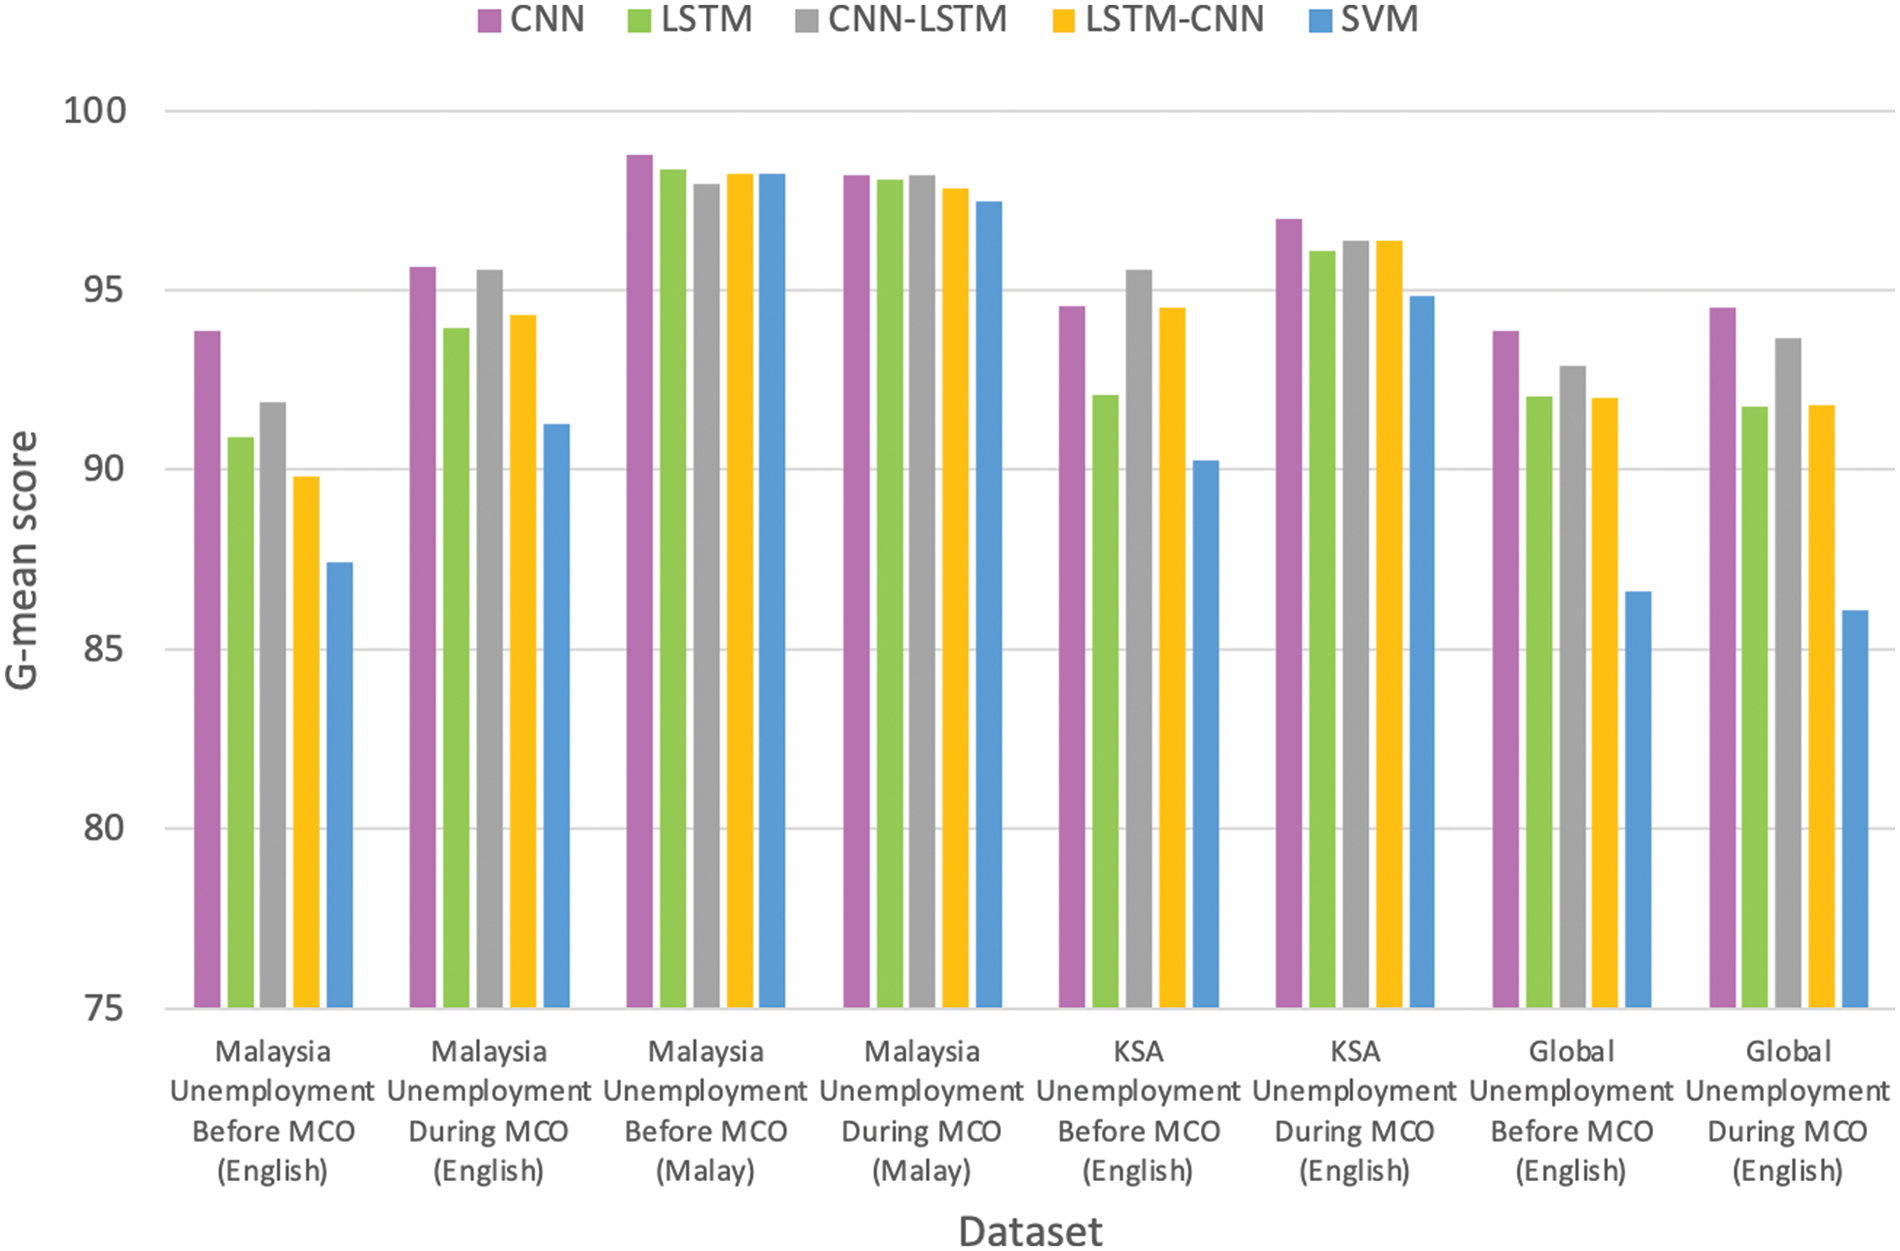
Figure 4: Comparison between LexDeep classifiers and SVM in terms of G-mean score
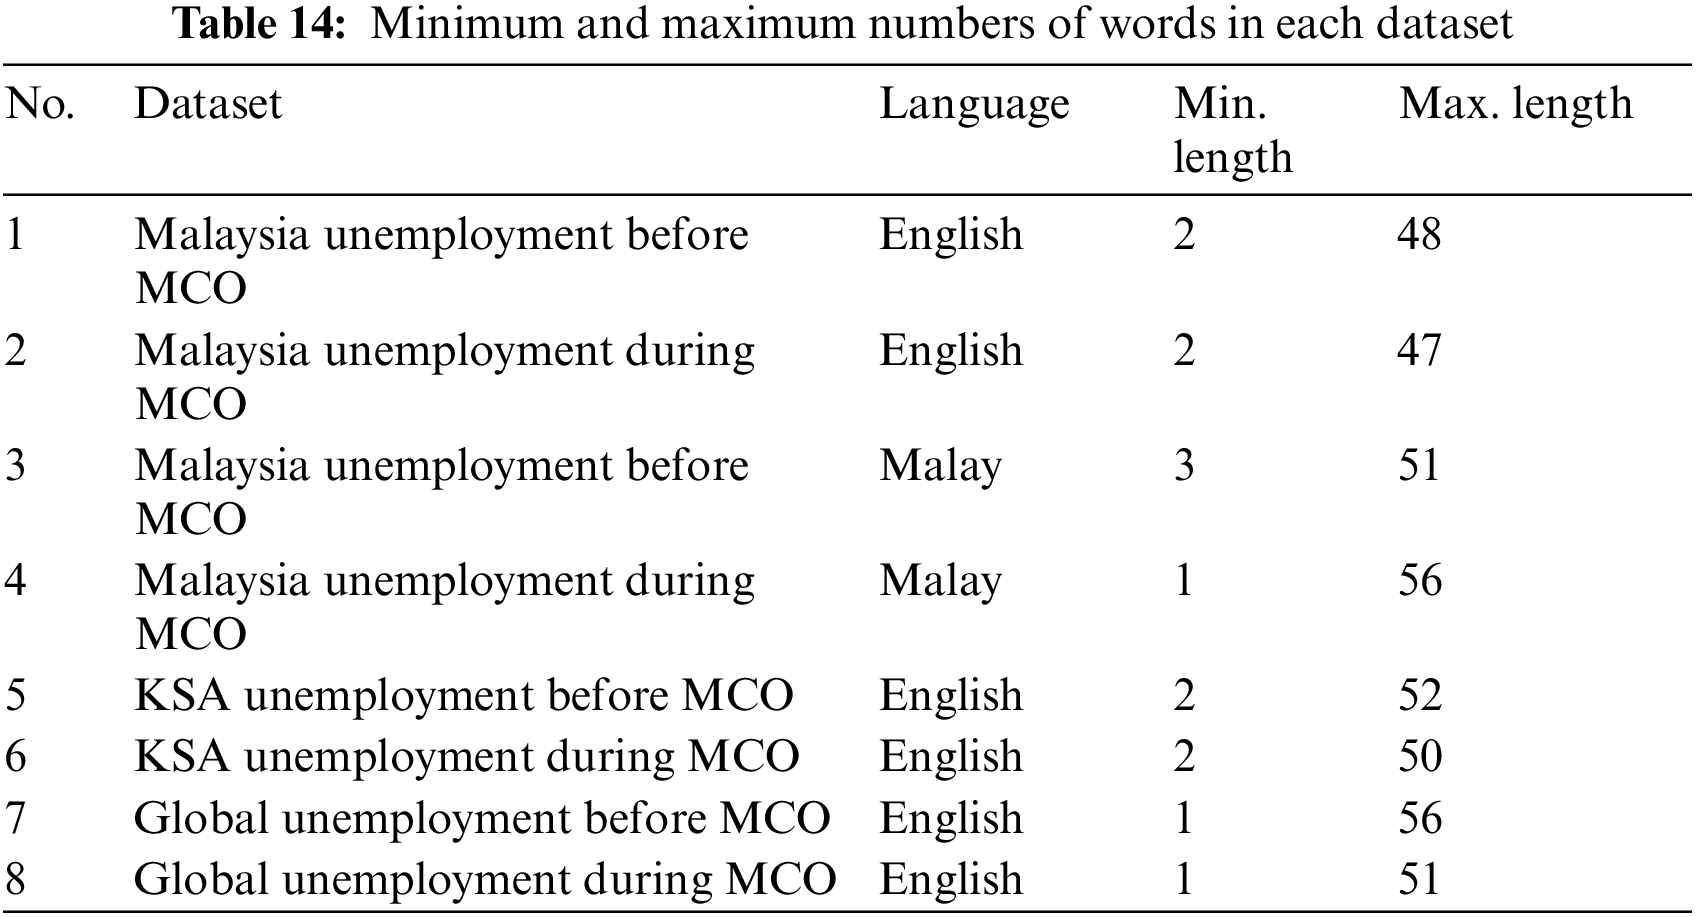
The LSTM layer appeared to lose its ability to harness the ordering of text and capture the local characteristics. The poorer performance of CNN-LSTM compared to CNN alone can be attributed to the lack of orderliness of the original data during their transfer into the LSTM layer [24]. According to [19], LSTM is unsuitable for short texts, such as those used in this study, with the longest text containing only 56 words and the shortest containing only one word, as indicated in Table 14. As LSTM has a limited ability to provide information, it can be regarded as a fully connected layer, and the addition of the CNN on top of LSTM may slightly improve the performance compared with the use of the regular LSTM model because the CNN can harness the local features.
The simple embedding layer learns to represent the words in a dataset as low-dimensional continuous dense vectors. Furthermore, the current study used pre-trained GloVe (100) and pre-trained Word2Vec (300) for the English datasets and pre-trained Word2Vec (256) from the Malaya library for the Malay datasets. However, the use of pre-trained word embedding resulted in poorer performance than the use of simple embedding. This may be owing to the presence of textual irregularities within the corpus, such as slang and misspellings, which were not included in the pre-trained embeddings. This was confirmed in the study by [17], in which the word vector quality influenced the final outcome of the DL model performance because word vectors containing semantic noise resulted in poor network fitting classification. The semantic noise in the current study included hashtags, such as #covidmalaysia and #psacovid, spelling variations due to misspellings, nonsense words, and repeated sequences. Furthermore, the results indicate that the DL models that were trained using pre-trained Word2Vec (300) outperformed those that were trained using pre-trained GloVe (100) as the embedding (Tables 6 to 12).
4.3.2 RQ2 Answer: Comparison of DL Classifiers with Benchmark Model
The experiment was repeated by training the SVM with TF-IDF as the feature extraction method for use as the benchmark against the DL models. The number of folds that were used for training each dataset followed those of the DL models, as outlined in Table 5. A comparison of the proposed LexDeep against the SVM performance for each dataset is presented in Figs. 2 to 4.
In conclusion, all DL models with simple embedding outperformed the SVM. Therefore, the evidence suggests that DL models are superior to classical ML classifiers in sentiment analysis tasks.
4.3.3 RQ3 Answer: Ratio Calculation for Sentiment Polarity of Unemployment
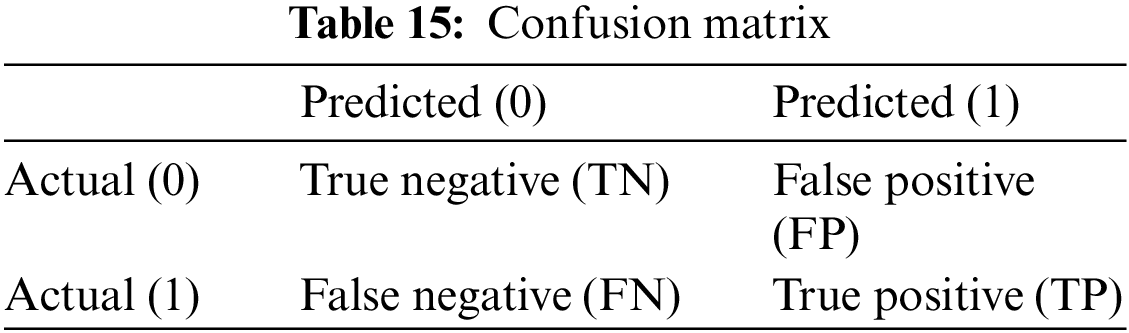
The ratios between the negative and positive sentiments were calculated for each dataset, following which the differences between the periods during and before the MCO were ascertained, according to the equations below. This process was based on the confusion matrix (Table 15) of the best-performing DL model with simple embedding for each imbalanced dataset.
The calculation of the ratios before and during the MCO only utilised the confusion matrices obtained from the training of the DL models using imbalanced texts. The ratio calculation formula is presented in Eqs. (3) and (4). The results that were obtained from the oversampled texts were disregarded because the oversampling process changed the negative and positive tweets to the same amount. Therefore, if the ratios before and during the MCO were to be calculated, a misleading result would be obtained because each calculated ratio would yield a value close to 1. For example, the ratios of the oversampled dataset for Malaysia Unemployment (Malay) before and during the MCO were 0.91 and 0.96, respectively.
The ratios between the negative and positive sentiments and the differences between the periods during and before the MCO are shown in Table 16. It can be observed that the best-performing models for most datasets were either the CNN or CNN-LSTM with simple embedding.
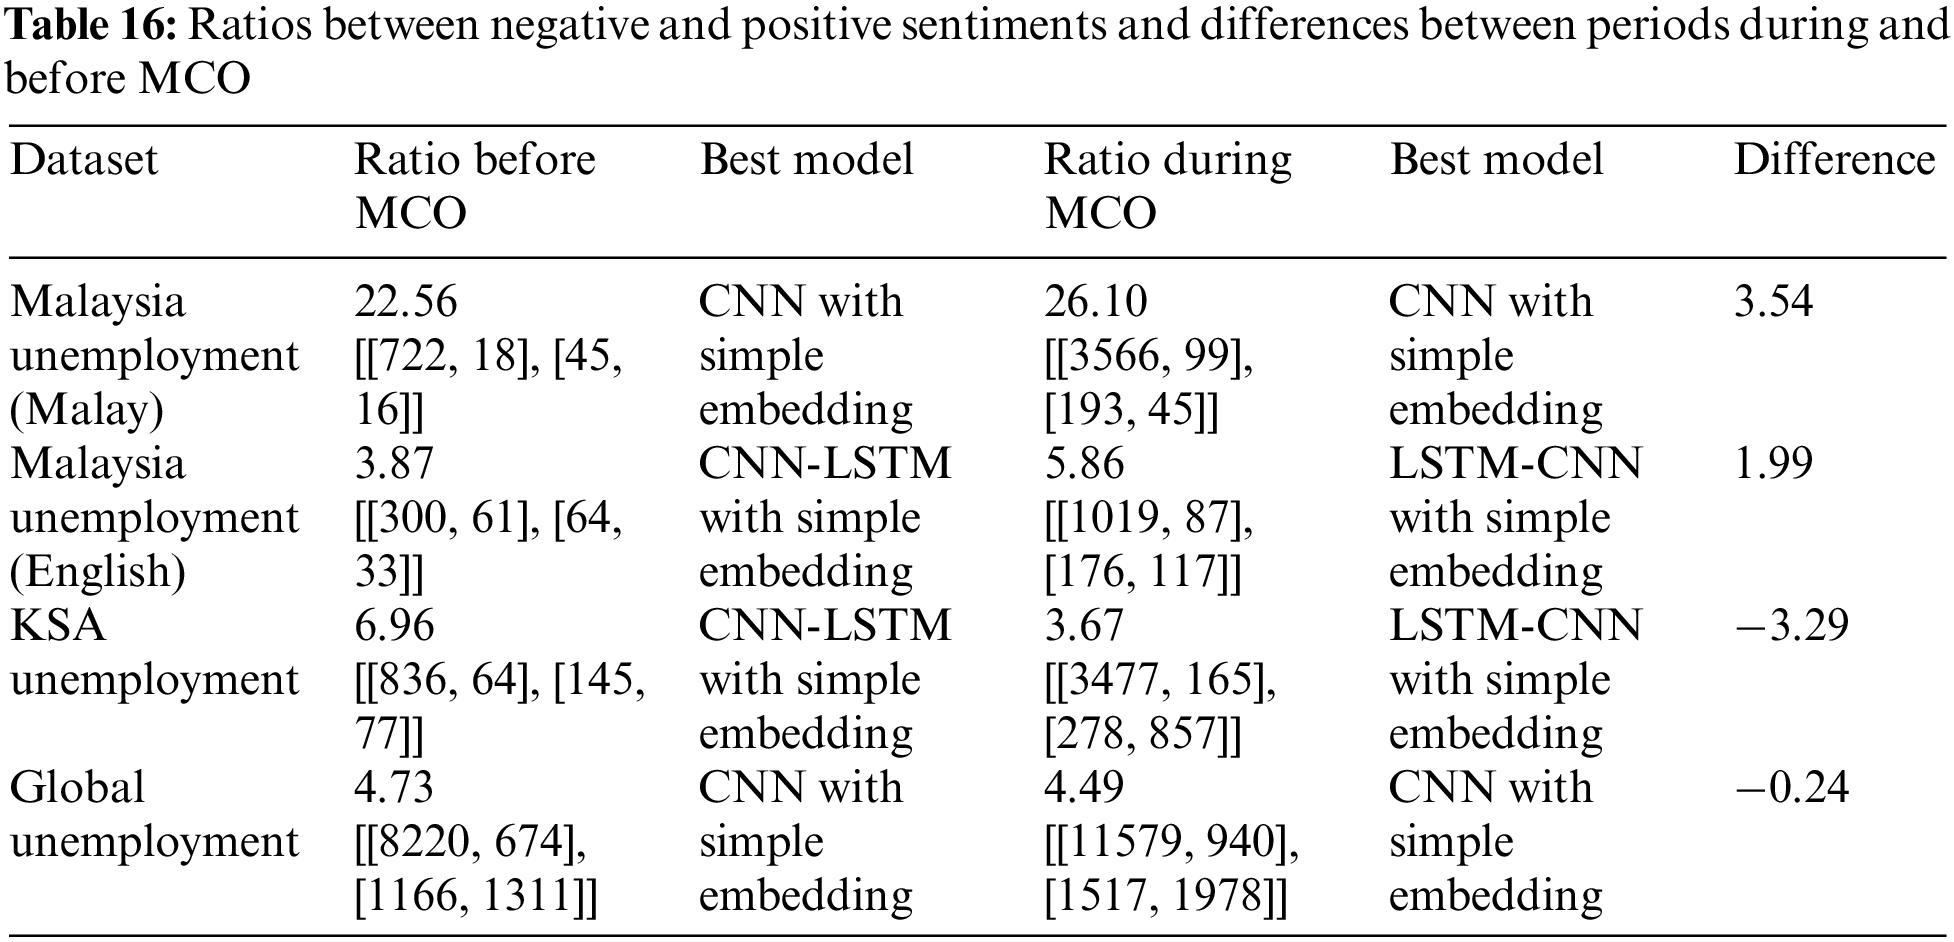
The DL models of the Global Unemployment and KSA Unemployment datasets revealed a decrease in the ratios between the negative and positive tweets, which were higher than the ratios that were obtained by the VADER lexicon, as shown in Table 17. The actual unemployment rates of Saudi Arabia and the global population also decreased, according to reports from Trading Economics [25] and the Organisation for Economic Co-operation and Development [26].
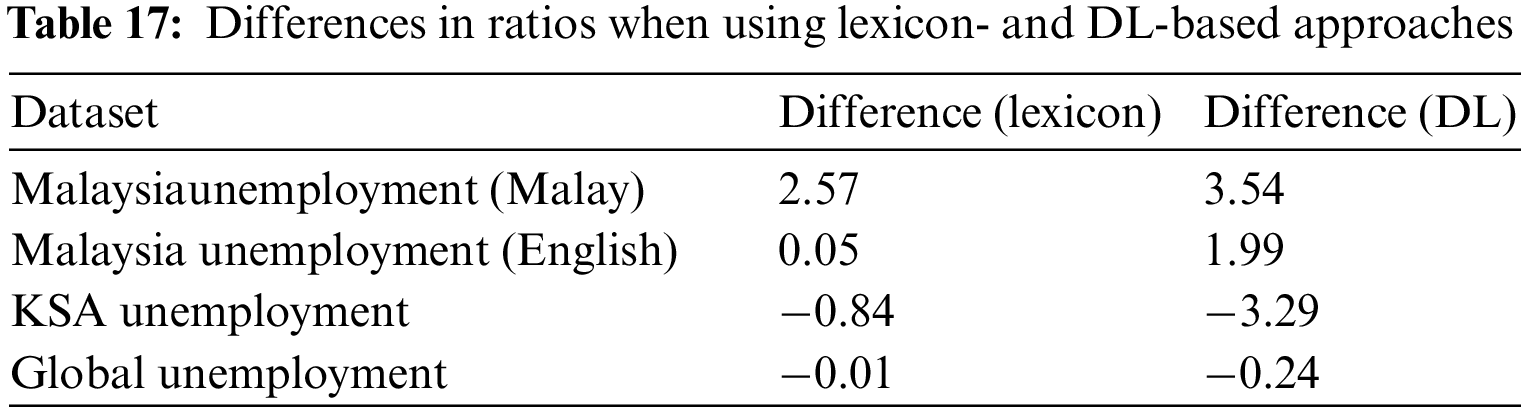
These reports indicate that an increase in the unemployment rate immediately after the outbreak of COVID-19 affected the global population. However, the rate then decreased steadily, which corresponded to the negative difference in the ratios that were obtained by both the lexicon and DL models, as mentioned previously.
Meanwhile, both Malaysia Unemployment (Malay) and Malaysia Unemployment (English) indicated that the unemployment rate in Malaysia increased based on the differences in the ratios that were obtained by the lexicon and DL approaches. This was confirmed in the Trading Economics report, which indicated a substantial rise in the unemployment rate in Malaysia directly after COVID-19 affected the global population. This was reflected in the differences in the ratios that were obtained. However, the unemployment rate of Malaysia later decreased slightly, whereas the rate in Saudi Arabia decreased considerably during the MCO.
The major goal of this study was to explore social trend analytics using LexDeep, which is a hybrid sentiment analysis technique, on Twitter to capture the risk of household income loss and to analyse unemployment rates during and before the COVID-19 pandemic. Moreover, this study aimed to evaluate the performance of the proposed LexDeep models compared to a baseline model (SVM).
Tweet data were collected using Twint with relevant keywords from before (9 March 2019 to 17 March 2020) and during (18 March 2020 to 21 August 2021) the pandemic. These tweets were processed to obtain their semantic orientations using VADER (lexicon-based); they were later used as training data for the DL classifiers with an embedding layer. Subsequently, the performance of each proposed LexDeep model was evaluated and compared with that of the baseline SVM model. Finally, the unemployment rates before and during COVID-19 were analysed to provide insights into the differences in the unemployment percentages based on social media input and analysis.
The results revealed that all LexDeep models with basic embedding outperformed the SVM. This suggests that LexDeep models outperform traditional ML classifiers in sentiment analysis tasks for domain-specific sentiments. In terms of the risk of income loss, unemployment is politically charged on both the regional and global scales. If a country is unable to address this issue, the global economy will suffer.
However, opportunities remain to test the latest DL methods with expanded keywords and a collection of larger datasets. This will enable further research on the performance of word embeddings in terms of the classifier performance. Future studies will focus on the development of a utility maximisation algorithm for evaluating household welfare, given the percentage risk of income loss owing to COVID-19.
Acknowledgement: The authors would like to thank all those directly and indirectly involved in this research.
Funding Statement: This work was funded by the Deanship of Scientific Research at Princess Nourah bint Abdulrahman University, through the Research Groups Program Grant no. (RGP-1443-0045).
Conflicts of Interest: The authors declare that they have no conflicts of interest to report regarding the present study.
References
1. World Bank, Global Economic Prospects. Washington: World Bank Group, 2020. [Google Scholar]
2. OECD, The impact of the coronavirus (COVID-19) crisis on development finance. Organisation for Economic Co-operation and Development (OECD2020. [Google Scholar]
3. S. Zahoor and R. Rohilla, “Twitter sentiment analysis using lexical or rule based approach: A case study,” in Proc. of the 2020 8th Int. Conf. on Reliability, Infocom Technologies and Optimization (Trends and Future Directions) (ICRITO), Noida, India, Amity University, pp. 537–542, 2020. [Google Scholar]
4. X. Man, T. Luo and J. Lin, “Financial sentiment analysis (FSAA survey,” in Proc. of the 2019 IEEE Int. Conf. on Industrial Cyber Physical Systems (ICPS), Howards Plaza Hotel Taipei, Taiwan, pp. 617–622, 2019. [Google Scholar]
5. S. Sohangir, N. Petty and D. Wang, “Financial sentiment lexicon analysis,” in Proc. of the 2018 IEEE 12th Int. Conf. on Semantic Computing (ICSC), Laguna Hills, CA, USA, pp. 286–289, 2018. [Google Scholar]
6. C. S. Khoo and S. Johnkhan, “Lexicon-based sentiment analysis: Comparative evaluation of six sentiment lexicons,” Journal of Information Science, vol. 44, no. 4, pp. 491–511, 2017. [Google Scholar]
7. A. Mahmood, S. Kamaruddin, R. Naser and M. Nadzir, “A combination of lexicon and machine learning approaches for sentiment analysis on Facebook,” Journal of System and Management Sciences, vol. 10, no. 3, pp. 140–150, 2020. [Google Scholar]
8. S. Sohangir, D. Wang, A. Pomeranets and T. M. Khoshgoftaar, “Big data: Deep learning for financial sentiment analysis,” Journal of Big Data, vol. 5, no. 1, pp. 1–25, 2018. [Google Scholar]
9. L. K. Ramasamy, S. Kadry, Y. Nam and M. Meqdad, “Performance analysis of sentiments in Twitter dataset using SVM models,” International Journal of Electrical and Computer Engineering, vol. 11, no. 3, pp. 2275–2284, 2021. [Google Scholar]
10. N. M. Sham and A. Mohamed, “Climate change sentiment analysis using lexicon, machine learning, and hybrid approaches,” Sustainability, vol. 14, no. 8, pp. 4723, 2022. [Google Scholar]
11. F. Wunderlich and D. Memmert, “Innovative approaches in sports science—Lexicon-based sentiment analysis as a tool to analyze sports-related Twitter communication,” Appl. Sci., vol. 10, no. 2, pp. 431, 2020. [Google Scholar]
12. P. M. Ryu, “Predicting the unemployment rate using social media analysis,” J. Inf. Process Syst., vol. 14, no. 4, pp. 904–915, 2018. [Google Scholar]
13. S. Qaiser, N. Yusoff, F. K. Ahmad and R. Ali, “Sentiment analysis of impact of technology on employment from text on Twitter,” International Journal of Interactive Mobile Technologies, vol. 14, no. 7, pp. 88–103, 2020. [Google Scholar]
14. G. Fernandez, C. Maione, K. Zaballa, N. Bonnici, B. H. Spitzberg et al., “Sentiment analysis of social media response and spatial distribution patterns on the COVID-19 outbreak: The case study of Italy,” in Empowering Human Dynamics Research with Social Media and Geospatial Data Analytics, Human Dynamics in Smart Cities, A. Nara, M. H. Tsou (Eds.Cham: Springer, pp. 167–184, 2021. [Google Scholar]
15. Z. Nia, A. Ahmadi, N. L. Bragazzi, W. A. Woldegerima, B. Mellado et al., “A cross-country analysis of macroeconomic responses to COVID-19 pandemic using Twitter sentiments,” pp. 1–30, 2022. [Online]. Available: https://ssrn.com/abstract=4001976. [Google Scholar]
16. P. Hajek and A. Barushka, “Integrating sentiment analysis and topic detection in Financial News for stock movement prediction,” in Proc. of the 2018 2nd Int. Conf. on Business and Information Management (ICBIM), Barcelona, Spain, 2018. [Google Scholar]
17. M. Pedro, “Twitter sentiment analysis using combined LSTM-CNN models,” Eprint Arxiv, pp. 1–9, 2017. [Google Scholar]
18. N. Dang, M. Moreno-Garcia and F. De la Prieta, “Sentiment analysis based on deep learning: A comparative study,” Electronics, vol. 9, no. 3, pp. 483, 2020. [Google Scholar]
19. Y. Wang, X. Wang and X. Chang, “Sentiment analysis of consumer-generated Online reviews of physical bookstores using Hybrid LSTM-CNN and LSA topic model,” in Proc. of the 2020 Int. Conf. on Culture-oriented Science & Technology (ICCST), Beijing, China, pp. 457–462, 2020. [Google Scholar]
20. L. Yang, Y. Li, J. Wang and R. Sherratt, “Sentiment analysis for E-Commerce product reviews in Chinese based on sentiment lexicon and deep learning,” IEEE Access, vol. 8, pp. 23522–23530, 2020. [Google Scholar]
21. C. G. S. and B. Sumathi, “A novel deep learning approach of convolutional neural network and random forest classifier for fine-grained sentiment classification,” International Journal on Electrical Engineering and Informatics, vol. 13, no. 2, pp. 465–476, 2021. [Google Scholar]
22. H. Zolkepli, “Malaya. Natural-language-toolkit library for Bahasa Malaysia, powered by deep learning TensorFlow,” Retrieved from GitHub Repository, 2018. [Online]. Available: https://github.com/huseinzol05/malaya. [Google Scholar]
23. S. Kim, K. Ganesan, P. Dickens and S. Panda, “Public Sentiment toward solar energy-Opinion mining of Twitter using a Transformer-based language model,” Sustainability, vol. 13, no. 5, pp. 2673, 2021. [Google Scholar]
24. B. Chen, Q. Huang, Y. -P. P. Chen, L. Cheng and R. Chen, “Deep neural networks for multi-class sentiment classification,” in Proc. of the IEEE 20th Int. Conf. on High Performance Computing and Communications; IEEE 16th Int. Conf. on Smart City; IEEE 4th Int. Conf. on Data Science and Systems, Exeter, United Kingdom, pp. 854–859, 2018. [Google Scholar]
25. Trading Economics. Saudi Arabia Unemployment Rate. Retrieved from Trading Economics, 2021. [Online]. Available: https://tradingeconomics.com/saudi-arabia/unemployment-rate. [Google Scholar]
26. OECD. Unemployment rate. Retrieved from Organisation for Economic Co-operation and Development, 2021. [Online]. Available: https://data.oecd.org/unemp/unemployment-rate.htm. [Google Scholar]
Cite This Article
 Copyright © 2023 The Author(s). Published by Tech Science Press.
This work is licensed under a Creative Commons Attribution 4.0 International License , which permits unrestricted use, distribution, and reproduction in any medium, provided the original work is properly cited.
 Downloads
 Citation Tools