
 Submit a Paper
 Propose a Special lssue
 Open Access
ARTICLE

Optimal Location to Use Solar Energy in an Urban Situation
1 Faculty of Engineering, Udayana University, Bali, 80361, Indonesia
2 An Independent Researcher, NIT Durgapur, West Bengal, 700027, India
3 Department of Electrical and Electronics Engineering, Vignan’s Foundation for Science Technology and Research, Guntur, 522001, India
4 Department of Doctoral Program, Faculty Economic and Business, Universitas Sumatera Utara, Medan, 20222, Indonesia
5 Electrical Engineering Department, Faculty of Engineering & Technology, Future University in Egypt, New Cairo, 11835, Egypt
* Corresponding Author: Ngakan Ketut Acwin Dwijendra. Email:
Computers, Materials & Continua 2023, 75(1), 815-829. https://doi.org/10.32604/cmc.2023.034297
Received 13 July 2022; Accepted 03 September 2022; Issue published 06 February 2023
 View Full Text
 Download PDF
Abstract
This study conducted in Lima, Peru, a combination of spatial decision making system and machine learning was utilized to identify potential solar power plant construction sites within the city. Sundial measurements of solar radiation, precipitation, temperature, and altitude were collected for the study. Gene Expression Programming (GEP), which is based on the evolution of intelligent models, and Artificial Neural Networks (ANN) were both utilized in this investigation, and the results obtained from each were compared. Eighty percent of the data was utilized during the training phase, while the remaining twenty percent was utilized during the testing phase. On the basis of the findings, it was determined that the GEP is the most suitable network for predicting the location. The test state’s Nash-Sutcliffe efficiency (NSE) was 0.90, and its root-mean-square error (RMSE) was 0.04. Following the generation of the final map based on the results of the GEP model, it was determined that 9.2% of the province’s study area is suitable for the construction of photovoltaic solar power plants, while 53.5% is acceptable and 37.3% is unsuitable. The ANN model reveals that only 1.7% of the study area is suitable for the construction of photovoltaic solar power plants, while 66.8% is acceptable and 31.5% is unsuitable.Keywords
Energy is a basic human need and is very important for achieving the interrelated goals of modern societies such as meeting human needs for heating, cooling, lighting, mobility and a wide range of applications and providing power and heat for production systems. Energy is the driving force behind economic development around the world. Global energy sources can be classified into three main groups of fossil fuels (oil, gas, coal, etc.), nuclear energy and renewable energy (wind, solar, geothermal, biomass, etc.). The world’s accelerating depletion of fossil fuels has highlighted the critical need for alternate energy sources. The issue of global warming is another motivation to utilize fewer fossil fuels [1]. As a result, discovering new sources of energy is critical to meeting the expanding human need for energy while also reducing the harmful consequences of fossil resources on the environment [2]. Most of the energy resources we currently rely on are limited and will run out due to growing demand. In addition, serious problems such as local air pollution and soil and water are one of the consequences of using different energy sources. Continuing the use of fossil fuels Not only because of the global impact on the climate system, but also because of the short-term and long-term effects on society and the ecosystem, as countries become more aware of the dangers of climate change, many Replacing fossil fuels with renewable energy sources is one of the main carbonation strategies, and global renewable energy capacity is growing rapidly in recent years, and this trend is expected to continue. There are renewable energy sources because these natural and free resources are rapidly replenished and throughout the world have spread. Solar photovoltaic technology is one of the growing technologies of renewable energy sources around the world [3]. Utilizing the solar potential, which is both unique and intact, not only helps to improve the overall composition of energy sources, but also reduces the emission of harmful and toxic gases. High-potential locations for solar power plants include the United States, the Southwest, Mediterranean European countries, the Middle East, the deserts of India, Pakistan, China, and Australia. In Peru, there is a strong political will to develop renewable energy sources and use their capabilities. One of the obstacles to the development of solar energy is the instability and variability of solar radiation, which can vary from site to site geographically. To choose a site to install a solar power plant, questions such as how good the position of the solar power plant is and how to reduce the overall cost of the project by considering the proximity to the existing infrastructure while maximizing the power output of the solar power plant. Dad. Soft computing methods can be defined as formal or structured approaches for individuals and groups to determine overall priorities among alternatives using multiple criteria and indicators [4–6]. In fact, the need to combine environmental and social considerations in energy planning leads to an increase in the use of soft computing methods. These methods are increasingly popular in sustainable development decisions and energy systems because of their ability to simultaneously consider and evaluate the economic, environmental, social, and technological aspects required by complex systems [7].
Zambrano-Asanza et al. [8], investigated the feasibility of using solar energy in different regions. For this purpose, they calculated the average, minimum and maximum annual horizontal radiation for different stations. Kocabaldir et al. [9],Using geographic information systems and multi-criteria decisions, identified areas suitable for solar energy use in Morocco. Using four general location criteria, urography 6, Land use and climate concluded that the most suitable places are flat lands that have a southern slope. Hassaan et al. [10], Identified criteria They fall into four general categories of environment (e.g., land use and protected logic (geomorphological) such as slope and slope direction (location) such as distance to cities and roads (and climate) such as sundial and humidity (location). has taken. Based on the results of their study, in determining the optimal areas for the placement of these plates, climatic layers are more important than other criteria. Munkhbat et al. [11], used soft calculation methods to study areas prone to the use of solar energy. The results were classified into four categories of low proportion, average, appropriate and most appropriate.
Population growth in Lima has resulted in the city’s continuous development. This development and population growth coincide with the demand for more housing. Lima has been expanding for many years, yet the majority of its buildings have a recurring issue: excessive energy usage. The excessive energy consumption is a result of a number of avoidable factors that affect the requirement for artificial light, air conditioning, and ventilation, among other issues [12].
The goal of this research is to give decision-makers with decision-support tools by combining Artificial Neural Network (ANN) and Gene Expression Programming (GEP) as soft computing approaches to explore the feasibility of using solar energy in Lima, Peru. Geographic Information System (GIS) tools were used to generate layers of criteria and constraints, as well as spatial analysis, to analyze and select suitable places in the research region for the establishment of solar farms.
This study was carried out in the province of Cieneguilla, which is located in Lima (Fig. 1). It has a common border to the east with the province of Huarochir (the districts of Antioquia and Santiago de Tuna), a common border to the south and west with the district of Pachacmac, and a common border to the north with the watershed of the Andean foothills along with the districts of Ate Vitarte and Chaclacayo. It is one of the few undeveloped neighborhoods in the capital city, and it is located in the valley of the Lurn River. The area is encircled by mountains, and it is situated in the valley. The solar energy project benefited greatly from the absence of urbanization, which provided the ideal setting for the endeavor.
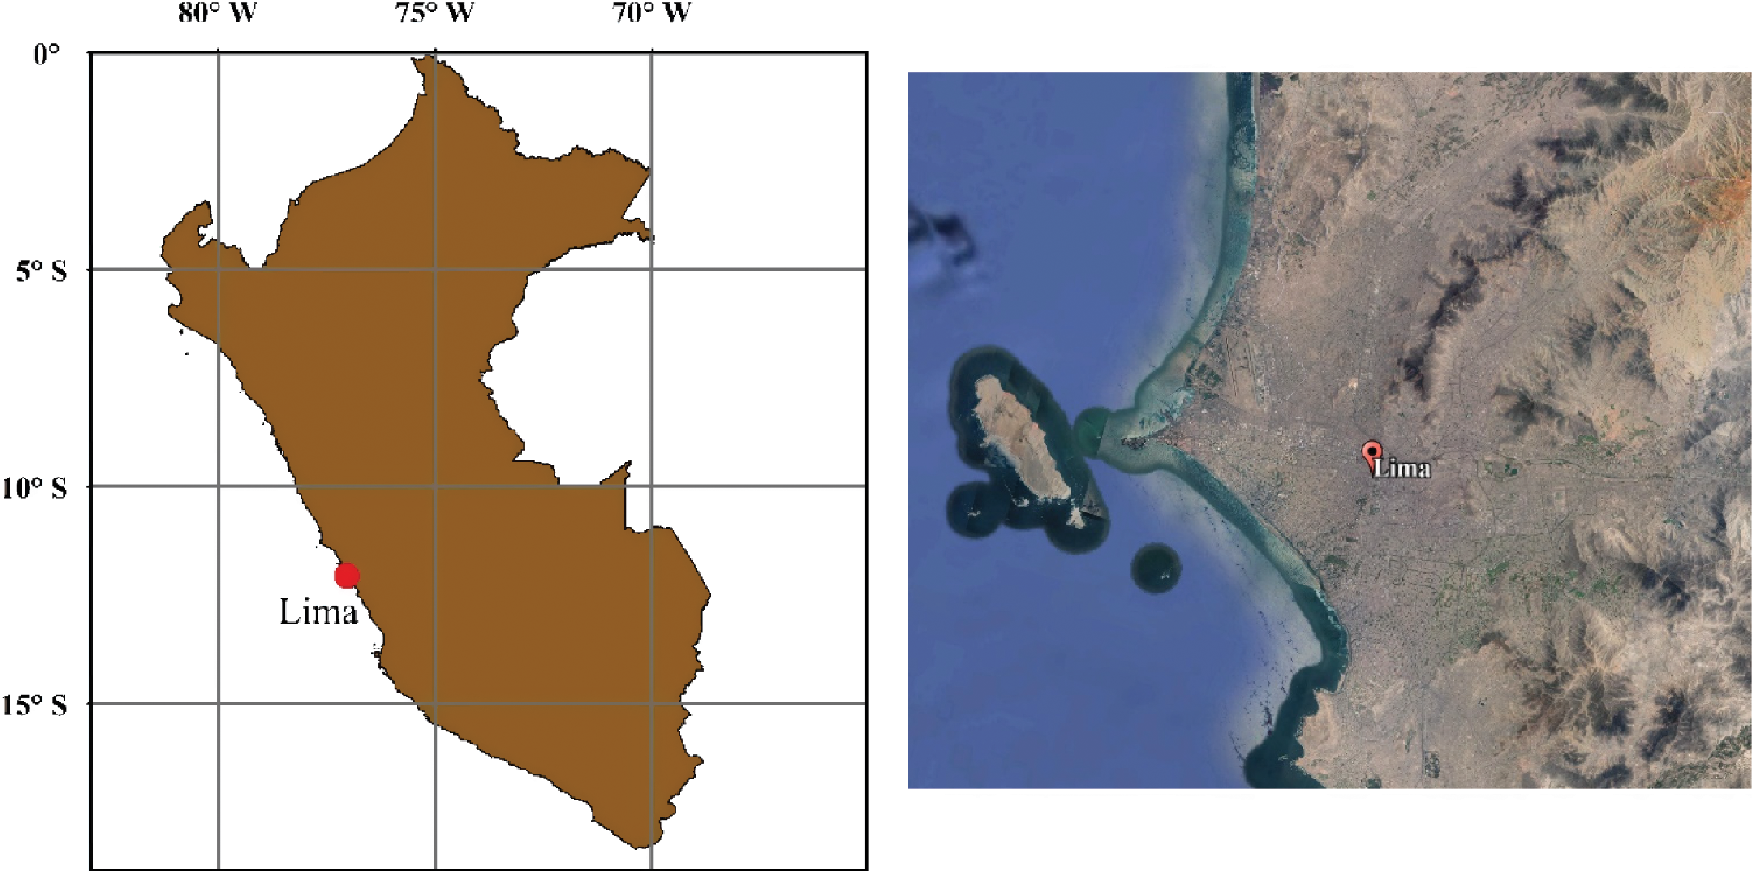
Figure 1: The study area map to use solar energy in an urban location (Lima, Peru)
In this study, ANN and GEP tree models have been utilized. Therefore, it is vital to examine the theoretical foundations of these procedures.
Neural networks have the ability to learn; So that they can accurately predict and generalize learning for subsequent storage computations and for incoming data sets [13]. One of the unique features of neural networks is the establishment of a separate type of relationship without input parameters, which, based on the relationship, gain the weight of each parameter [14]. The typical structure of an ANN model is comprised of three layers (Fig. 2). The input layer, which is responsible for the role of providing the network with its input parameters, the output layer, which is where the network’s output parameters can be found, and the hidden layer, which refers to the layers that sit in between the input layer and the output layer and actually perform the function of information processing [15].
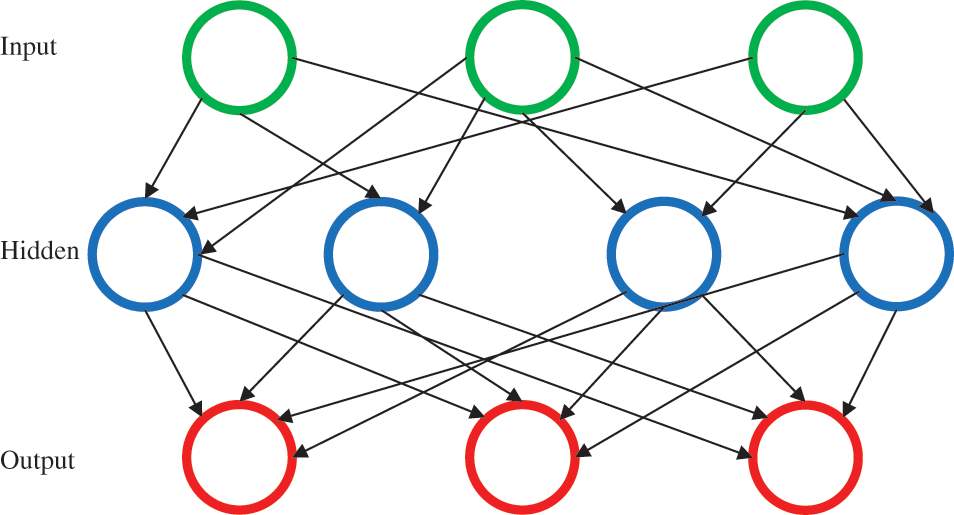
Figure 2: ANNs illustrated in a graphic format
The number of neurons in the input layer and the output layer is equal to the number of inputs and outputs. The hidden layer or layers are responsible for processing and communicating the input and output layers seamlessly [16–19]. The number of neurons and layers in the latent layer depends on the type and complexity of the problem. Neurons in the artificial neural network are complex systems that, like biological neurons, are connected by disturbed geometric connections. Systems try to solve unsolvable problems with the classical method using the brain working system [20].
The primary control factors for artificial neural network approaches are what are termed connection resistors called weights. These weights are located between the neurons. Each neuron is given the weighted outputs (Wj,i, xi) of the neurons in the layer below it. Collectively, these provide a net input to the neuron j (netj), which is calculated using the equation below [5,21].
The multi-layer perceptron (MLP) neural network is a class of progressive neural network in which each neuron in one layer is connected to the neurons of the next layer. For MLP learning, like multilayer networks, various learning algorithms are used, one of the most common of which is the error propagation algorithm. In the present study, an algorithm has been used. Matlab has been used to simulate the structures of ANN and determine the optimal structure [21]. ANN architecture helps the network understand variable relationships. Problem dictates neural network architecture [22]. The problem calls for eight inputs and one output layer neuron. Various architectures were created, trained, and tested. The best network architecture in this prediction is a two-layer network with five neurons in the first layer (hidden layer) and one neuron in the second layer (output layer). Second-layer network architecture and linear transfer functions (purelin, tansig).
Gene Expression Programming, also known as GEP, is a technique that, by tracking the development of intelligent models, has become a way for calculating the rotation of algorithms. The advantage that model gene expression planning has over other types of networks is that, in gene expression planning, the structure (input variables, purpose, and a set of functions) are defined first, and then, during the process, the optimal structure of the model and the coefficients are determined. This gives model gene expression planning a distinct competitive advantage over other types of networks. There are a total of five steps involved in the methodical process of problem-solving utilizing GEP [1]. Choosing the terminal set, which corresponds exactly to the independent variables of the issue as well as the variables that describe the current state of the system. In this stage, the selection of the fit function is made, and the Root Mean Square Error is typically used as the metric to base the decision on (RMSE) [23]. Choose a set of functions, which may include Boolean functions, test functions, and mathematical operators. A measuring index for the correctness of the model, based on which it is possible to determine the extent to which the model is able to solve a certain problem. Control components are defined as numerical component values and qualitative variables that are utilized to control the execution of a program. The number of data in the training section, the number of data in the chromosome test sections, the size of the head, the number of genes, and the choice of the transplant operator are all variables that have the potential to be modified using one of four mathematical operations: addition, subtraction, multiplication, or division. In the current investigation, Gene Xpro Tools served as the foundation for the creation and implementation of genes that were based on genetic programming. Fig. 3 provides a representation of the structure of the GEP model [24]. After analyzing the sensitivity of the GEP model, the used parameters and their rates are evaluated. In this research, mutation rate, inversion rate, transgression rate of consecutive insertion and single point combination rate are considered as 0.044, 0.1, 0.1, 0.1 and 0.3 respectively.
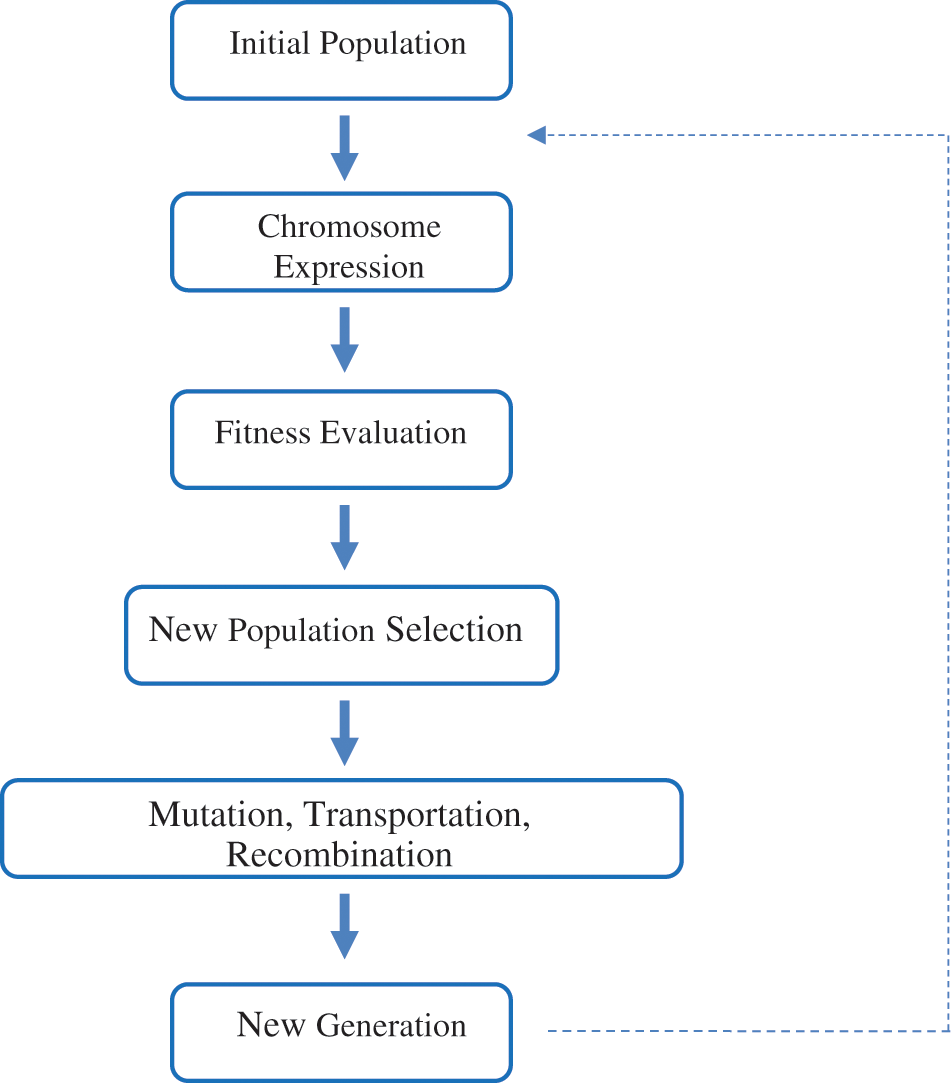
Figure 3: A representation of the GEP’s internal structure as a model
2.3 Evaluation Standards for the Effectiveness of Networks
To evaluate the performance of models, statistical measurements are applied. For verification and quantitative evaluation of the performance of the proposed models, statistical measures such as Nash–Sutcliffe Model Efficiency Coefficient (NSE), Mean Average Error (MAE), Root Mean Square Error (RMSE), and correlation coefficient (R) have been utilized. In the given relations N number of observational data, Xi and Yi indicate observational and predicted parameter, respectively. X− and Y− are Average observed and projected values, respectively [25].
By evaluating and studying numerous sources in the field of solar power plant zoning criteria, these criteria have been categorized into three climatic, economic, and physical classes. In this study, we analyzed solar radiation, sundial, rainfall, sunny hour, and temperature as climatic criteria, altitude and slope of the earth as physical and land cover use, and distance from cities as economic criteria to establish spatial priorities for the development of photovoltaic solar power plants. The applied constraints are ranked in five descriptive classes: extremely unpleasant, undesirable, average, desirable, and very desirable, as illustrated in Table 1 [26]. To prepare the study data and criteria, the layers are imported into an ArcGIS 10.7 and make the required modifications to the data format, limitations, and priorities. Fig. 4 depicts the consequence of applying the adjustments and limitations.

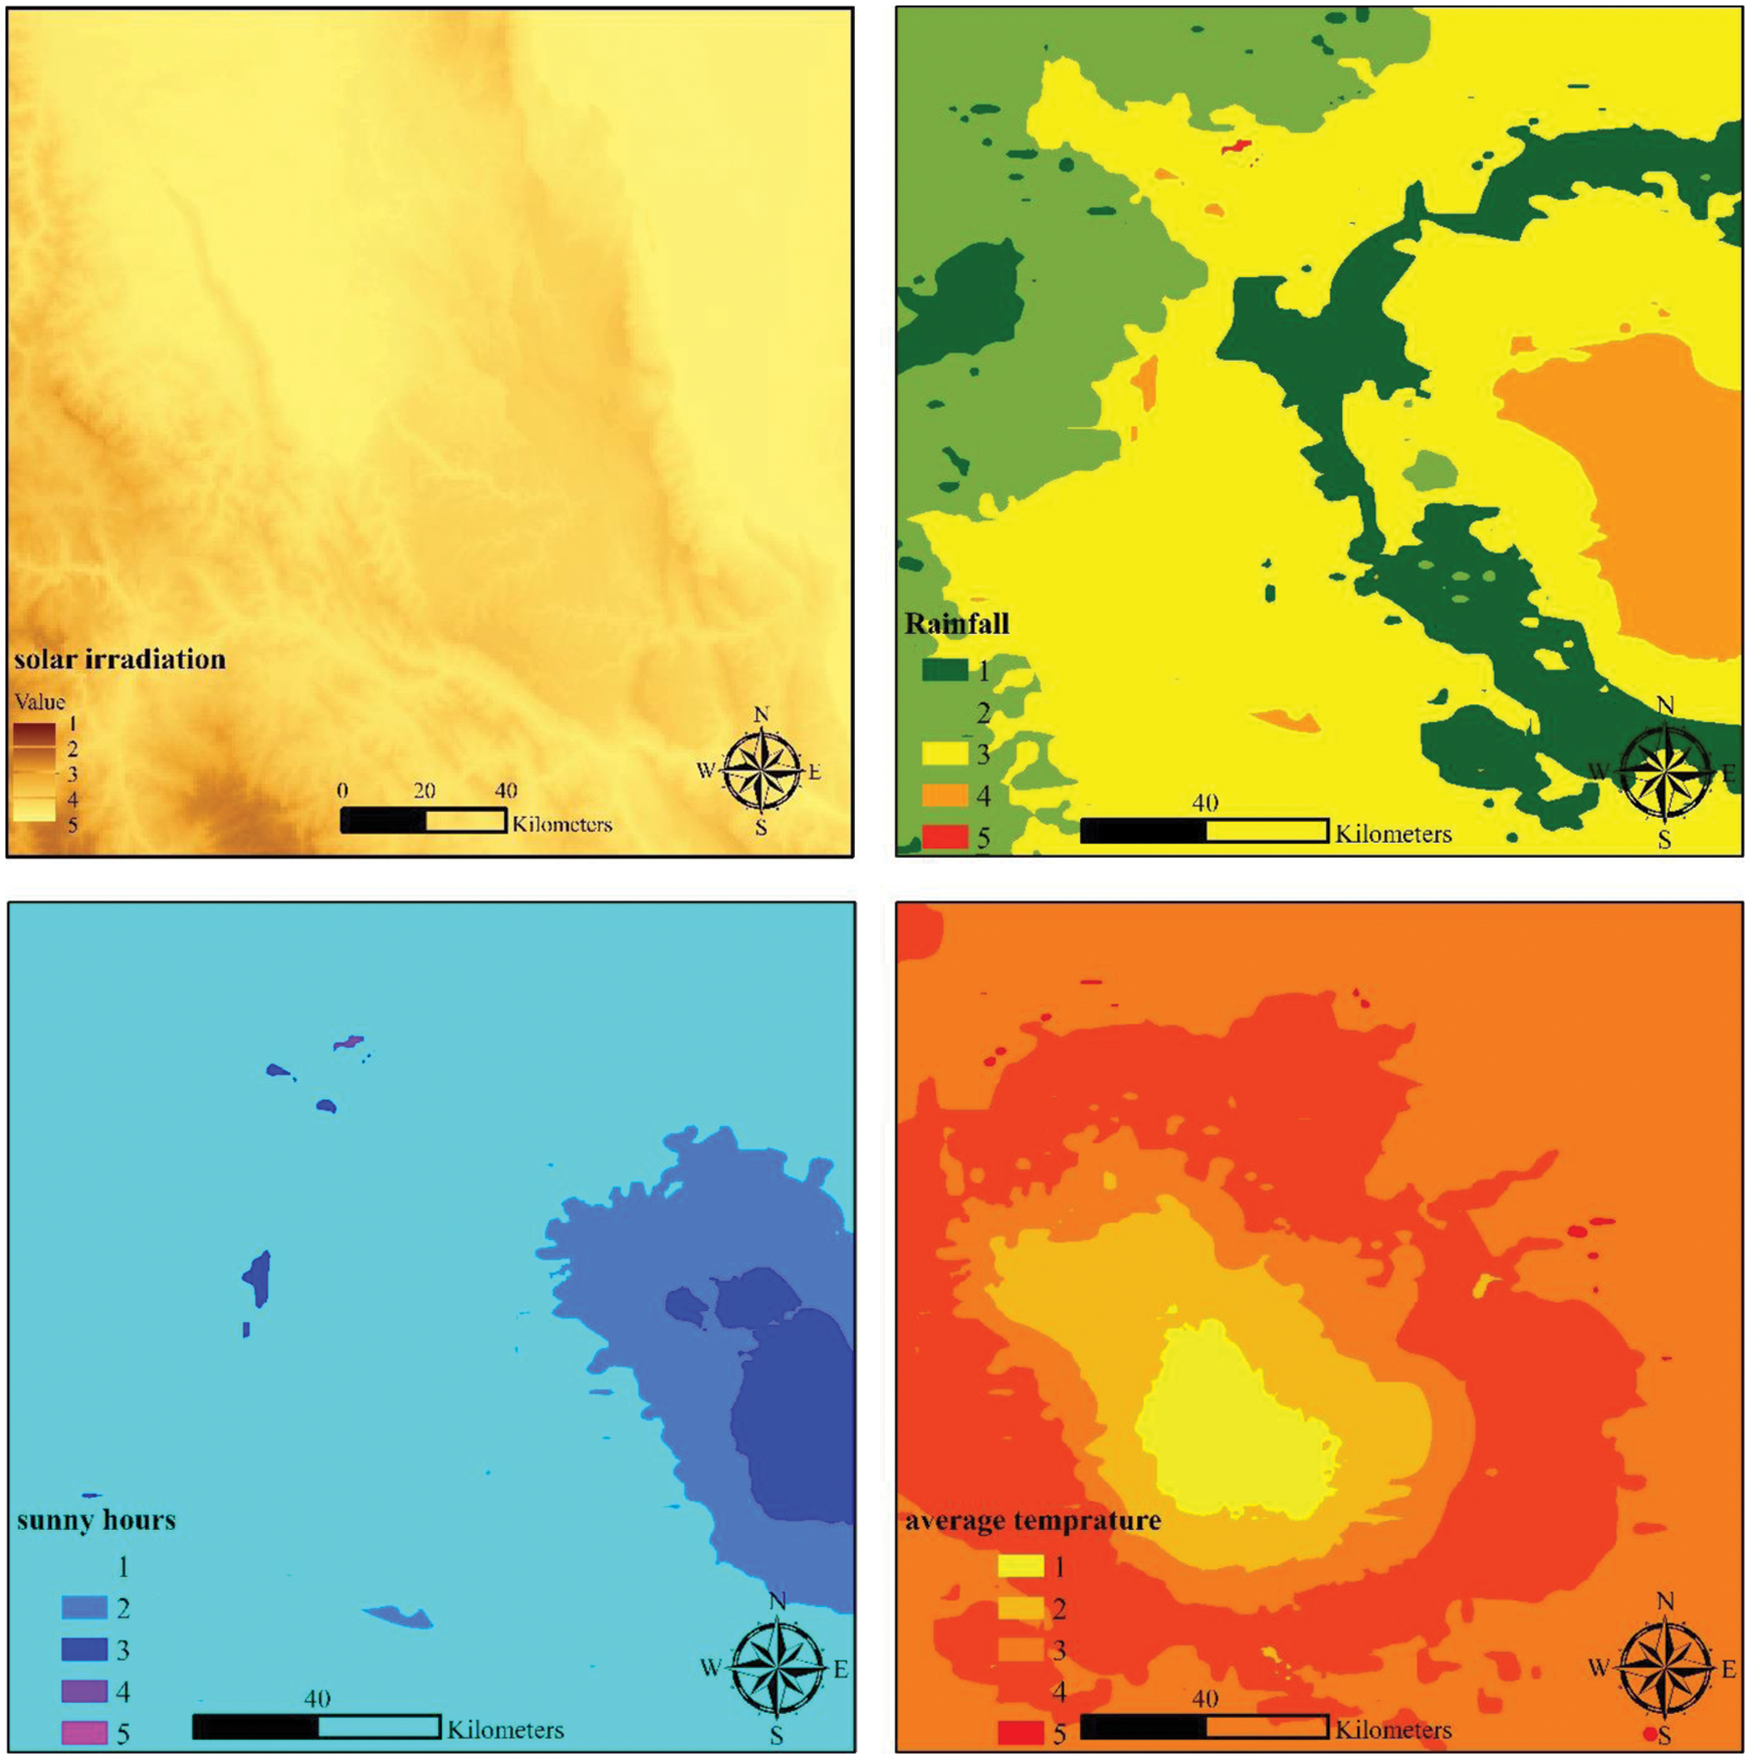
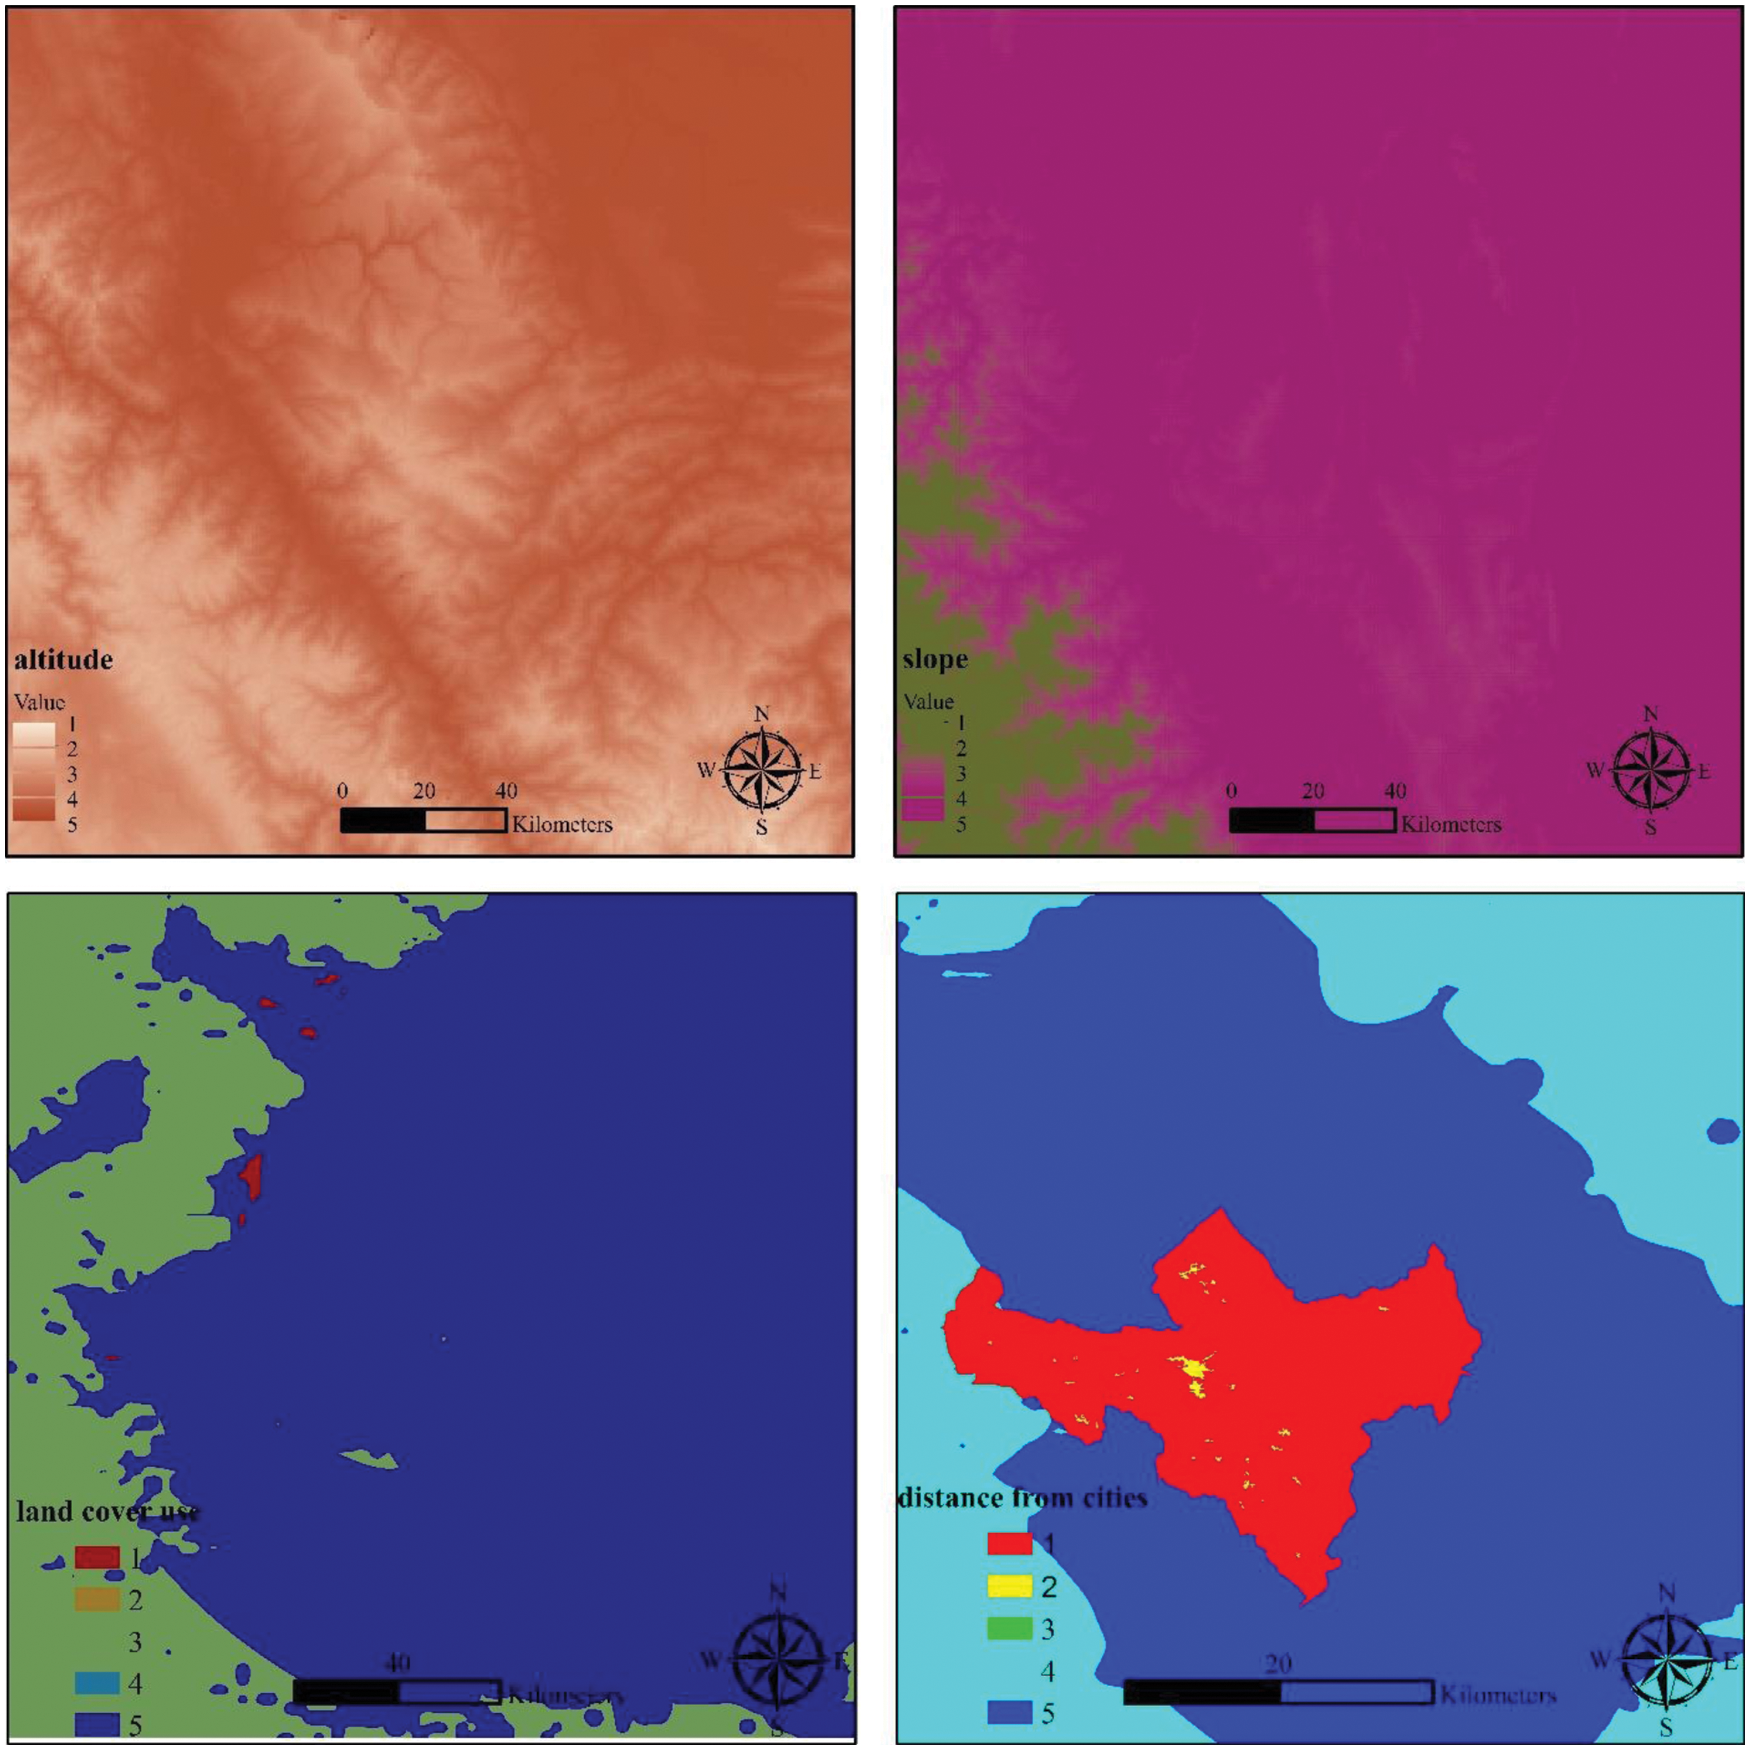
Figure 4: Creating a map of priorities based on criteria
According to Table 1, the sundial criterion should be given more consideration. This is because solar photovoltaic power plants can be built in areas that receive little precipitation and a lot of sunlight, and the amount of sunlight and the amount of precipitation both have an effect on the amount of solar radiation that is received. According to the sundial, rainfall comes in first, followed by solar rotation, and then solar temperature. The utilization of land comes in at number four on the list of priorities because the construction of solar power plants requires huge swaths of land, which should not come at the expense of agricultural land, gardens, protected areas, and other such places. To connect to the national grid, photovoltaic power plants, like other power plants, need access to power substations and transmission lines. On the other hand, substations are established near cities and at high altitudes, and transmission lines are built as close as possible to major roads. As a result, the distance from cities, height, and distance from major roads are ranked fifth through seventh, respectively. With the help of this criterion, we may evaluate whether or not the operation and the machinery are viable options. The influence of the temperature requirement on the efficiency of solar panels has been researched, and it was determined to be the ninth most important factor.
The description of the Fig. 4 are presented as following:
Solar Irradiation
According to international standards, the possibility of building solar power plants will have economic justification if the average radiant energy of the sun during the day is greater than 3.5 kWh per square meter. For this reason, in this study, the Area Solar Radiation function has been used to obtain the annual average of solar energy in order to perform a proper analysis in location by preparing this layer. In order to calculate the typical yearly amount of solar energy, the Area Solar Radiation function applies Eq. (6) [27].
where, Globaltot is calculated from the sum of the direct radiation of Dir θ,α and the scattered radiation of Dif θ,α in terms of watt-hours per square meter. The values of direct radiation and scattered radiation are obtained according to Eqs. (3) and (4), respectively.
where, Sconst, solar constant with numerical value 1368 W/m2, atmospheric transparency coefficient,
The effect of the directions of the earth’s surface on the radiation received is determined by the product of the cosine of the angle of impact; the angle of collision of
RgIB (Eq. (8)), the universal radiation (Eq. (11)), Pdif, is the scattering ratio of the universal solar flux, Dur, the analysis interval, SkyGap θ,α, the Gap map and Weight θ,α the scattering ratio (Eqs. (12) and (13)).
The amount of universal radiation RgIB is calculated without modifying the angle of impact and then by modifying the direct radiation ratio based on Eq. (12).
The scattered radiation ratios of
where,
Rainfall
In areas with high rainfall, the amount of cloudiness will be higher. In addition to increasing competitiveness, it causes an increase in particulate matter in the atmosphere, which will increase the absorption and reflection of the short-wave energy of the sun; the clouds return an average of 0.5% of the total shortwave energy of the sun [29].
Sundial
The sundial is one of the important climatic factors considered when determining whether or not photovoltaic solar power plants can be constructed. Of course, this parameter is affected by latitude, altitude, cloud cover, and severe air pollution; so that 22 percent of changes in the number of hours of sunshine per year are justified based on the width of the radius and the height. That is, for each degree of increase in latitude, the number of hours of sunshine per year increases by 22 min.
Temperature
Photovoltaic solar power plants utilize direct sunlight to generate energy, and it is a popular misconception that the higher the ambient temperature, the better the location for these power plants. Because the panel’s voltage and current, which indicate output power, are inversely proportional to the ambient temperature; that is, for each 1 degree increase in solar panel temperature above 25 degrees, the quantity of energy produced decreases by 0.4% to 0.5% [18].
Altitude
The higher the altitude, the lower the thickness of the atmosphere, and therefore the less absorption and reflection of the sun’s shortwave energy.
Slope
The slope of the ground in the construction of photovoltaic solar power plants is important in terms of access to the power plant site and the possibility of executive activity of machinery and has no effect on the installation and operation of solar panels; Below these panels are mounted on metal structures that adjust the slope required for vertical impact of sunlight with these structures .
Distance from Cities
In order for the generated electricity to reach consumers, power plants must be connected to the entire grid. Power plants are connected to the national grid by substations, and photovoltaic solar power plants are no exception. Due to the fact that substations have been established near cities to supply electricity to cities, the distance from cities is an important criterion in locating.
Land Use
In this study, severely eroded and poor lands, poor pastures and sands have been considered as very desirable and desirable areas. These types of land are of interest for the development of solar panels and the creation of solar farms due to their efficiency and availability.
Results Based on ANN and GEP
ANN and GEP requires training data, in order to obtain optimal and highly desirable locations. Then the layers were combined and out of 55983 records were used as desirable and very desirable regions for training and evaluation of different networks. 80% data was used to train stage and the rest for testing.
The results of efficiency of ANN and GEP are given in Table 2. The results showed that the accuracy of the GEP model is higher than the ANN model, so that the NSE, for GEP and ANN are 0.93 and 0.76 for train state, and 0.90 and 0.65 for test state, respectively.

As can be seen in Fig. 5 and Table 3, the final map that was constructed in accordance with the ANN and GEP model was subdivided into three distinct descriptive groups using the results that were obtained. The ANN classification states that approximately 1.7% of the study area falls into the favorable class for the construction of a photovoltaic solar power plant, 66.8% of the study area falls into the tolerable class, and 31.5 percent of the study area falls into the unfavorable class. According to the GEP classification, approximately 9.2 percent of the study area falls into the favorable category for the construction of photovoltaic solar power plants; however, 53.5 percent of the land falls into the tolerable category, and 37.3 percent of the area falls into the unfavorable category. In the following table, the three-class area that each model predicts will be occupied by solar power plants is presented in kilometers squared.
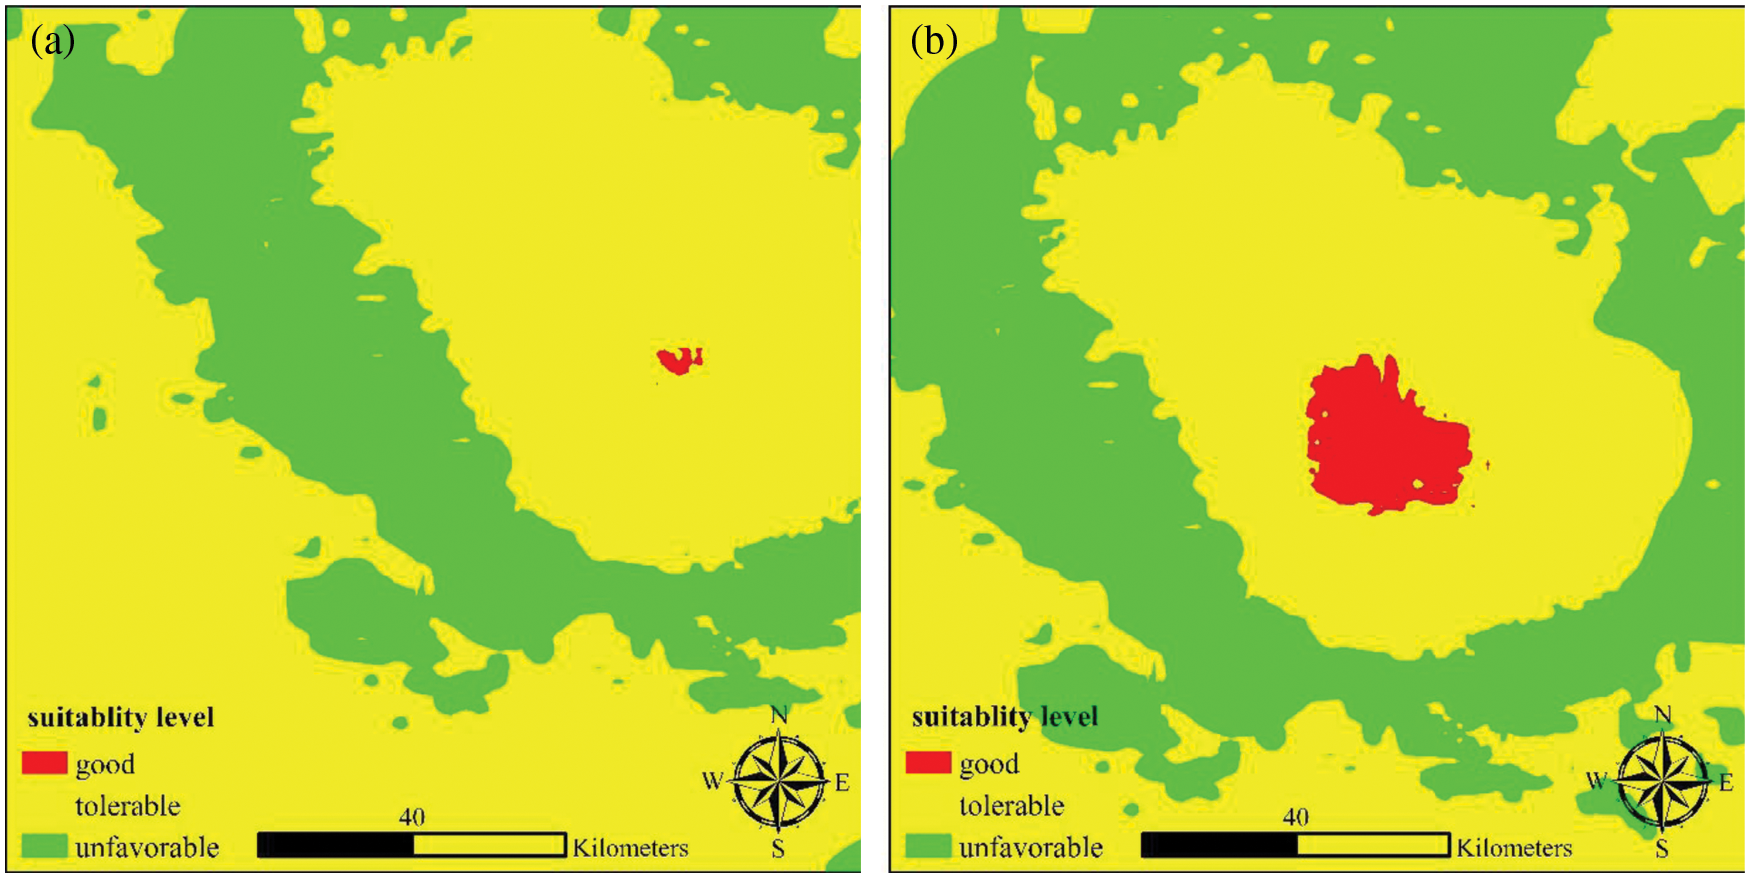
Figure 5: Photovoltaic solar power plant construction map based on (a) ANN and (b) GEP model in Lima, Peru

With the development of industry and technology, the supply of electricity required only through fossil power plants is not possible due to their limitations. On the other hand, with the increasing awareness of communities, the limitations and harms of the use of elephant energy have become more apparent and have forced countries to use renewable energy. Due to the geographical location of Peru and its benefit from 300 sunny days, the use of solar energy in both large and small (domestic) power plants helps to provide sustainable energy [30,31]. In this study, by arranging existing methods for location, i.e., using spatial decision-making systems and GIS, soft computing methods such as ANN and GEP are used to identify areas prone to the construction of photovoltaic solar power plants in the Lima, Peru. To achieve this goal, first, based on the criteria for construction and location of photovoltaic solar power plants, environmental factors including solar radiation, precipitation, sundial and temperature as climatic criteria, altitude and slope as physical and land use criteria, distance from roads and Distance from cities has been defined as economic criteria. Based on these criteria, training data were prepared. Based on NSE, MAE, RMSE, and R evaluation criteria, GEP was selected as the more suitable than ANN network. After preparing the final map based on GEP model results, it was found that of the total area of the province, about 9.2 percent of the study area in the good class for the building of photovoltaic solar power plants, 53.5 percent of the land is in the tolerable category, and 37.3 percent of the area is in the unfavorable category. While, according to the ANN model, approximately 1.7 percent of the study area is in the good class for the building of photovoltaic solar power plant, 66.8 percent of the study area is in the tolerable class, and 31.5 percent of the study area is in the unfavorable class.
Despite all the efforts and innovations in this research, the present study, like other studies, faces limitations. One of the most important limitations is the very small number of solar power plants and the non-construction of these power plants | It is based on environmental and climatic criteria, in addition, if criteria such as power lines, substations, air pollution traps, dust maps, etc. were available, a more accurate forecast would have been made; For this reason, the use of these criteria is recommended for future studies. Meanwhile, The major concern and limitation in this study was the gathering precise and reliable data.
Funding Statement: The authors received no funding for this study.
Conflicts of Interest: The authors declare that they have no conflicts of interest to report regarding the present study.
References
1. H. Azizi and N. Nejatian, “Evaluation of the climate change impact on the intensity and return period for drought indices of SPI and SPEI (study area: Varamin plain),” Water Supply, vol. 22, no. 4, pp. 4373–436, 2022. [Google Scholar]
2. F. Qayyum, F. Jamil, S. Ahmad and D. H. Kim, “Hybrid renewable energy resources management for optimal energy operation in nano-grid,” Computers, Materials & Continua, vol. 71, no. 2, pp. 2091–2105, 2022. [Google Scholar]
3. S. Chawla and V. A. Tikkiwal, “Performance evaluation and degradation analysis of different photovoltaic technologies under arid conditions,” International Journal of Energy Research, vol. 45, no. 1, pp. 786–798, 2021. [Google Scholar]
4. R. Ghasempour, M. A. Nazari, M. Ebrahimi, M. H. Ahmadi and H. Hadiyanto, “Multi-criteria decision making (MCDM) approach for selecting solar plants site and technology: A review,” International Journal of Renewable Energy Development, vol. 8, no. 1, pp. 15–25, 2019. [Google Scholar]
5. S. Türk, A. Koç and G. Şahin, “Multi-criteria of PV solar site selection problem using GIS-intuitionistic fuzzy based approach in Erzurum province/Turkey,” Scientific Reports, vol. 11, no. 1, pp. 1–23, 2021. [Google Scholar]
6. A. Molajou, P. Pouladi and A. Afshar, “Incorporating social system into water-food-energy nexus,” Water Resources Management, vol. 35, no. 13, pp. 4561–4580, 2021. [Google Scholar]
7. B. A. A. Yousef, A. A. Hachicha, I. Rodriguez, M. A. Abdelkareem and A. Inyaat, “Perspective on integration of concentrated solar power plants,” International Journal of Low-Carbon Technologies, vol. 16, no. 3, pp. 1098–1125, 2021. [Google Scholar]
8. S. Zambrano-Asanza, J. Quiros-Tortos and J. F. Franco, “Optimal site selection for photovoltaic power plants using a GIS-based multi-criteria decision making and spatial overlay with electric load,” Renewable and Sustainable Energy Reviews, vol. 143, pp. 110853, 2021. [Google Scholar]
9. C. Kocabaldir and M. A. Yucel, “GIS-based multi-criteria decision analysis of site selection for photovoltaic power plants in Çanakkale province,” International Journal of Environment and Geoinformatics, vol. 7, no. 3, pp. 347–355, 2020. [Google Scholar]
10. M. A. Hassaan, A. Hassan and H. Al-Dashti, “GIS-Based suitability analysis for siting solar power plants in Kuwait,” The Egyptian Journal of Remote Sensing and Space Science, vol. 24, no. 3, pp. 453–461, 2021. [Google Scholar]
11. U. Munkhbat and Y. Choi, “Gis-based site suitability analysis for solar power systems in Mongolia,” Applied Sciences, vol. 11, no. 9, pp. 3748, 2021. [Google Scholar]
12. S. L. Pinjare and A. M. Kumar, “Implementation of neural network back propagation training algorithm on FPGA,” International Journal of Computer Applications, vol. 52, no. 6, pp. 1–7, 2012. [Google Scholar]
13. H. Moayedi and A. Mosavi, “An innovative metaheuristic strategy for solar energy management through a neural networks framework,” Energies, vol. 14, no. 4, pp. 1196, 2021. [Google Scholar]
14. N. Ghadami, M. Gheibi, Z. Kian, M. G. Faramarz, R. Naghedi et al., “Implementation of solar energy in smart cities using an integration of artificial neural network, photovoltaic system and classical Delphi methods,” Sustainable Cities and Society, vol. 74, pp. 103149, 2021. [Google Scholar]
15. V. Nourani, A. Molajou, H. Najafi and A. Danandeh Mehr, “Emotional ANN (EANNA new generation of neural networks for hydrological modeling in IoT,” in Artificial Intelligence in IoT, springer, Cham, pp. 45–61, 2019. [Google Scholar]
16. T. E. Boukelia, O. Arslan and M. S. Mecibah, “ANN-based optimization of a parabolic trough solar thermal power plant,” Applied Thermal Engineering, vol. 107, pp. 1210–1218, 2016. [Google Scholar]
17. K. S. Garud, S. Jayaraj and M. Y. Lee, “A review on modeling of solar photovoltaic systems using artificial neural networks, fuzzy logic, genetic algorithm and hybrid models,” International Journal of Energy Research, vol. 45, no. 1, pp. 6–35, 2021. [Google Scholar]
18. K. Yang, J. Schot and B. Truffer, “Shaping the directionality of sustainability transitions: The diverging development patterns of solar photovoltaics in two Chinese provinces,” Regional Studies, vol. 56, no. 3, pp. 751–769, 2021. [Google Scholar]
19. L. Silva and S. Sareen, “Solar photovoltaic energy infrastructures, land use and sociocultural context in Portugal,” Local Environment, vol. 26, no. 3, pp. 347–363, 2021. [Google Scholar]
20. H. Sun and R. Grishman, “Lexicalized dependency paths based supervised learning for relation extraction,” computer,” Computer Systems Science and Engineering, vol. 43, no. 3, pp. 861–870, 2022. [Google Scholar]
21. D. Dansana, R. Kumar, A. Parida, R. Sharma, J. Adhikari et al., “Using susceptible-exposed-infectious-recovered model to forecast coronavirus outbreak,” Computers, Materials & Continua, vol. 67, no. 2, pp. 1595–1612, 2021. [Google Scholar]
22. A. Molajou, V. Nourani, A. Afshar, M. Khosravi and A. Brysiewicz, “Optimal design and feature selection by genetic algorithm for emotional artificial neural network (EANN) in rinfall-runoff modeling,” Water Resources Management, vol. 35, no. 8, pp. 2369–2384, 2021. [Google Scholar]
23. H. Sun and R. Grishman, “Employing lexicalized dependency paths for active learning of relation extraction,” Intelligent Automation & Soft Computing, vol. 34, no. 3, pp. 1415–1423, 2022. [Google Scholar]
24. H. Shatnawi, C. W. Lim, F. B. Ismail and A. Aldossary, “Experimental study of heat transfer enhancement in solar tower receiver using internal fins,” Computers, Materials & Continua, vol. 68, no. 2, pp. 1693–1711, 2021. [Google Scholar]
25. H. Ahn, K. Sun and K. P. Kim, “Comparison of missing data imputation methods in time series forecasting,” Computers, Materials & Continua, vol. 70, no. 1, pp. 767–779, 2021. [Google Scholar]
26. D. Messaoudi, N. Settou, B. Negrou and B. Settou, “GIS based multi-criteria decision making for solar hydrogen production sites selection in Algeria,” International Journal of Hydrogen Energy, vol. 44, no. 60, pp. 31808–31831, 2019. [Google Scholar]
27. L. Xiangchun, C. Zhan, S. Wei, L. Fenglei and Y. Yanxing, “Data matching of solar images super-resolution based on deep learning,” Computers, Materials & Continua, vol. 68, no. 3, pp. 4017–4029, 2021. [Google Scholar]
28. S. S. Band, P. Taherei Ghazvinei, K. bin Wan Yusof, M. Hossein Ahmadi, N. Nabipour et al., “Evaluation of the accuracy of soft computing learning algorithms in performance prediction of tidal turbine,” Energy Science & Engineering, vol. 9, no. 5, pp. 633–644, 2021. [Google Scholar]
29. M. H. Ahmadi and E. Açıkkalp, “Exergetic dimensions of energy systems and processes,” Journal of Thermal Analysis and Calorimetry, vol. 145, no. 3, pp. 631–634, 2021. [Google Scholar]
30. S. Silvestre, S. Kichou, A. Chouder, G. Nofuentes and E. Karatepe, “Analysis of current and voltage indicators in grid connected PV (photovoltaic) systems working in faulty and partial shading conditions,” Energy, vol. 86, pp. 42–50, 2015. [Google Scholar]
31. M. Alrifaey, W. H. Lim, C. K. Ang, E. Natarajan, M. Solihin et al., “Hybrid deep learning model for fault detection and classification of grid-connected photovoltaic system,” IEEE Access, vol. 10, pp. 13852–13869, 2022. [Google Scholar]
Cite This Article
 Copyright © 2023 The Author(s). Published by Tech Science Press.
This work is licensed under a Creative Commons Attribution 4.0 International License , which permits unrestricted use, distribution, and reproduction in any medium, provided the original work is properly cited.
 Downloads
 Citation Tools