
 Submit a Paper
 Propose a Special lssue
 Open Access
ARTICLE

Experimental Evaluation of Trilateration-Based Outdoor Localization with LoRaWAN
1 Department of Electrical and Electronic Engineering, Universiti Teknologi PETRONAS, Seri Iskandar, 32610, Malaysia
2 Balochistan University of Information Technology, Engineering, and Management Sciences, Quetta, 37500, Pakistan
3 College of Engineering, Al Ain University, Al Ain, 64141, United Arab Emirates
4 Department of Technology, The University of Lahore, Lahore, 54000, Pakistan
5 High Performance Cloud Computing Centre (HPC3), Universiti Teknologi PETRONAS, Seri Iskandar, 32610, Malaysia
* Corresponding Author: Saeed Ahmed Magsi. Email:
Computers, Materials & Continua 2023, 75(1), 845-862. https://doi.org/10.32604/cmc.2023.033636
Received 23 June 2022; Accepted 26 October 2022; Issue published 06 February 2023
 View Full Text
 Download PDF
Abstract
Long Range Wide Area Network (LoRaWAN) in the Internet of Things (IoT) domain has been the subject of interest for researchers. There is an increasing demand to localize these IoT devices using LoRaWAN due to the quickly growing number of IoT devices. LoRaWAN is well suited to support localization applications in IoTs due to its low power consumption and long range. Multiple approaches have been proposed to solve the localization problem using LoRaWAN. The Expected Signal Power (ESP) based trilateration algorithm has the significant potential for localization because ESP can identify the signal’s energy below the noise floor with no additional hardware requirements and ease of implementation. This research article offers the technical evaluation of the trilateration technique, its efficiency, and its limitations for the localization using LoRa ESP in a large outdoor populated campus environment. Additionally, experimental evaluations are conducted to determine the effects of frequency hopping, outlier removal, and increasing the number of gateways on localization accuracy. Results obtained from the experiment show the importance of calculating the path loss exponent for every frequency to circumvent the high localization error because of the frequency hopping, thus improving the localization performance without the need of using only a single frequency.Keywords
The localization techniques can be broadly divided into two categories depending on range measurements, such as range-based [1,2] and range-free techniques [3–5]. The range-free approach does not require distance or angle measurements among nodes. It localizes nodes by simple sensings, such as wireless connectivity [6], and anchor proximity [7]. This makes it a low-cost solution. However, its localization accuracy is very low [5]. The range-based localization uses the geometrical information of the devices and the separation distance between them, thereby increasing localization accuracy [2,8]. The traditional radio frequency (RF) technologies that have been widely used are Global Positioning System (GPS), Wi-Fi, Bluetooth Low Energy (BLE), etc. The problem with the traditional technologies is high power consumption; therefore, these technologies are not efficient to be used for localization in IoT. To solve the problem of high-power consumption, Low Power Wide Area Networks (LPWANs) are getting very much attention in the field of localization. There are many vendors and competing standards in the LPWAN space, the most prominent of which include: DASH7, Sigfox, LoRaWAN, Weightless, Wize, etc. Long Range Wide Area Network (LoRaWAN) is well suited for localization applications as it can be used with little power. Although GPS is very accurate outdoors, regular battery charging or replacement is needed. Secondly, GPS signals have low penetration power, especially in high-rise buildings, mountains, etc. The localization can be done for years without charging or replacing the battery on LoRaWAN devices. With a 250 mAh battery, it is possible to have 20000 transmissions before depletion of the battery compared to GPS, which can have only 1000 GPS calculations [9]. Localization accuracy has always been the major problem while using LoRaWAN. Multiple range-based approaches like Angle of Arrival (AoA), Time of Arrival (ToA), Received Signal Strength Indicator (RSSI), and Time Difference of Arrival (TDoA) are proposed by the research community for the improvement in the localization accuracy [10]. ToA approach can be more accurate when the synchronization offset is very low between the end node and the gateway, which is highly unlikely due to the clock drift over time. The clock of the LoRaWAN board used in the end device depends on the crystal oscillator. The crystal oscillator has the problem of drift over time [11]. AoA needs to have antennae arrays (receiver side) to find the location [12], which the LoRaWAN currently does not support [11].
In this research article technical evaluation of the trilateration technique for finding out the location of the end node is carried out. Moreover, the experimental evaluation was conducted on campus to validate the working of LoRaWAN for outdoor localization having the maximum strength of students and the maximum mobility of the vehicles. Additionally, ESP has been used instead of the RSSI to characterize the signal energy. Most importantly, the solution is proposed for the localization error caused due to frequency hopping. Instead of using only a single frequency, results from the experiment show the importance of calculating the path loss exponent for every frequency to circumvent the localization error caused due to the high variance in ESP because of the frequency hopping.
The rest of the paper is organized as follows. In Section 2, a review of localization techniques that have been applied using LoRaWAN is discussed. Detailed methodology is included in Section 3. Results based on the data collected using LoRaWAN and the application of the trilateration technique are elaborated and discussed in Section 4. The conclusion is derived in the last section, along with the references.
Different approaches have been studied in the literature to carry out the localization. These approaches include but are not limited to trilateration [13], Time of Arrival (ToA) [14–16], Time Difference of Arrival (TDoA) [17], Angle of Arrival (AoA) [18], and Fingerprinting techniques [19]. The trilateration technique uses the received signal strength indicator (RSSI) to calculate the distance between the end node and the gateways. This technique needs to have a minimum of three gateways. ToA technique uses the time taken by the signal to reach the receiver. This time is then converted to the distance. TDoA works similar to ToA. They both are time-based techniques to convert time into distance. In TDoA, the time difference of the signal to reach at least two gateways is calculated. This difference is then used to determine the distance between the end node and the gateways. The AoA technique uses the angle of the signal received at the gateway. This angle is then used to find out the location of the end node.
In [20], the trilateration technique is used to determine the localization accuracy between Wi-Fi, BLE, and Long Range (LoRa) in an indoor environment. The authors concluded that the Wi-Fi had the highest accuracy of 0.54 m. The LoRa had an accuracy of 0.62 m, but their findings were limited to three different environments having a graduate lab of 24 × 24 square feet area, a corridor of 23 × 23 square feet, and a classroom with an area of 50 × 30 square feet. Secondly, the authors carried out the experiments from 1700 h to 2100 h so that there is minimum mobility of students. Trilateration has been implemented in an experimental evaluation of cell-level indoor localization using Wi-Fi and LoRa in [21]. The authors divided a small testbed area into cells and predicted the cells using the trilateration technique. The authors concluded that the Wi-Fi based trilateration technique is better. In [22], the LoRa has been used for indoor localization at an apartment building. They considered the LoRa localization accuracy using the LoS and NLoS scenarios. The authors concluded that in an LoS scenario, the accuracy is 1.6 m, while for an NLoS scenario, the accuracy is 3.2 m.
Sciullo et al. [23] implemented a LoRa-based mobile emergency management system (LOCATE). They used the end nodes to send the GPS locations to the server. If the node could not receive the GPS location due to no GPS signals, it requests the neighboring nodes for their locations. The current end node then applies the trilateration technique after getting the response from at least three end nodes with their GPS locations. In [24], LoRa has been implemented for search and rescue operations. The path-loss model was implemented to search for the person to be rescued. First, path loss data needed to be collected at the locations, and then the end node’s location was predicted.
The study based on frequency hopping was conducted by Kwasme et al. [25] in a test area of 50 × 90 m using an RSSI-based trilateration technique for localization using LoRaWAN. The work has concentrated on an outdoor location in an open football field with LoS between gateways and end nodes. The study comprised six gateways. They removed the outliers that were away 15–20 dBs from the average RSSI values and called it a refined average. The study concluded that frequency hopping has a negative impact on localization accuracy. It further concluded that using an average RSSI reading of a single frequency reduces the impact of the frequency hopping on localization accuracy.
Bansal et al. [26] presented a LoRa localization system named OwLL. The authors used the frequency hopping function of LoRaWAN to stitch the multiple TV whitespace and the ISM band to solve the low-bandwidth problem of LoRa and then used the TDoA technique to perform the localization. This technique helped them to get a median localization error of 3.6 m for LoS clients and 14.8 m for the NLoS locations.
Several researchers used RSSI-based fingerprinting techniques and machine learning algorithms to predict the location of the end nodes. Lazaro et al. have implemented a room-level localization system using the LoRa Backscatters [27]. Their system detected the LoRa Backscatter’s location by comparing the received RSSIs at all the receivers. The system performed at an accuracy of 89.7% by using the linear discriminant analysis (LDA). The fingerprinting algorithm is implemented by Anjum et al. [28]. The prediction of the location was made by using machine learning algorithms. The fingerprinting technique has high accuracy in determining the position of the end node, but labor-intensive measurements of fingerprints are needed at outdoor locations. This technique works very well in an environment that does not have rapid changes. For example, the fingerprints taken on the day differ from those taken on the following day due to possible environmental changes. This potential change in the environment can be caused due to many reasons, like more cars parked on the second day and the increase in the density of the people. Therefore, it is needed to keep the fingerprints updated, which is very labor-intensive work for outdoor scenarios. The fingerprinting technique is best for indoor scenarios as there is less chance of rapid change in the environment. Similarly, a quantum bird migration optimizer-based node localization (QBMA-NL) [29] technique is presented, which uses RSSI and the Euclidean distance to find out the location of the target nodes. In [30] random neural networks have been used for outdoor LoRa localization. In this method, the fingerprints need to be collected first; then, using those fingerprints, the neural networks have been implemented to predict the location of the end node.
The Time Difference of Arrival (TDoA) technique can be used for localization. The problem with the TDoA is the synchronization offset between the gateways. The gateways need to be tightly synchronized for the TDoA technique to work efficiently for localization. Yoshitome et al. [31] compared the RSSI and Time Difference of Arrival (TDoA) for the outdoor localization and concluded that TDoA works best in the outdoor scenario.
In comparison to the latest literature, this study contributes to the experiments carried out in a large-scale outdoor environment with maximum mobility of people and vehicles. The challenging terrain and the environment were chosen deliberately to get an accurate picture of the capabilities of the LoRa to be used for localization using the trilateration technique. Instead of traditionally used RSSI, we used ESP to characterize the energy of the signal below the noise floor [32]. Most importantly, we evaluated the localization performance in the presence of frequency hopping. To the best of the author’s knowledge, previous works focused on using a single frequency to circumvent the high variance in ESP due to frequency hopping, but in LoRaWAN, end devices and gateways interact continuously to allow the data transmission to “hop” to other frequency channels that are more suitable for the speed, duty cycle, system’s power, and range constraints [33]. Therefore, only using a single frequency would not do any good but deteriorates the LoRaWAN function more.
3 Methodology and System Setup
This section explains the detailed methodology that has been adapted, the setup of hardware, and the testbed.
The devices used for the experiments were Dragino LoRa shield as an end node and RisingHF (RHF2S008) as a gateway. The end node and gateways were powered by a power bank and power over ethernet (PoE) respectively. This gateway has an integrated GPS module that helps find out TDoA. The gateway features are [34]:
• LoRaWAN half-duplex operation mode
• Uplinks include eight multi-SF LoRa channel
• One single-SF LoRa channel and 1 GFSK channel
• Output power achieves 27 dBm max
• Receiver sensitivity as low as −141 dBm
• Support 10/100 M Ethernet connection and GPRS/3G/4G connection
• Antenna gain is 3 dBi
The network server used was the online public network server named THE THINGS NETWORK. LoRa Shield transmits the data to the gateway. The gateway then transfers the data along with the metadata like RSSI, Timestamps, and SNR to the public online network server “THE THINGS NETWORK”, as shown in Fig. 1. The gateways can be connected to the internet or “THE THINGS NETWORK” using Ethernet, GPRS, 3G, 4G, and Wi-Fi.
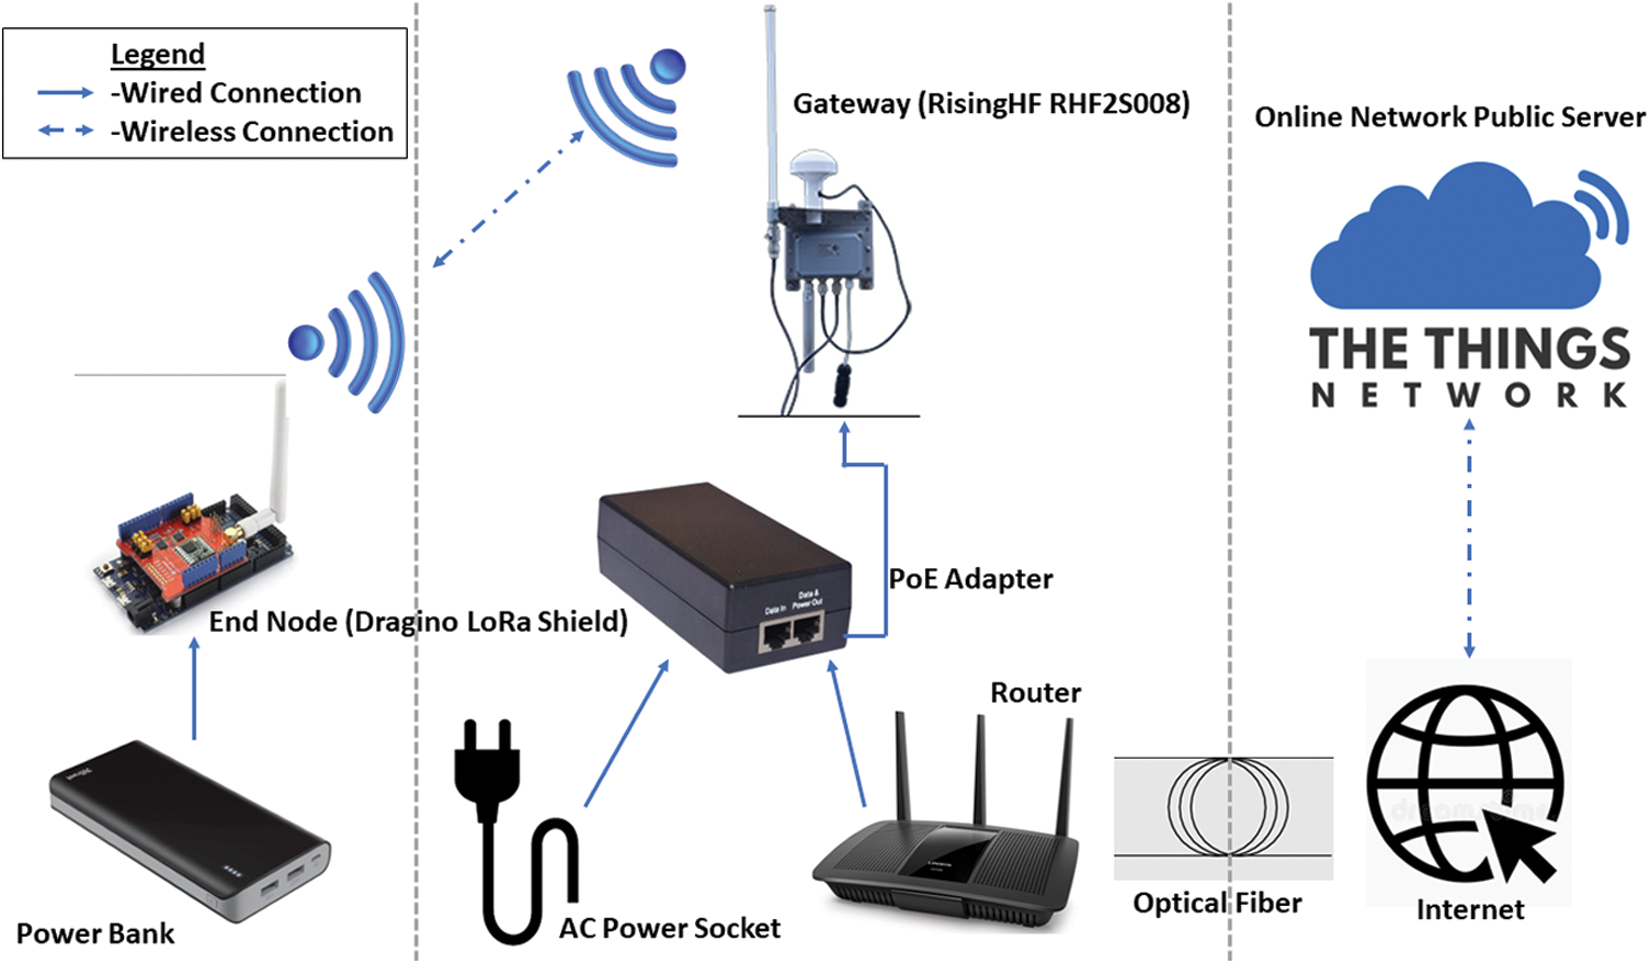
Figure 1: “THE THINGS NETWORK” and the overall experimental system setup
The experiments were conducted in an area of 1850 by 705 m at Universiti Teknologi PETRONAS (UTP). Three to four story buildings, trees, lakes, open grounds, and foliage are present in the area. The experiments were conducted from a time duration of 0900 to 1700 h from Mondays to Fridays. The chosen timings were deliberate to have a maximum strength of students and the maximum mobility of the vehicles on the campus. No experimentations were conducted on weekends when there is little strength of students, and the mobility of vehicles is significantly less. The days and the time were chosen to have maximum interference in the LoRa signals to derive an accurate picture of the capabilities of the LoRa for localization using trilateration.
3.3 Placement of Gateways and the End Nodes
The map of the points where ESPs are measured can be seen in Fig. 2. Six gateways and three end nodes were used for the testbed. Two hundred random points in Universiti Teknologi PETRONAS were selected for the end nodes. At each point, a total of 21 ESP values were taken. The distances between the End Node and gateways were calculated using the longitudes and latitudes of the End Nodes and the gateways using Eq. (1).
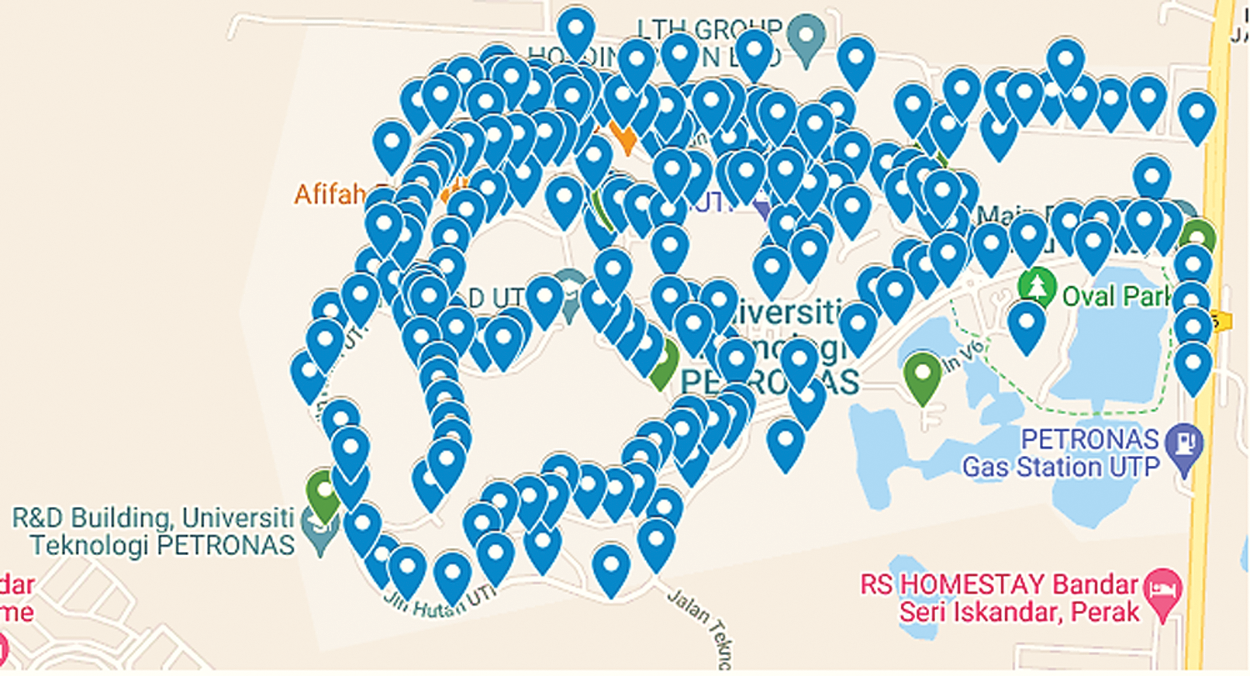
Figure 2: A mapped tagging of the gateways and the end node’s locations in UTP
In Eq. (1), n is the distance between two points on earth, l is the latitude, q is the longitude, R is the radius of the earth which is approximately equal to 6371 km [35]. The location of the gateways and the end nodes can be seen in Fig. 2. with green and blue markers, respectively. The experimental evaluation began with three gateways and ended with six placed on the building rooftops to determine whether the localization error increased or decreased. The gateway locations were fixed and chosen carefully to have internet and power.
The gateways and the end nodes were positioned on a tripod. The height of the tripod was1.5 m. The gateway with the highest elevation was 74 m above sea level, as seen in Fig. 3. The elevation has been measured by a mobile application named Ulysse Speedometer. The variance in end node and gateway placement heights can affect the localization accuracy. It is challenging to make the elevation constant because of their placements in different areas and distances. It is pertinent to note that all the measurements were taken outdoors, and no indoor measurements were carried out in this experiment.
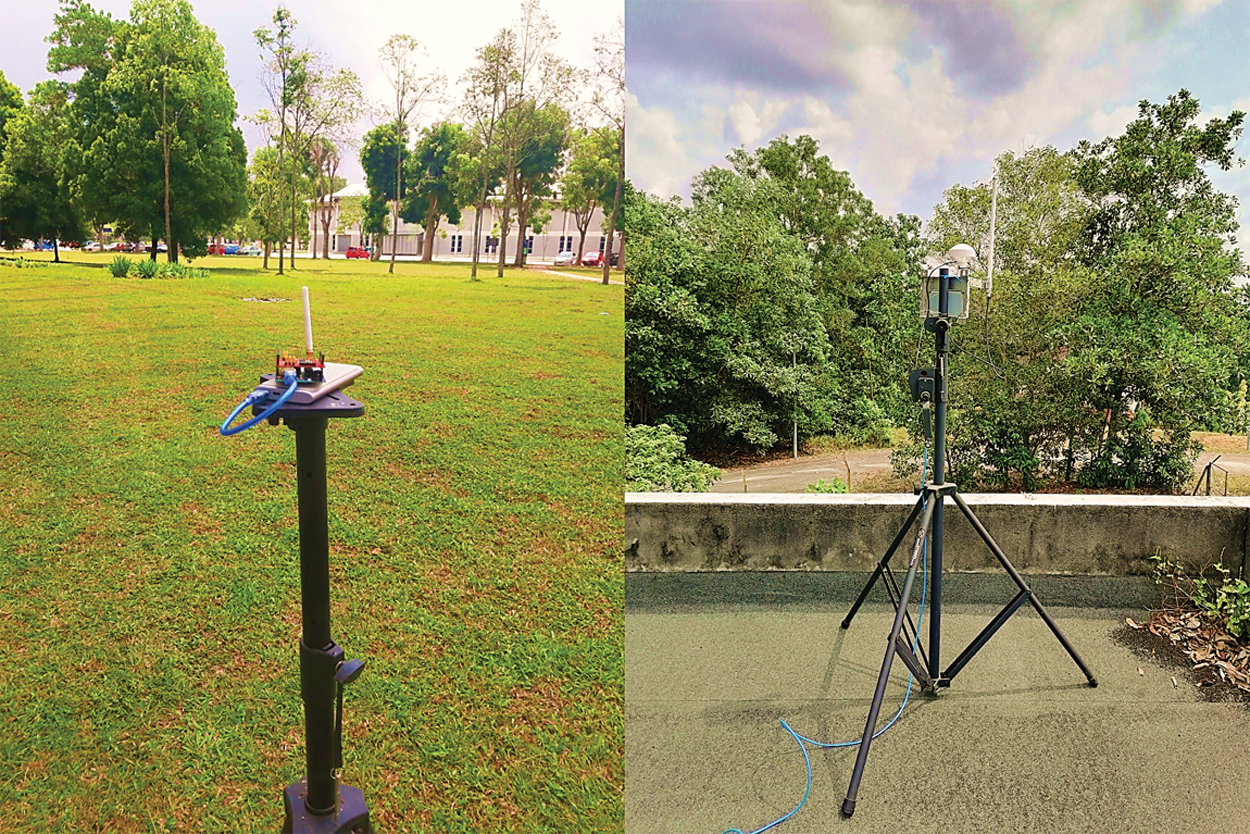
Figure 3: Orientation and placement of the end node and the gateway
3.4 Expected Signal Power (ESP) Based Trilateration
RSSI is one of the most used approaches in localization [36–40]. RSS is the actual power strength of the signal received and is measured in dBm or mW. The RSS determines the distance between Transmitter and Receiver in range-based techniques. The larger the distance smaller the RSS, and the smaller the distance larger the RSS between transmitter (Tx) and receiver (Rx). The received power cannot be solely used to determine the distance because of the shadowing and the multipath effect, which are random [41] and can be shown in Eq. (2).
where
Despite the fact that LoRa has the ability to receive transmissions up to 20 dB below the noise floor, the RSSI is unable to capture the path loss of these incredibly weak signals. To capture the energy of the signal, LoRa employs the ESP [32].
Now to relate RSSI with the received signal power
Packet’s SNR and RSSI are used to calculate the ESP and further the path loss. It can be shown in the logarithm unit [43] with Eq. (6).
Localization using ESP requires trilateration or N-point literation to locate a device relative to the reference point, as shown in Fig. 4.
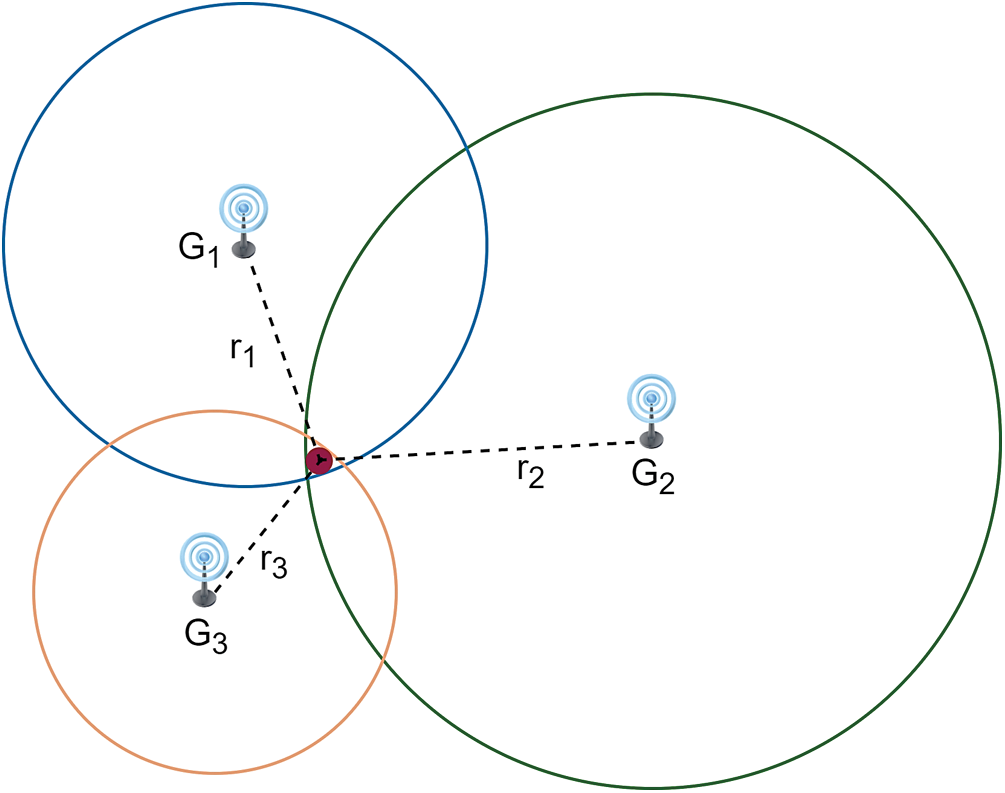
Figure 4: Trilateration using three gateways
The location of the end node is the intersection point of the three circles represented by (
By doing simplifications, the location of the end node (
where
It is crucial to estimate the path loss exponent for the environment before performing the experiments. It is worth mentioning that the PLE depends on the environment. The PLE in free space is different, as is the PLE at a location with many buildings, trees, etc. The PLE can be calculated empirically or using standard value tables for various environments [42]. The second approach cannot be implemented in our methodology as many buildings, trees, people, and cars exist. It is, therefore, not an easy task to calculate the PLE using the typical values table. The method used to determine the PLE in our study is the linear least squares regression. This method minimizes the vertical distance between the regression line and the ESP. It is crucial to estimate the PLE as correctly as possible to find the distance with the least errors.
A total of 14 random points at different locations and distances from the gateways have been selected, with 21 ESP readings at each location recorded. These readings at each location are then averaged and plotted to the curve. The logarithmic distance 10log(d/d0) at the x-axis and the path loss in dB at the y-axis give us the path loss exponent using the linear least squares regression [25] as shown in Fig. 5.
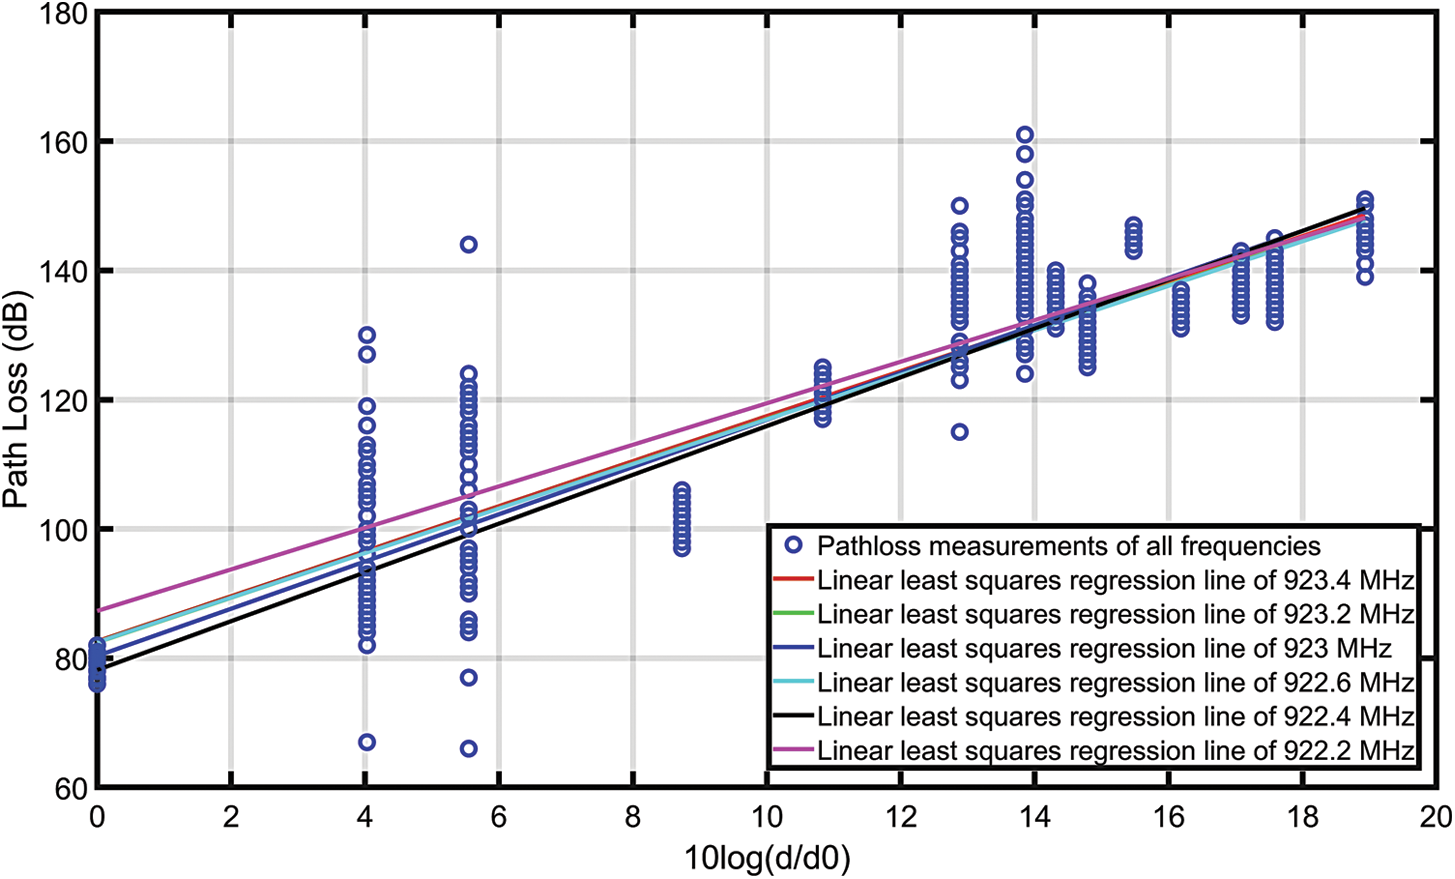
Figure 5: Linear least squares regression lines for all the frequencies to determine the path-loss exponent using 14 different locations
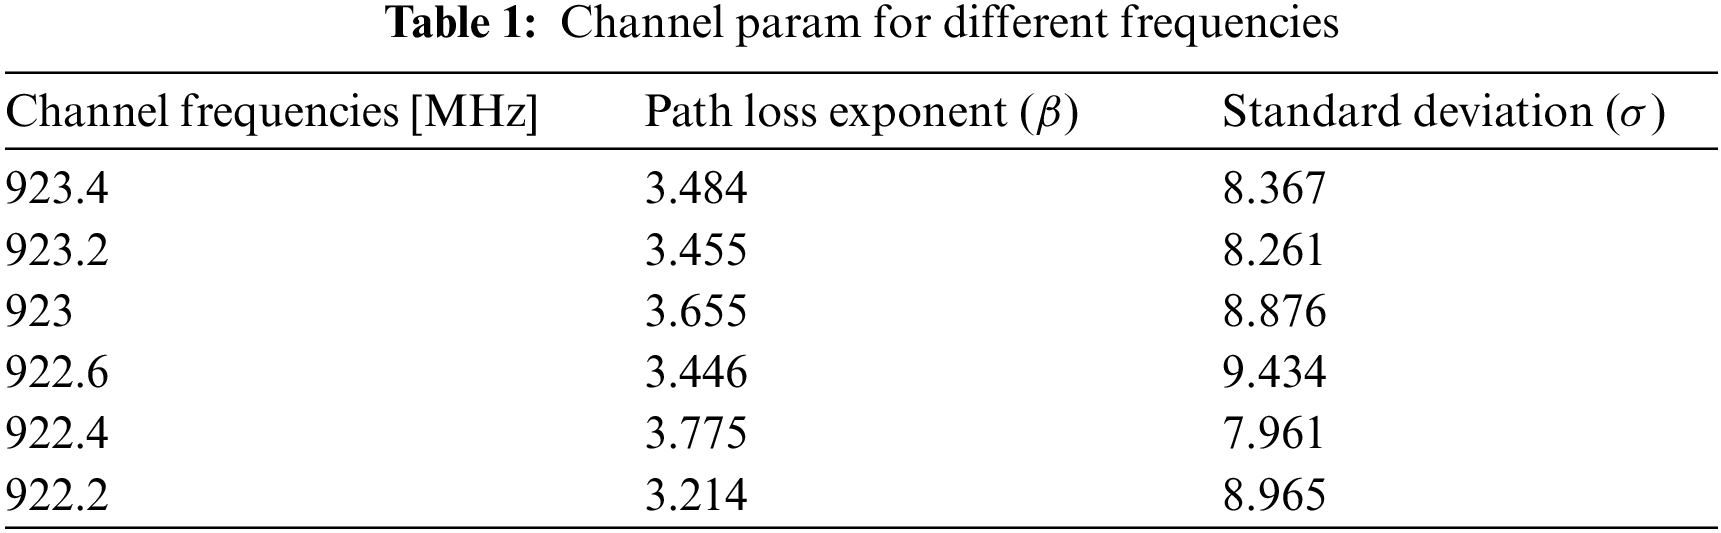
The path loss exponent and the standard deviation found by the above-discussed method for different channels using different frequencies can be found in Table 1. We have used the path loss exponents of every frequency in the localization algorithm to counter the frequency hopping effect on localization error. With β > 3 for all the different frequency channels, it can be observed that the campus environment is very harsh for the LoRa signals. It is important to note that the PLE for the free space is 2.
We started the ESP measurements with three gateways and 21 ESP readings at each location. The gateways were then increased by choosing the locations where the power and internet were available. For the multilateration algorithm, the number of gateways was increased to six. The ESPs received from all the gateways are then combined and averaged out so that the overall impact of gateway diversity can be observed in localization error.
Frequency hopping is the dynamic change in the frequency LoRa uses to send packets from transmitter to receiver. This change in frequency makes the ESP vary at a single location, thus impacting the localization. To counter this problem, we have used linear least squares regression to determine the path loss exponents of each frequency in the localization algorithm. This process is referred to as “filtered average using multiple PLEs” in the article.
The overall impact of outliers in the LoRa localization is studied in this research article. We first applied the raw ESPs to the localization algorithm, removed the outliers using Tukey’s method, and determined the overall impact on the distance error. The procedure to detect the outliers can be seen in Algorithm 1. The inputs to Algorithm 1 are the total number of locations and the two-dimensional array of raw ESPs. We first sorted the array of ESPs in ascending order, and then the medians, the interquartile range, and the upper and the lower quartiles are calculated in line 5 to line 11. The output of Algorithm 1 is filtered ESPs.
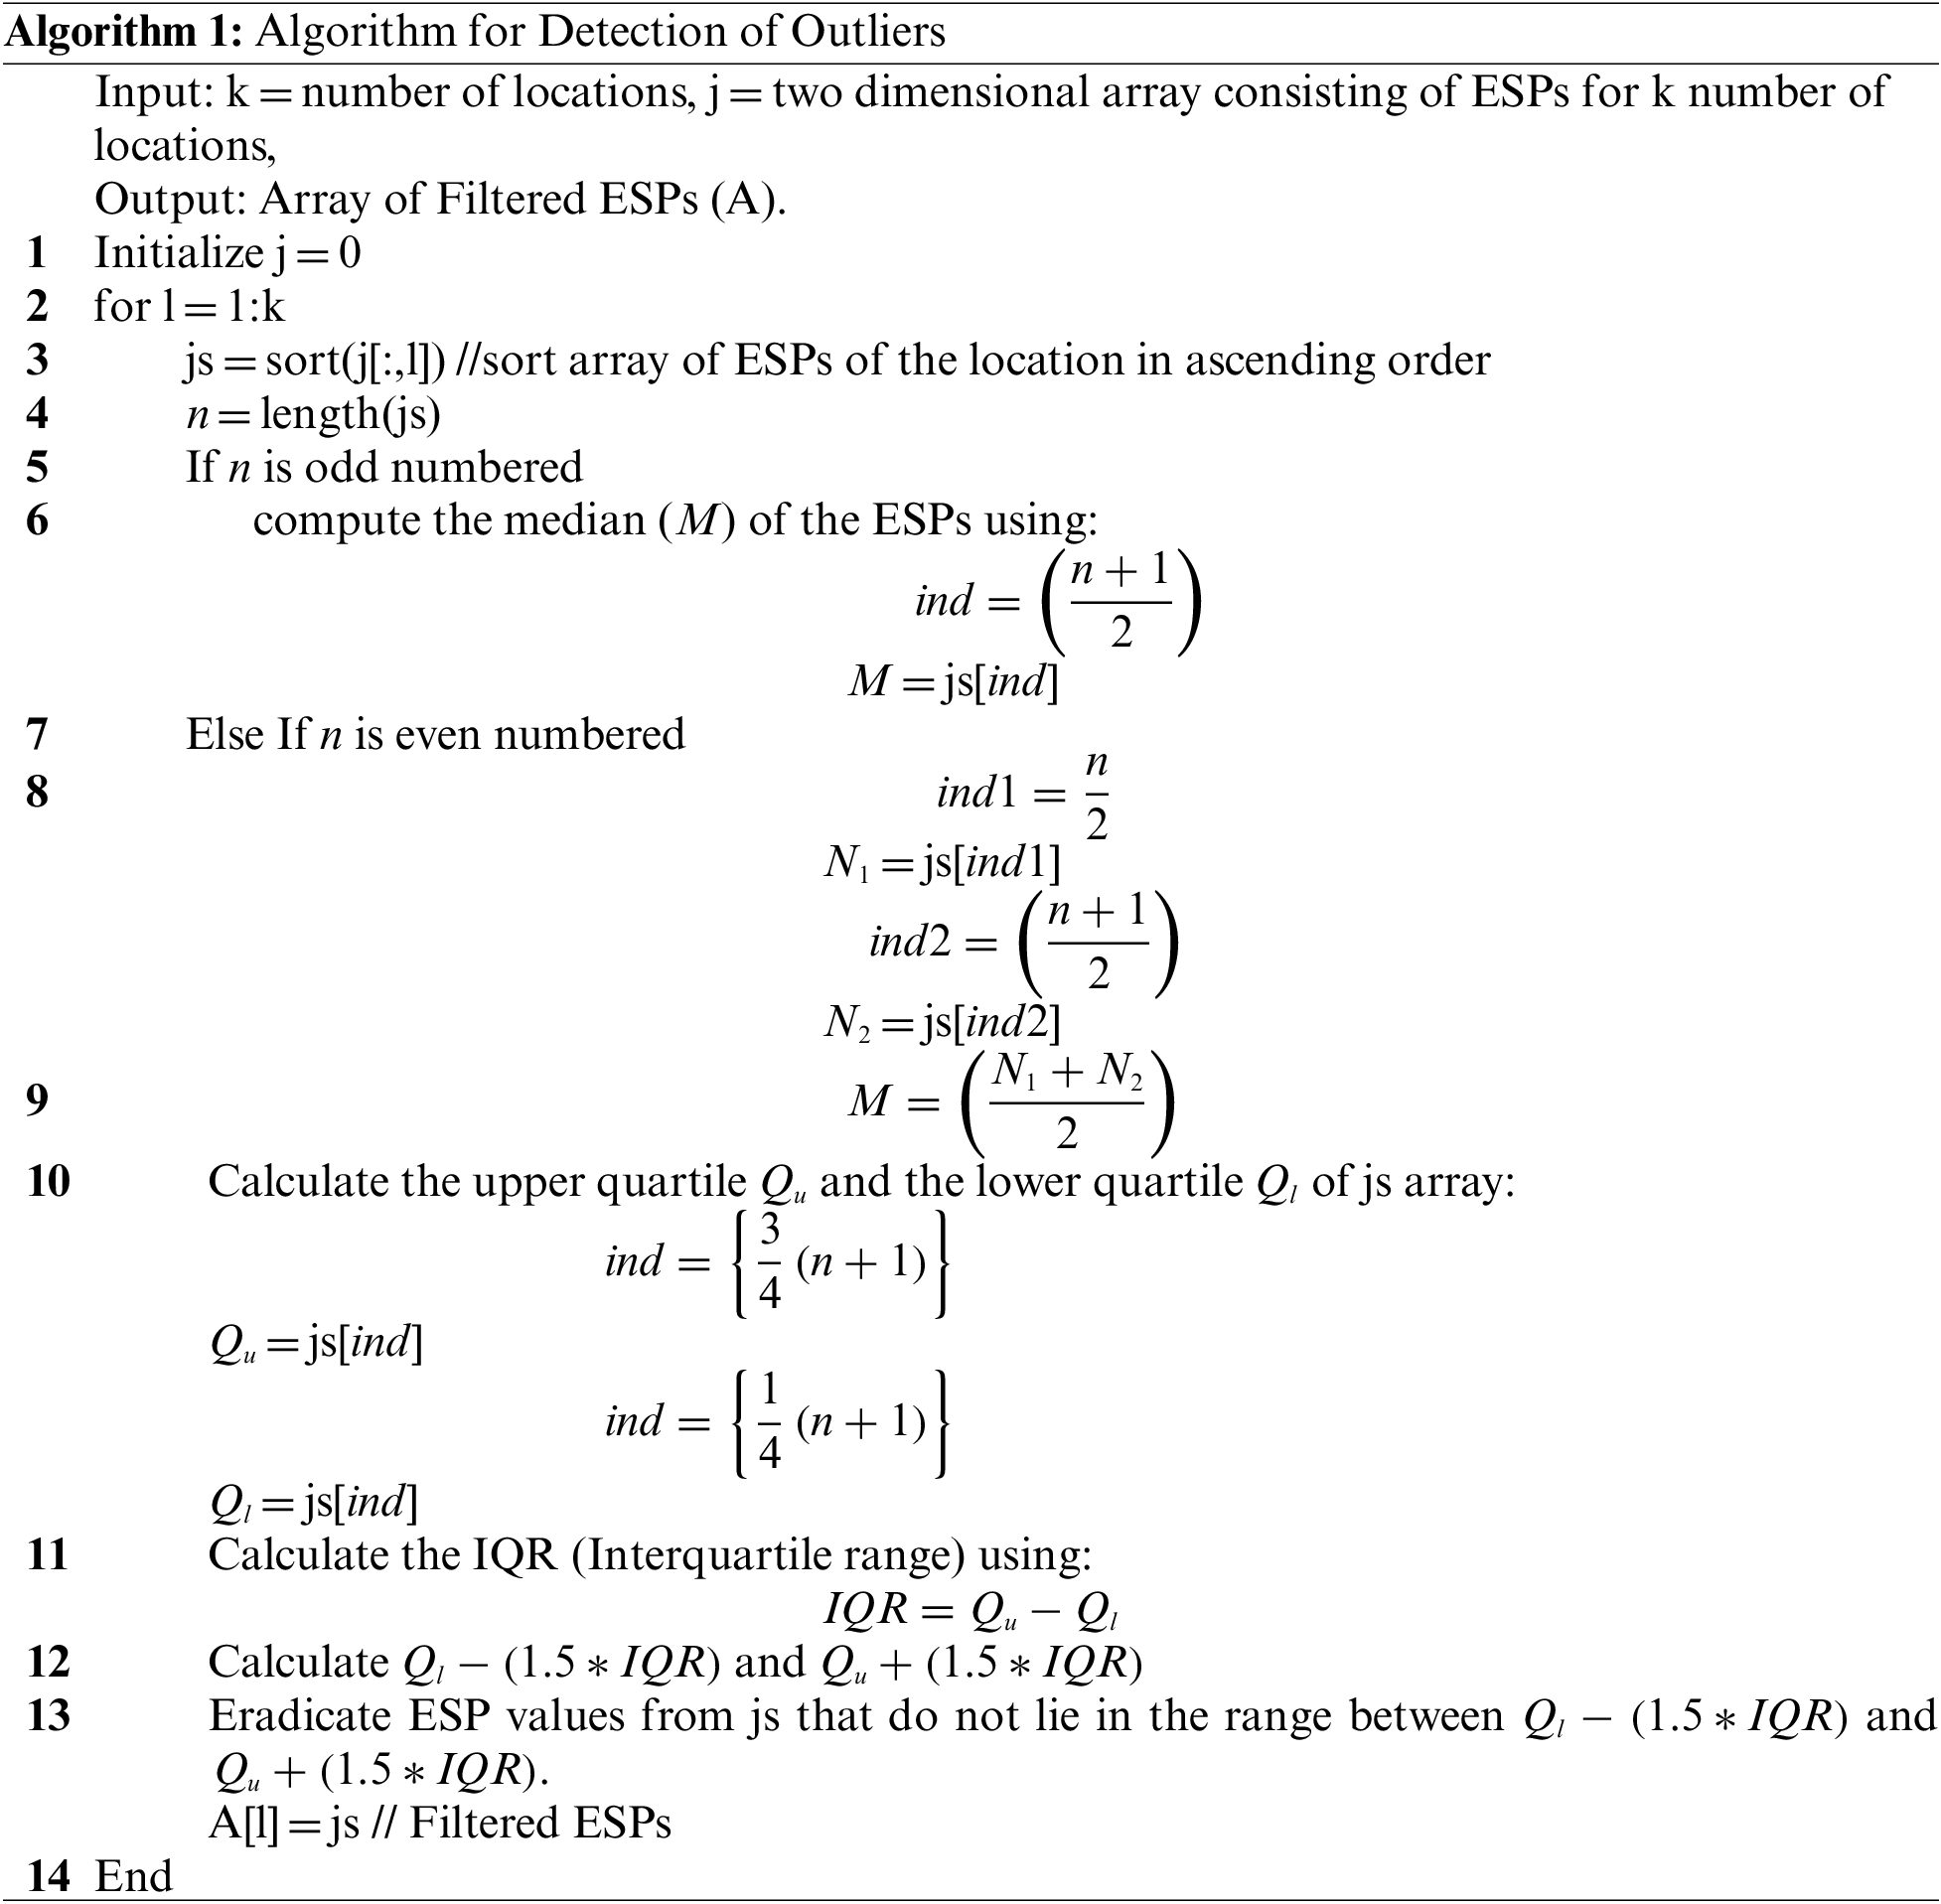
:
A localization algorithm has been designed for localization using ESPs in MATLAB. The trilateration is implemented in the localization algorithm to predict the location of the end node. The overall impact of frequency hopping, the importance of path loss exponent calculation of every frequency, the number of gateways, and the removal of outliers have been studied.
It is important to calculate the bearing or heading angle to determine the predicted location of the end node in the point coordinate system. The bearing is the angle between the north-south meridian and the line connecting the target and the reference point [45]. Eq. (9) is implemented to calculate the bearing angle.
The initial point, the distance, and the bearing angle are now known. The next step is to find the point coordinates (
where
This section provides an overview of the findings and a thorough analysis. In Subsection 4.1, the results are discussed, and the analysis is made in Subsection 4.2.
A total of 200 ground-truth locations have been randomly selected. At each location, 21 ESP values are taken. This gives a total of 4200 measurements of ESPs per gateway. After averaging the ESPs at each location, we get 200 values of ESPs. This localization algorithm is designed to work for at least three gateways and a maximum of six gateways. The illustration of the localization algorithm for six gateways can be seen in Fig. 6.
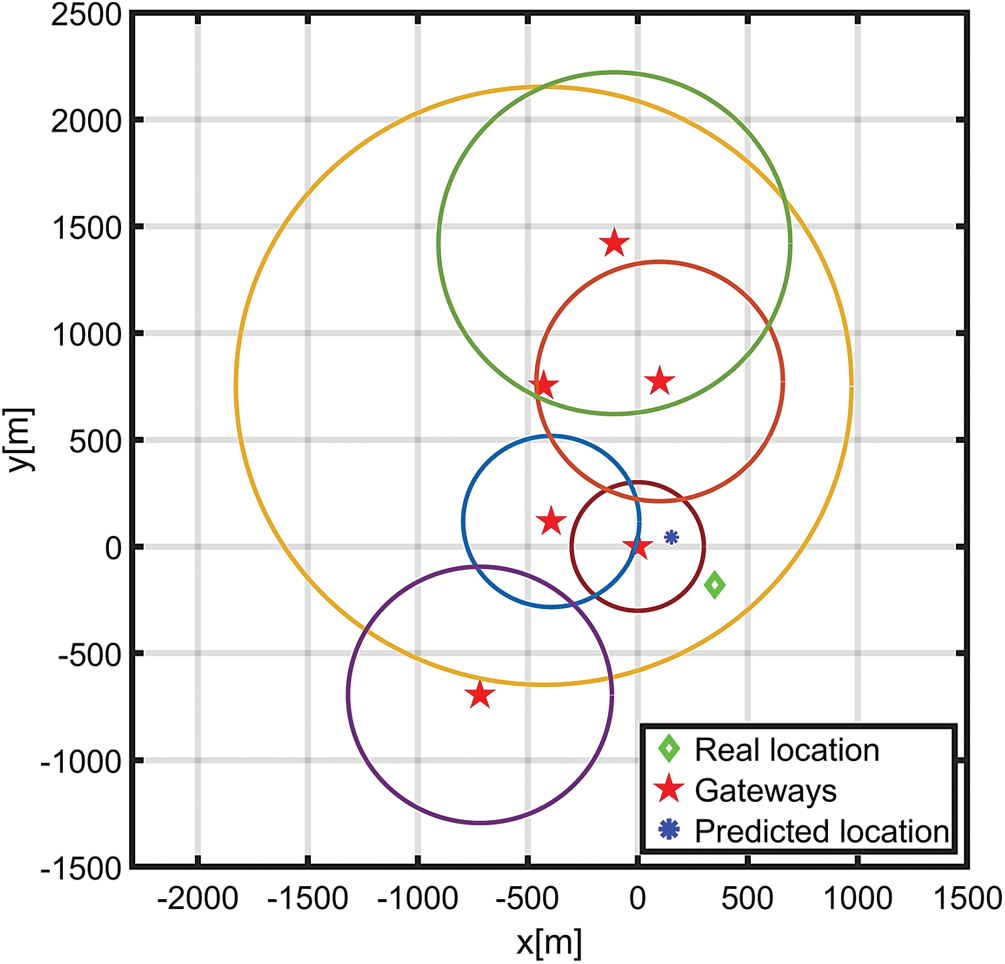
Figure 6: Illustration of localization algorithm using six gateways. The intersection of the circles represents the predicted location of the end node
The centers of the circles are the ground-truth location of the gateways. As seen in Fig. 6. the intersection of all the circles is the predicted location of the end node. The real location is the green marker. There is a distance error between the predicted and the real location. This error depends on many param, like reflection, refraction, scattering, shadowing effects, and interference. As the ESPs are highly susceptible to those param, we averaged the ESPs at each location to depict the true ESPs at every ground truth location. This averaging helps us to have consistency in our ESP readings.
The use of inappropriate ESPs referred to as outliers, impact the localization accuracy. The removal of outliers from the ESPs improves the localization accuracy. The box chart in Fig. 7. provides a visual representation of the data, the median, the upper and the lower quartiles, and the maximum and the minimum values that are not outliers. The outliers can be seen at varying distances. We have used the outlier’s detection and removal of outliers to remove the inappropriate ESPs. After removing outliers, the average of the appropriate ESPs is taken. We now have clean data that is free from outliers at every location. After removing outliers, we call this average of ESPs as filtered average ESP.
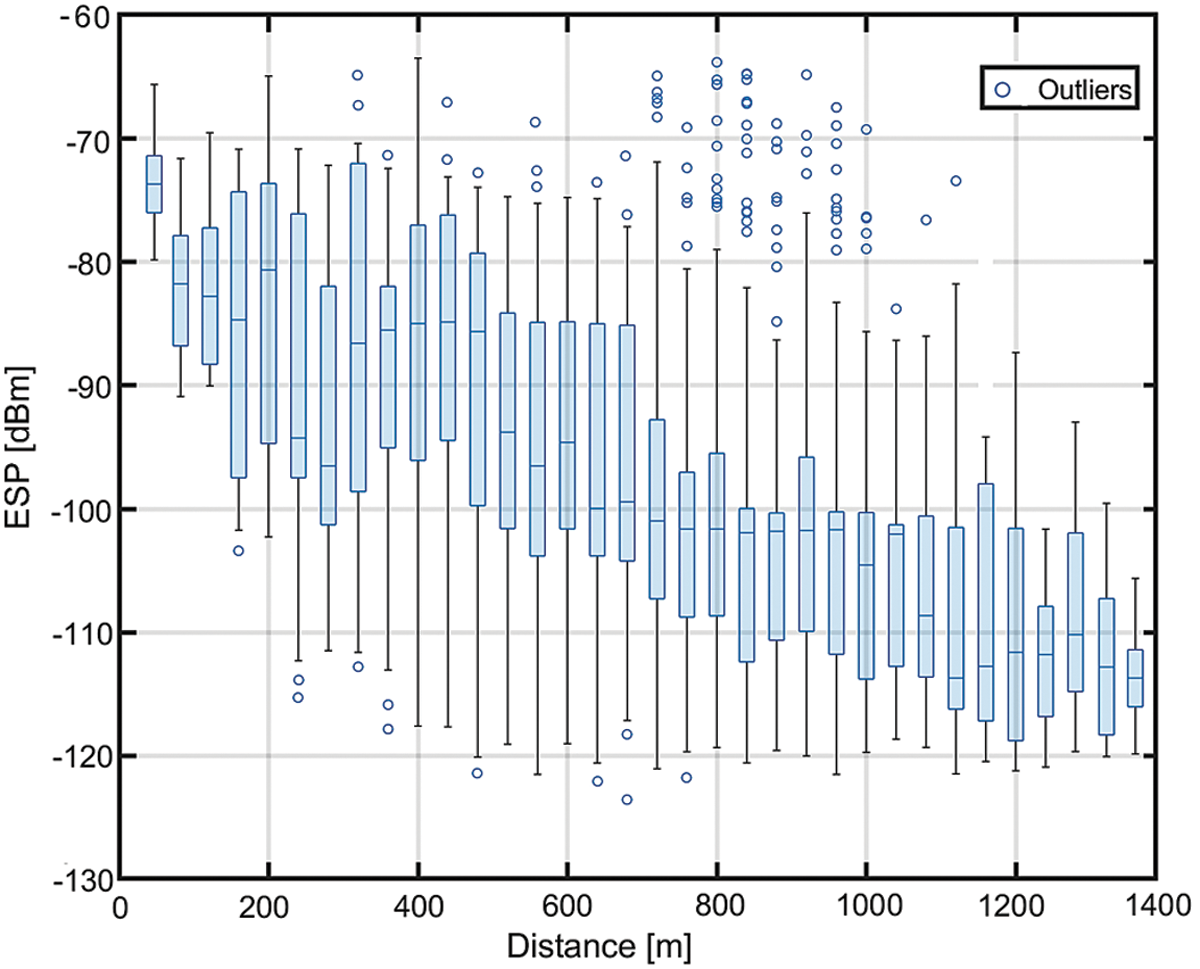
Figure 7: Determination of outliers at different locations
After filtering the data, Fig. 8. shows the cumulative distribution function (CDF) of localization errors. It can be observed that every frequency has different median errors that show the high variance in ESPs because of the frequency hopping. This frequency hopping is the feature of the LoRaWAN that highly impacts the localization performance. This change in average ESP (due to frequency hopping) values at the same location push the localization algorithm to predict different locations at different frequencies, which can be validated by seeing the CDF plot in Fig. 8. The proposed solution is to find the path loss exponents per frequency and use the model for each frequency used, thus circumventing this obstacle. It can be observed in Fig. 8. that the localization error gets close to the minimum if we use the proposed solution. This method achieves a mean error of 323.9 m, with 75% error less than 520 m using six gateways.
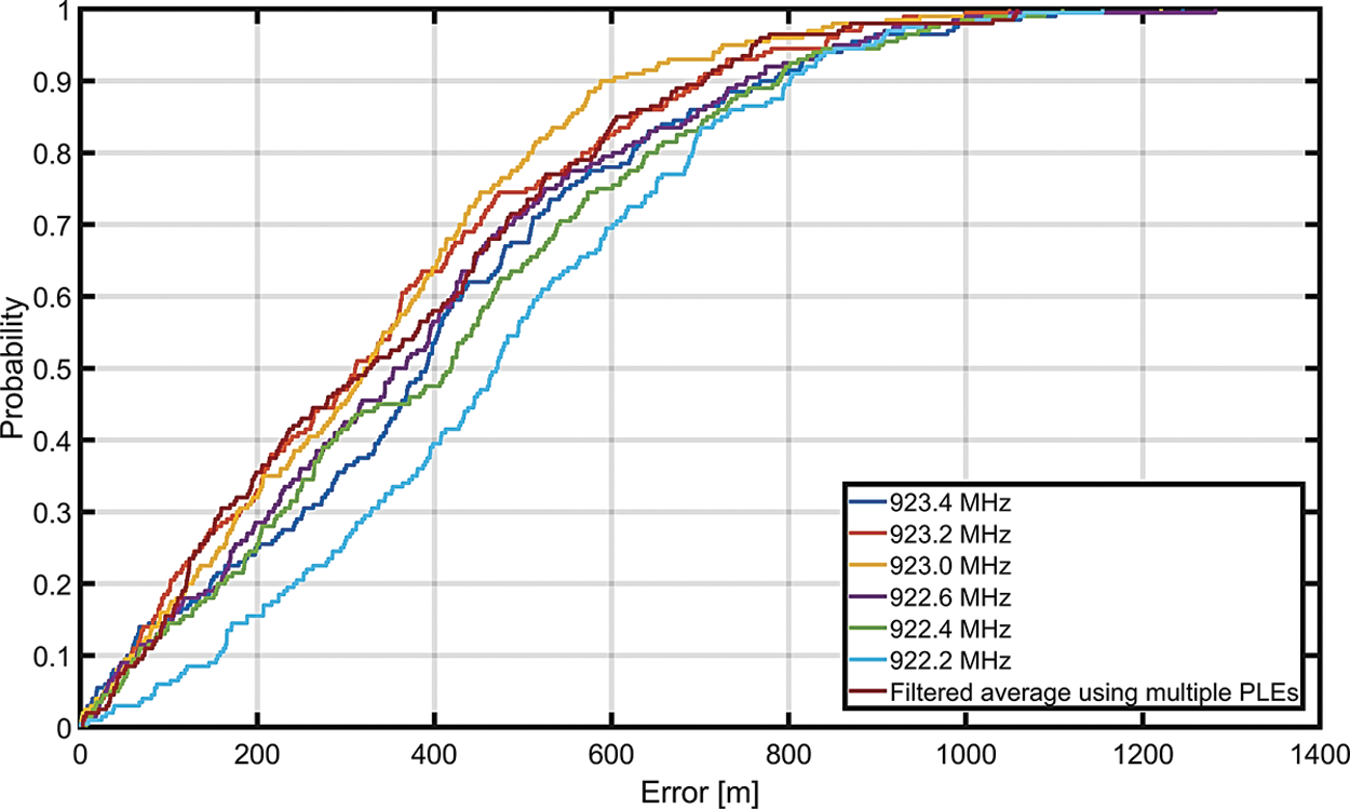
Figure 8: CDF plot of localization errors of individual frequencies along with the localization error of filtered average using multiple PLEs
We have also observed the results using the different number of gateways. We applied a minimum of three gateways and a maximum of six gateways. It is observed that the error using three gateways was the maximum and reduced to the minimum for six gateways. Fig. 9. shows us the CDF plot of localization errors using the different number of gateways. It can be seen in Fig. 9. that with three gateways, the error is the highest. The increase in the number of gateways to six decreases the error significantly. One important observation from Fig. 9. is that after four gateways, the improvement in localization accuracy is not that significant. Hence, using four gateways serve the purpose of equalizing the cost and localization accuracy.
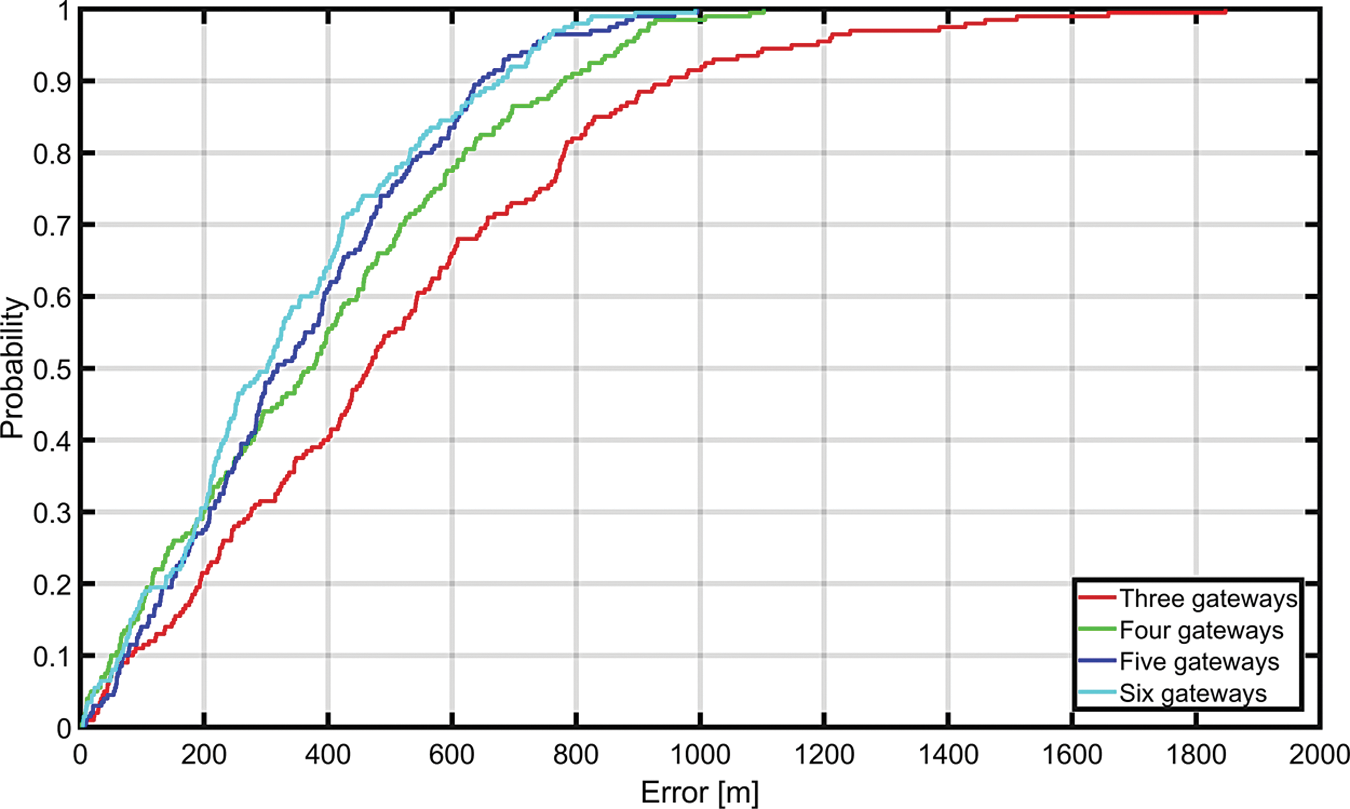
Figure 9: Impact of gateway diversity on localization errors
In Table 2, the average localization error can be seen for four cases. Raw average defines the average error using raw ESPs of all the frequencies, including the outliers. The filtered average is the average error of all frequencies excluding the outliers, the filtered average at a single frequency is the average error with a frequency having minimum error without outliers, and the last case is the proposed solution.
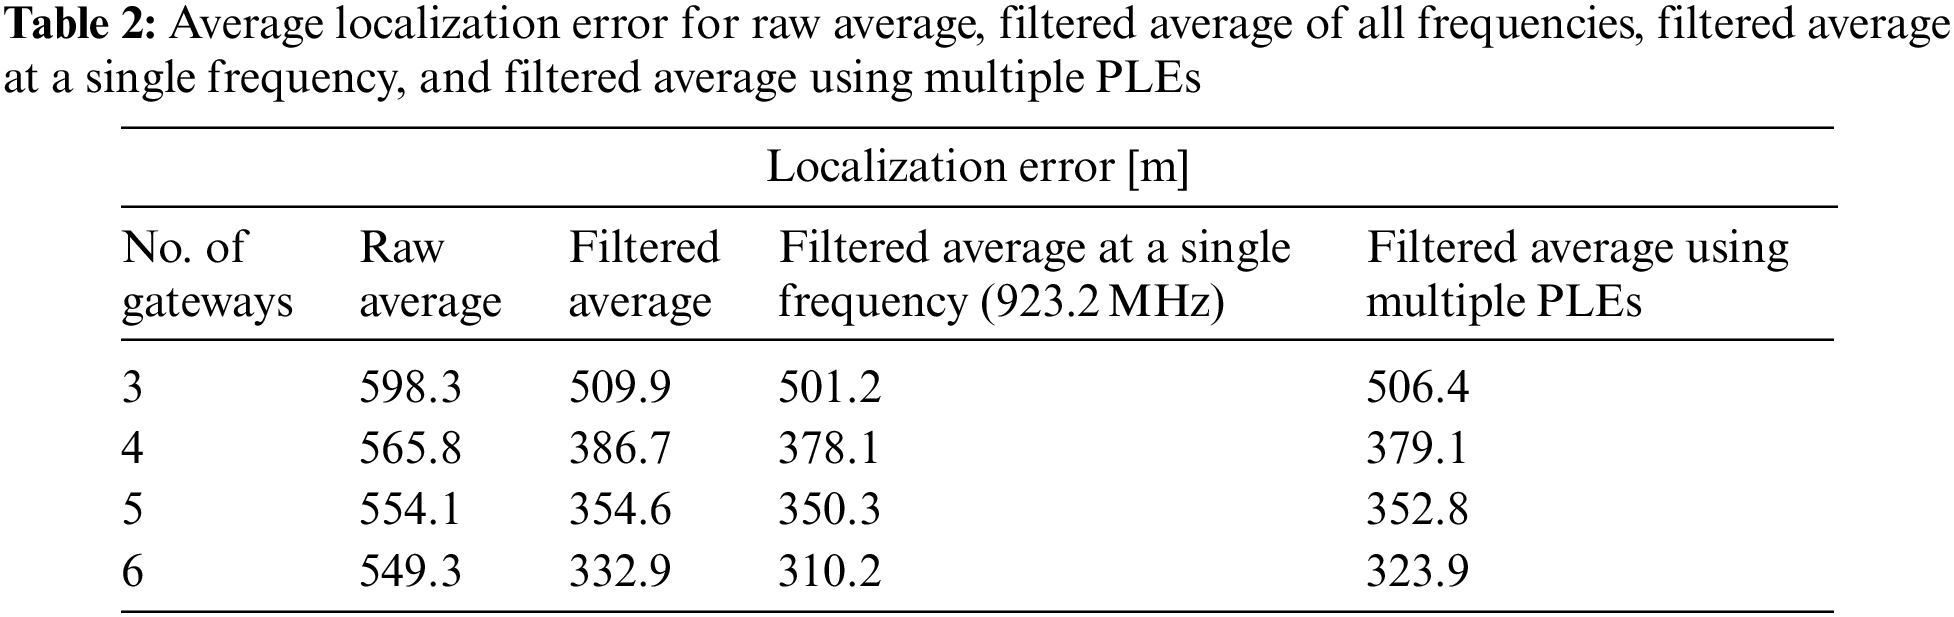
Fig. 10. shows the actual and the predicted ground truth locations. The locations have been predicted using six gateways and the filtered average of the ESPs using the proposed solution. The green marker shows the actual ground truth location of the end nodes. The blue markers depict the predicted locations.
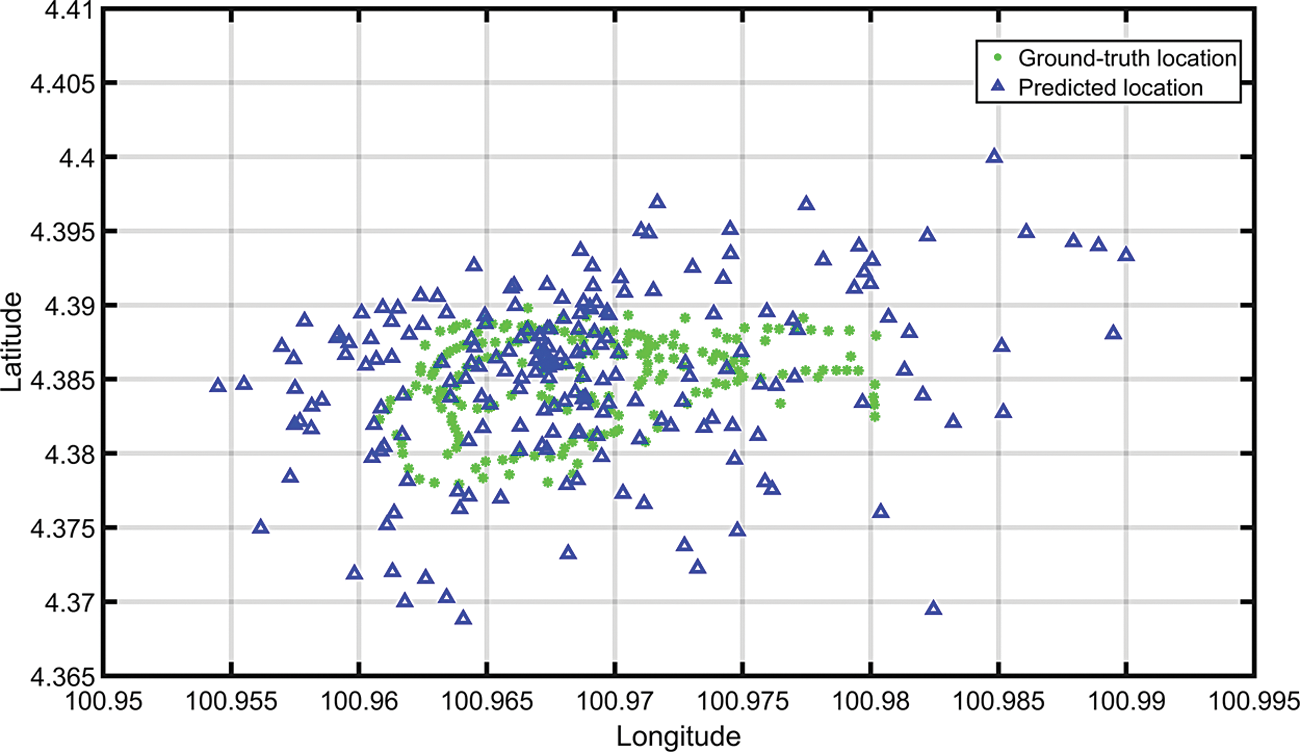
Figure 10: Actual locations of the end nodes vs. the predicted locations using six gateways and the filtered average ESP
We have observed from the results that the frequency hopping impacts negatively similar to [25] as the trilateration algorithm cannot cope with the frequency hopping. The estimated distance between the actual location of the end node and the predicted location keeps changing due to the variation in ESP. The solution to this problem can be to use a single frequency. But In LoRaWAN, end devices and gateways interact continuously to allow the data transmission to “hop” to other frequency channels that are more suitable for the speed, duty cycle, system’s power, and range constraints [33]. Therefore, only using a single frequency would not do any good but deteriorates the LoRaWAN function more. The proposed solution was to find the path loss exponents per frequency and use the model for every frequency, thus circumventing this obstacle. This solution proved effective and was close to the minimum error by a single frequency.
One key observation derived from the results is that the increase in gateways decreases the localization error. But with the increase in the number of gateways, the cost increases. So, there should be a balance between the cost and the accuracy. Similar to the results in [25], we observed that the improvement in localization accuracy is not that significant after four gateways. Therefore, using only four gateways serve the purpose of equalizing the cost and the localization accuracy.
The trilateration algorithm for localization using the proposed solution estimated the location of the end node with an average error of 323.9 m. This localization algorithm used only the values of ESP. The results, therefore, show that the seldom use of trilateration or the multilateration does not fully help in getting good results. Thus, implementing a machine learning algorithm with other metrics like ESP and timestamps might further improve these critical issues.
In this research article, we have experimentally evaluated the LoRaWAN localization on campus using the trilateration technique. The experimental results showed that removing outliers and increasing gateways have reduced the average position prediction to 332.9 m. Additionally, we observed that the frequency hopping has negatively impacted the localization accuracy. The average error decreased by 6.81% if we used the filtered average of ESPs at a single frequency. Results obtained from the experiment exhibit the importance of calculating the path loss exponent for every frequency to circumvent the high localization error caused due to the frequency hopping, thus enhancing the localization performance by 2.7% compared to the filtered average. The results indicated that only trilateration or multilateration does not fully help in getting good results. This research work can be further extended by using timestamps and machine learning algorithms to study the impact on localization accuracy.
Acknowledgement: The author of this research article acknowledges the financial support from the Universiti Teknologi PETRONAS under full-time PhD sponsorship for Graduate Assistantship (GA) program. We would also like to acknowledge the efforts and technical contributions made towards this study by college of Engineering, Al Ain University, UAE.
Funding Statement: This work was a part of research collaboration between the Institute of Transport Infrastructure, Universiti Teknologi PETRONAS and College of Engineering, Al Ain University, UAE. This research was funded by the ADEK Award for Research Excellence (AARE19-245) 2019.
Conflicts of Interest: The authors declare that they have no conflicts of interest to report regarding the present study.
References
1. B. Dil, S. Dulman and P. Havinga, “Range-based localization in mobile sensor networks,” in Lecture Notes in Computer Science (Including Subseries Lecture Notes in Artificial Intelligence and Lecture Notes in Bioinformatics), Springer, Berlin, Heidelberg, vol. 3868, pp. 164–179, 2006. [Google Scholar]
2. A. Zanella, “Best practice in RSS measurements and ranging,” IEEE Communications Surveys and Tutorials, vol. 18, no. 4, pp. 2662–2686, 2016. [Google Scholar]
3. T. He, C. Huang, B. M. Blum, J. A. Stankovic and T. Abdelzaher, “Range-free localization schemes for large scale sensor networks,” in Proc. MobiCom., San Diego, CA, USA, pp. 81–95, 2003. [Google Scholar]
4. S. G. Siddharth, G. M. Tamilselvan and C. Venkatesh, “Location prediction for improved human safety at complex environments,” Computers, Materials and Continua, vol. 71, no. 2, pp. 5219–5234, 2022. [Google Scholar]
5. Z. Zhong and T. He, “Achieving range-free localization beyond connectivity,” in Proc. SenSys., Berkeley, CA, USA, pp. 281–294, 2009. [Google Scholar]
6. Y. Shang, W. Ruml, Y. Zhang and M. P. J. Fromherz, “Localization from mere connectivity,” in Proc. MobiHoc., Annapolis, Maryland, USA, pp. 201–212, 2003. [Google Scholar]
7. N. Bulusu, J. Heidemann and D. Estrin, “GPS-less low-cost outdoor localization for very small devices,” IEEE Personal Communications, vol. 7, no. 5, pp. 28–34, 2000. [Google Scholar]
8. H. Sallouha, A. Chiumento and S. Pollin, “Localization in long-range ultra narrow band IoT networks using RSSI,” in Proc. ICC, Paris, France, pp. 1–6, 2017. [Google Scholar]
9. N. Podevijn, D. Plets, J. Trogh, L. Martens, P. Suanet et al., “TDoA-based outdoor positioning with tracking algorithm in a public LoRa network,” Wireless Communications and Mobile Computing, vol. 2018, pp. 1864209, 2018. [Google Scholar]
10. F. Carrino, A. Janka, O. Abou Khaled and E. Mugellini, “Loraloc: Machine learning-based fingerprinting for outdoor geolocation using LoRa,” in Proc. SDS, Lucerne, Switzerland, pp. 82–86, 2019. [Google Scholar]
11. R. Henriksson, “Indoor positioning in LoRaWAN networks,” M.S. Thesis, Chalmers University of Technology, Sweden, 2016. [Google Scholar]
12. J. Xiong and K. Jamieson, “Arraytrack: A fine-grained indoor location system,” in Proc. Nsdi., Lombard, IL, USA, pp. 71–84, 2013. [Google Scholar]
13. L. A. Martinez Hernandez, S. Perez Arteaga, G. Sanchez Perez, A. L. Sandoval Orozco and L. J. Garcia Villalba, “Outdoor location of mobile devices using trilateration algorithms for emergency services,” IEEE Access, vol. 7, pp. 52052–52059, 2019. [Google Scholar]
14. F. Bonafini, D. F. Carvalho, A. Depari, P. Ferrari, A. Flammini et al., “Evaluating indoor and outdoor localization services for LoRaWAN in smart city applications,” in Proc. MetroInd.4.0 & IoT, Naples, Italy, pp. 300–305, 2019. [Google Scholar]
15. N. Rogel, D. Raphaeli and O. Bialer, “Time of arrival and angle of arrival estimation algorithm in dense multipath,” IEEE Transactions on Signal Processing, vol. 69, pp. 5907–5919, 2021. [Google Scholar]
16. S. Bashir, O. A. Malik and D. T. C. Lai, “Accurate location estimation of smart dusts using machine learning,” Computers, Materials and Continua, vol. 71, no. 2, pp. 6165–6182, 2022. [Google Scholar]
17. J. J. Pérez-Solano, S. Ezpeleta and J. M. Claver, “Indoor localization using time difference of arrival with UWB signals and unsynchronized devices,” Ad. Hoc. Networks, vol. 99, pp. 102067, 2020. [Google Scholar]
18. V. N. Katsikis, S. D. Mourtas, P. S. Stanimirovic and Y. Zhang, “Solving complex-valued time-varying linear matrix equations via QR decomposition with applications to robotic motion tracking and on angle-of-arrival localization,” IEEE Transactions on Neural Networks and Learning Systems, vol. 33, no. 8, pp. 3415–3424, 2022. [Google Scholar]
19. C. L. Nguyen, O. Georgiou, G. Gradoni and M. di Renzo, “Wireless fingerprinting localization in smart environments using reconfigurable intelligent surfaces,” IEEE Access, vol. 9, pp. 135526–135541, 2021. [Google Scholar]
20. F. U. Khan, M. Awais, M. B. Rasheed, B. Masood and Y. Ghadi, “A comparison of wireless standards in IoT for indoor localization using LoPy,” IEEE Access, vol. 9, pp. 65925–65933, 2021. [Google Scholar]
21. F. U. Khan, A. N. Mian and M. T. Mushtaq, “Experimental testbed evaluation of cell level indoor localization algorithm using wi-fi and LoRa protocols,” Ad. Hoc. Networks, vol. 125, pp. 102732, 2022. [Google Scholar]
22. K. Kim, S. Li, M. Heydariaan, N. Smaoui, O. Gnawali et al., “Feasibility of LoRa for smart home indoor localization,” Applied Sciences (Switzerland), vol. 11, no. 1, pp. 415, 2021. [Google Scholar]
23. L. Sciullo, A. Trotta and M. di Felice, “Design and performance evaluation of a LoRa-based mobile emergency management system (LOCATE),” Ad. Hoc. Networks, vol. 96, pp. 101993, 2020. [Google Scholar]
24. G. M. Bianco, R. Giuliano, G. Marrocco, F. Mazzenga and A. Mejia-Aguilar, “LoRa system for search and rescue: Path-loss models and procedures in mountain scenarios,” IEEE Internet of Things Journal, vol. 8, no. 3, pp. 1985–1999, 2021. [Google Scholar]
25. H. Kwasme and S. Ekin, “RSSI-based localization using LoRAWAN technology,” IEEE Access, vol. 7, pp. 99856–99866, 2019. [Google Scholar]
26. A. Bansal, A. Gadre, V. Singh, A. Rowe, B. Iannucci et al., “OwLL: Accurate LoRa localization using the TV whitespaces,” in Proc. IPSN, Nashville, TN, USA, pp. 148–162, 2021. [Google Scholar]
27. A. Lazaro, M. Lazaro and R. Villarino, “Room-level localization system based on LoRa backscatters,” IEEE Access, vol. 9, pp. 16004–16018, 2021. [Google Scholar]
28. M. Anjum, M. A. Khan, S. A. Hassan, A. Mahmood, H. K. Qureshi et al., “RSSI fingerprinting-based localization using machine learning in LoRa networks,” IEEE Internet of Things Magazine, vol. 3, no. 4, pp. 53–59, 2021. [Google Scholar]
29. H. Abdullah Mengash, R. Marzouk, S. ben Haj Hassine, A. Mustafa Hilal, I. Yaseen et al., “Quantum artificial intelligence based node localization technique for wireless networks,” Computers, Materials & Continua, vol. 73, no. 1, pp. 327–342, 2022. [Google Scholar]
30. W. Ingabire, H. Larijani, R. M. Gibson and A. U. H. Qureshi, “Outdoor node localization using random neural networks for large-scale urban IoT LoRa networks,” Algorithms, vol. 14, no. 11, pp. 307, 2021. [Google Scholar]
31. E. H. Yoshitome, J. V. R. Cruz, M. E. P. Monteiro and J. L. Rebelatto, “LoRa-aided outdoor localization system: RSSI or TDoA?” Internet Technology Letters, vol. 5, no. 2, pp. e319, 2021. [Google Scholar]
32. Y. Lin, W. Dong, Y. Gao and T. Gu, “SateLoc: A virtual fingerprinting approach to outdoor LoRa localization using satellite images,” ACM Transactions on Sensor Networks, vol. 17, no. 4, pp. 1–28, 2021. [Google Scholar]
33. M. Ahmed Ouameur, M. Caza-Szoka and D. Massicotte, “Machine learning enabled tools and methods for indoor localization using low power wireless network,” Internet of Things, vol. 12, pp. 100300, 2020. [Google Scholar]
34. L. Wenliang, RHF2S008 Industrial LoRaWAN Gateway User Manual, Shenzhen, China: RuiXingHengFang Network Industrial LoRaWAN Gateway, 2018. [Online]. Available: https://fccid.io/2AJUZ-RHF2S008/User-Manual/User-manual-3935508. [Google Scholar]
35. E. Winarno, W. Hadikurniawati and R. N. Rosso, “Location based service for presence system using haversine method,” in Proc. ICITech., Salatiga, Indonesia, pp. 1–4, 2018. [Google Scholar]
36. Z. Yang, Z. Zhou and Y. Liu, “From RSSI to CSI: Indoor localization via channel response,” ACM Computing Surveys, vol. 46, no. 2, pp. 1–32, 2013. [Google Scholar]
37. P. Castro, P. Chiu, T. Kremenek and R. Muntz, “A probabilistic room location service for wireless networked environments,” in Lecture Notes in Computer Science (Including Subseries Lecture Notes in Artificial Intelligence and Lecture Notes in Bioinformatics), Springer, Berlin, Heidelberg, vol. 2201, pp. 18–34, 2001. [Google Scholar]
38. A. Haeberlen, A. Rudys, E. Flannery, D. S. Wallach, A. M. Ladd et al., “Practical robust localization over large-scale 802.11 wireless networks,” in Proc. MobiCom., Philadelphia, PA, USA, pp. 70–84, 2004. [Google Scholar]
39. P. Krishnan, A. S. Krishnakumar, W. H. Ju, C. Mallows and S. Ganu, “A system for LEASE: Location estimation assisted by stationary emitters for indoor RF wireless networks,” in Proc. IEEE INFOCOM, Hong Kong, China, 2004, vol. 2, pp. 1001–1011, 2004. [Google Scholar]
40. P. Kumar, L. Reddy and S. Varma, “Distance measurement and error estimation scheme for RSSI based localization in wireless sensor networks,” in Proc. WSCN, Allahabad, India, pp. 1–4, 2009. [Google Scholar]
41. G. Zanca, F. Zorzi, A. Zanella and M. Zorzi, “Experimental comparison of RSSI-based localization algorithms for indoor wireless sensor networks,” in Proc. REALWSN, Glasgow, Scotland, pp. 1–5, 2008. [Google Scholar]
42. A. Goldsmith, Wireless Communications, Cambridge, NY, USA: Cambridge University Press, 2005. [Online]. Available: https://books.google.com. [Google Scholar]
43. A. Rahmadhani, “Performance evaluation of LoRaWAN: From small-scale to large-scale networks,” M.Sc. Thesis, TU Delft University of Technology, The Netherlands, 2017. [Google Scholar]
44. P. Manzoni, C. T. Calafate, J. C. Cano and E. Hernández-Orallo, “Indoor vehicles geolocalization using LoRaWAN,” Future Internet, vol. 11, no. 6, pp. 124, 2019. [Google Scholar]
45. S. He, H. S. Shin and A. Tsourdos, “Trajectory optimization for target localization with bearing-only measurement,” IEEE Transactions on Robotics, vol. 35, no. 3, pp. 653–668, 2019. [Google Scholar]
Cite This Article
 Copyright © 2023 The Author(s). Published by Tech Science Press.
This work is licensed under a Creative Commons Attribution 4.0 International License , which permits unrestricted use, distribution, and reproduction in any medium, provided the original work is properly cited.
 Downloads
 Citation Tools