
 Submit a Paper
 Propose a Special lssue
 Open Access
ARTICLE

Multi-Objective Optimization of External Louvers in Buildings
1 Department of Industrial Engineering and Management, Ming Chi University of Technology, New Taipei City, 24301, Taiwan
2 Department of Architecture, Faculty of Engineering, Udayana University, Bali, 80361, Indonesia
3 Faculty of Engineering, Warmadewa University, Bali, Indonesia
4 Department of Civil Engineering, Faculty of Engineering, Kadiri University, Kediri, Indonesia
5 Electrical Engineering Department, Faculty of Engineering & Technology, Future University in Egypt, New Cairo, 11835, Egypt
* Corresponding Author: Elsayed M. Tag El Din. Email:
Computers, Materials & Continua 2023, 75(1), 1305-1316. https://doi.org/10.32604/cmc.2023.033274
Received 13 June 2022; Accepted 02 September 2022; Issue published 06 February 2023
 View Full Text
 Download PDF
Abstract
Because solar energy is among the renewable energies, it has traditionally been used to provide lighting in buildings. When solar energy is effectively utilized during the day, the environment is not only more comfortable for users, but it also utilizes energy more efficiently for both heating and cooling purposes. Because of this, increasing the building’s energy efficiency requires first controlling the amount of light that enters the space. Considering that the only parts of the building that come into direct contact with the sun are the windows, it is essential to make use of louvers in order to regulate the amount of sunlight that enters the building. Through the use of Ant Colony Optimization (ACO), the purpose of this study is to estimate the proportions and technical specifications of external louvers, as well as to propose a model for designing the southern openings of educational space in order to maximize energy efficiency and intelligent consumption, as well as to ensure that the appropriate amount of light is provided. According to the findings of this research, the design of external louvers is heavily influenced by a total of five distinct aspects: the number of louvers, the depth of the louvers, the angle of rotation of the louvers, the distance between the louvers and the window, and the reflection coefficient of the louvers. The results of the 2067 simulated case study show that the best reflection rates of the louvers are between 0 and 15 percent, and the most optimal distance between the louvers and the window is in the range of 0 to 18 centimeters. Additionally, the results show that the best distance between the louvers and the window is in the range of 0 to 18 centimeters.Keywords
Energy consumption is a challenge for global contemporary architecture in general, and for developing-country contemporary architecture in particular [1,2]. Modern attention to climate and its role in the architectural design process is associated with significant changes [3,4]. Today, outstanding architecture has been considered [5], which is the result of estimating and measuring a wide range of variables. The importance of paying attention to the position of daylight in intelligent energy consumption is growing [6]. It has become necessary due to rising energy demand, scarcity of fossil resources, pollution, global warming and the greenhouse effect, and the need to limit fossil fuel consumption and focus on renewable energy. Today, removing heat from lighting systems and lighting residential and commercial spaces both require significant amounts of energy. Using sunlight as a source of illumination has numerous advantages, both economically and environmentally.
Improving the comfort and convenience of interior space by optimizing natural light levels is now one of the most important issues in space reconstruction and improvement, particularly in office buildings [7]. With rising energy consumption, the need for multi-objective optimization and efforts to reduce consumption is growing, particularly in developing countries, prompting architects to excel in architecture and make the best use of renewable energy [8]. It not only provides a favorable environment for users, but it also reduces energy consumption for cooling and heating the environment [9]. Fluorescent lamps emit approximately 75 lm/W of light, whereas incandescent bulbs emit approximately 20 lm/W of light. As a result, when compared to equivalent electric lighting, daylighting generates only half to a fifth of the heat, significantly reducing the building′s cooling burden [10]. Lighting energy consumption can be reduced by up to 65 percent by utilizing active and passive systems that utilize natural light and electronic controls [11]. Because electric lighting can account for 25%–40% of a commercial building’s energy requirements, the combined savings from reduced lighting and cooling loads can be significant. As a result, controlling the amount of light entering the space is an important factor in improving energy efficiency in the building, and since the only part of the building that directly enters the sun is the window, the use of louvers to control the penetration is recommended. The passage of sunlight into space is critical [12]. The use of daylight in a wide range of Indonesian cities, including Jakarta, is noteworthy due to its convenient geographical location and having many sunny hours throughout the year [13]. The effects of the reflection coefficient of skylights were investigated using computer simulation with radiance, and the light coefficients in nearby spaces were reported in the form of formulas with varying reflection coefficients.
In this study, Ant Colony Optimization (ACO) and algorithmic programming will be utilized in order to make an estimate of the dimensions and technical specifications of external louvers, as well as to propose a model for designing the southern openings of educational space in order to maximize energy efficiency and consumption, as well as to provide the necessary light level for indoor space. In order to attain this purpose, there are three crucial actions that must first be taken: first, the background of the subject must be evaluated; second, effective parameters must be retrieved; and third, these parameters must be simulated and optimized.
In this research, the ACO algorithm was designed. The problem is defined and structured in the form of a graph in the first step, and the amount of initial pheromone that must be placed on each graph in order to start the algorithm is evaluated in the second step. Ants defined the mechanism of graph navigation in the third step, which is known as path selection [14]. The suitability of the ants’ paths was evaluated in the fourth step, and the pheromones of all the ants’ pathways were updated based on their competence. Finally, the convergence condition was added to bring the algorithm to a halt.
2.1 Structuring Solutions in Graphs
The multi-objective optimization method was created using the approach of archives to the dominant solutions, while taking into account the fundamental structure of the ants optimization algorithms. The main solution in this technique is to assign an ant society to each of the goals of an optimization problem. What matters is how the communities relate to the aforementioned goals. At each computing step in the current method, all of the solutions developed in one society are transferred to the opposite community, where the ants of that community attempt to improve the answers based on their criteria. The first step in using the ACO metaheuristic algorithm to solve problems is to graph the existing solutions. Each column in the graph represents a cube block. In fact, a node that the ant must pass through [15,16]. As previously stated, our goal is to reverse the density model’s achievement at various depths. According to the graph generated by this algorithm, the ants construct a variety of models by traversing each cube block and assigning a value as a density difference to that cube. He finally selects the best model as the final answer after examining each of the models in each iteration.
To begin the algorithm, consider the pheromone value as the initial value () on each node of the graph. To increase the level of exploratory search at the start of the algorithm, the path's initial pheromones are assumed to be superimposed. As a result, the initial search phase will be very exploratory, preventing the algorithm from achieving early or local convergence, because, despite the high pheromone, the algorithm will have enough time to search for a wider area of probability space.
2.3 Select the Path and Navigate the Graph
To decide on the different density values for each cube block, a relation that not only works on the basis of probability but also has random choices must be designed. Four relations were created for this purpose based on the intended purpose [17]. Using this relationship, the ants can decide which node to go to next based on probability or chance.
2.4 Fit Calculation (Value Function)
The fit function is obtained by applying an appropriate conversion to the target function, which is the function to be optimized. This function assigns a numerical value to each ant solution to determine its quality. The higher the quality of the answer, the more suitable it is, and the more likely its nodes will participate in the paths made by the ants in subsequent repetitions. Greater fit will be synonymous with maximization or minimization of the objective function, depending on whether the problem is maximization or minimization. Because determining the density of each cube block follows the maximization of the function, the minimization problems must be converted to maximization. That is, the maximum pheromone (maximum fit) attributed to the nodes present (density of each block) in the matrix structure should be the minimum sum of the absolute magnitude of errors (sum of the absolute magnitude of the anomalous difference calculated from the measured anomaly) at all observation stations on the ground be pertinent Finally, the fitness function used in this study was designed using Eq. (2) by performing various tests and examining the relationship between the sum of the absolute magnitude of errors and the amount of pheromones attributed to the nodes [19].
In the above relation, N indicates the number of observation stations and
Evaporation of pheromones in this algorithm, in proportion to the pheromone on each node, is done from all nodes, Eq. (3):
In the above relation,
After the pheromone evaporates from all nodes, it is time to update the pheromone in the nodes surveyed by the ants.
In the above relation
Very different modes can be considered for the algorithm’s convergence condition in meta-heuristic algorithms, and this condition varies depending on the problem conditions. Again, the algorithm’s convergence condition is such that, in each iteration, if 60% of the ants follow a single path, and we do not have the result of improvements over previous iterations, the path chosen by at least 1% of the ants is accepted as a convergence path. As a result, the algorithm will continue until this condition is met, and it will stop as soon as this condition is met. Fig. 1 depicts the algorithm's implementation process [23].
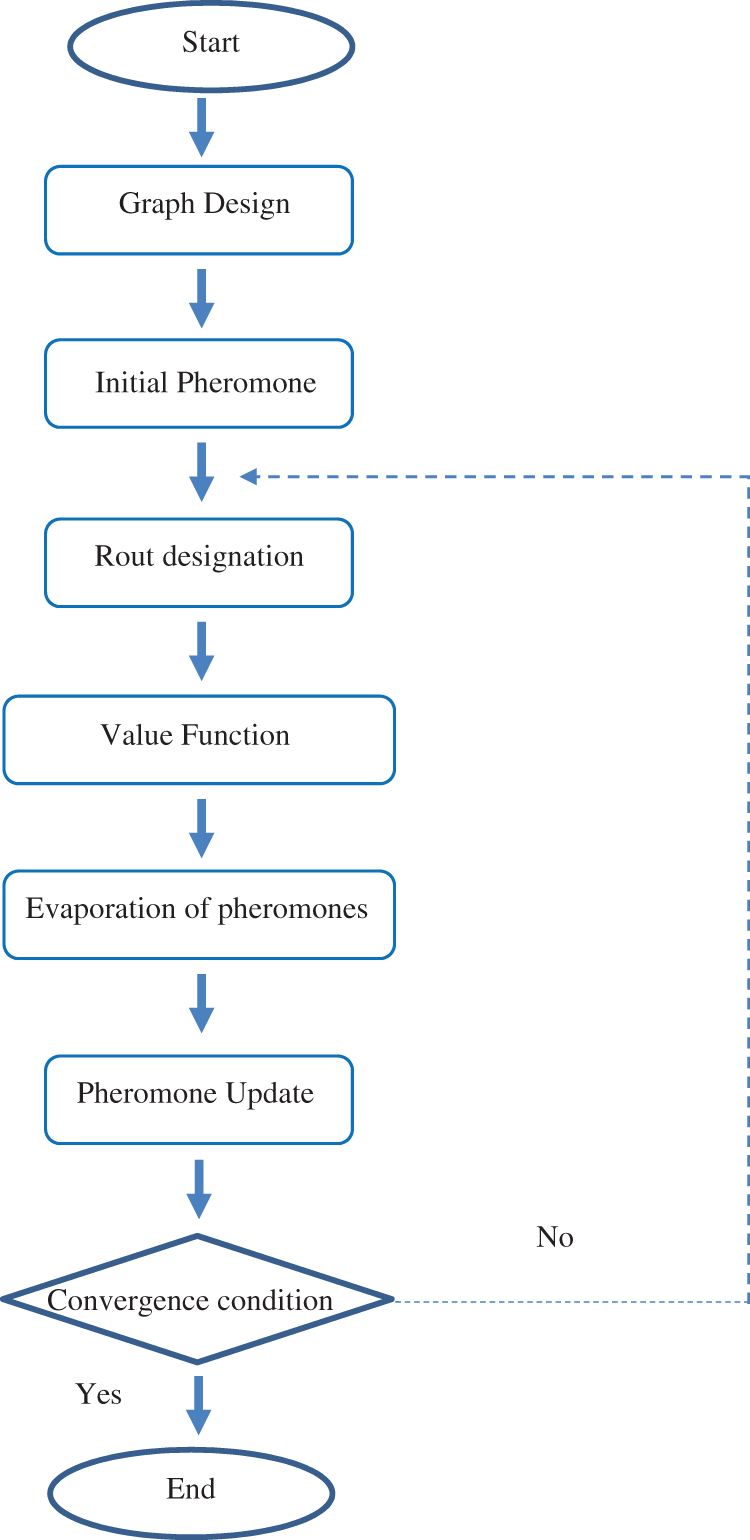
Figure 1: AOC designed for inverse modeling
2.8 Simulated Space Specifications
All simulations are run for all days of the year and from 8:00 AM to 1:00 PM for various states of variables in a specific period. Simulations that produce the desired outcome are examined. It should be noted that the amount of light in the simulations is also measured at a height of 85 cm (the height of the study surface in class) and under Jakarta, Indonesian climatic conditions.
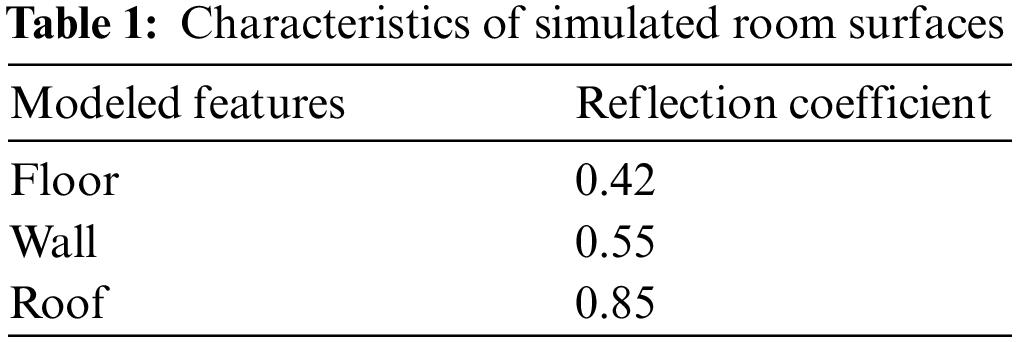
For Revit simulation, use a class with dimensions of 800 cm × 600 cm and a height of 300 cm, as well as windows with dimensions of 160 cm × 160 cm (35% of the wall area) that are 85 cm from the floor on the south wall (Fig. 2). The window’s dimensions to the external wall have been estimated to be 30% to 40%. In this case, the window can minimize energy exchange while still providing adequate lighting. As a result, the window area accounts for 35% of the wall area. The interior walls and ceiling were simulated with materials that were very white in wall texture, and the space floor was made of materials that were close to ceramic and white. The reflection coefficient of this room's interior surfaces is as follows: (Table 1).
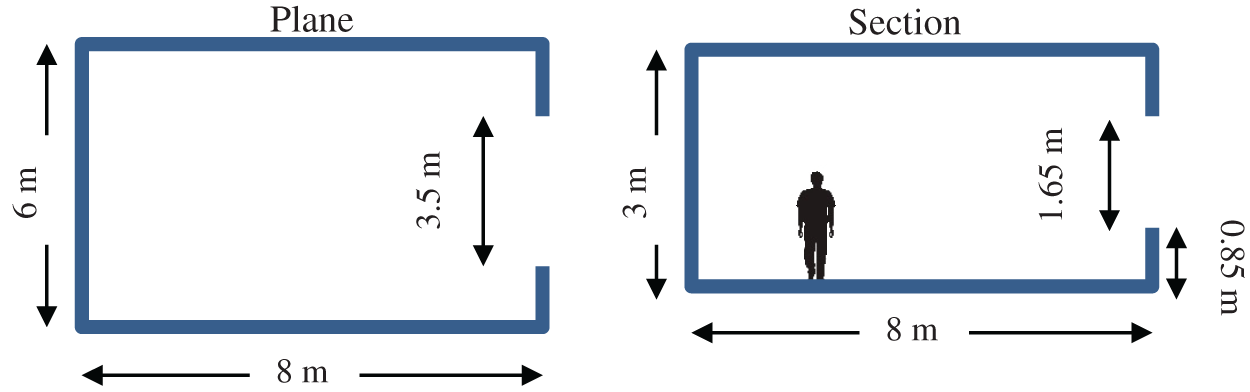
Figure 2: Characteristics of the simulated space in plane and section of room
Jakarta weather information is available on the website of the Office of Energy Efficiency and Renewable Energy, which has been used for simulation. The location of the shutters in the external state and the amount of light required in the spaces with different uses, the amount of light in the space is 350–550 lux. It should be noted that the type of shutter adjustment is based on climate. In this study, the climate of Jakarta with a longitude of 106.8 and a latitude of −6.2 is examined. Since the working hours in Jakarta class are from 8:00 AM–01:00 PM, in the simulation, the same time range is considered for working hours. Therefore, in the ACO algorithms, the objective function (brightness) is considered according to the educational space use of 350–550 lux space in the horizontal level 85 cm above the floor level (studding level). This surface is divided into 30 by 30 cm squares. The goal is to find the optimal amount of variables for the design of louvers that have a brightness level of 350–500 lux in 65% of the time of desk and work surface productivity.
2.9 Specifications of the Simulated Louvre System
The angle of rotation, number, depth, distance of the louvers from the window, and reflection of the louvers were extracted after testing the sensitivity of the parameters. These five parameters comprise a design algorithm in which the shape of the Louvre changes as the parameters are changed. The following parameters and the range of their changes are defined (Fig. 3):
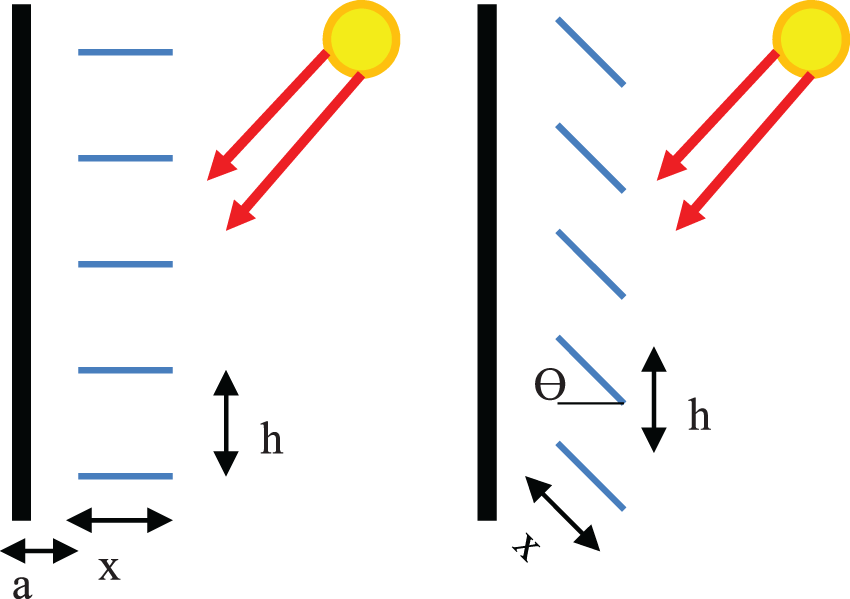
Figure 3: Effective parameters in the design of louvers
The distance of the louvers from the glass surface (a), which in this study varies between 0–40 cm with distances of 15 cm. Depth of louvers (x) which in this study is defined according to the degree of overlap of louvers between 15–45 cm with distances of 15 cm. The angle of rotation of the louvers (ϴ) varies between 0–90 degrees with distances of 10 degrees. The number of louvers (n) in this study is defined between 2 to 10 according to the dimensions of the window, which also determines the distance between the louvers (h). The reflection of the Louvres (R) varies in the range between 0%–100%.
The origin of AOC algorithm is inspired by the effect that ants have on movement. Pass. Many species of ants leave a substance called a pheromone on the ground in their path of motion, creating an effect that is used to mark the path taken. This effect is their communication tool, and in fact, by sensing the effects of the pheromone, other food-seeking ants can find their way to the food source that others have discovered [24].
The ability of ants to adapt to changes in their environment is an important aspect of ant colony life. For instance, when the shortest path is blocked by an obstacle. They can no longer track the pheromone’s effect. As a result, some ants choose to turn right while others choose to turn left at random. Ants that take the shorter path at random amplify the previous pheromone faster than ants that take the longer path. As a result, more ants choose the shorter path with more pheromones. Most ants quickly choose a new shorter path as a result of this positive feedback [25,26].
The optimization problems in the ACO algorithm are organized as a graph with vertices and edges. In this graph, problem states are the sum of all possible ants to navigate. In the ACO algorithm, each possible solution is represented as a graph with edges and nodes. The amount of pheromones attributed to a node determines how many times it is selected by ants. The amount of pheromones on each node is proportional to the degree of competence of that node, and thus the number of times it is selected by ants is determined. Furthermore, the pheromone from each node evaporates from all nodes [27,28].
The window without the Louvre is tested first as a base, and then the various dimensions and angles of the Louvre are examined in various conditions. At this stage, the simulation space is tested and simulated as a base mode without the Louvre light control system, and the brightness of the space at the working level (85 cm above the ground) is determined during the summer revolution, winter solstice, and equinox.
It is demonstrated by Fig. 4 that an excessive amount of light enters the room, which, in addition to producing glare, also causes the room’s temperature to rise, while certain areas of the room do not receive an adequate amount of light. This pattern was modeled for all four seasons, and each simulation showed the same effect in terms of the light quality in space (glare and a lack of light in certain areas of the space). After that, the solution of putting louvers was incorporated into the simulation, and its many configurations were examined for their effectiveness. As a result, the test area was replicated in the Revite environment at the beginning without taking into account the Louvre system as the starting point. After that, the simulation volume is loaded so that the parametric louvers can be designed and the parameters that are defined in the Grasshopper plugin may be determined. For each of the variables, a particular interval has been created; this period shifts depending on the Louvres′ shape and the amount of effect they have. The Galapagos plugin is introduced to the algorithm so that evolutionary calculations may be used to find the most effective ways for variables to interact with one another. This allows the variables that have been defined to be optimized. The simulation and optimization procedure is depicted in a concise manner in Fig. 5. With the assistance of parametric simulation of daylight and optimization of effective parameters utilizing ACO algorithm, the goals of this study were to optimize the daylight control system (Louvre) and to determine the design requirements of this type of system. Both of these goals were to be accomplished with the help of this study. As a result, numerous distinct parameters are altered all at once, and the outcomes are utilized. The ultimate goal of enhancing the performance of this kind of system is to reduce energy consumption while simultaneously maximizing the amount of natural light that is let in.
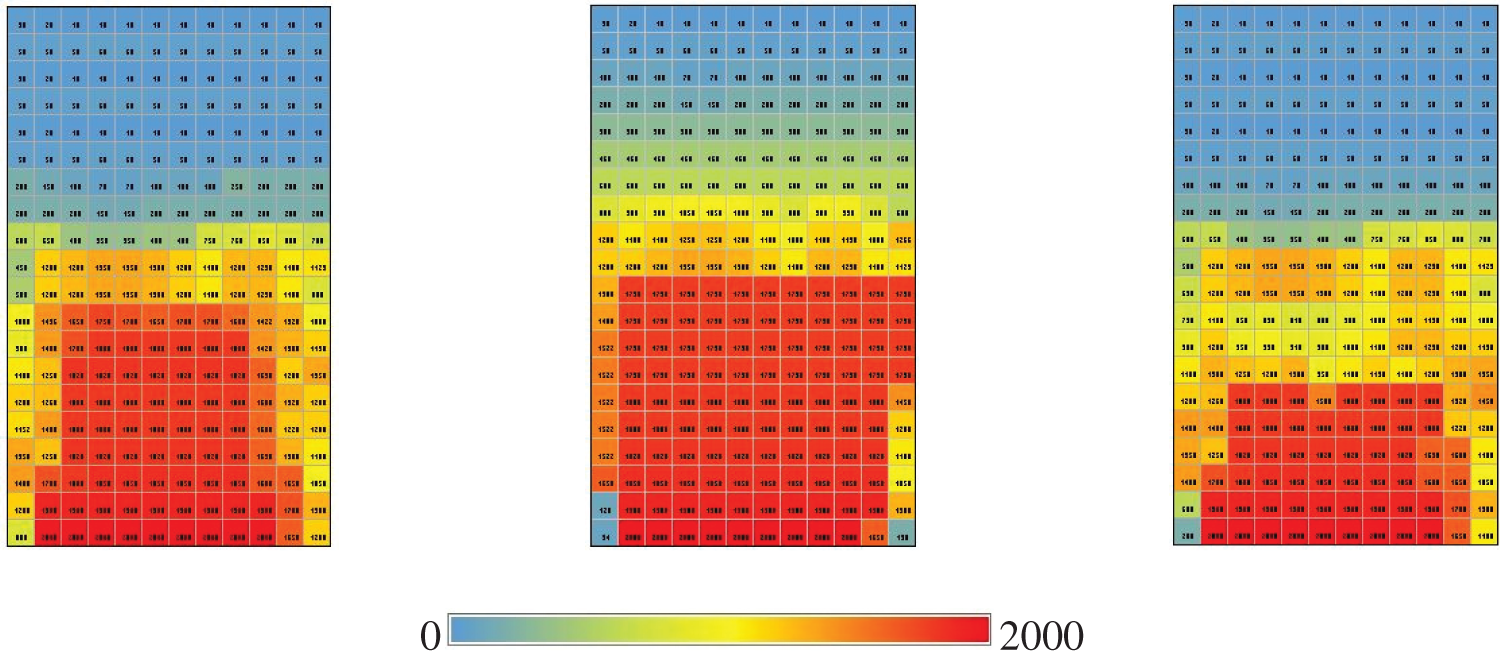
Figure 4: The average brightness of the simulated sample across each of the four seasons
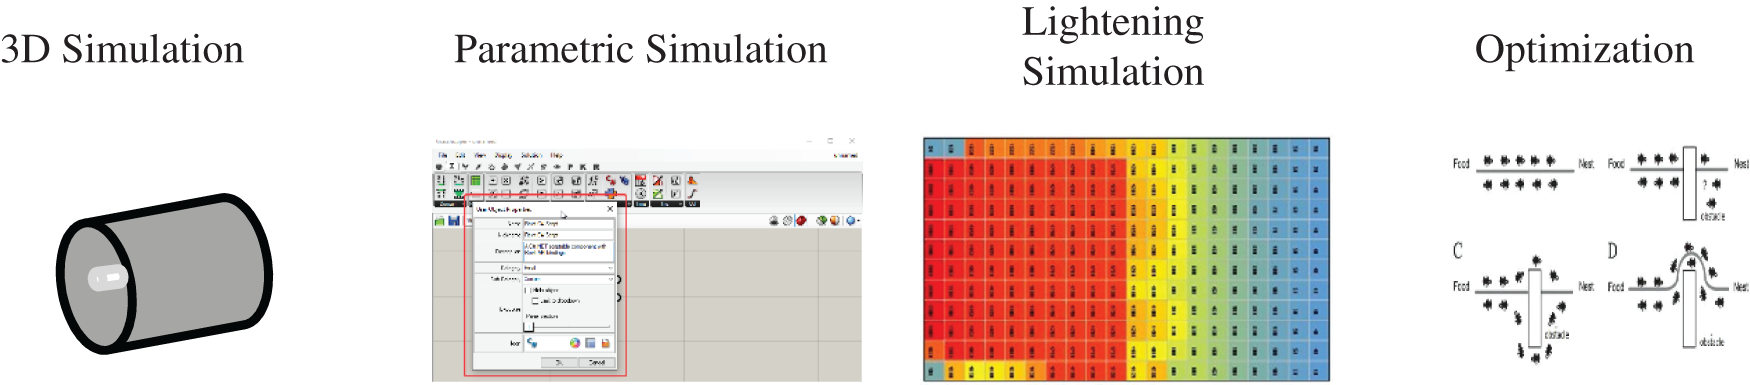
Figure 5: The processes while highlighting a variety of simulation and optimization tools explaination
Although the number of variables and the large number of cases make it impossible to study all compounds in a multivariate function, metric simulation allows the study of daylight performance by changing the parameters. In this study, complex geometry models T and L with different densities were used to further evaluate the efficiency of the ACO algorithm designed for inverse linear modeling. 0 (ACO algorithm regulatory parameters), q0 (ACO algorithm regulatory parameters), and are 0.5, 0.6, and 0.08, respectively. According to the use of the simulated space, the intervals between 350 to 550 have been selected as optimal conditions, in order to achieve the most optimal states, the intervals between 360–440, including 50 modes, were selected as optimal conditions (Fig. 6).
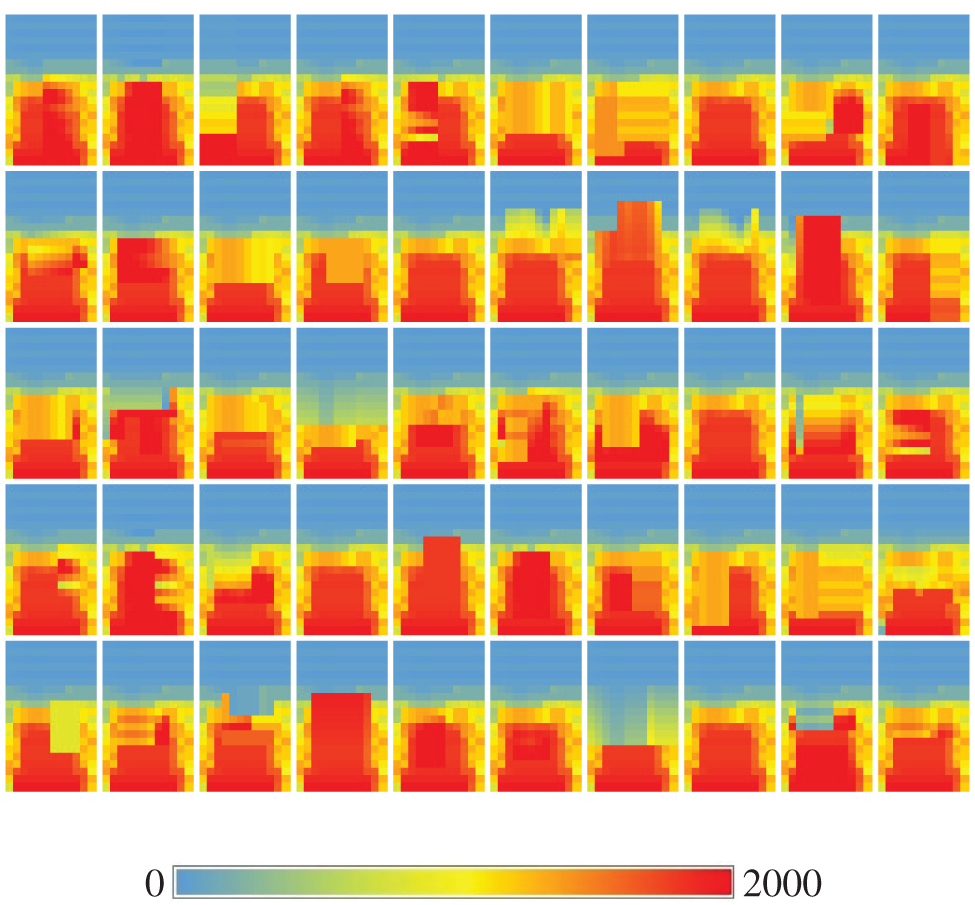
Figure 6: The results of applying the brightness optimization to the simulated sample
The distance of the louvers from the glass surface (a) in the simulation performed in the intervals between 0–50 cm with distances of 10 cm has changed. Among the 53 final optimal samples, the distance of the louvers from the window was 0 in 38.8% of cases and 10 cm in 38.4% and 20 cm in 25.5% of the samples. In none of the desirable cases, a distance of 40 and 50 cm has been recorded. Depth of louvers (x) which in this study is defined according to the degree of overlap of louvers between 10–50 cm with distances of 10 cm. Among the 53 optimal final samples, in 37.9% of the cases, the depth of the louvers was 2.13 in, 30 cm in 1.30 in, 20 cm in 10 cm, in 13.3% in 40 cm and 11.9% in 50 cm have been registered. The angle of rotation of the Louvres (ϴ) in the simulation varied between 0–90 degrees with distances of 15 degrees. Cases of 60 degrees were recorded in 14.6% of 45 degrees, in 16.1% of 30 degrees and in 12.2% of cases of 15 degrees; other angles were repeated in less than 10 samples. The number of louvers (n) is defined between 2 and 10 according to the dimensions of the window. The results of the analysis of 53 simulated favorable conditions show that in 20.7% of cases the number of Louvres is 4, in 17.9% of cases 5, in 11.2% of cases 6, in 14.2% of cases 3 and other items are small. The reflection coefficient of the Louvres (R) varies between 0%–100%. The results of the analysis of 53 simulated favorable conditions show that in 77.3% of cases 0%, in 18.8% of cases 10% and in 3.9% of cases the reflection rate of 20% was recorded. The number of louvers (n) is defined between 2 and 10 according to the dimensions of the window. The results of the analysis of 53 simulated favorable conditions show that in 20.7% of cases the number of louvers is 4, in 16.9% of cases 5, in 13.2% of cases 6, in 13.2% of Items 3 and other items are small. The reflection coefficient of the Louvres (R) varies between 0%–100%. The results of the analysis of 53 simulated favorable conditions show that in 77.3% of cases 0%, in 18.8% of cases 10% and in 3.7% of cases the reflection rate of 20% was recorded. In none of the cases was the reflection rate 30% to 100% recorded.
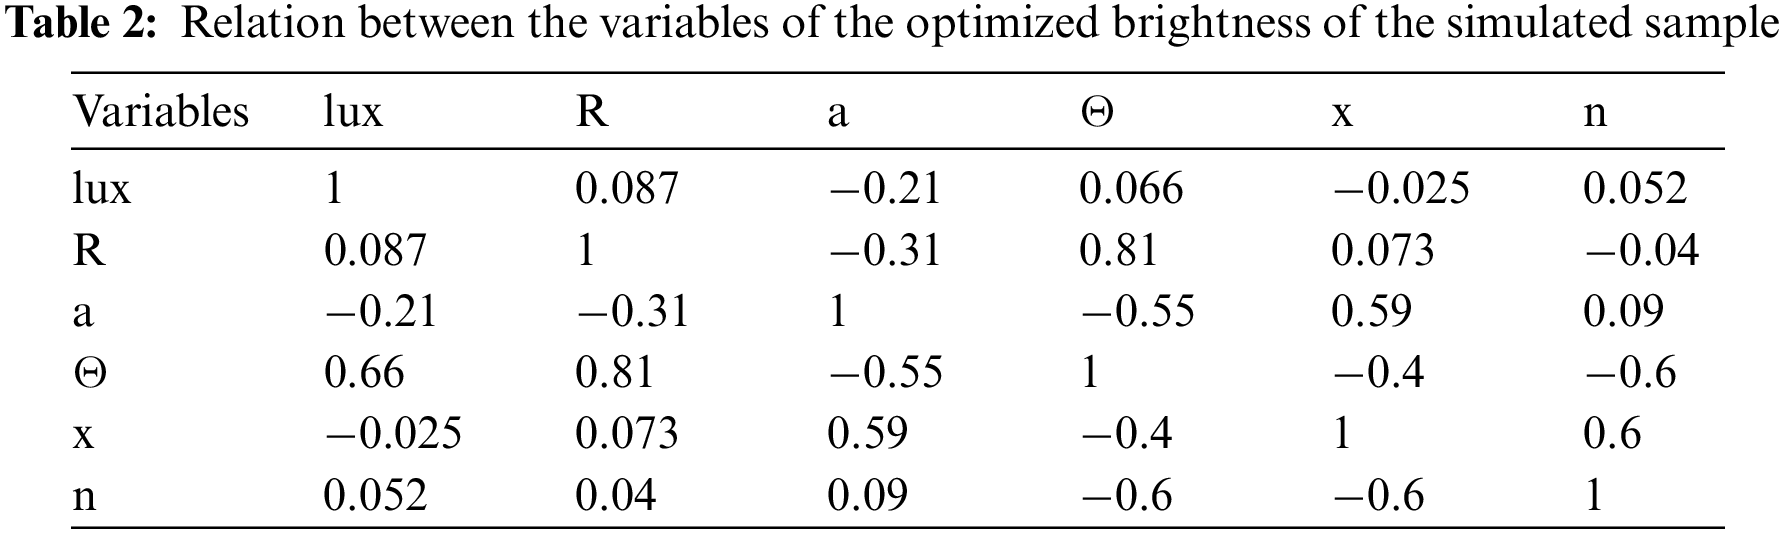
Table 2 represents the correlation between five independent variables and dependent variables using Kendall Tau test. The highest correlation is related to the two independent variables of louver reflection coefficient (R) and louver rotation angle (ϴ) with a confidence coefficient of 0.81 and a direct correlation coefficient of 0.59 Between the two independent variables, the depth of the louvers (x) and the distance of the louvers from the window (a) with a confidence coefficient of 0.99, a direct correlation coefficient of 0.48 was recorded. Between two independent variables, the distance of the Louvres from the window (a) and the angle of rotation of the Louvres (ϴ), a correlation coefficient of −0.55 has been recorded indirectly with a confidence coefficient of 0.98, and between the two independent variables, the depth of the Louvres (x) and the angle of rotation of the Louvres (ϴ) With a reliability coefficient of 0.99, a correlation coefficient of −0.4 has been recorded indirectly. Regarding the correlation between the independent variables and the dependent variable, shows that the average correlation of the brightness level in terms of lux (dependent variable) with the number of louvers (n) has a correlation coefficient of 0.052 and a direct relationship with the depth of the louvers (x). The correlation coefficient is 0.59 and the indirect relationship with the distance of the Louvre from the window (a) is the correlation coefficient of 0.32 and the indirect relationship.
According to the simulations that were carried out during the summer revolution, the winter revolution, the spring equinox, and the autumn equinox in the city of Jakarta, the amount of lighting was greater than what was required for educational space (−400). This results in an increase in the amount of energy required to cool the environment. As a result, the application of light control systems like louvers plays a vital part in the process of controlling and improving the quality of the light that is available within. The results of both the simulation and the installation of external louvers show that the installation of this system in the southern wall of the building in the city of Jakarta has a significant effect on controlling the amount of incoming light and lighting level of educational space for energy efficiency and intelligent consumption, as well as providing the required light level inside the building. It has quite a few. According to the findings of this research, there are five key considerations that need to be made when designing external louvers. These include the number of louvers, the depth of the louvers, the angle of rotation of the louvers, the distance of the louvers from the window, and the reflection coefficient of the louvers. The results of the study that simulated 2000 different modes in the city of Jakarta show that the best reflection from the louvers is between 0 and 15 percent, and the optimal distance between the louvers and the window is in the range of 0 to 18 centimeters. These findings are based on the findings of the study that was conducted in Jakarta.
Funding Statement: The authors received no funding for this study.
Conflicts of Interest: The authors declare that they have no conflicts of interest to report regarding the present study.
References
1. A. Eltaweel, M. A. Mandour, Q. Lv and Y. Su, “Daylight distribution improvement using automated prismatic louvre,” Journal of Daylighting, vol. 7, no. 1, pp. 84–92, 2020. [Google Scholar]
2. A. Arslanyilmaz, “Book review: Task-based language learning and teaching with technology,” The EuroCALL Review, vol. 31, no. 1, pp. 134–136, 2014. [Google Scholar]
3. K. C. Chu, D. J. Horng and K. C. Chang, “Numerical optimization of the energy consumption for wireless sensor networks based on an improved ant colony algorithm,” IEEE Access, vol. 7, pp. 105562–105571, 2019. [Google Scholar]
4. F. Dahan, K. El Hindi, H. Mathkour and H. Alsalman, “Dynamic flying ant colony optimization (DFACO) for solving the traveling salesman problem,” Sensors (Switzerland), vol. 19, no. 8, pp. 1837, 2019. [Google Scholar]
5. X. Dai, S. Long, Z. Zhang and D. Gong, “Mobile robot path planning based on ant colony algorithm with a∗ heuristic method,” Frontiers in neurorobotics, vol. 13, pp. 15, 2019. [Google Scholar]
6. D. A. Friedman and E. Søvik, “The ant colony as a test for scientific theories of consciousness,” Synthese, vol. 198, no. 2, pp. 1457–1480, 2021. [Google Scholar]
7. K. Kosutova, T. van Hooff, C. Vanderwel, B. Blocken and J. Hensen, “Cross-ventilation in a generic isolated building equipped with louvers: Wind-tunnel experiments and CFD simulations,” Building and Environment, vol. 154, no. 9, pp. 263–280, 2019. [Google Scholar]
8. N. A. Kyriakakis, M. Marinaki and Y. Marinakis, “A hybrid ant colony optimization-variable neighborhood descent approach for the cumulative capacitated vehicle routing problem,” Computers & Operations Research, vol. 134, pp. 105397, 2021. [Google Scholar]
9. Q. Li, Y. Wang, L. Ma, M. Arici, D. Li et al., “Effect of sunspace and PCM louver combination on the energy saving of rural residences: Case study in a severe cold region of China,” Sustainable Energy Technologies and Assessmentss, vol. 45, no. 3, pp. 101126, 2021. [Google Scholar]
10. Y. Liu and B. Cao, “A novel ant colony optimization algorithm with levy flight,” IEEE Access, vol. 8, pp. 67205–67213, 2020. [Google Scholar]
11. Z. Liu, X. Wang, K. Lu and D. Su, “Retraction: Automatic arrhythmia detection based on convolutional neural networks,” Computers, Materials & Continua, vol. 63, no. 2, pp. 1079, 2020. [Google Scholar]
12. Z. Liu, X. Wang, C. Sun and K. Lu, “Retraction: Implementation system of human eye tracking algorithm based on FPGA,” Computers, Materials & Continua, vol. 62, no. 3, pp. 1487, 2020. [Google Scholar]
13. H. Lloyd and M. Amos, “Solving sudoku with ant colony optimization,” IEEE Trans. Games, vol. 12, no. 3, pp. 302–311, 2020. [Google Scholar]
14. T. H. Nguyen and R. Grishman, “Graph convolutional networks with argument-aware pooling for event detection,” 32nd AAAI Conference on Artificial Intelligence, AAAI 2018, vol. 32, no. 1, pp. 5900–5907, 2018. [Google Scholar]
15. Q. Luo, H. Wang, Y. Zheng and J. He, “Research on path planning of mobile robot based on improved ant colony algorithm,” Neural Computing and Applications, vol. 32, no. 6, pp. 1555–1566, 2020. [Google Scholar]
16. M. Neroni, “Ant colony optimization with warm-up,” Algorithms, vol. 14, no. 10, pp. 295, 2021. [Google Scholar]
17. T. Nurcahyadi and C. Blum, “Adding negative learning to ant colony optimization: A comprehensive study,” Mathematics, vol. 9, no. 4, pp. 1–23, 2021. [Google Scholar]
18. A. I. Palmero-Marrero and A. C. Oliveira, “Effect of louver shading devices on building energy requirements,” Applied energy, vol. 87, no. 6, pp. 2040–2049, 2010. [Google Scholar]
19. Z. Ruan, H. Luo, W. Lin and J. Wang, “Erratum: Mitigating content caching attack in NDN,” Computers Materials & Continua, vol. 56, no. 3, pp. 483–499, 2018. [Google Scholar]
20. A. Sadeghianjahromi, S. Kheradmand, H. Nemati and C. C. Wang, “Optimization of the louver fin-and-tube heat exchangers↔a parametric approach,” Journal of Enhanced Heat Transfer, vol. 27, no. 4, pp. 289–312, 2020. [Google Scholar]
21. P. Sriromreun and P. Sriromreun, “An optimum design for air filter housing-louver: Enhancing filter life-time,” Case Studies in Thermal Engineering, vol. 21, no. 9, pp. 100701, 2020. [Google Scholar]
22. Y. Tao, X. Fang, S. Setunge, J. Tu, J. Liu et al., “Naturally ventilated double-skin façade with adjustable louvers,” Solar Energy, vol. 225, pp. 33–43, 2021. [Google Scholar]
23. L. Vinet and A. Zhedanov, “A ‘missing’ family of classical orthogonal polynomials,” Journal of Physics A: Mathematical and Theoretical, vol. 44, no. 8, pp. 085201, 2011. [Google Scholar]
24. A. Molajou, P. Pouladi and A. Afshar, “Incorporating social system into water-food-energy nexus,” Water Resources Management, vol. 35, no. 13, pp. 4561–4580, 2021. [Google Scholar]
25. M. Sadeghzadeh, M. H. Ahmadi, M. Kahani, H. Sakhaeinia, H. Chaji et al., “Smart modeling by using artificial intelligent techniques on thermal performance of flat-plate solar collector using nanofluid,” Energy Science & Engineering, vol. 7, no. 5, pp. 1649–1658, 2019. [Google Scholar]
26. M. Zamen, A. Baghban, S. M. Pourkiaei and M. H. Ahmadi, “Optimization methods using artificial intelligence algorithms to estimate thermal efficiency of PV/T system,” Energy Science & Engineering, vol. 7, no. 3, pp. 821–834, 2019. [Google Scholar]
27. M. Sheikholeslami, M. Jafaryar, E. Abohamzeh, A. Shafee and H. Babazadeh, “Energy and entropy evaluation and two-phase simulation of nanoparticles within a solar unit with impose of new turbulator,” Sustainable Energy Technologies and Assessments, vol. 39, no. 6, pp. 100727, 2020. [Google Scholar]
28. A. Molajou, V. Nourani, A. Afshar, M. Khosravi and A. Brysiewicz, “Optimal design and feature selection by genetic algorithm for emotional artificial neural network (EANN) in rainfall-runoff modeling,” Water Resources Management, vol. 35, no. 8, pp. 2369–2384, 2021. [Google Scholar]
Cite This Article
 Copyright © 2023 The Author(s). Published by Tech Science Press.
This work is licensed under a Creative Commons Attribution 4.0 International License , which permits unrestricted use, distribution, and reproduction in any medium, provided the original work is properly cited.
 Downloads
 Citation Tools