
 Submit a Paper
 Propose a Special lssue
 Open Access
ARTICLE

Arithmetic Optimization with Ensemble Deep Transfer Learning Based Melanoma Classification
1 Department of Computer Science, Dr. Nalli Kuppusamy Arts College (Affiliated to Bharathidasan University, Tiruchirappalli), Thanjavur, 613003, India
2 Department of Computer Science, College of Computer and Information Sciences, Majmaah University, Al-Majmaah, 11952, Saudi Arabia
3 Lepartment of Computer Engineering, College of Computer Engineering & Sciences, Prince Sattam Bin Abdulaziz University, Al-Kharj, 11942, Saudi Arabia
4 Department of Computer Science and Engineering, Vignan’s Institute of Information Technology, Visakhapatnam, 530049, India
5 Department of Applied Data Science, Noroff University College, Kristiansand, Norway
6 Department of ICT Convergence, Soonchunhyang University, Korea
* Corresponding Author: Yunyoung Nam. Email:
Computers, Materials & Continua 2023, 75(1), 149-164. https://doi.org/10.32604/cmc.2023.033005
Received 04 June 2022; Accepted 05 July 2022; Issue published 06 February 2023
 View Full Text
 Download PDF
Abstract
Melanoma is a skin disease with high mortality rate while early diagnoses of the disease can increase the survival chances of patients. It is challenging to automatically diagnose melanoma from dermoscopic skin samples. Computer-Aided Diagnostic (CAD) tool saves time and effort in diagnosing melanoma compared to existing medical approaches. In this background, there is a need exists to design an automated classification model for melanoma that can utilize deep and rich feature datasets of an image for disease classification. The current study develops an Intelligent Arithmetic Optimization with Ensemble Deep Transfer Learning Based Melanoma Classification (IAOEDTT-MC) model. The proposed IAOEDTT-MC model focuses on identification and classification of melanoma from dermoscopic images. To accomplish this, IAOEDTT-MC model applies image preprocessing at the initial stage in which Gabor Filtering (GF) technique is utilized. In addition, U-Net segmentation approach is employed to segment the lesion regions in dermoscopic images. Besides, an ensemble of DL models including ResNet50 and ElasticNet models is applied in this study. Moreover, AO algorithm with Gated Recurrent Unit (GRU) method is utilized for identification and classification of melanoma. The proposed IAOEDTT-MC method was experimentally validated with the help of benchmark datasets and the proposed model attained maximum accuracy of 92.09% on ISIC 2017 dataset.Keywords
Melanoma has been classified as one of the serious skin cancer types and is ranked at 9th position amongst the common cancer types. Every year, more than 132,000 cases are diagnosed across the globe [1]. According to the report by The American Cancer institution in the year 2019, 1,92,310 patients are affected with melanoma in U.S. In the last few years, the prevalence rate of melanoma is increasing with more number of patients getting infected with the disease alike other cancer types. A minor operation may incline the possibility of recovery after early detection of melanoma [2]. Dermoscopy is the commonly used imaging technique used for diagnosing melanoma. It expands the skin surface affected by cancer and its structure can be easily seen by dermatologists for investigation [3]. But discrimination of skin lesions, by dermatologists, from dermoscopic images is subjective and a time-consuming process. Further, the accuracy of the diagnoses primarily depends upon the expertise. Therefore, non-experienced dermatologists cannot make judgments with accuracy [4].
On the other hand, numerous problems arise in case of automatic detection of melanoma. At first, skin lesion has great intra-class variations and inter-class similarities in texture, color, and shape; different types of skin cancers possess high visual similarity [5]. Secondly, the region of skin lesions largely differ in dermoscopic images while the borders between normal skin and skin lesions remain unclear in certain images. Next, artifacts like rulers, texture, and hair are highly challenging to recognize in dermoscopic images in case of changes in melanoma. Likewise, many other factors increase the challenges involved in automated detection of melanoma from dermoscopic images [6]. So, there is an urgent need to develop an automated and non-subjective detection technique. This might help dermatologists to make accurate diagnoses. Such challenges inspire the researchers to propose new algorithms for diagnosis and visualization of melanoma. Computer-Aided Diagnosis (CAD) schemes assist in the diagnosis of melanoma. CAD system offers a user-friendly environment for inexperienced dermatologists [7]. The evidence produced by CAD diagnosis mechanism is utilized as a second opinion for melanoma diagnosis. In order to detect a skin lesion at early stages and resolve the abovementioned complexity, extensive studies have been conducted earlier with the help of Computer Vision (CV) algorithm [8]. The classification method varies such as Decision Trees (DT), Support Vector Machines (SVM), and Artificial Neural Networks (ANN). Conventional techniques are parametric in nature and need trainable datasets to achieve normal distribution. However, skin cancer dataset is uncontrivable [9]. Every lesion contains a distinct pattern; therefore, this technique is not sufficient. For this reason, DL technique is powerful in skin image classification as it can help the dermatologists to diagnose lesions with high accuracy [10].
The current study develops an Intelligent Arithmetic Optimization with Ensemble Deep Transfer Learning Based Melanoma Classification (IAOEDTT-MC) model. Initially, the proposed IAOEDTT-MC model applies image preprocessing at initial stage with the help of Gabor Filtering (GF) technique. In addition, U-Net segmentation approach is employed to segment the lesion regions in dermoscopic images. Besides, an ensemble of DL models including ResNet50 and ElasticNet models is applied. Moreover, AO algorithm with Gated Recurrent Unit (GRU) method is employed for both identification and classification of melanoma. The proposed IAOEDTT-MC approach was experimentally validated with the help of benchmark datasets and the results were examined under several measures.
In literature [11], the authors proposed an automatic skin lesion classification technique. In this technique, Transfer Learning (TL) and pretrained Deep Learning (DL) networks were used. Apart from data augmentation and fine-tuning, TL model is also employed for AlexNet by replacing the final layer with softmax function to categorize three distinct types of lesions such as atypical nevus, common nevus, and melanoma. In Li et al. [12], two DL techniques were proposed to address three major tasks that evolve in the region of skin cancer image processing such as lesion segmentation, lesion dermoscopic feature extraction, and lesion classification. A DL architecture, comprised of two Fully Convolutional Residual Network (FCRN), was presented to concurrently produce coarse classification and segmentation results. Lesion Index Calculation Unit (LICU) was designed earlier to refine the coarse classification result by evaluating distance heat map. A direct CNN was introduced in this study for dermoscopic feature extraction tasks.
The authors in the study conducted earlier [13] developed a DL-based technique that overcomes the limitation in automated detection and segmentation of melanoma from dermoscopic images. An encoder-decoder network, with decoder and encoder subnetworks, was developed in this study. This network is interconnected with a sequence of skip pathways that carries the semantic level of encoder feature map close to the decoder feature map for feature extraction and effectual learning. The scheme applies multi-stage-and-scale method and uses softmax classification for pixel-wise classification of melanoma lesions. Kaur et al. [14] developed an automated melanoma classification method based on Deep CNN (DCNN) for accurate classification of malevolent vs. benevolent melanoma. DCNN architecture can be well planned by organizing more than one layer that is accountable for deriving lower to higher-level features of the skin image in an exclusive manner. Other vital conditions in DCNN structure includes the selection of sizes and multiple filters that employ optimizing hyperparameters, proper DL layers, and selection of in-depth network.
Thapar et al. [15] suggested a reliable technique for skin lesion detection with the help of dermoscopic images. This aim of this technique is to enhance the visual observation and diagnostic ability of healthcare professionals in terms of differentiating benign from malignant lesions. Swarm Intelligence (SI) algorithm was utilized in this study for segmentation of Region of Interest (RoI) from dermoscopic images. Further, Speeded-Up Robust Feature (SURF) was applied for feature extraction of RoI which is determined as a better segmentation outcome, attained by Grasshopper Optimization Algorithm (GOA). Banerjee et al. [16] proposed a DL-based ‘You Only Look Once (YOLO)’ technique based on the application of DCNN to diagnose melanoma from digital and dermoscopic images. This technique also aimed at providing fast and accurate output compared to traditional CNN. With respect to position of the recognized object in a cell, this method forecasted the class confidence score and bounding box of the detected object. In literature [17], the authors addressed the problem of efficient usage of feature set extracted from DL model which is pre-trained on ImageNet.
In this study, a novel IAOEDTT-MC technique has been developed for identification and classification of melanoma on dermoscopic images. Initially, the proposed IAOEDTT-MC model applies image pre-processing using GF technique. Followed by, U-Net segmentation approach is employed to segment the lesion regions in dermoscopic images. Furthermore, an ensemble of DL models including ResNet50 and ElasticNet models is applied. At last, AO algorithm with GRU approach is employed for the identification and classification of melanoma. Fig. 1 depicts the overall process involved in IAOEDTT-MC approach.
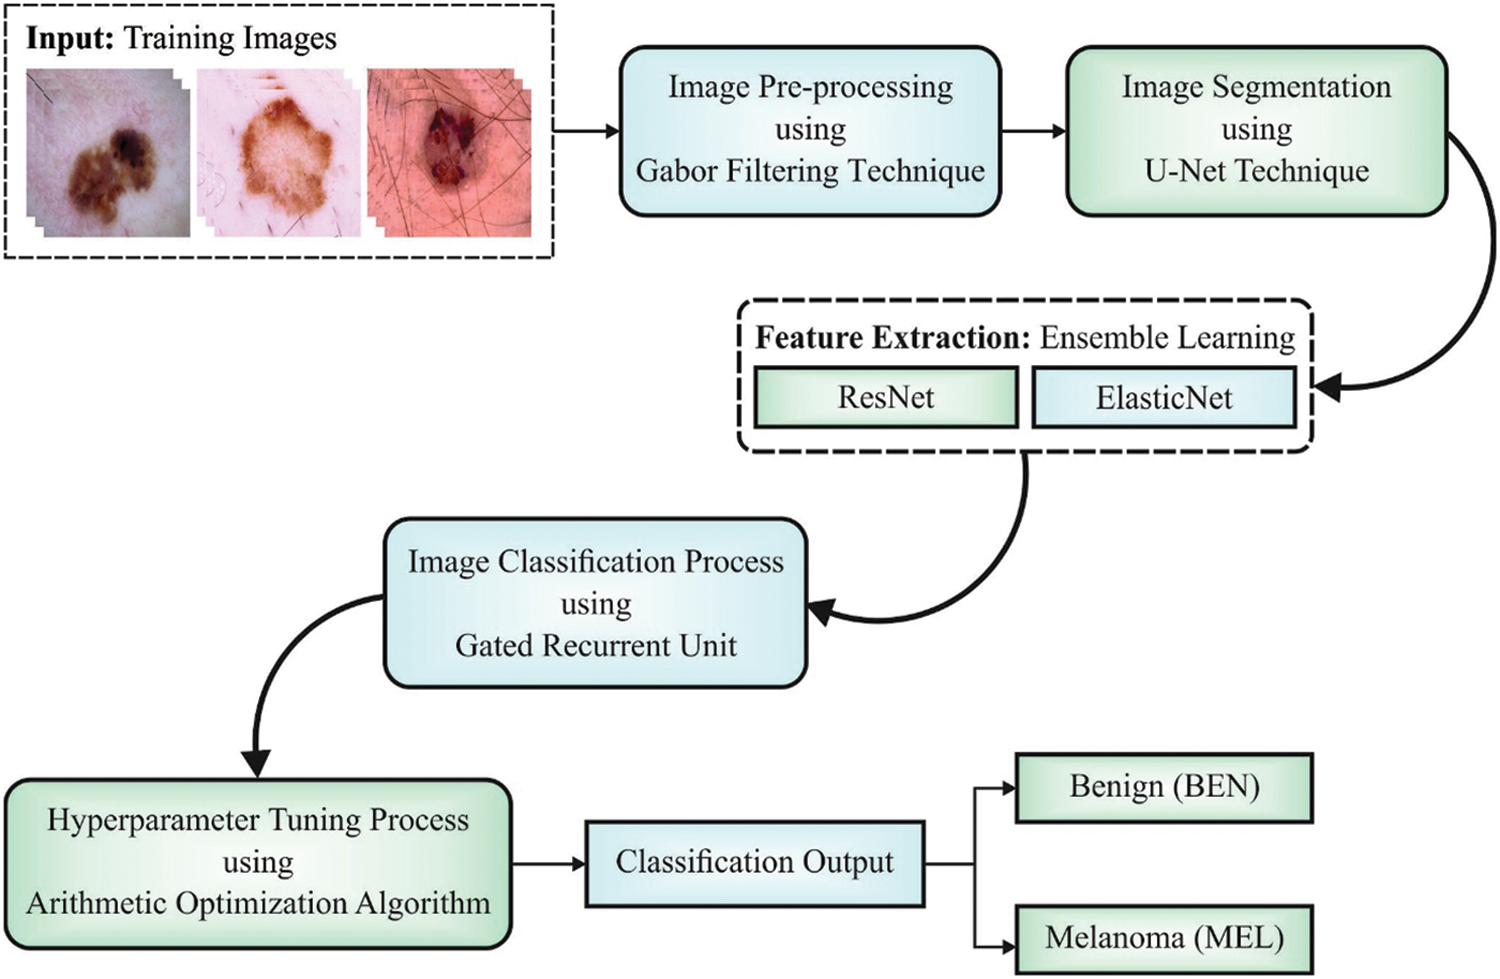
Figure 1: Block diagram of IAOEDTT-MC approach
GF is a band-pass filter that is effectively executed for CV application and variations in image processing. Two-dimensional Gabor function is an orientated complex in which the sinusoidal grating gets decreased with the help of two-dimensional Gaussian envelope. In two-dimensional co-ordinate
where
In the above equation,
In this study, U-Net segmentation technique is utilized for the segmentation of lesion region in dermoscopic image. U-net network is classified as follows: initially, the contracting path uses a standard CNN structure [19]. All the blocks in contracting path comprise of two consecutive 3 × 3 convolutions along with max-pooling layer and ReLU activation unit. This procedure is repeated iteratively. U-net is innovated in the upcoming section and is named as expansive path in which all the phases upsample the feature maps using 2 × 2 up-convolutions. Next, the feature map from respective layer in the contracting path, can be cropped and concatenated onto up-sampled feature maps. It is followed by ReLU activation and two consecutive 3 × 3 convolutions. Finally, a 1 × 1 convolution is employed in the reduction of feature maps to necessary amount of channels and generation of the segmented images. Cropping is essential, because the pixel features in the edges have minimum amount of context data due to which it should be dismissed. This results in a u-shaped network and propagates the context dataset alongside the network. This scenario enables the user to segment objects in a region with the help of context from a large overlapping region.
For feature extraction, an ensemble of DL models including ResNet50 and ElasticNet models is applied. Ensemble learning is a fusion method in which two or three models are fused together to gain benefits in terms of performance and computation. The outcomes of an ensemble of DNNs are always better compared to the outcomes achieved from a single model. In this study, average ensemble learning is utilized by a similar weight assigned to all the models.
In this expression,
ResNet is commonly used for improving the problem of vanishing or exploding gradients [20]. ResNet is a collection of residual blocks while each residual block is in turn a collection of different layers such as Batch Normalization (BN), convolution, and ReLU layers. In addition to all the residual blocks, the input is directly processed as the output using identity whereas a short connection permits the user to perform residual learning; this is important to resolve gradient problems in training deep network. The residual block is expressed as follows.
Here,
Thus, ResNet-50 is attained by stacking the residual block so as to count the last network layer to 50.
ElasticNet is basically a linear regression mechanism developed on the basis of Lasso and ridge regressions [21]. Assume that the sample size is N and the number of prediction parameters is p.
In Eq. (8), the regression coefficient is represented as
Lasso regression is defined as follows.
To break the limitation of two techniques, elastic net method is developed. Regression coefficient is represented as follows.
If
The penalty function of the elastic net is
Finally, AO algorithm with GRU model is employed for identification and classification of melanoma. RNN is a well-known neural network that can process sequential datasets. This characteristic of RNN makes it relevant to learn the algorithmic tasks [22]. Though RNN is utilized for different NLP applications, it has a primary constraint i.e., if suffers from gradient vanishing in deep network. For sequential datasets
In Eq. (13), f refers to the activation function. GRU is a kind of RNN model with less number of gates than LSTM. In GRU cell units, both forget gate and input gate can be controlled by a single gate. Therefore, both input and forget gates are integrated into a single gate which makes the GRU a simple technique than LSTM. For instance, when
In these expression,
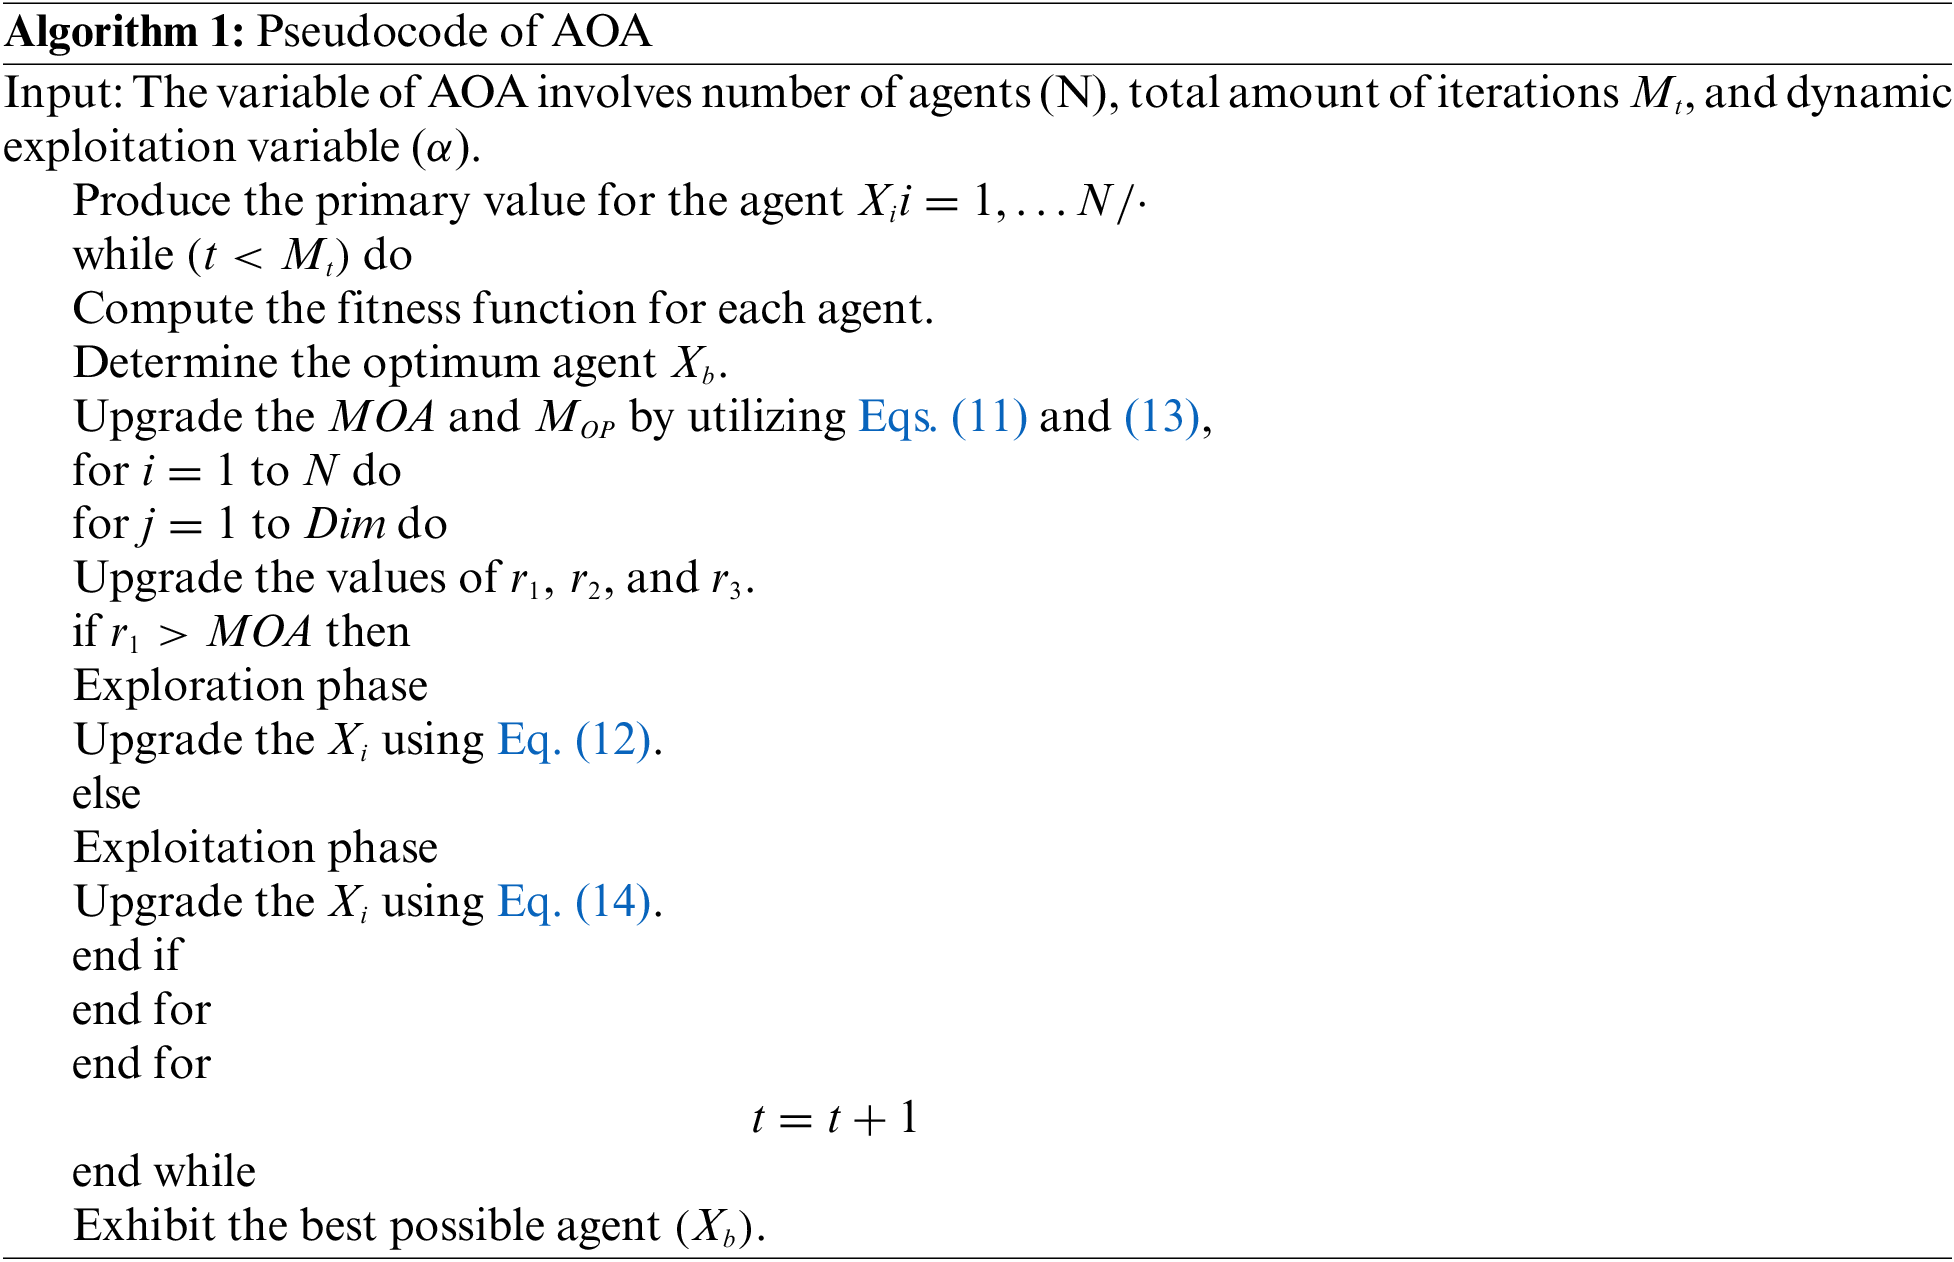
AOA comprises of exploitation, and exploration stages, inspired by arithmetical operations, like
Followed by, the fitness function of the solution is evaluated to identify the finest one
Here,
Then, e denotes the small integer value,
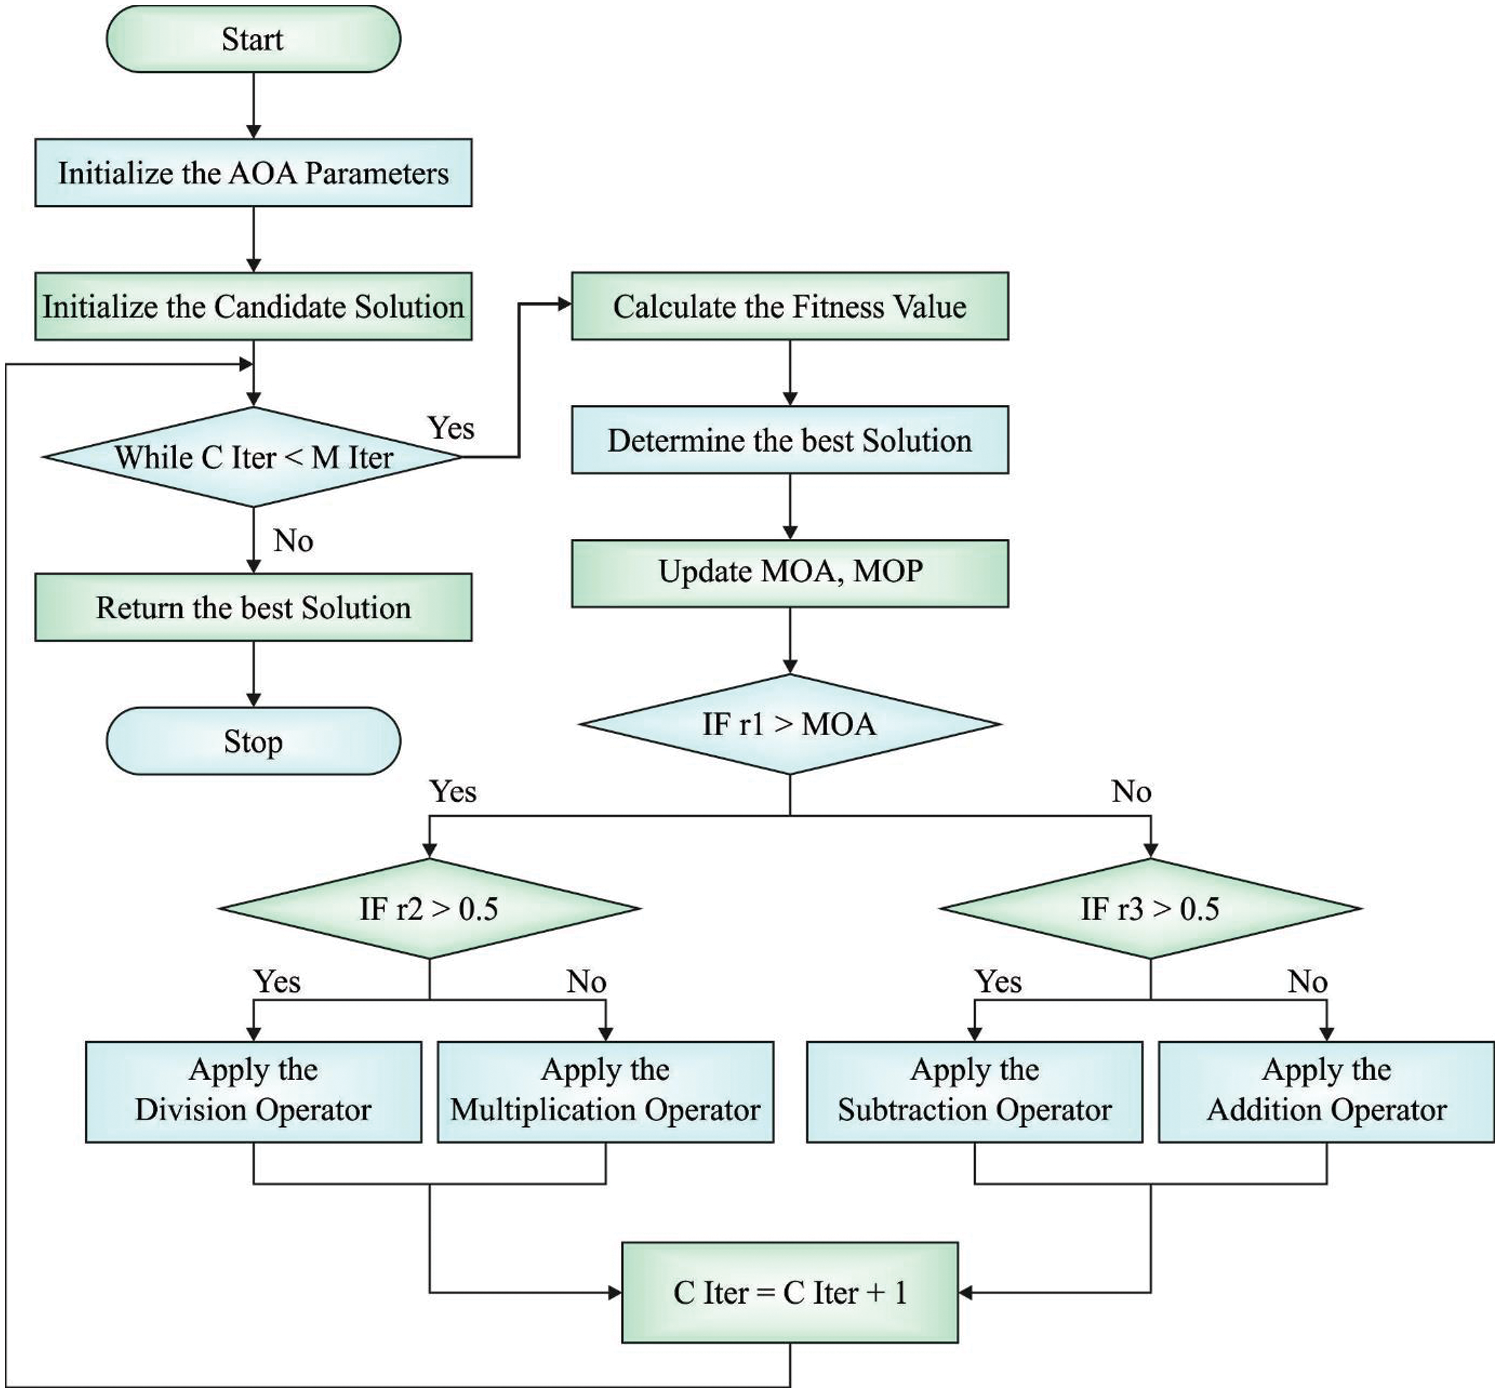
Figure 2: Flowchart of AOA
Furthermore, subtraction (D) and addition (A) operators are also applied in the implementation of AOA exploitation process as given below.
Here,
:
The proposed EAOEDTT-MC model was experimentally validated using two benchmark datasets namely, ISIC 2017 [24] and ISIC 2020 [25]. The proposed EAOEDTT-MC approach was simulated with the help of Python 3.6.5 tool. The datasets has two class labels namely, melanoma (MEL) and benign (BEN) as shown in Table 1. A few sample images are portrayed in Fig. 3.
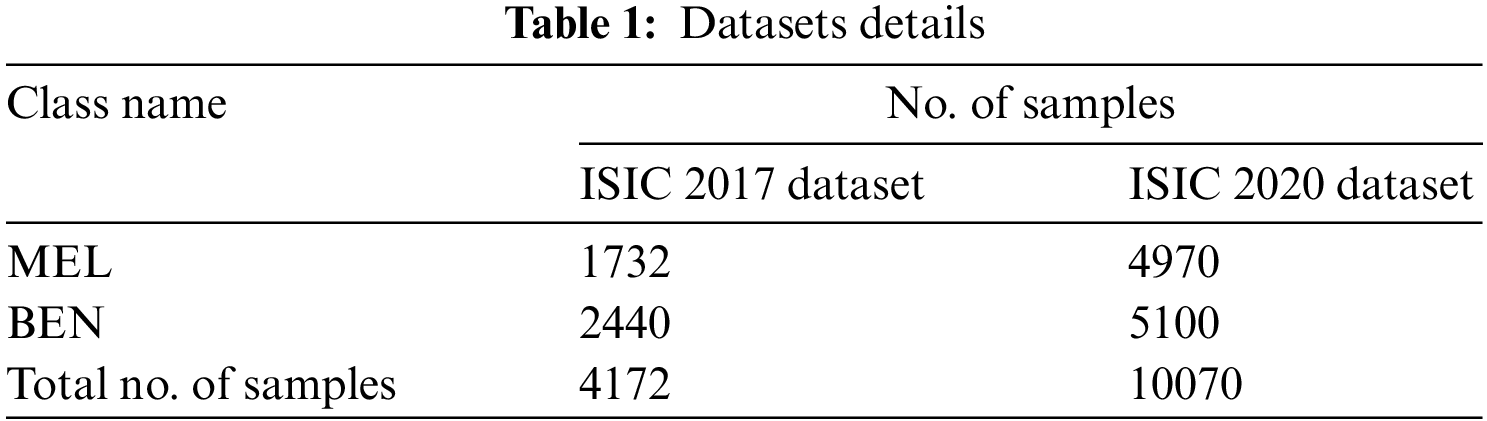
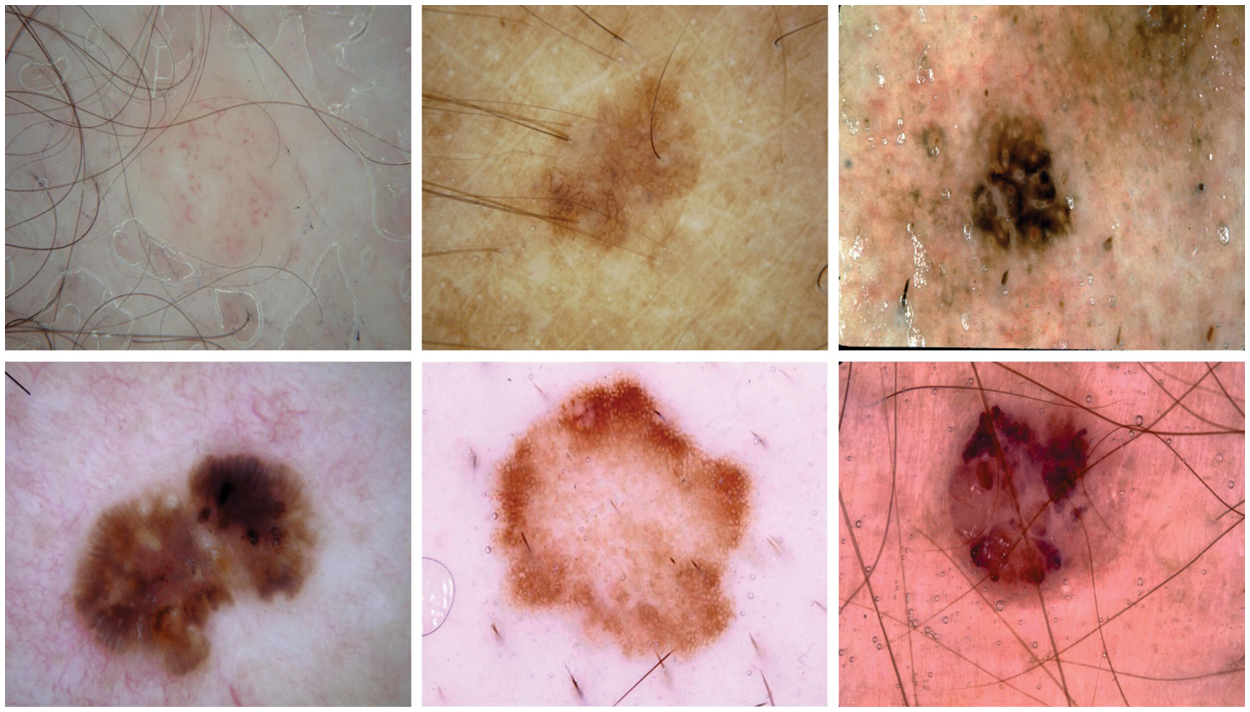
Figure 3: Sample images
Fig. 4 highlights the confusion matrices generated by the proposed EAOEDTT-MC model on test ISIC 2017 dataset. On entire dataset, the proposed EAOEDTT-MC model classified 1,452 samples under MEL class and 2,389 samples under BEN class. Eventually, on 70% of TR dataset, EAOEDTT-MC approach categorized 1,010 samples under MEL class and 1,679 samples under BEN class. Concurrently, on 30% of TS dataset, the proposed EAOEDTT-MC system recognized 442 samples under MEL class and 710 samples under BEN class.
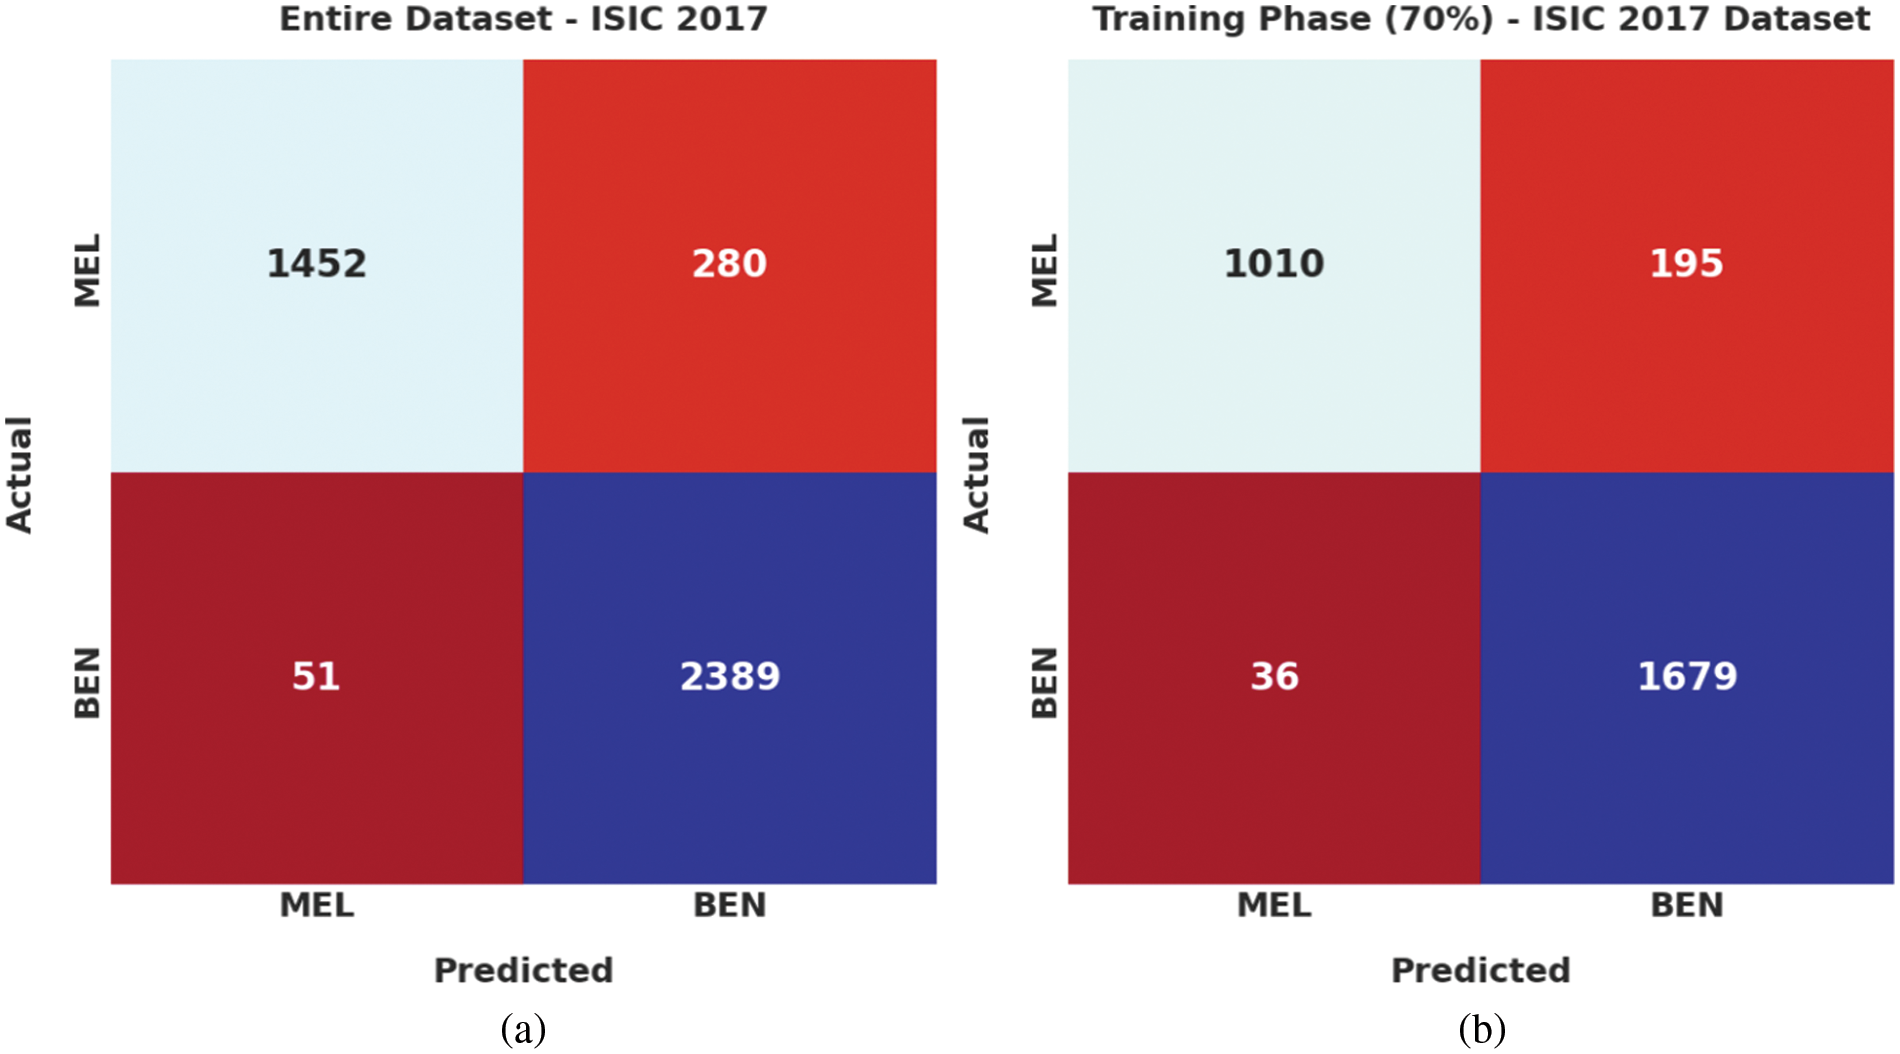
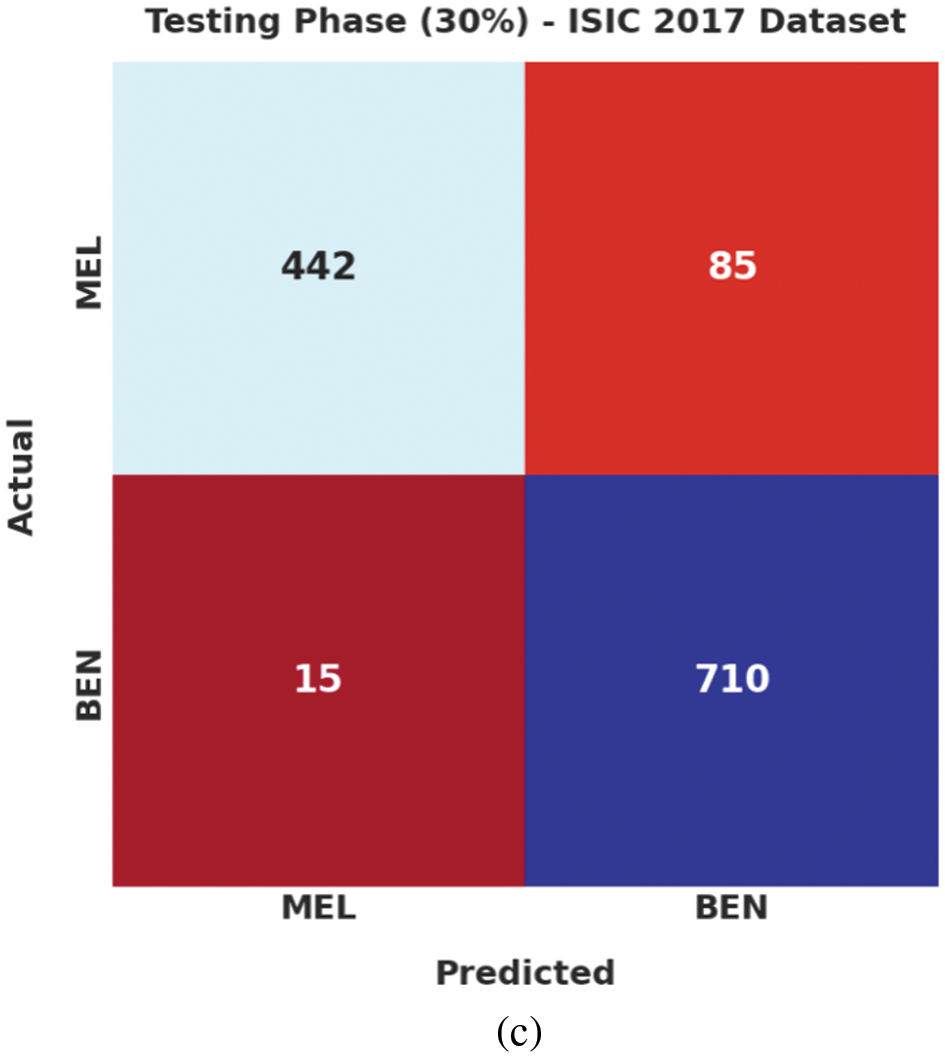
Figure 4: Confusion matrices of EAOEDTT-MC approach under ISIC 2017 dataset (a) entire dataset, (b) 70% of TR data, and (c) 30% of TS data
Table 2 and Fig. 5 shows a brief melanoma classification results achieved by the proposed EAOEDTT-MC model on test ISIC 2017 dataset. The experimental results imply that the proposed EAOEDTT-MC model achieved effectual outcomes in every aspect. For instance, with entire dataset, EAOEDTT-MC model attained an average
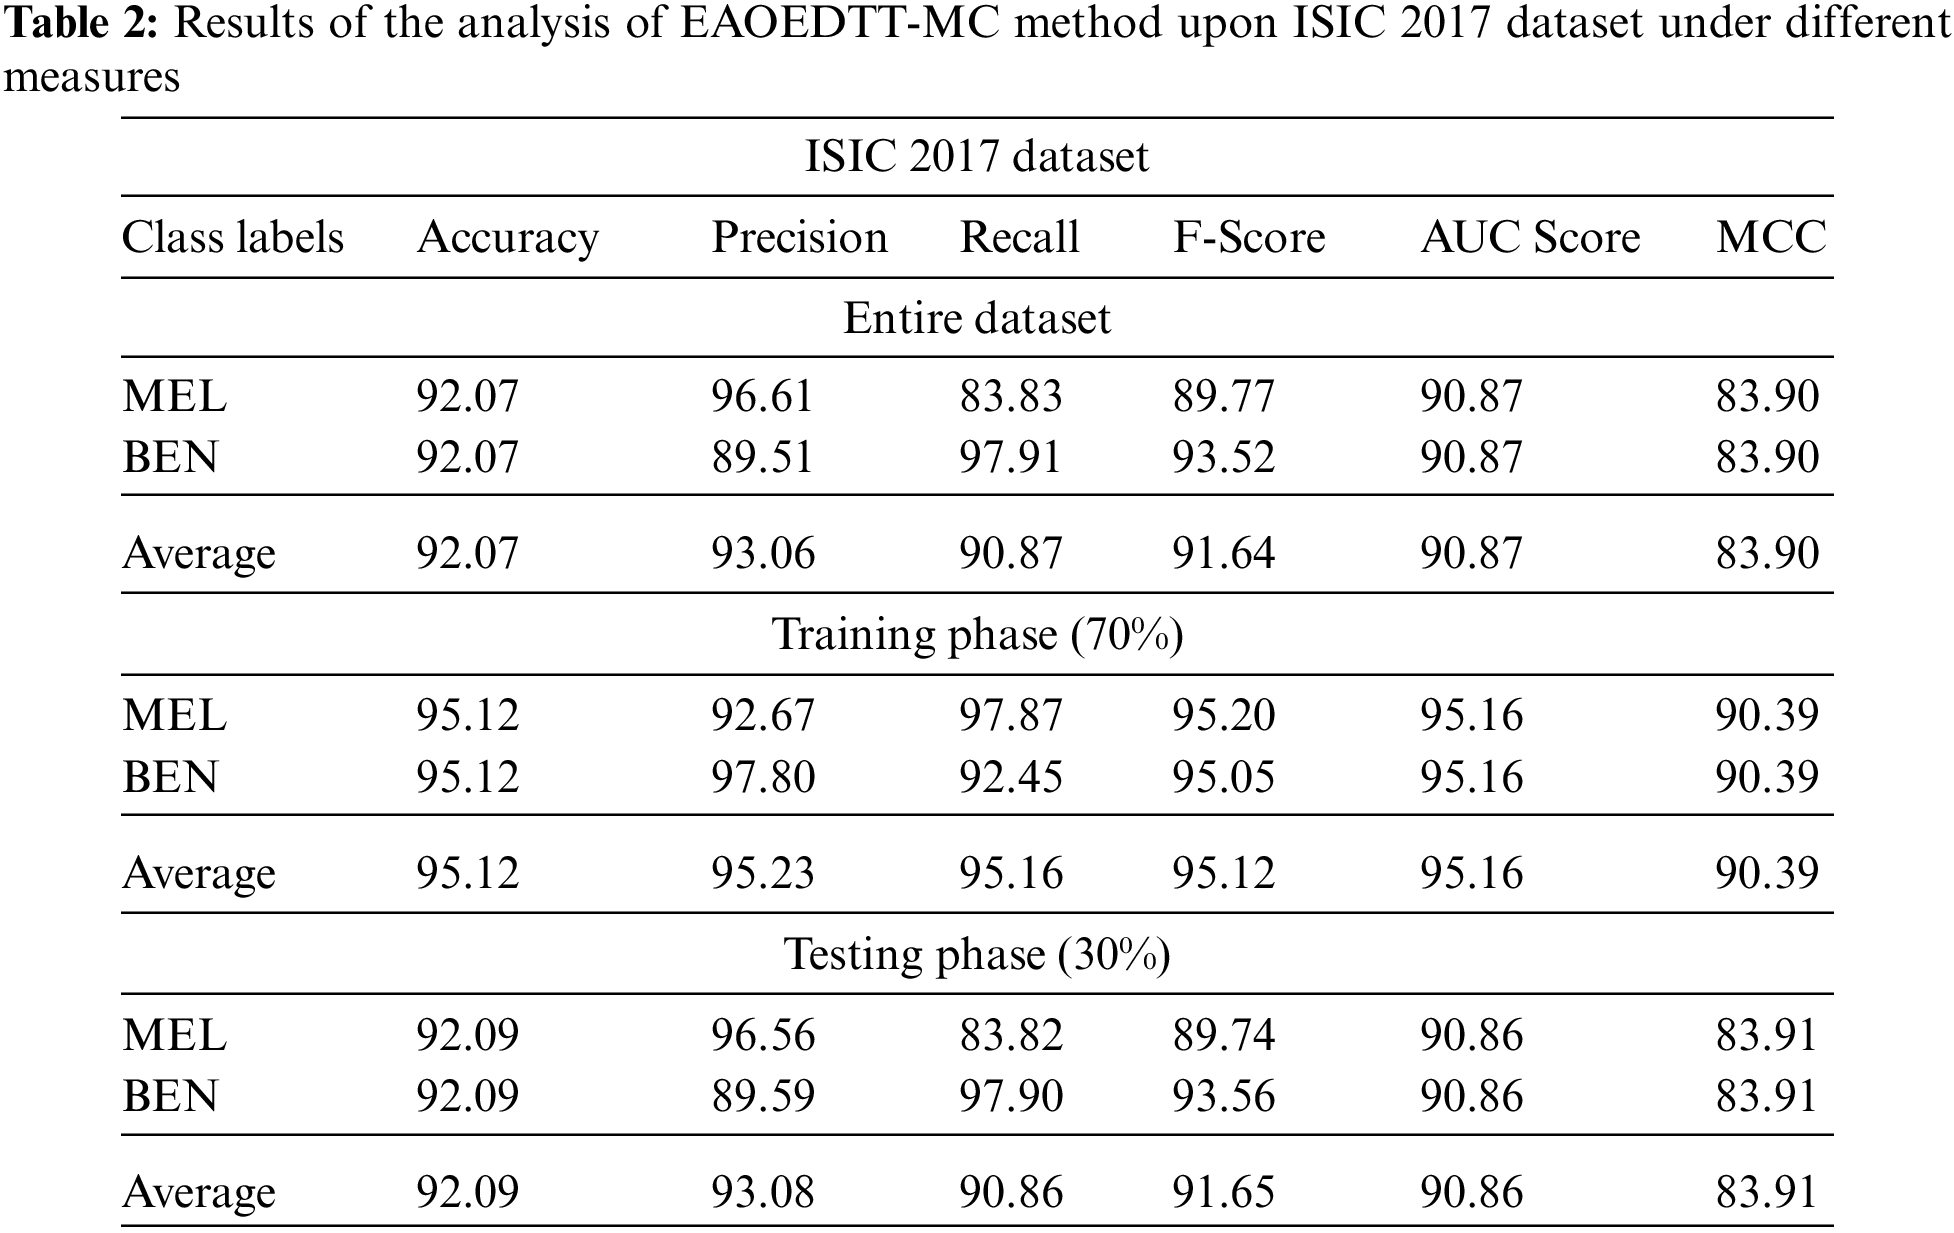
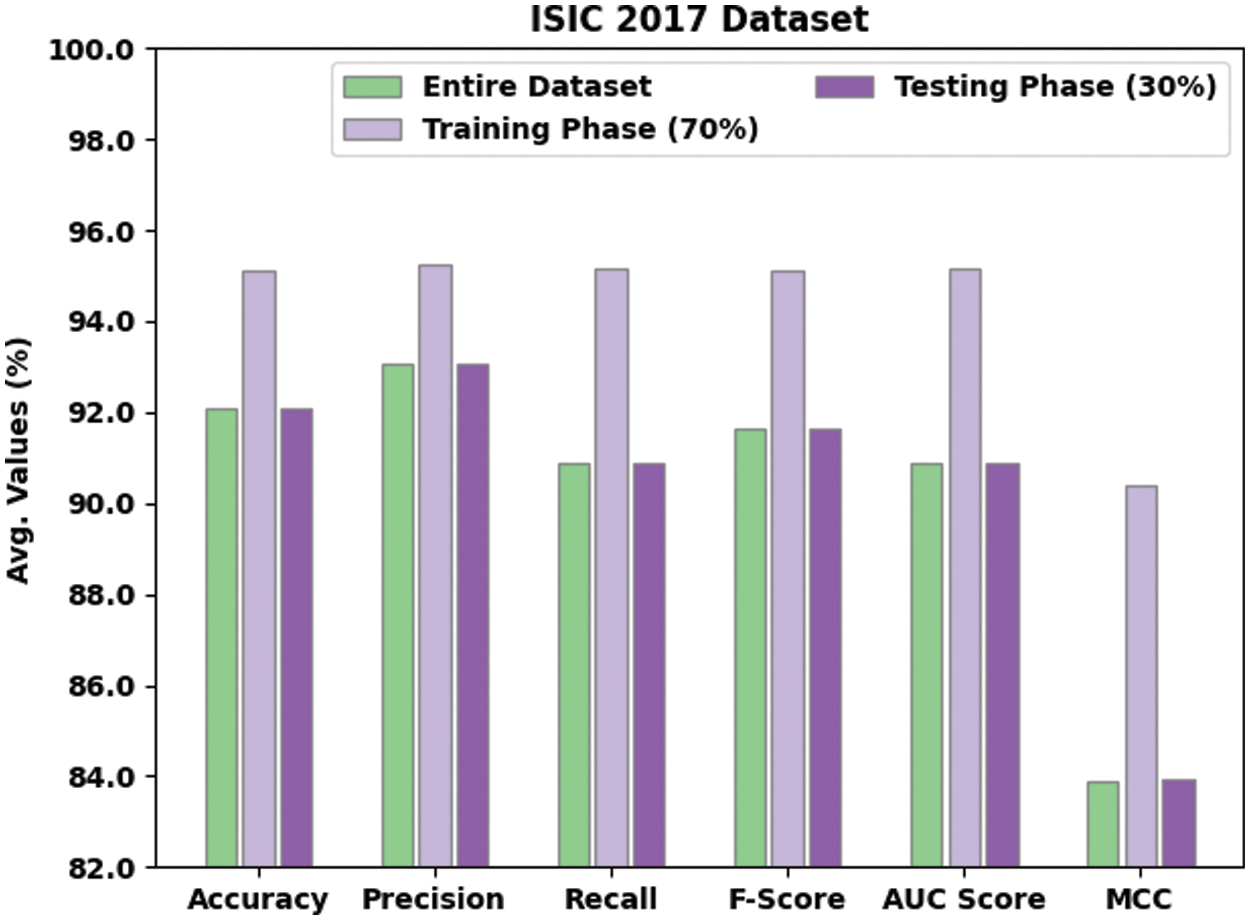
Figure 5: Average analysis of EAOEDTT-MC method under ISIC 2017 dataset
Training Accuracy (TA) and Validation Accuracy (VA) values, attained by the proposed EAOEDTT-MC approach on ISIC 2017 dataset, are demonstrated in Fig. 6. The experimental outcomes reveal that the proposed EAOEDTT-MC algorithm gained maximum TA and VA values. To be specific, VA seemed to be higher than TA. Next, Fig. 7 shows the training loss (TL) and validation loss (VL) analysis of the proposed model. The results indicated that the proposed model has offered minimal loss with an increase in epochs.
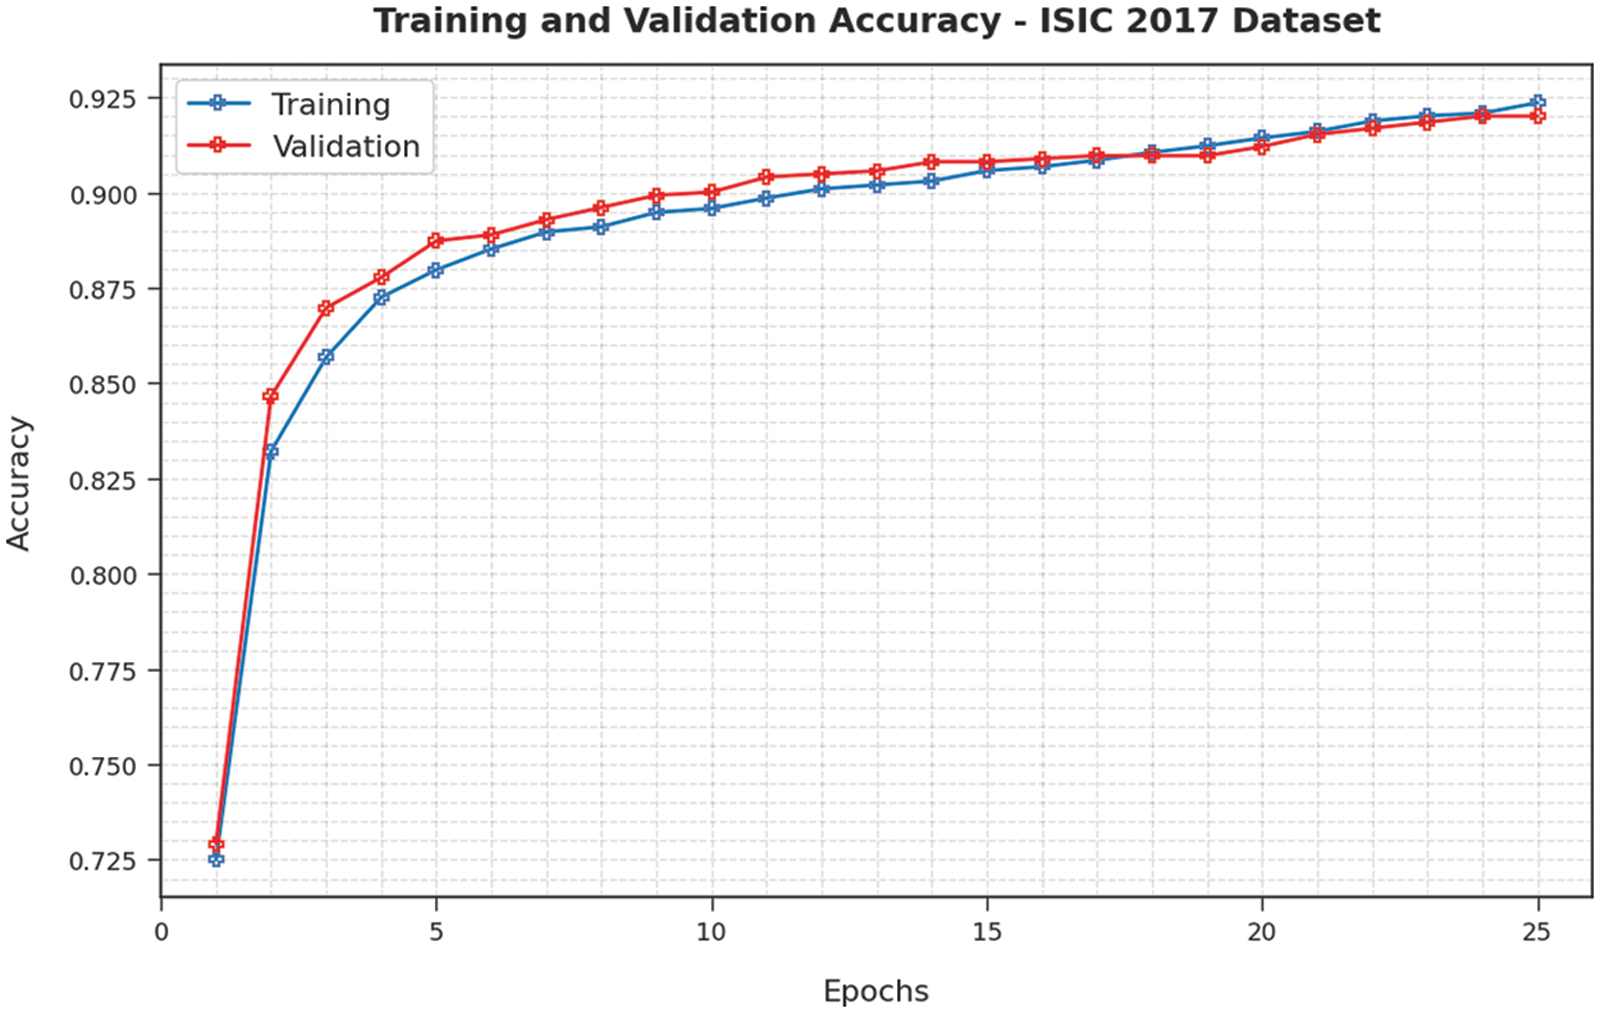
Figure 6: TA and VA analysis of EAOEDTT-MC method under ISIC 2017 dataset
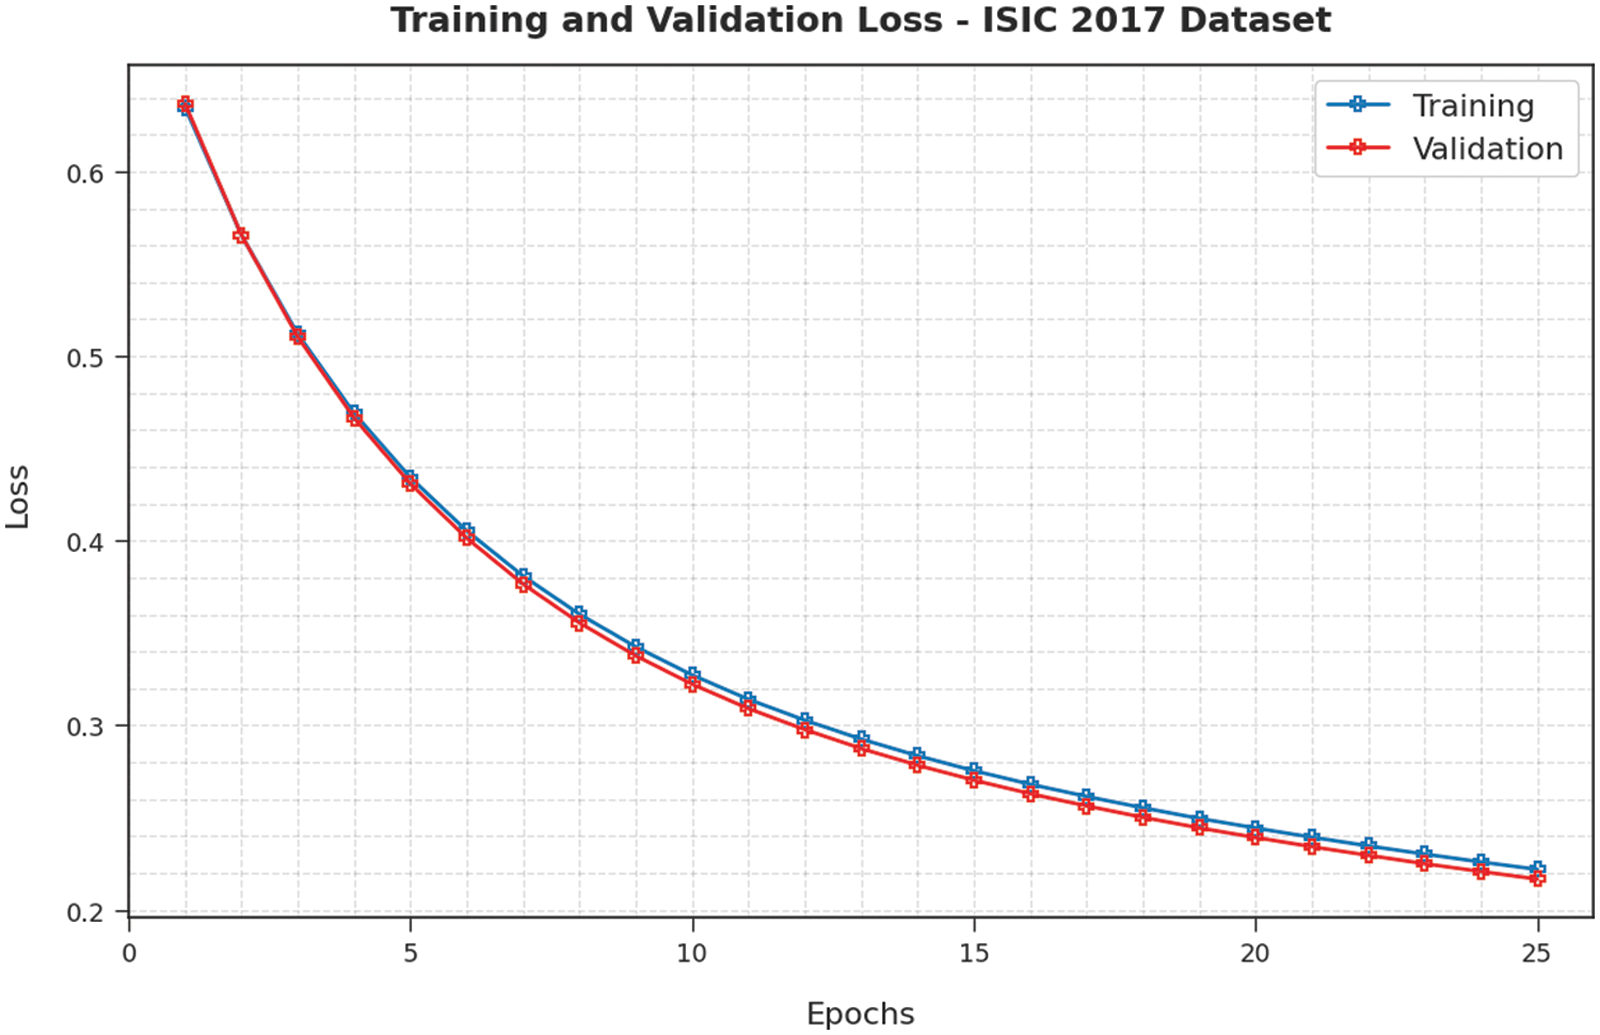
Figure 7: TL and VL analysis results of EAOEDTT-MC method under ISIC 2017 dataset
Table 3 and Fig. 8 shows the comparative study results accomplished by the proposed EAOEDTT-MC method and other existing techniques on ISIC 2017 dataset [26]. The experimental values indicate that ResNet18, Inception v3, and AlexNet models obtained the least classification performance over other models. At the same time, LCNet model reached a moderately improved classification performance while it
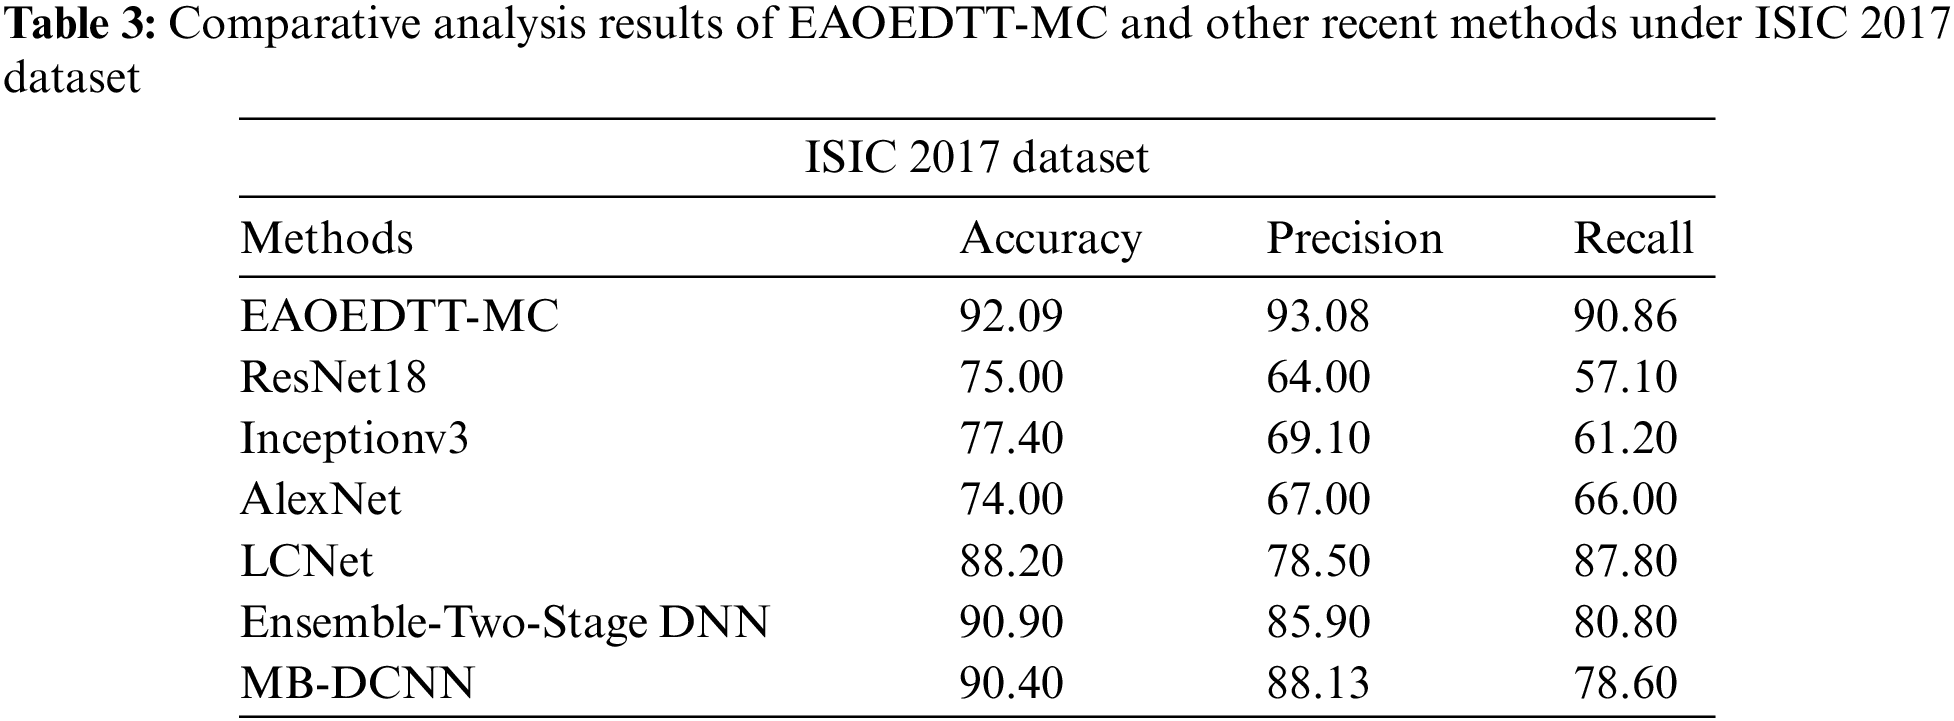
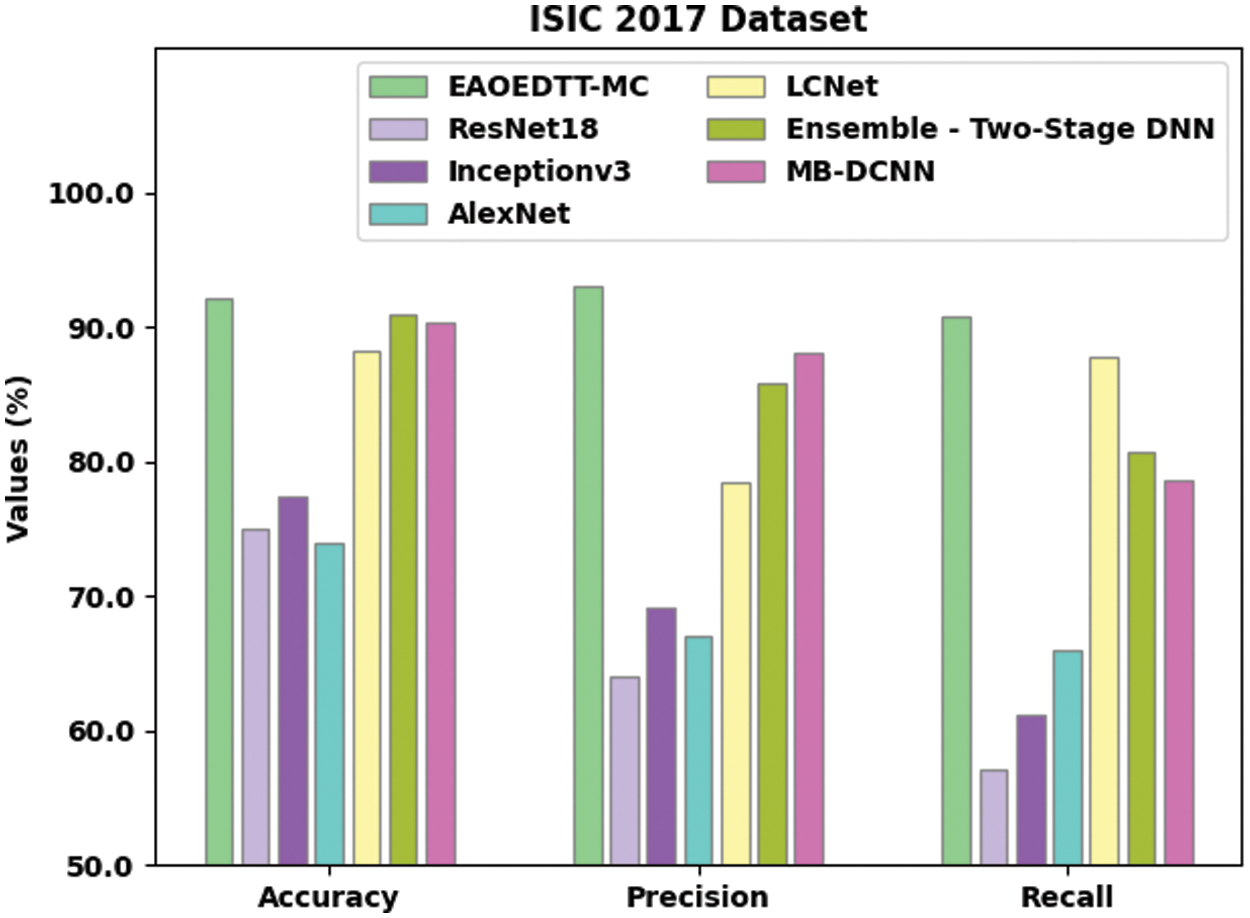
Figure 8: Comparative analysis results of EAOEDTT-MC method under ISIC 2017 dataset
In this study, a novel IAOEDTT-MC approach has been developed for identification and classification of melanoma on dermoscopic images. Initially, the proposed IAOEDTT-MC model applies image pre-processing using GF technique. Followed by, U-Net segmentation approach is followed to segment the lesion regions in dermoscopic image. Furthermore, an ensemble of DL models including ResNet50 and ElasticNet models is applied. At last, AO algorithm with GRU algorithm is utilized for identification and classification of melanoma. The design of AO algorithm involves the integration of LAHC concept with traditional AOA in order to enhance the quality of the solution. The proposed IAOEDTT-MC system was experimentally validated utilizing benchmark datasets and the outcomes were inspected under distinct measures. The extensive comparative analysis outcomes highlighted the enhanced performance of IAOEDTT-MC model over recent algorithms. In future, the performance of IAOEDTT-MC model can be enhanced with the help of hybrid metaheuristic algorithms with deep instance segmentation models.
Funding Statement: This research was supported by the MSIT (Ministry of Science and ICT), Korea, under the ICAN (ICT Challenge and Advanced Network of HRD) program (IITP-2022-2020-0-01832) supervised by the IITP (Institute of Information & Communications Technology Planning & Evaluation) and the Soonchunhyang University Research Fund.
Conflicts of Interest: The authors declare that they have no conflicts of interest to report regarding the present study.
References
1. R. Manne, S. Kantheti and S. Kantheti, “Classification of skin cancer using deep learning, convolutional neural networks-opportunities and vulnerabilities-A systematic review,” International Journal for Modern Trends in Science and Technology, vol. 6, no. 11, pp. 101–108, 2020. [Google Scholar]
2. T. J. Brinker, A. Hekler, A. H. Enk, J. Klode, A. Hauschild et al., “Deep learning outperformed 136 of 157 dermatologists in a head-to-head dermoscopic melanoma image classification task,” European Journal of Cancer, vol. 113, pp. 47–54, 2019. [Google Scholar]
3. A. Naeem, M. S. Farooq, A. Khelifi and A. Abid, “Malignant melanoma classification using deep learning: Datasets, performance measurements, challenges and opportunities,” IEEE Access, vol. 8, pp. 110575–110597, 2020. [Google Scholar]
4. X. Lai, J. Zhou, A. Wessely, M. Heppt, A. Maier et al., “A disease network-based deep learning approach for characterizing melanoma,” International Journal of Cancer, vol. 150, no. 6, pp. 1029–1044, 2022. [Google Scholar]
5. S. H. Kassani and P. H. Kassani, “A comparative study of deep learning architectures on melanoma detection,” Tissue and Cell, vol. 58, pp. 76–83, 2019. [Google Scholar]
6. S. Mukherjee, A. Adhikari and M. Roy, “Malignant melanoma classification using cross-platform dataset with deep learning CNN architecture,” in Recent Trends in Signal and Image Processing, Advances in Intelligent Systems and Computing Book Series, Singapore: Springer, vol. 922, pp. 31–41, 2019. [Google Scholar]
7. A. Korfiati, K. Grafanaki, G. C. Kyriakopoulos, I. Skeparnias, S. Georgiou et al., “Revisiting miRNA association with melanoma recurrence and metastasis from a machine learning point of view,” International Journal of Molecular Sciences, vol. 23, no. 3, pp. 1299, 2022. [Google Scholar]
8. A. Adegun and S. Viriri, “Deep learning techniques for skin lesion analysis and melanoma cancer detection: A survey of state-of-the-art,” Artificial Intelligence Review, vol. 54, no. 2, pp. 811–841, 2021. [Google Scholar]
9. J. A. A. Damian, V. Ponomaryov, S. Sadovnychiy and H. C. Fernandez, “Melanoma and nevus skin lesion classification using handcraft and deep learning feature fusion via mutual information measures,” Entropy, vol. 22, no. 4, pp. 484, 2020. [Google Scholar]
10. A. Maiti and B. Chatterjee, “Improving detection of melanoma and naevus with deep neural networks,” Multimedia Tools and Applications, vol. 79, no. 21–22, pp. 15635–15654, 2020. [Google Scholar]
11. K. M. Hosny, M. A. Kassem and M. M. Foaud, “Skin cancer classification using deep learning and transfer learning,” in 2018 9th Cairo Int. Biomedical Engineering Conf. (CIBEC), Cairo, Egypt, pp. 90–93, 2018. [Google Scholar]
12. Y. Li and L. Shen, “Skin lesion analysis towards melanoma detection using deep learning network,” Sensors, vol. 18, no. 2, pp. 556, 2018. [Google Scholar]
13. A. A. Adegun and S. Viriri, “Deep learning-based system for automatic melanoma detection,” IEEE Access, vol. 8, pp. 7160–7172, 2020. [Google Scholar]
14. R. Kaur, H. G. Hosseini, R. Sinha and M. Lindén, “Melanoma classification using a novel deep convolutional neural network with dermoscopic images,” Sensors, vol. 22, no. 3, pp. 1134, 2022. [Google Scholar]
15. P. Thapar, M. Rakhra, G. Cazzato and M. S. Hossain, “A novel hybrid deep learning approach for skin lesion segmentation and classification,” Journal of Healthcare Engineering, vol. 2022, pp. 1–21, 2022. [Google Scholar]
16. S. Banerjee, S. Singh, A. Chakraborty, A. Das and R. Bag, “Melanoma diagnosis using deep learning and fuzzy logic,” Diagnostics, vol. 10, no. 8, pp. 577, 2020. [Google Scholar]
17. T. Majtner, S. Y. Yayilgan and J. Y. Hardeberg, “Optimised deep learning features for improved melanoma detection,” Multimedia Tools and Applications, vol. 78, no. 9, pp. 11883–11903, 2019. [Google Scholar]
18. C. Chen, W. Li, H. Su and K. Liu, “Spectral-spatial classification of hyperspectral image based on kernel extreme learning machine,” Remote Sensing, vol. 6, no. 6, pp. 5795–5814, 2014. [Google Scholar]
19. Y. Zhang, Y. Zhang, Z. Zhang, J. Bao and Y. Song, “Human activity recognition based on time series analysis using U-net,” arXiv: 1809.08113 [cs, stat], 2018, Accessed: Jun. 03, 2022. [Google Scholar]
20. S. Ye, S. Lu, X. Bai and J. Gu, “ResNet-Locust-bn network-based automatic identification of east asian migratory locust species and instars from rgb images,” Insects, vol. 11, no. 8, pp. 458, 2020. [Google Scholar]
21. P. G. Nieto, E. G. Gonzalo and J. P. Sánchez, “Prediction of the critical temperature of a superconductor by using the WOA/MARS, ridge, Lasso and elastic-net machine learning techniques,” Neural Computing and Applications, vol. 33, no. 24, pp. 17131–17145, 2021. [Google Scholar]
22. H. M. Lynn, S. B. Pan and P. Kim, “A deep bidirectional gru network model for biometric electrocardiogram classification based on recurrent neural networks,” IEEE Access, vol. 7, pp. 145395–145405, 2019. [Google Scholar]
23. L. Abualigah, A. Diabat, P. Sumari and A. Gandomi, “A novel evolutionary arithmetic optimization algorithm for multilevel thresholding segmentation of covid-19 ct images,” Processes, vol. 9, no. 7, pp. 1155, 2021. [Google Scholar]
24. N. C. F. Codella, D. Gutman, M. E. Celebi, B. Helba, M. A. Marchetti et al., “Skin lesion analysis toward melanoma detection: A challenge at the 2017 international symposium on biomedical imaging (ISBIhosted by the international skin imaging collaboration (ISIC),” in 2018 IEEE 15th Int. Symp. on Biomedical Imaging (ISBI 2018), Washington, DC, USA, pp. 168–172, 2018. [Google Scholar]
25. V. Rotemberg, N. Kurtansky, B. B. Stablein, L. Caffery, E. Chousakos et al., “A Patient-centric dataset of images and metadata for identifying melanomas using clinical context,” Scientific Data, vol. 8, no. 1, pp. 1–8, 2021. [Google Scholar]
26. J. Ding, J. Song, J. Li, J. Tang and F. Guo, “Two-stage deep neural network via ensemble learning for melanoma classification,” Frontiers in Bioengineering and Biotechnology, vol. 9, pp. 1–12, 2022. [Google Scholar]
Cite This Article
 Copyright © 2023 The Author(s). Published by Tech Science Press.
This work is licensed under a Creative Commons Attribution 4.0 International License , which permits unrestricted use, distribution, and reproduction in any medium, provided the original work is properly cited.
 Downloads
 Citation Tools