
 Submit a Paper
 Propose a Special lssue
 Open Access
ARTICLE

Gastrointestinal Diseases Classification Using Deep Transfer Learning and Features Optimization
1 College of Applied Computer Science, King Saud University (Almuzahmiyah Campus), Riyadh, 11543, Saudi Arabia
2 Department of Computer Science, HITEC University, Taxila, 47080, Pakistan
3 Department of Computer Engineering, HITEC University, Taxila, 47080, Pakistan
4 Department of Software Engineering, Foundation University Islamabad, Islamabad, 44000, Pakistan
* Corresponding Author: Awais Mahmood. Email:
Computers, Materials & Continua 2023, 75(1), 2227-2245. https://doi.org/10.32604/cmc.2023.031890
Received 29 April 2022; Accepted 04 August 2022; Issue published 06 February 2023
 View Full Text
 Download PDF
Abstract
Gastrointestinal diseases like ulcers, polyps’, and bleeding are increasing rapidly in the world over the last decade. On average 0.7 million cases are reported worldwide every year. The main cause of gastrointestinal diseases is a Helicobacter Pylori (H. Pylori) bacterium that presents in more than 50% of people around the globe. Many researchers have proposed different methods for gastrointestinal disease using computer vision techniques. Few of them focused on the detection process and the rest of them performed classification. The major challenges that they faced are the similarity of infected and healthy regions that misleads the correct classification accuracy. In this work, we proposed a technique based on Mask Recurrent-Convolutional Neural Network (R-CNN) and fine-tuned pre-trained ResNet-50 and ResNet-152 networks for feature extraction. Initially, the region of interest is detected using Mask R-CNN which is later utilized for the training of fine-tuned models through transfer learning. Features are extracted from fine-tuned models that are later fused using a serial approach. Moreover, an Improved Ant Colony Optimization (ACO) algorithm has also opted for the best feature selection from the fused feature vector. The best-selected features are finally classified using machine learning techniques. The experimental process was conducted on the publicly available dataset and obtained an improved accuracy of 96.43%. In comparison with state-of-the-art techniques, it is observed that the proposed accuracy is improved.Keywords
Gastric problems are increasing in the world with the increase in the population because Gastrointestinal Tract (GI Tract) cancer is developing rapidly in people around the globe. On average, every year 0.7 million cancer cases are reported in the world [1]. Along with GI cancer, ulcer development in the GI tract is also a major disease. As the [2] reported that highest annual prevalence of ulcers recorded in Spain was 141.9 per 100,000 people and the lowest was 57.75 in Sweden. A major age-wise increase in gastric disease prevalence is also observed in developing countries. Stats showed that a 10% increase is observed between the age of 18 to 29 years, 27% between the age of 30 to 39 years, and 48% between the ages of 60 to 69 years [2,3].
One of the main causes of gastrointestinal ulcers is helicobacter pylori bacteria which also lead to the development of gastrointestinal cancer [4,5]. A study done in 2020 revealed that more than 50% of the world population is inhabited by the H. Pylori bacteria but only a limited number of people suffer from active disease because of many factors like gender, age, smoking habit, and crowding [3,6–8].
The gastrointestinal tract can be classified into many parts like the esophagus, which is an upper stomach part, the main stomach in mid, the duodenum at the end of the stomach, the small bowel, colon, and rectum [9]. The endoscopic method helps the physician monitor and detect gastrointestinal abnormalities in their early stages to cure them with appropriate treatment. The latest technique called wireless capsule endoscopy (WCE) [10] enables doctors to see inside the stomach, an area that was very difficult to reach in traditional endoscopy. In wireless capsule endoscopy, patients swallow the camera-containing capsule which captures thousands of images as it passes through the GI tract. These images are stitched together to form a video which is then analyzed by the doctors (Expert Gastrologist) to find deformities. This manual method takes 2–3 h on average, so researchers are developing different automated methods [11,12].
Computer vision researchers have employed different machine learning and deep learningmethods for automated recognition of endoscopic diseases using WCE images [13,14]. The method typically starts with preprocessing steps like augmentation, and contrast enhancement, and then features are extracted from images which are passed to the next stage for classification of abnormalities. Transfer learning is an approach used by researchers to improve learning by transferring information from the related domain [15]. In the machine learning domain, the weights of a model trained on another data are utilized to fine-tune the model on the given data. It is shown by researchers that a model which is fine-tuned by a transfer learning approach provides better results than the model which is trained from the scratch [16,17].
Many researchers have employed different machine learning and deep learning methods for the classification of endoscopic diseases like [13] developed a matrix of features by applying different techniques and then applied Support Vector Machine (SVM), Decision Trees, and Neural networks. The Maximum achieved accuracy by applying these methods is 93.64%. Similarly in another paper [14] authors applied recurrent attention neural network and got an accuracy of 90.85%.
Various techniques have been developed for the classification of GI diseases, but many challenges are still not properly addresses. The main challenges in classifying the GI disease are less availability of annotated images and the second lack of similarity in shape, texture, and sizes across the images of the same class. Therefore, in this paper, we have employed Mask R-CNN for gastrointestinal disease localization and then these images are passed to two models ResNet-50 and ResNet-152 for features extraction. The features are then optimized using Ant Colony Optimization Algorithm and used for gastrointestinal abnormalities classification. Pre-trained models are used as it is displayed in past directed explores that calibrating and fine-tuning a pre-trained model out-plays the model trained from scratch [16–18].
The main contributions of this paper are as follows:
• Localization of gastrointestinal disease from images by training Mask R-CNN.
• Fine Tuning of deep neural network ResNet-50 using deep transfer learning by adding additional layers on top of it.
• Fusing the features of both models i.e., ResNet-50 and ResNet-152 for deep classification.
• Features optimization of fused features using improved Ant Colony Optimization Algorithm.
• Comparison of existing techniques with other trained deep neural networks as well as traditional techniques.
The organization of the remaining paper is as follows: Part 2 explains appropriate literature, Part 3 shows the dataset, Part 4 clarifies the proposed methodology, Part 5 elucidates results and at the end, in Part 6 we have concluded the paper.Recently, many different techniques have been proposed by researchers for the classification of gastrointestinal diseases in which two basic approaches are used. One approach is based on machine learning in which hand-crafted features are extracted and then the model is built on its basis. Another approach is based on deep learning in which a machine extract features by itself and builds a model on them.
Authors’ of [19] used logistic regression and ridge regression for the development of a machine learning model which was built on the dataset collected from 854 patients and got an accuracy of 82.6% and 83.3%. A fully automated system was developed in [20] where features extraction, features fusion, and robust features were employed for gastric infection detection. The system was trained on hand-crafted and deep Convolutional Neural Network (CNN) features which were extracted from the Kvasir dataset, CVC-ClinicDB, Private, and ETIS- LaribPolypDB. These features were fused, and the system got an accuracy of 96.5%. A technique is proposed in [13] in which color features were used for the detection of ulcers and bleeding by utilizing private WCE images dataset. Authors also employed texture features along with other hand-crafted features and developed a single matrix. Different classifiers like support vector machine, decision tree, and neural network utilized these features to develop a model which achieved maximum accuracy of 93.64%. A four-step computer-aided methodology [11] is employed to detect gastrointestinal diseases from the WCE images dataset which contains nine thousand samples of ulcers, bleeding, and healthy. In the first step, using hue, saturation, intensity (HIS) transformation, color transformation is performed then active contour segmentation is implemented. After the first two steps, the saliency-based method is performed on color space, and at last local binary pattern (LBP), and gray-level co-occurrence matrix (GLCM) features are fused. Finally, using a neural network, classification is done on extracted features.
A deep learning-based approach was proposed by the authors of [21] for the classification of gastrointestinal diseases like ulcers, polyps, and bleeding. The authors’ used a pre-trained model ResNet101 and fine-tuned it by utilizing the grasshopper approach of features optimization. Min-distance was used as a fitness function. A transfer learning approach where visual geometry group neural network (VGGNet), a deep learning-based model is used for the classification of gastrointestinal diseases [22]. Dataset for this model consisted of 854 images and it achieved a maximum accuracy of 86.6%. In [23], the authors’ proposed a gaussian dynamic time warping pooling network (GDPNet) model to detect different types of gastrointestinal diseases like ulcers, polyps, and erosions. This model is based on a deep convolutional network, and it achieved maximum accuracy of 88.9%. Fan et al. [24] proposed a deep learning model which was based on AlexNet to train on an image database. The authors used different performance parameters like accuracy, sensitivity, and specificity and achieved the results of 95.16%, 96.80%, and 94.79% respectively. However, AlexNet architecture shows poor results in classifying poor or low-quality images. A model based on a deep convolutional neural network that employed pre-trained VGGNet, residual neural network (ResNet) and Inception is proposed in [25]. The model is trained on 787 images, out of which 367 images are of cancer, 220 images are of ulcers and the remaining 200 are normal images. The model got maximum accuracy of 77.1% and a ROC curve of 0.85 to 0.95. In [26] paper preprocessed the kvasir images for enhancement and noise removal and then passed them through three neural networks AlexNet, ResNet-101, and GoogleNet for training. This technique achieved maximum accuracy of 97%. The literature summary is shown in Table 1.
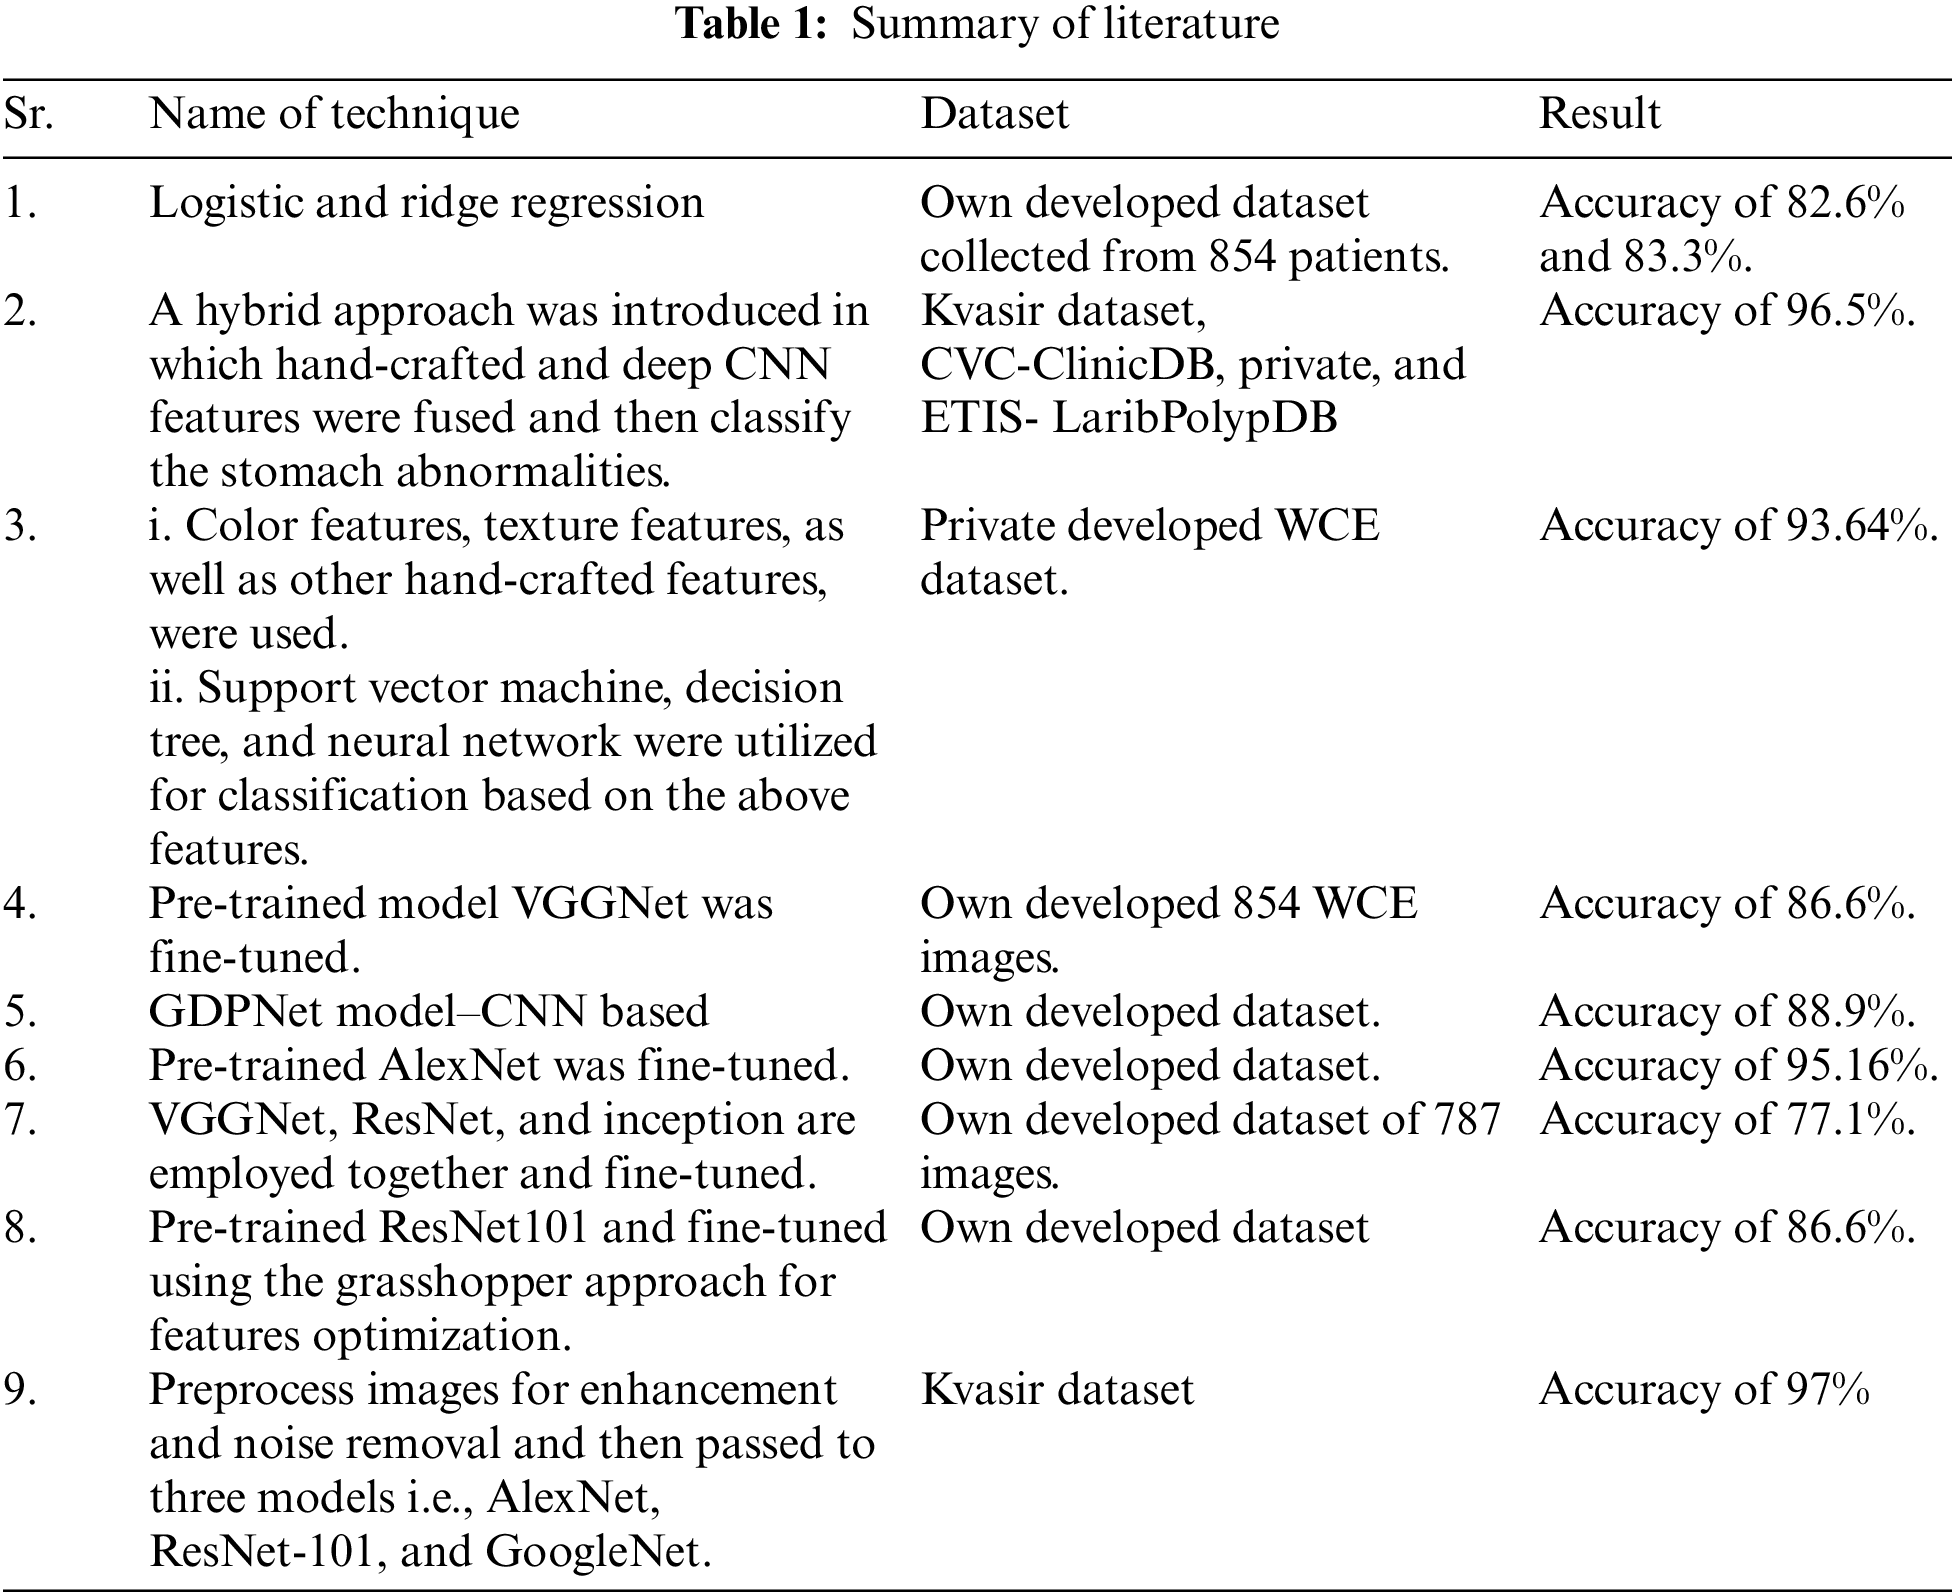
It is evident from the above literature that researchers are exploring the field by using different machine learning and deep learning techniques but most of them are utilizing their own developed images dataset. Only a few researchers utilized the Kvasir dataset, so there is a need to additionally investigate this area of research.
For this research, we have used the Kvasir dataset [25]. Kvasir dataset contains annotated images that are duly verified by the practitioners. This dataset consists of 8 classes which are dyed-lifted-polyps, dyed-resection-margins, esophagitis, normal-cecum, normal-pylorus, normal-z-line, polyps, and ulcerative-colitis. All of these classes belong to pathological findings and anatomical landmarks in the GI tract. Z-line, pylorus, and cecum belong to anatomical landmarks moreover esophagitis, polyp, and ulcerative colitis belongs to pathological findings. A total of 4500 images are available in the dataset and for each class, 500 images are present. Images are adequate to be used for classification using a machine or deep learning [25]. The resolution of images in this dataset is varied from 720 * 576 to 1920 * 1072 pixels. A preview of anatomical landmarks is shown in Fig. 1 and pathological findings are shown in Fig. 2.
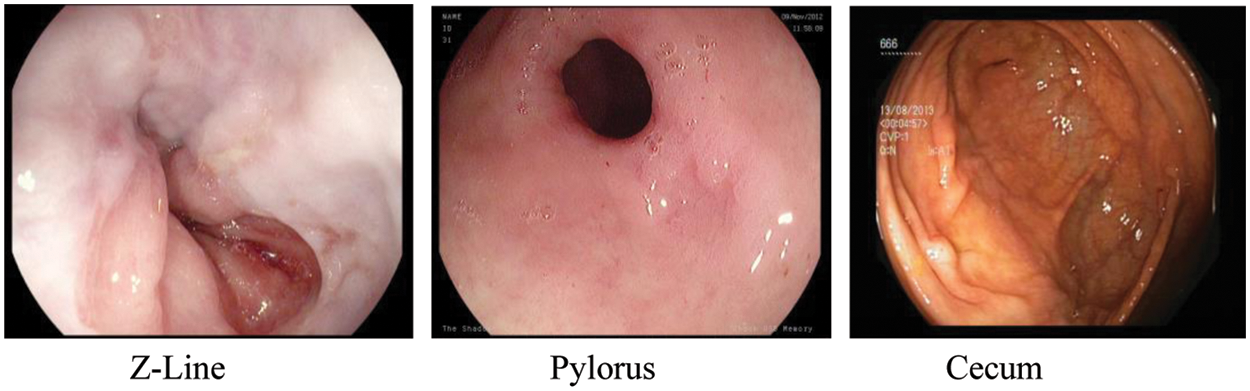
Figure 1: Anatomical landmarks
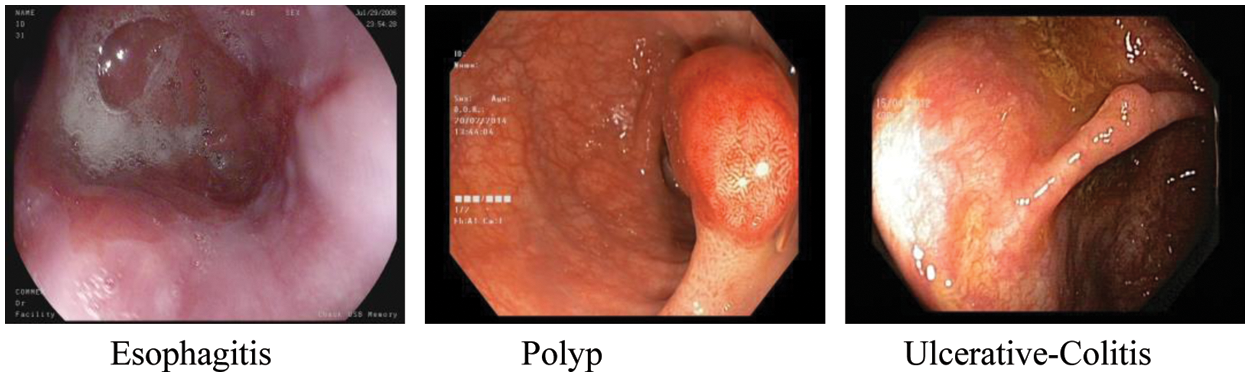
Figure 2: Pathological findings
Esophagitis is the contamination of the throat. It is for the most part brought about by the condition in which gastric corrosive streams back to the throat.
Polyps are wounds inside the bowel noticeable as mucosal extends. These can be level or raised and can develop into cancer. Polyps are ordinarily innocuous and can be diagnosed when specialists are analyzing patients for different issues.
Ulcerative colitis is an enduring demagogic infection that influences the large bowel of the lower intestine. It tends to be a destructive infection.
Z-Line marks the transition spot between the stomach and esophagus. It is beneficial as a locus factor for recognizing pathology withinside the esophagus.
Pylorus is a region around the opening from the stomach to the initial segment of the little bowel also called the duodenum.
The cecum is the closest piece to the enormous bowl. One of the fundamental and trademark features of the cecum is the appendiceal cavity.
These are the Polyps that are elevated by infusion of saline, a combination of water and salt, and indigo carmine, a corrosive sodium salt.
The Resection-Margins are vital to evaluate regardless of whether a polyp is eliminated. Leftover polyp tissues can transform into harmful development.
The methodology of our proposed framework is shown in Fig. 3 in which we have applied Mask R-CNN on the data and performed localization of diseases. After the first step, pre-trained ResNet-50 and ResNet-152 models are fine-tuned, and features are extracted from both models. These features are then fused, and an optimization technique is applied to these features. Deep classification is applied to optimized features.
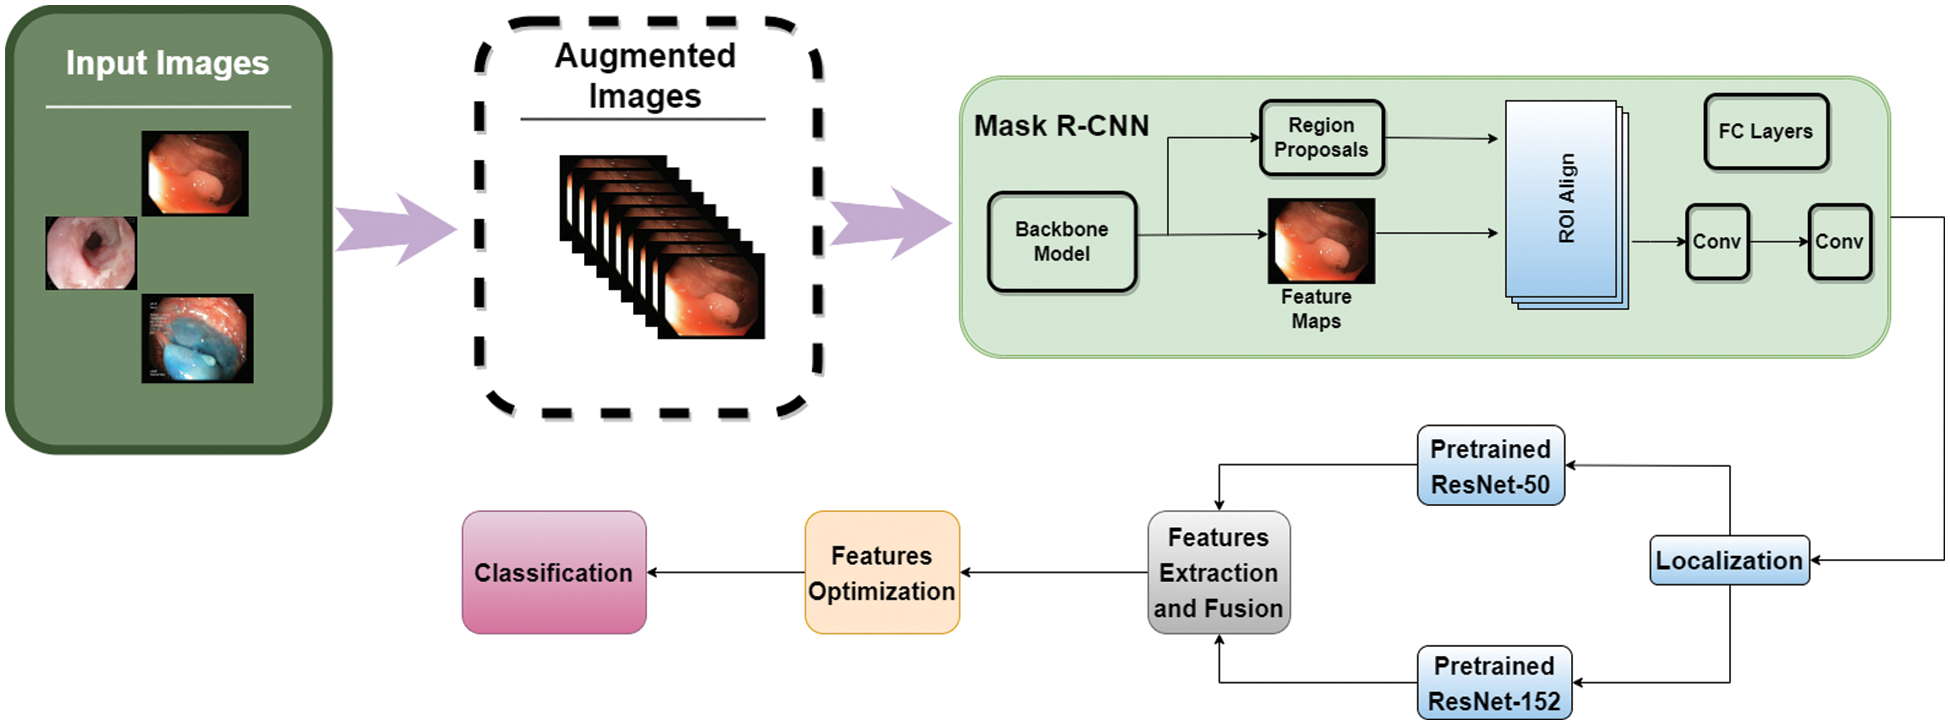
Figure 3: Proposed methodology
For the first step, after loading the dataset, images were divided into training and testing examples in the ratio of 80% and 20%. Then, we used data augmentation on the images by applying random transformations so that model doesn’t see similar images twice which generalizes the model in a better way and prevents overfitting. The major transformations we applied are rotation with value 20, shifting width with 0.2 and 0.3 values, shifting height, zoom-in and out, shear transformation, rescaling, and horizontal and vertical flip.
After data augmentation, images are passed to the mask R-CNN for performing localization of disease from each image. The architecture of Mask R-CNN is shown in Fig. 4. The main advantage to use this model is that it adopts the two stages of R-CNN, first is a Region Proposed Network (RPN) which provides the bounding boxes of candidate objects in the image and the second stage extracts features with the help of ROIPool from each bounding box and performs classification as well as regression of bounding-box. Mask R-CNN uses the second layer correspondingly and in addition to this, Mask R-CNN also provides the binary mask for every ROI. The backbone architecture we used for Mask R-CNN is ResNet-101 as it is evident from research that it outperforms the state-of-the-art architectures [27].
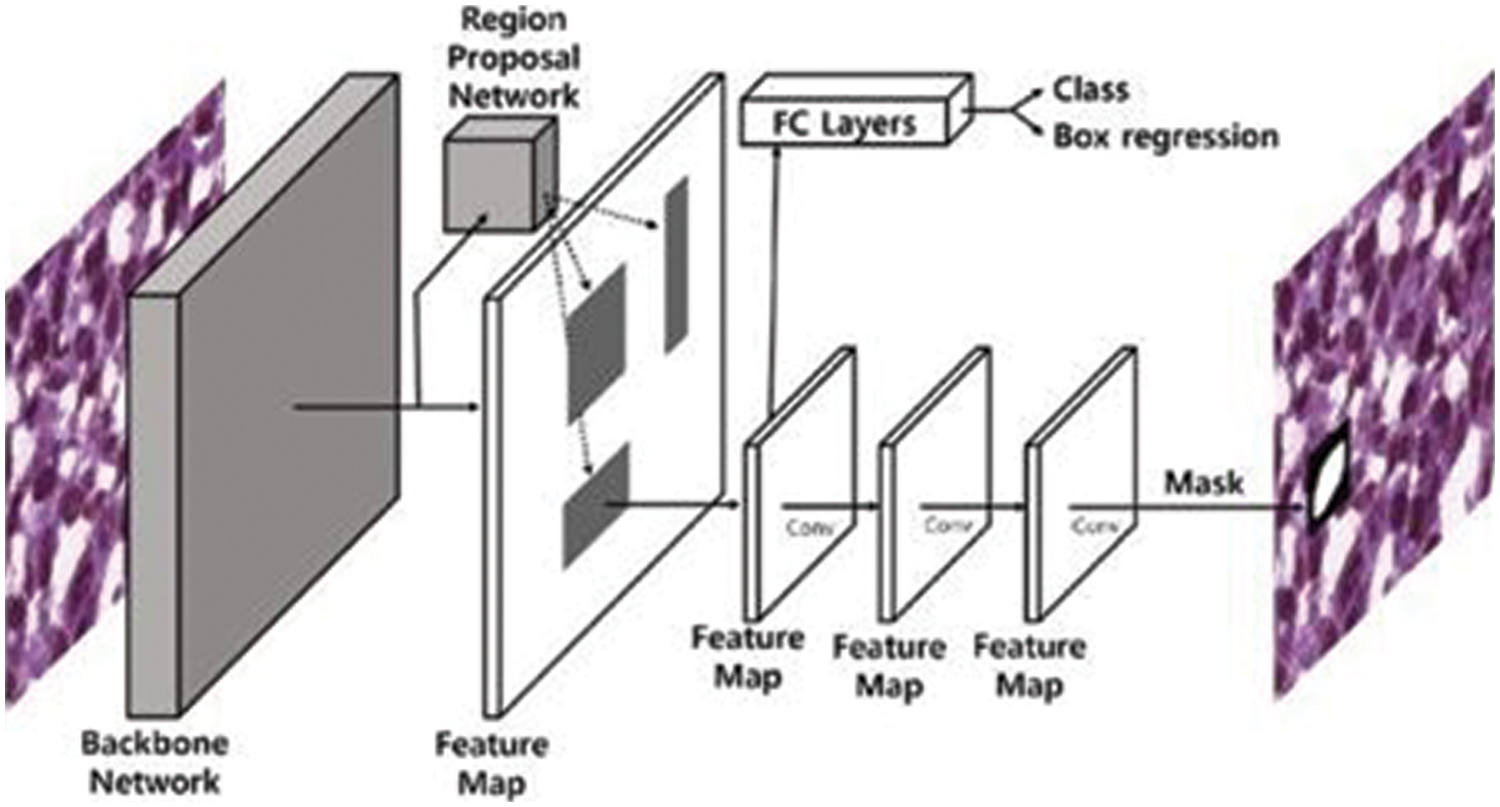
Figure 4: Mask R-CNN architecture [28]
The localized images are then passed to pre-trained models ResNet-50 and ResNet-152 for extraction of features. The architecture of the ResNet-50 model shows that it has convolutional layers, max-pooling layers, and a fully connected layer. This model is trained on the ImageNet dataset and can classify images into 1000 categories [29]. The architecture of the model is shown in Fig. 5.
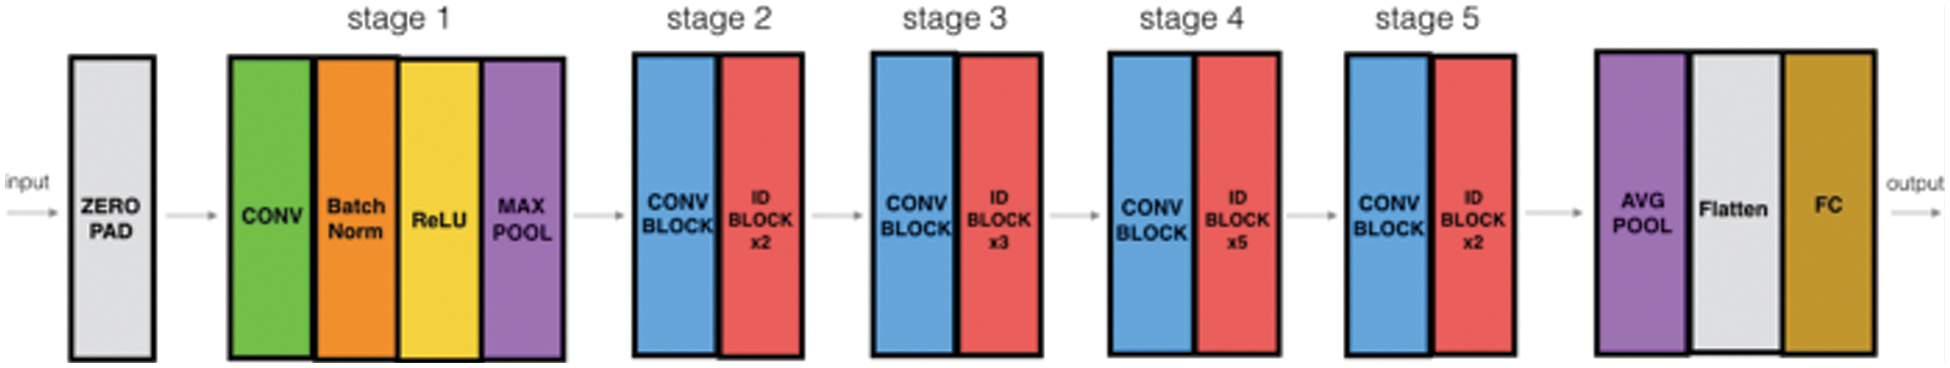
Figure 5: ResNet-50 architecture [30]
This is a 50-layered model with more than 23 million trainable parameters. After selection of the pre-trained Resnet-50 model, we have removed the top fully connected layer which was used for classification, and added 1 fully connected layer with 1000 neurons and relu as an activation function, to reduce over-fitting 1 dropout layer with 0.5 probability value, another fully connected layer with 500 neurons and relu as an activation function, 1 max-pooling layer with 2 * 2 filter, another dropout layer with 0.2 probability, and at last 1 fully connected layer for features extraction. This modification revamped the model to a novel model. It also helps in extracting deep residual features and moving the features from the previous classification layer to the latter added layers. Subsequently, we trained the network by providing the Kvasir data of 4,500 images for fine-tuning and adjusting weights according to the dataset provided.
ResNet-152 is another model we have used for the extraction of features using the concept of transfer learning. We have loaded this pre-trained model which was trained on the ImageNet dataset and fine-tuned it using the Kvasir dataset. The extracted features are from the average pooling layer of ResNet152 which are just before the classification layer. The architecture of ResNet-152 is shown in Fig. 6.
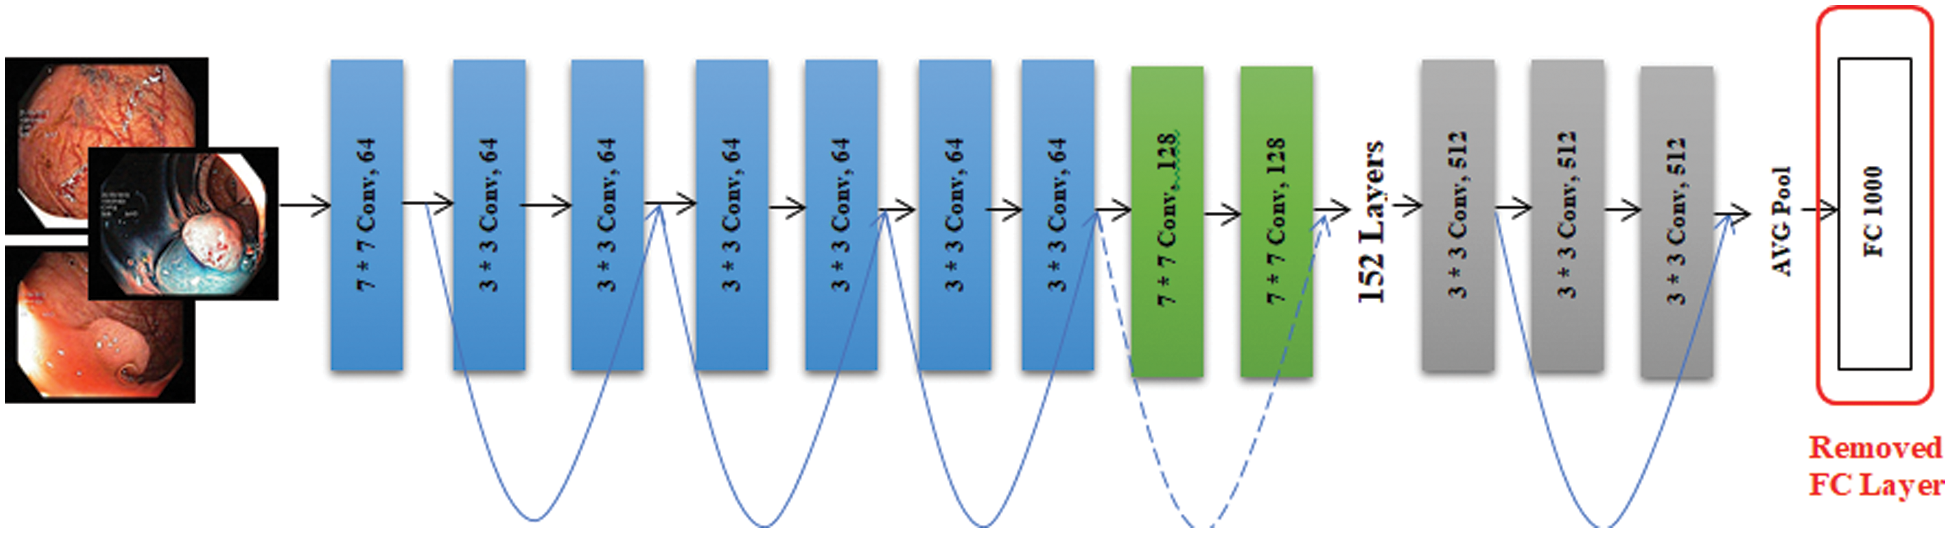
Figure 6: ResNet-152 architecture
Extracted features from both models i.e., ResNet-50 and ResNet-152 are combined and fused. As features of both models are fused, there are chances that features may get duplicated and redundant features are used for classification due to which computational cost increases. Therefore, for features optimization, ACO (Ant Colony Optimization) is used. For an original set of J features, the subset is identified which contains K features in such a way that K < J. The local important features are extracted using mutual information and information gain. These local important features are then used for deep classification using a dense layer with SoftMax activation.
Experimental settings of the model are shown here for reproducibility. For training purposes, we used a stochastic gradient (SGD) optimizer, which proves itself efficient and effective in recent advances in deep learning [31] with a learning rate of 0.001 and momentum of 0.9. It is a way to minimize the objective function of model parameters by updating the parameters in the opposite direction of the objective functions’ gradient. For each training example x(i) and its label y(i), a stochastic gradient updates the parameters [32]. Momentum is used for decreasing high variance in SGD and smoothing the convergence. It helps in convergence towards the right direction and decreasing the variation to the wrong or irrelevant direction. The convergence equation of stochastic gradient (
Categorical cross-entropy is used as a loss function. The loss function is used during the training of neural networks for adjusting weights to build a better fitting model. A loss function calculates the error or penalty for the deviation between the target output variable and the model’s output [34]. The equation of categorical cross-entropy
We have trained the model on 150 epochs and for each epoch batch size was 50. Steps per epoch were calculated by dividing the length of training data by batch size. The ultimate objective of our research was to get as many accurate predictions on unseen images as possible.
The experiment is conducted on Kera’s having TensorFlow at the backend using Python. When the training is conducted, it is perceived that accuracy gets steadied after 110 epochs and remained approximately similar till 150 epochs. When other optimizers are used instead of stochastic gradient, like adagrad, adam, and gradient descent, the training accuracy was not achieving prominent results even after increasing epochs, and validation accuracy also decreased. Similarly, when momentum and learning rate was changed, the training, as well as validation accuracy, got high fluctuations and a major gap showed between training and validation accuracy.
When the batch size was changed, no prominent difference in accuracy was noticed but the time taken for the model to train gets varied. Similarly, when the steps per epoch changed, variation in training time is observed however no prominent change in accuracy was observed.
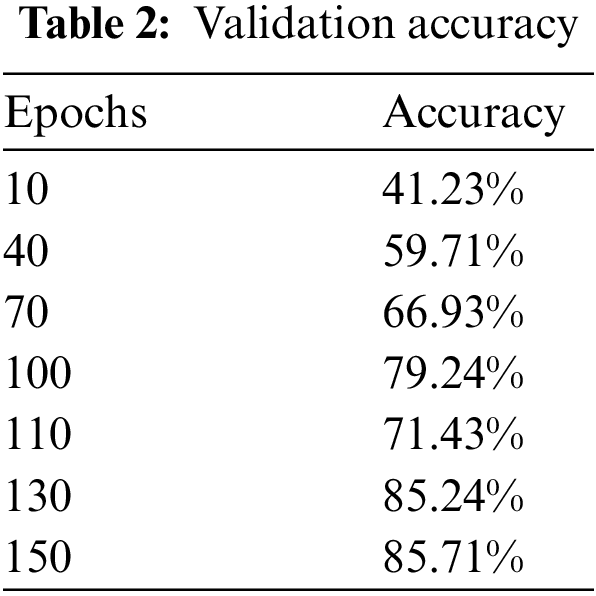
When the additional layers that we applied on the top of the model were removed and tested on the model on just ResNet-50 by applying a fully connected layer at the top for classification with SoftMax activation, maximum validation accuracy was dropped to 85.71%. Fig. 7 and Table 2 show validation accuracy results of the ResNet-50 model.
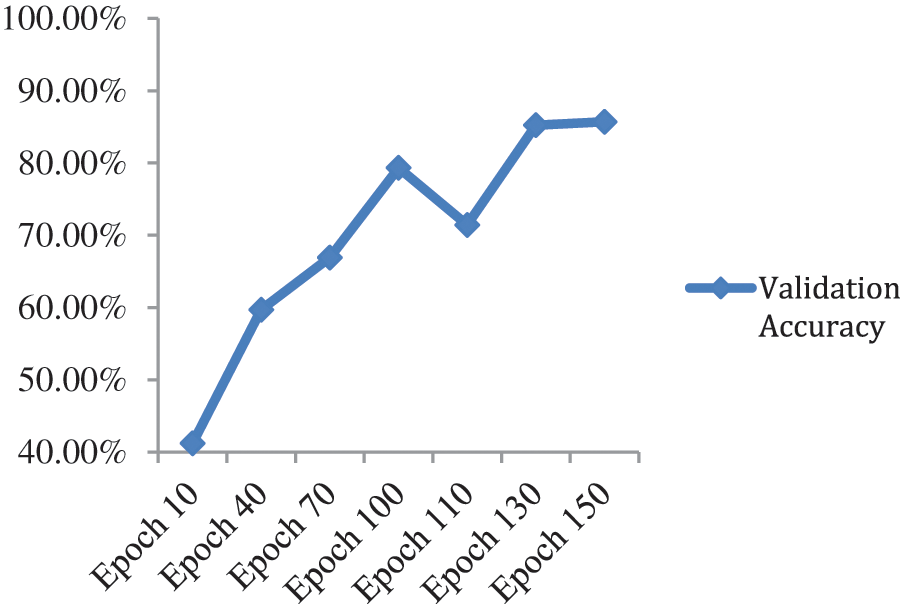
Figure 7: Validation accuracy per epochs of ResNet-50 model
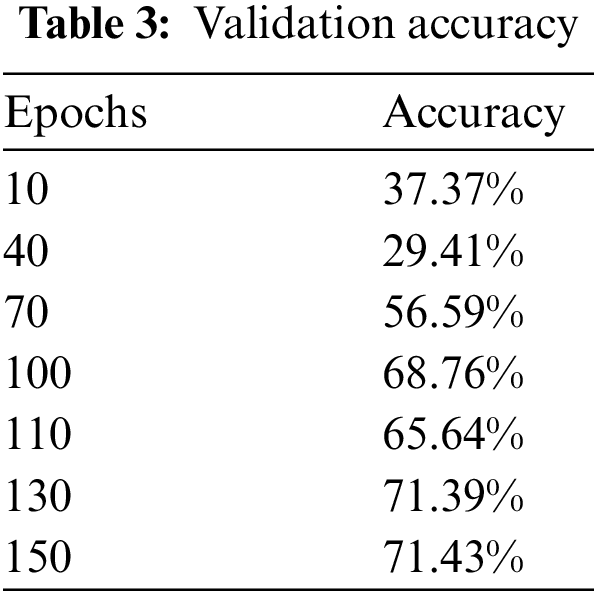
When we added one drop-out layer with 0.5 probability and one fully connected layer with 1000 neurons, maximum validation accuracy drastically reduced to 71.43% from 85.71% as shown in Fig. 8 and Table 3.
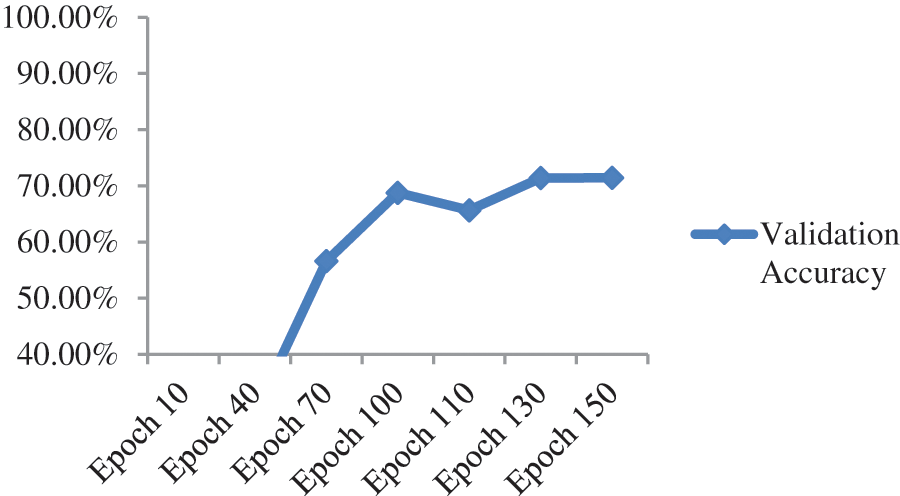
Figure 8: Validation accuracy per epochs of ResNet-50 model with additional dense and dropout layer
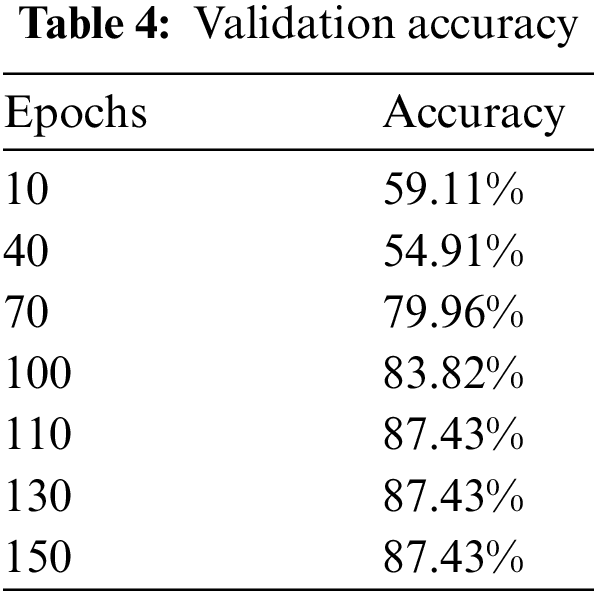
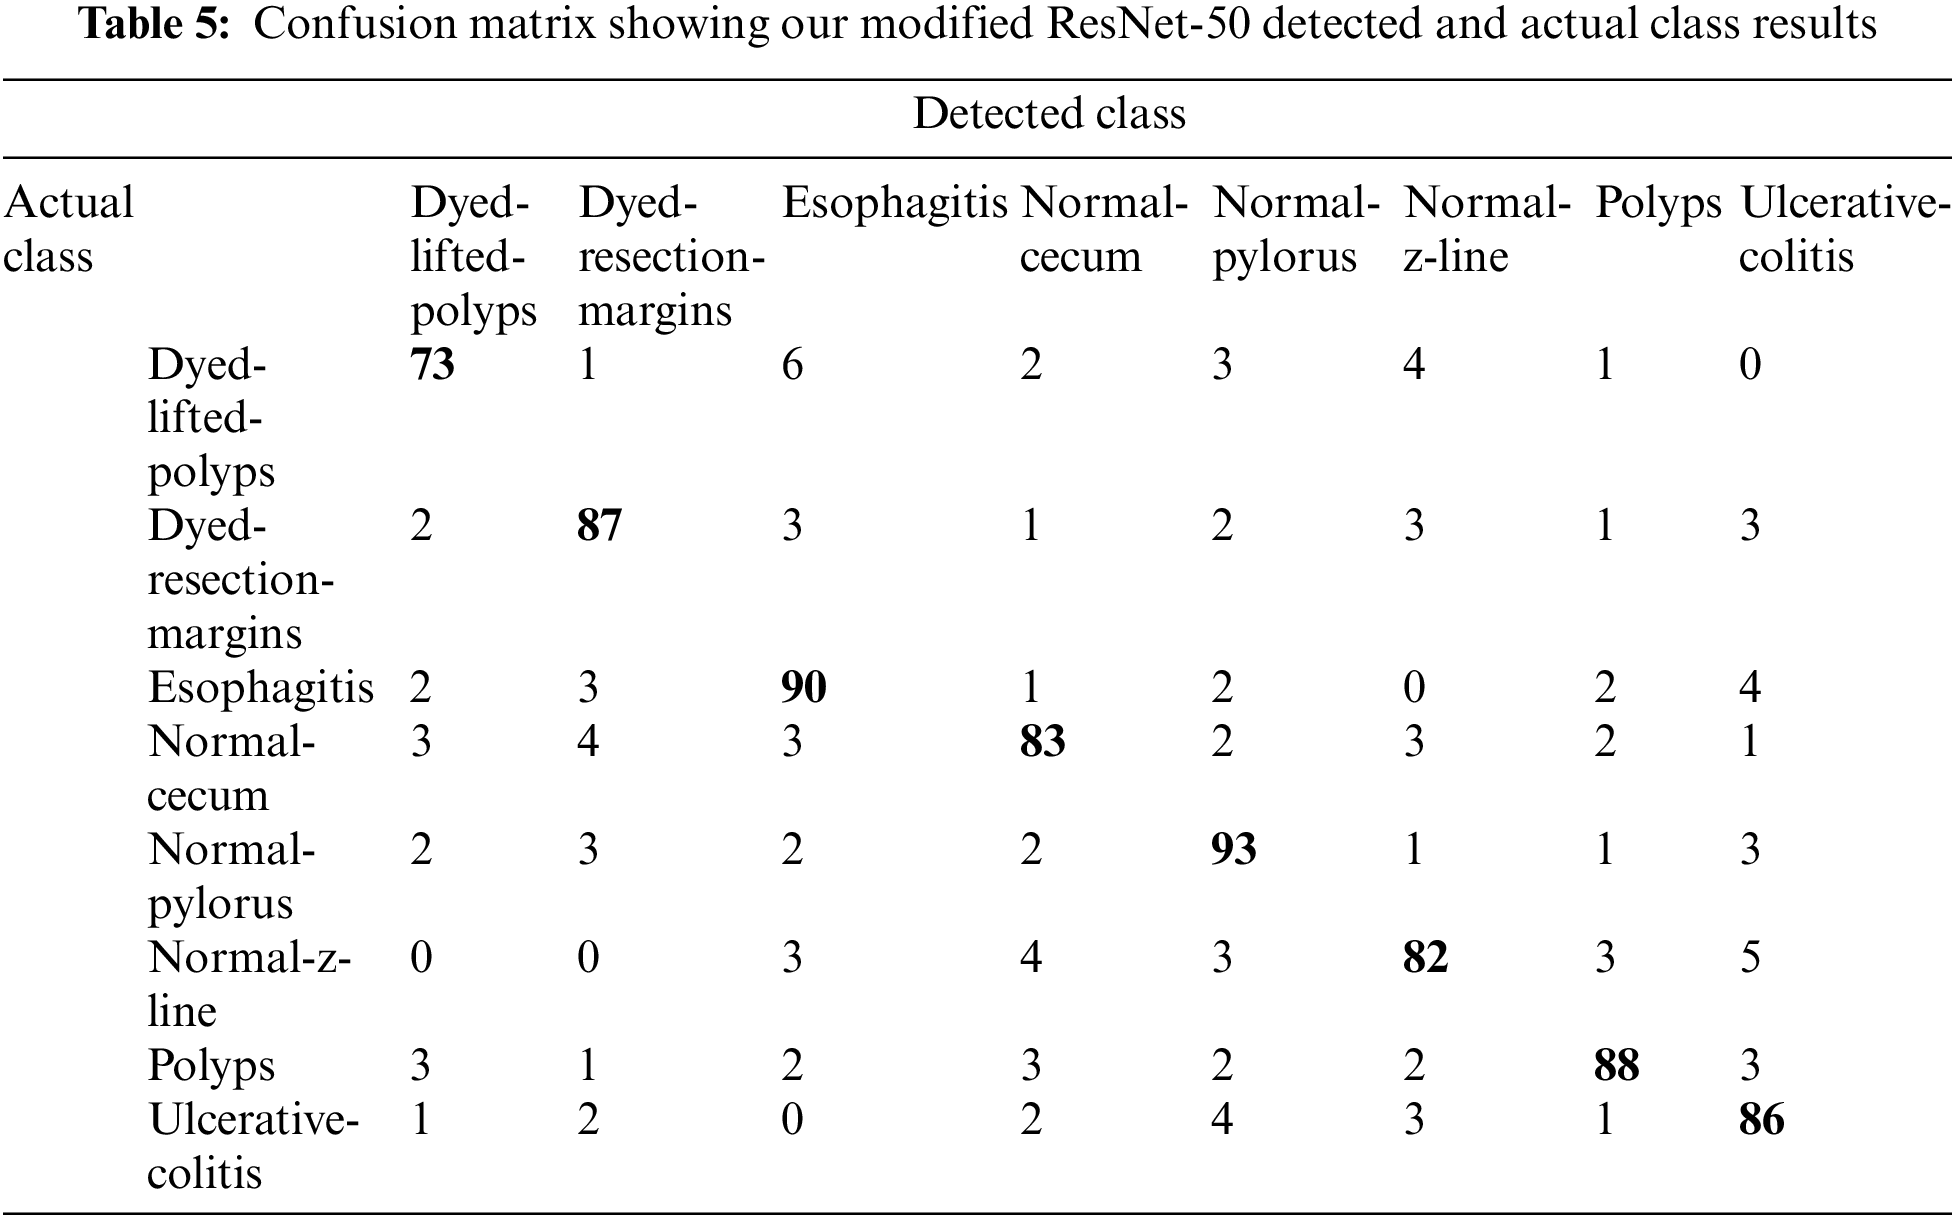
Upon training our described ResNet-50 model with additional layers which have a max-pooling layer too, validation accuracy jumped to 87.43% as shown in Fig. 9 and Table 4 so we used this model as it shows much better accuracy. The confusion matrix for the given model is shown in Table 5. As we added more different layers to our proposed model, validation accuracy got decreased and dropped below 80%.
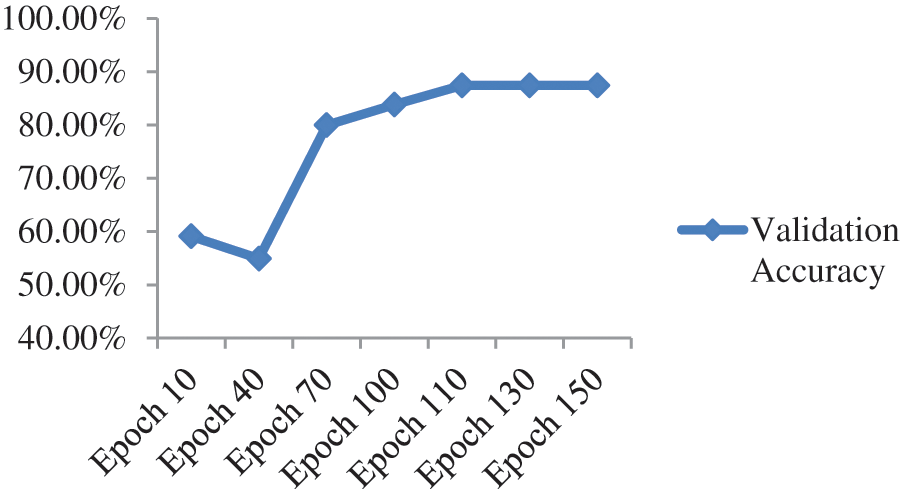
Figure 9: Validation accuracy per epochs of our modified ResNet-50
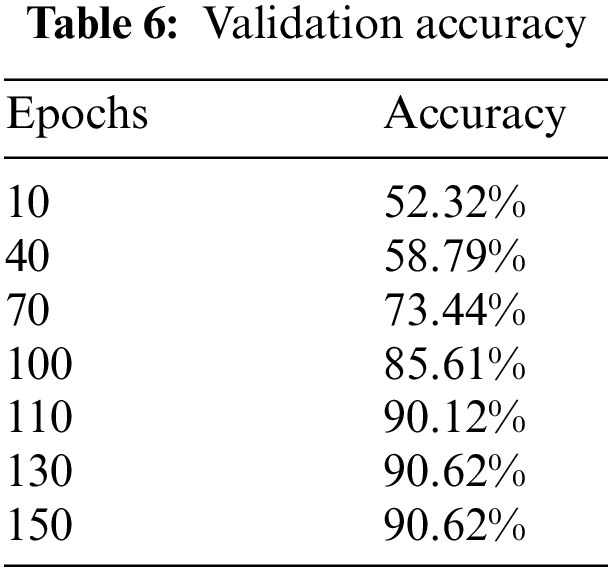
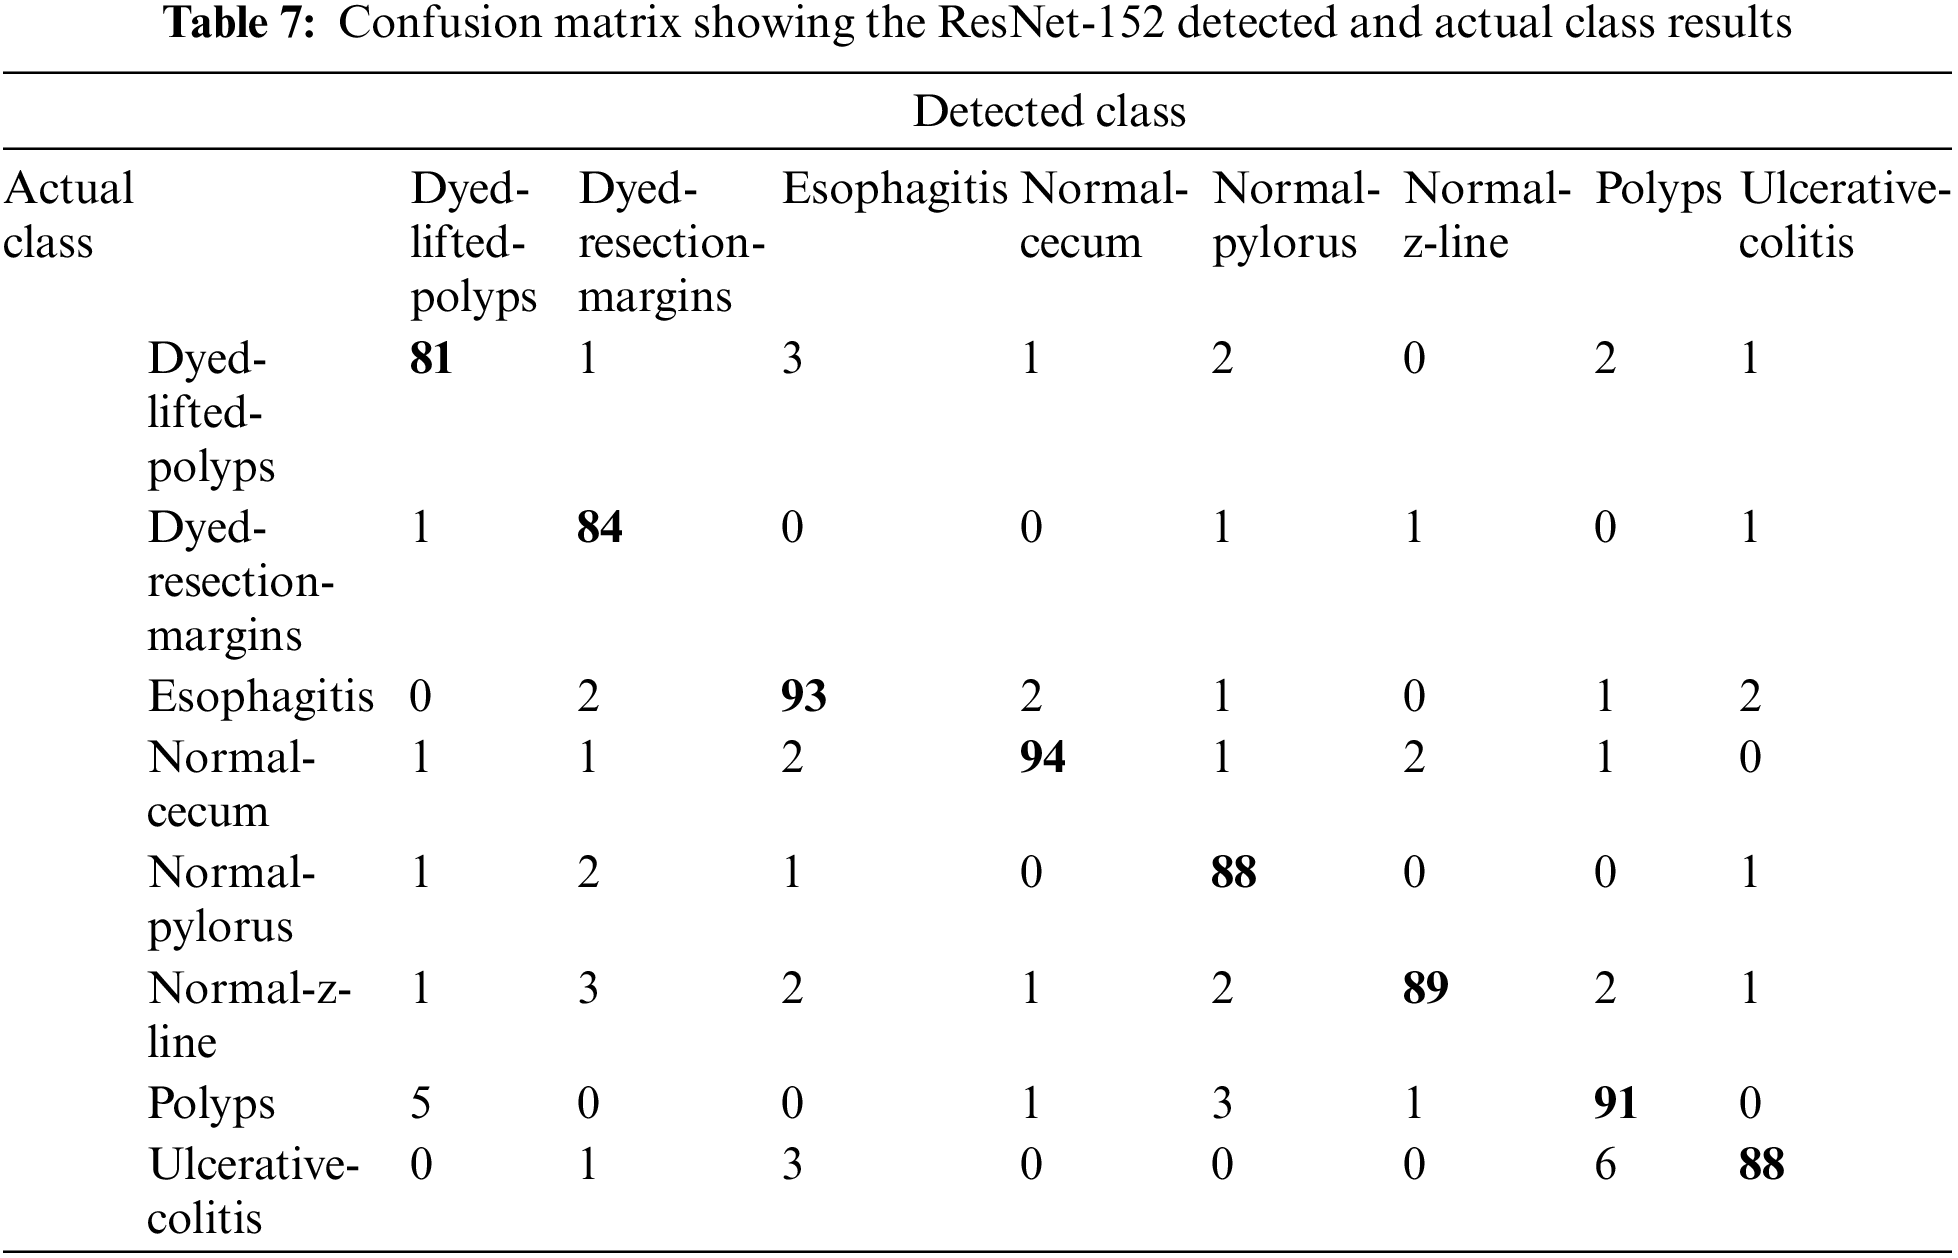
Upon training ResNet-152, a residual-based network like ResNet-50 but with 152 deep layers, the performance of the model got better with the epochs as evident from Fig. 10 and Table 6. Initially, in the first 10 epochs, the achieved accuracy was 52.32% which was not up to the mark but as the epochs moved near to and above the 100 counts, vast improvement is shown as accuracy started jumping above 84%. The model achieved the maximum accuracy of 90.62% in the given dataset. The experimental settings were the same for training this network as ResNet-50. A confusion matrix is also provided in Table 7 to help check the misclassification rate of each class. Moreover, when we tried to stacked-up additional layers on top of this model, no major improvement in performance in term of accuracy were shown.
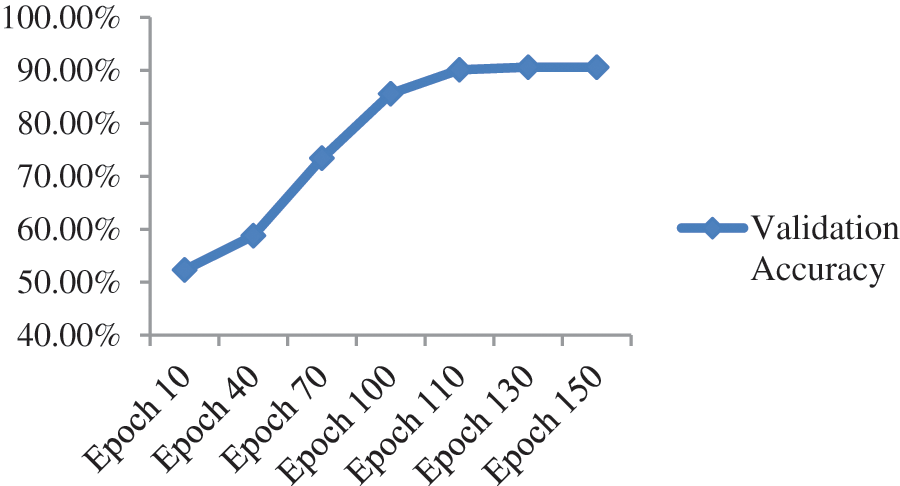
Figure 10: Validation accuracy per epoch of ResNet-152
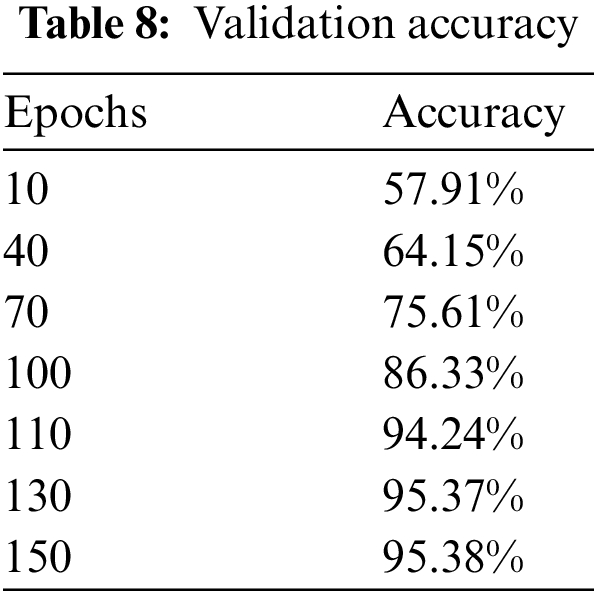
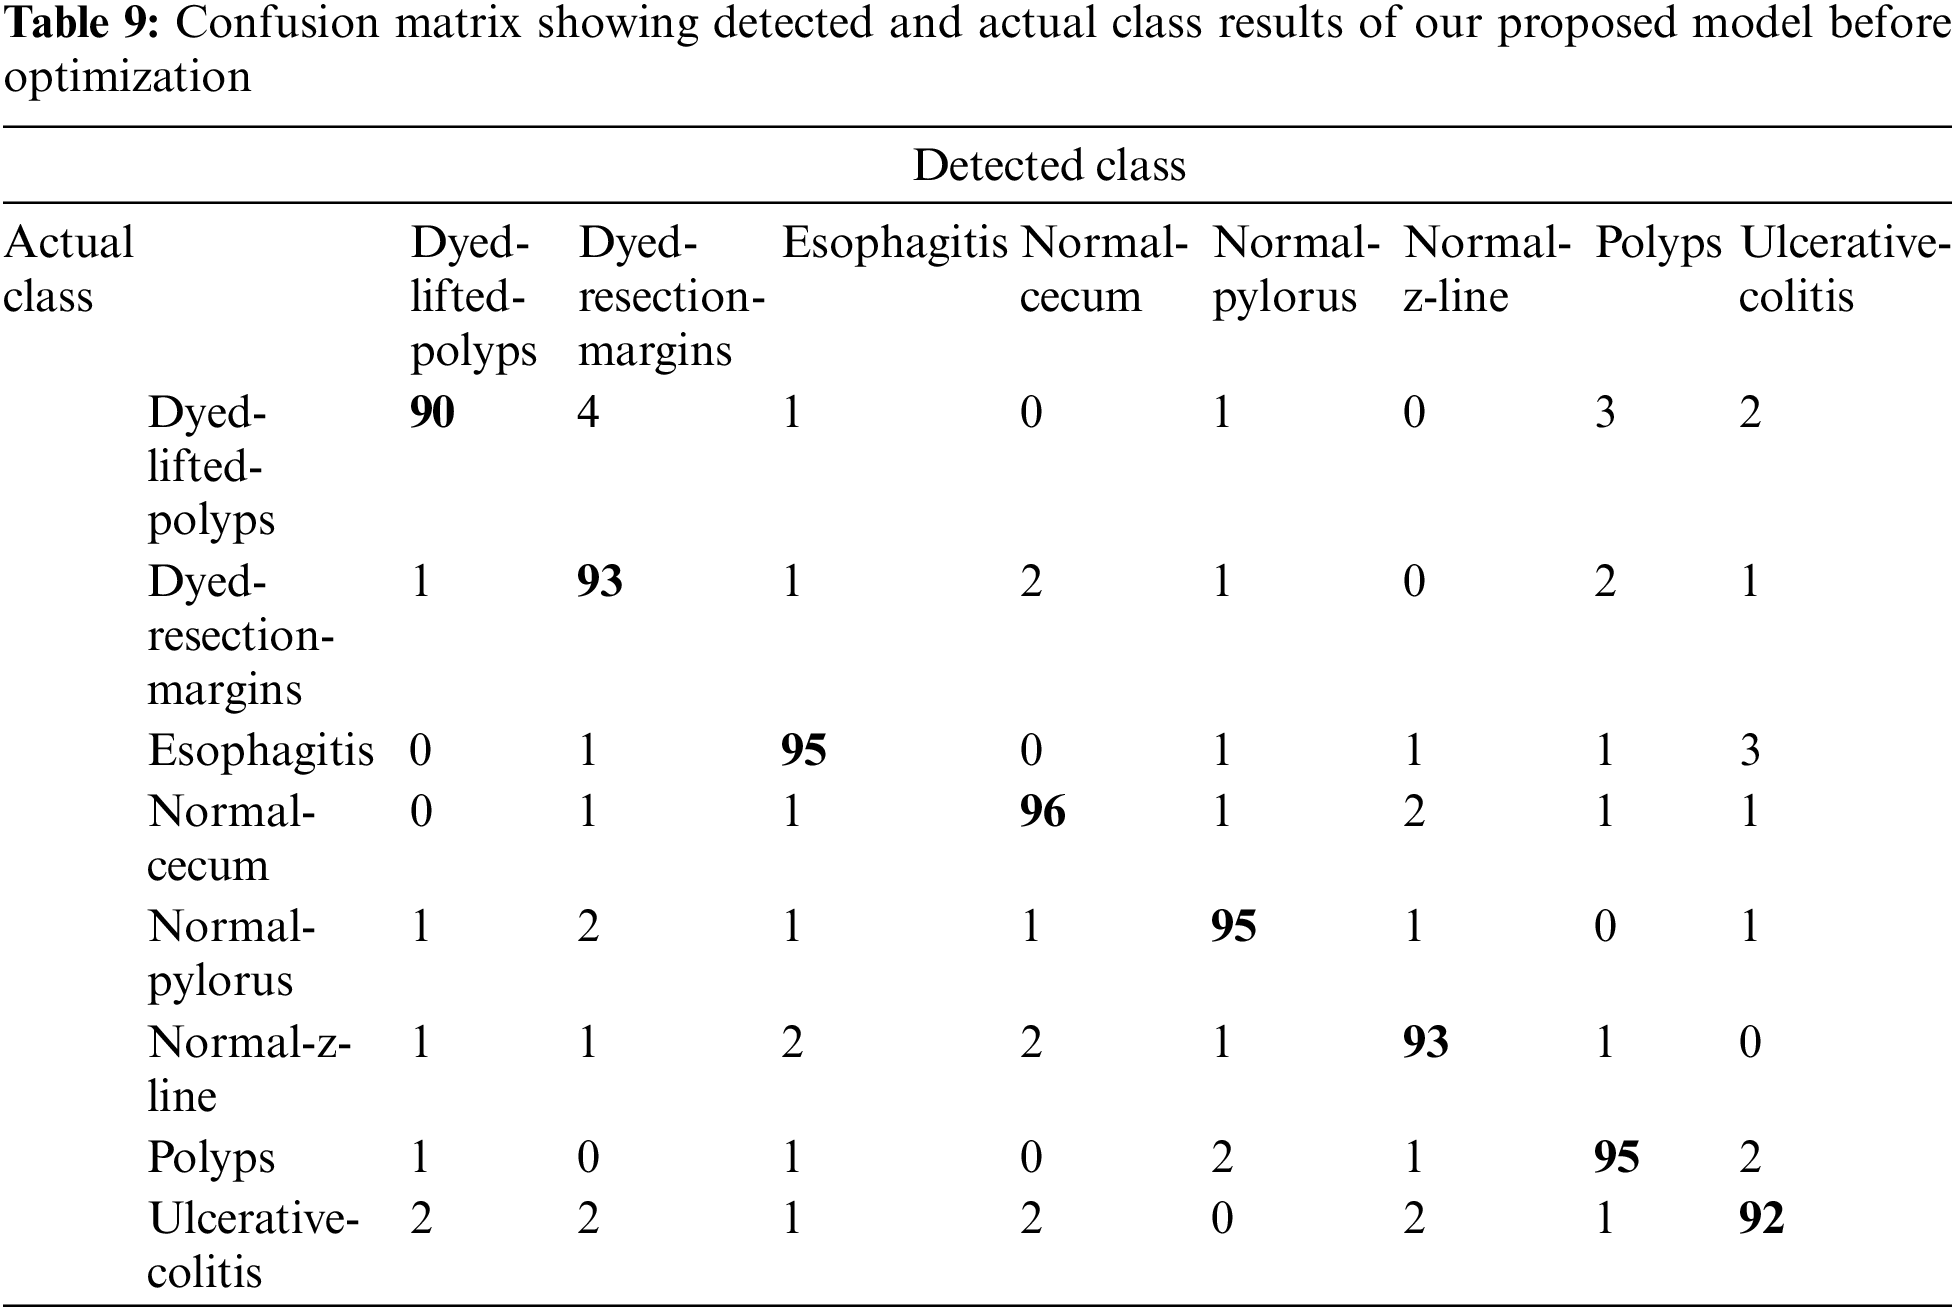
When the features of both models are fused, it is evident from Fig. 11 and Table 8 that classification accuracy is improved and showed much better performance than individual models. The accuracy after merging the two models jumped to 95.38%. To check the misclassification rate in individual labels, we have presented the confusion matrix as shown in Table 9.
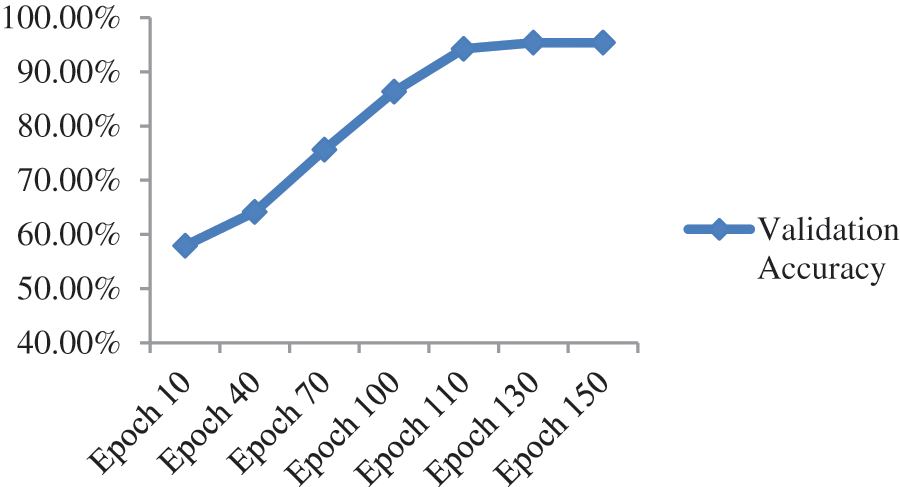
Figure 11: Validation accuracy per epoch of our proposed model before optimization
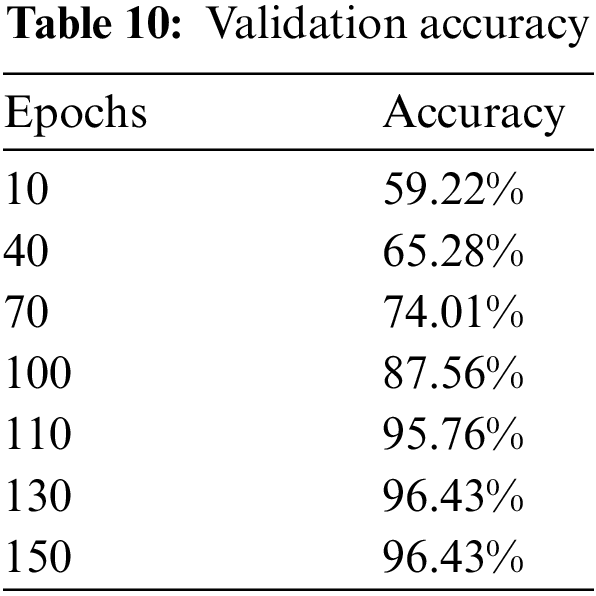
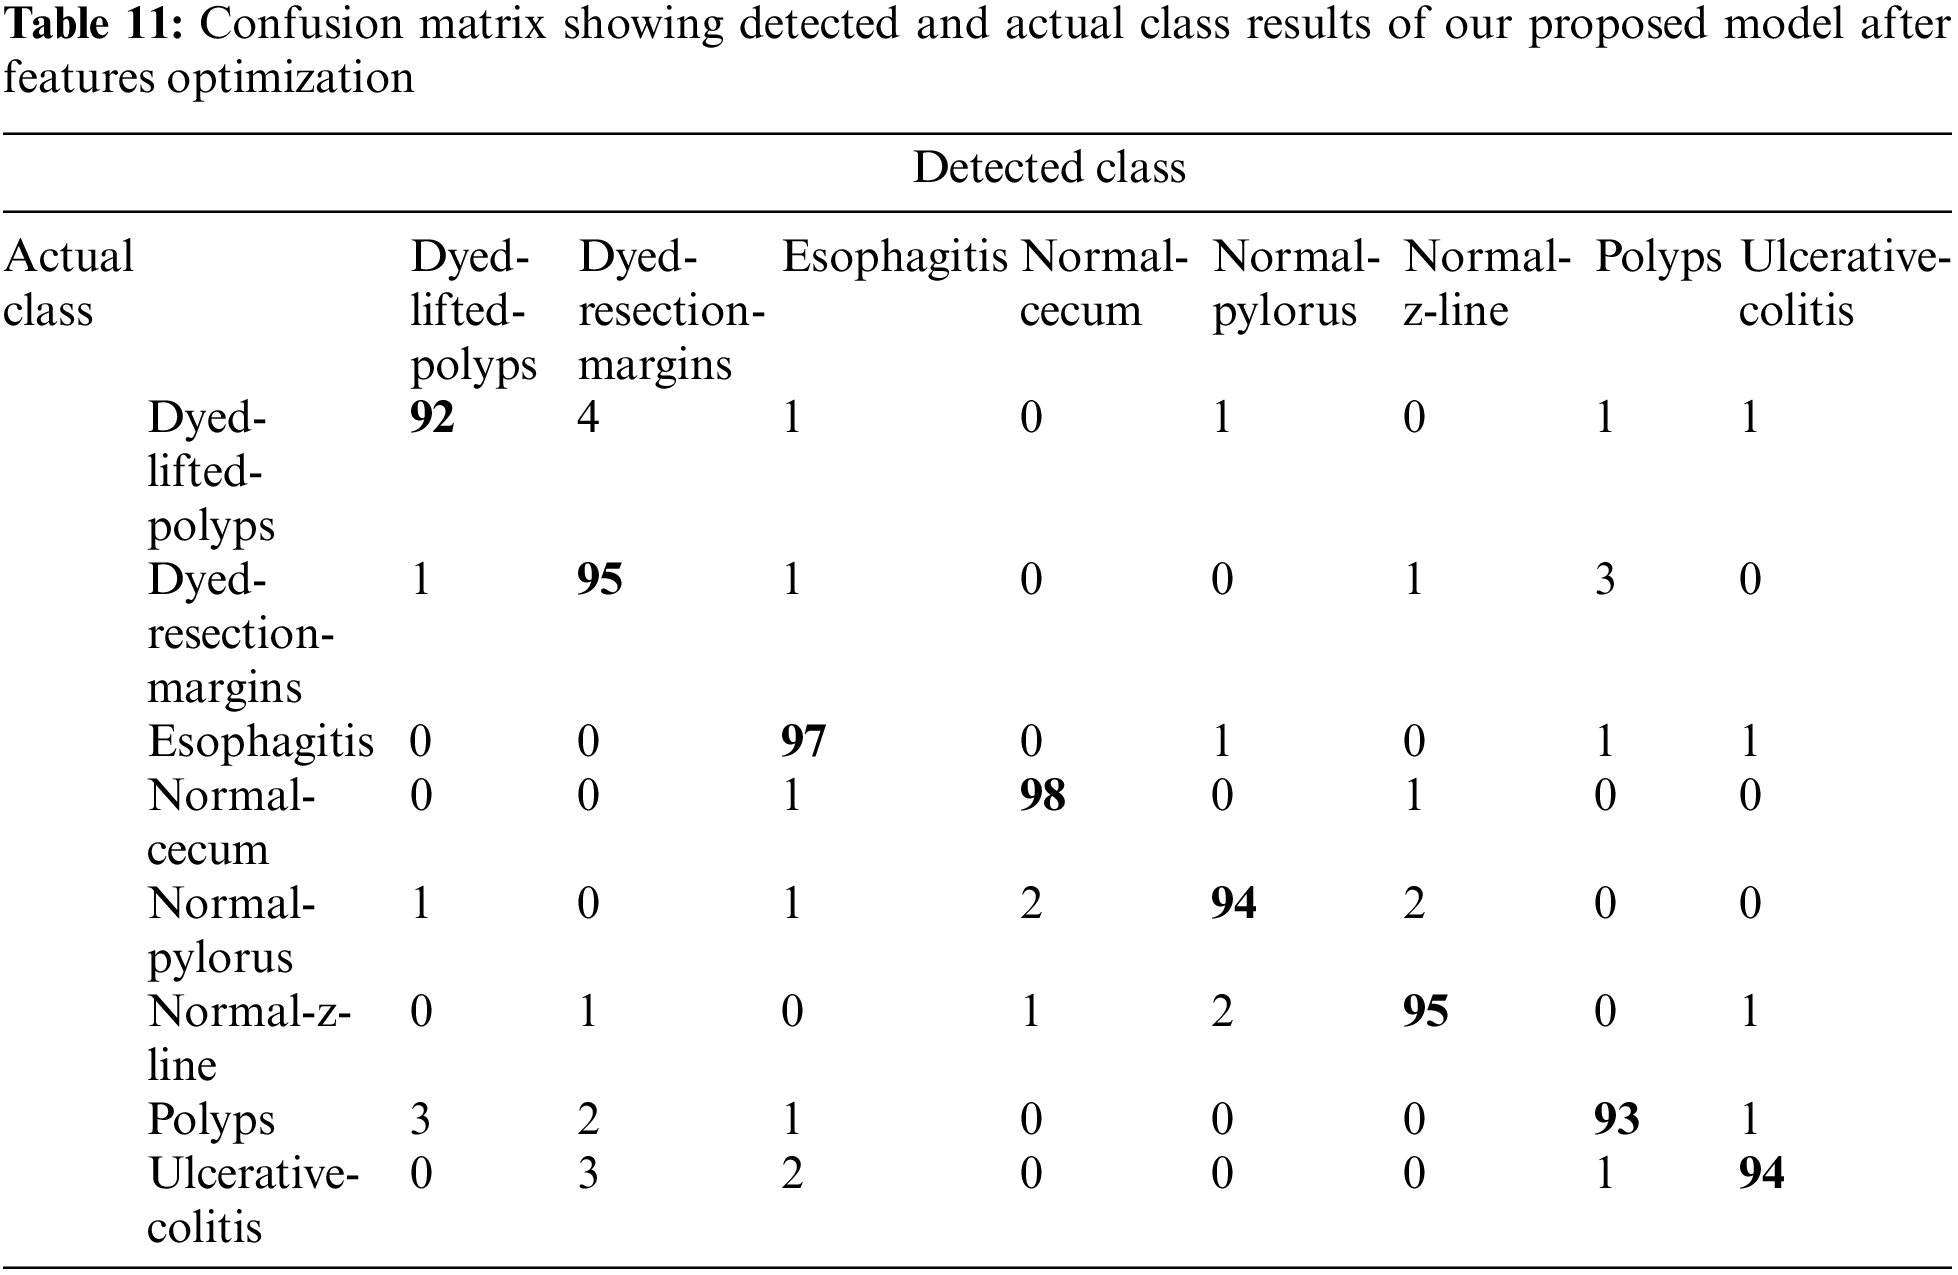
Upon the optimization of features using Ant Colony Optimization (ACO), it is apparent from Fig. 12 and Table 10 that classification accuracy is improved, and the model showed better performance in terms of accuracy. The accuracy after optimization of features jumped to 96.43%. For a better understanding of the classification rate in individual labels, we have presented the confusion matrix as shown in Table 11.
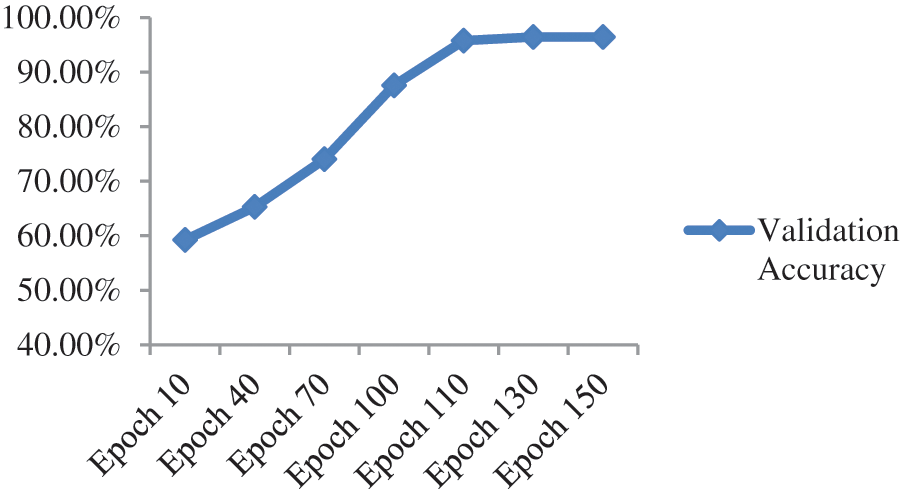
Figure 12: Validation accuracy per epochs of our proposed model after features optimization
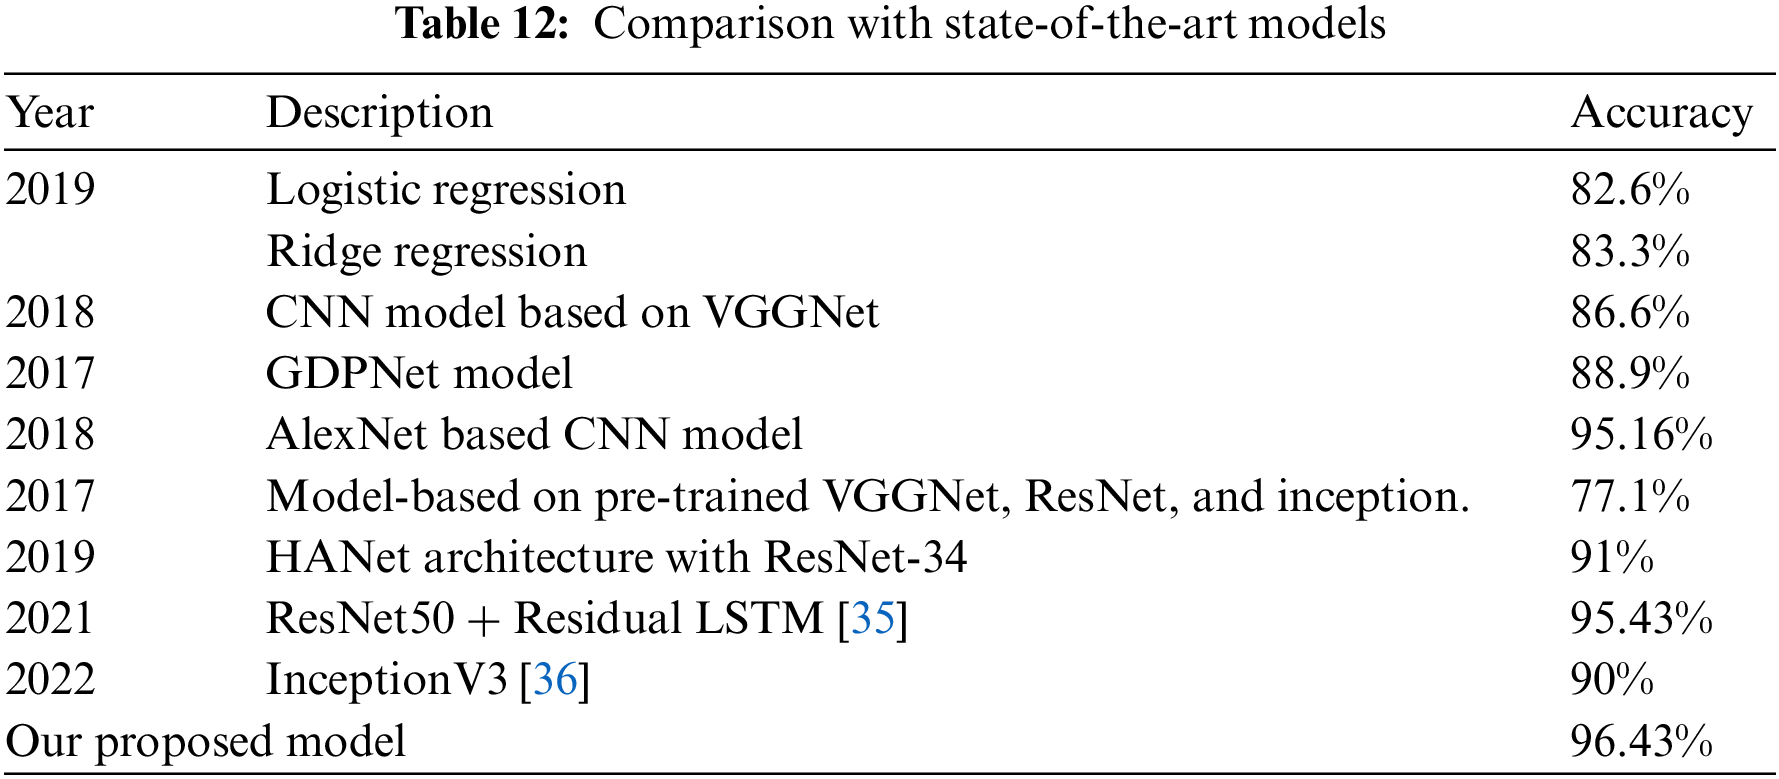
To propose our model that achieves better accuracy, we have performed extensive experimentation and also collected the majority of results not only for individual models like ResNet-50 and ResNet-152 separately but by combining the features of both models. After combining, features were also selected and optimized using Ant Colon Optimization (ACO) algorithm. The collected results are shown in terms of accuracy as well as confusion matrices are provided for a better understanding of generated results. On comparing our model results with state-of-the-art papers in this domain, it is evident that our model has achieved competitive accuracy of 96.43% as shown in Table 12.
In this paper, we have presented a deep learning-based framework for stomach disease localization and classification. The MASK R-CNN is employed at the initial stage for infection localization that is later employed for the training of pre-trained models through transfer learning (TL). Newly trained fine-tuned models are employed for the features extraction that is later fused using a serial approach. The purpose of the fusion process is to get the maximum information about the infected part for better accuracy but it includes some redundant information as well. Therefore, an improved optimization algorithm is introduced for the best feature selection. The selection process reduces the redundant information that impacts classification accuracy and computational time. For the experimental process, the publicly available dataset was used and achieved improved accuracy. In future work, we plan to investigate the proposed model for Ulcer classification [37], medical records classification [38,39], and face analysis [40,41]. Also, an efficient Net CNN model will opt for the features extraction.
Funding Statement: Researchers Supporting Project number (RSP2022R458), King Saud University, Riyadh, Saudi Arabia.
Conflicts of Interest: The authors declare that they have no conflicts of interest to report regarding the present study.
References
1. R. L. Siegel, K. D. Miller and A. Jemal, “Cancer statistics, 2015,” CA: A Cancer Journal for Clinicians, vol. 65, pp. 5,–29, 2015. [Google Scholar]
2. H. A. B S., J. King, S. S. B S., G. Ho and C. Chan, “The global incidence of peptic ulcer disease at the turn of the 21st century: A study of the organization for economic co-operation and development (OECd),” The American Journal of Gastroenterology, vol. 113, pp. S682–S684, 2018. [Google Scholar]
3. F. Aziz, Y. Taj and S. U. Kazmi, “Thin layer immunoassay; an economical approach to diagnose Helicobacter pylori infection in gastroduodenal ulcer disease patients of Pakistan; A comparative analysis,” International Journal of Microbiology and Advanced Immunology, vol. 1, pp. 24–31, 2020. [Google Scholar]
4. F. Buhling, G. Koch, T. Wex, A. Heimburg and M. Vieth, “Simultaneous detection and differentiation of anti-helicobacter pylori antibodies by flow microparticle immunofluorescence assay,” Clinical and Vaccine Immunology, vol. 11, pp. 131–136, 2004. [Google Scholar]
5. H. M. S. Algood and T. L. Cover, “Helicobacter pylori persistence: An overview of interactions between H. pylori and host immune defenses,” Clinical Microbiology Reviews, vol. 19, pp. 597–613, 2006. [Google Scholar]
6. C. Ghose, G. I. Perez-Perez, V. J. Torres, M. Crosatti and A. Nomura, “Serological assays for identification of human gastric colonization by Helicobacter pylori strains expressing vaca m1 or m2,” Clinical and Vaccine Immunology, vol. 14, pp. 442–450, 2007. [Google Scholar]
7. M. Plonka, W. Bielanski, S. Konturek, A. Targosz and Z. Sliwowski, “Helicobacter pylori infection and serum gastrin, ghrelin and leptin in children of polish shepherds,” Digestive and Liver Disease, vol. 38, pp. 91–97, 2006. [Google Scholar]
8. M. Amjad, S. U. Kazmi, S. M. Qureshi and M. R. Karim, “Inhibitory effect of IL-4 on the production of IL- 1β and TNF-α by gastric mononuclear cells of Helicobacter pylori infected patients,” Irish Journal of Medical Sciences, vol. 171, pp. 112, 2001. [Google Scholar]
9. F. Carpi, N. Kastelein, M. Talcott and C. Pappone, “Magnetically controllable gastrointestinal steering of video capsules,” IEEE Transactions on Biomedical Engineering, vol. 58, pp. 231–234, 2010. [Google Scholar]
10. G. Iddan, G. Meron, A. Glukhovsky and P. Swain, “Wireless capsule endoscopy,” Nature, vol. 405, pp. 417–417, 2000. [Google Scholar]
11. M. A. Khan, M. S. Sarfraz, M. Alhaisoni, A. A. Albesher and S. Wang, “StomachNet: Optimal deep learning features fusion for stomach abnormalities classification,” IEEE Access, vol. 8, pp. 197969–197981, 2020. [Google Scholar]
12. M. A. Khan, M. Sharif, T. Akram, M. Yasmin and R. S. Nayak, “Stomach deformities recognition using rank-based deep features selection,” Journal of Medical Systems, vol. 43, pp. 1–15, 2019. [Google Scholar]
13. J. Y. Yeh, T. H. Wu and W. J. Tsai, “Bleeding and ulcer detection using wireless capsule endoscopy images,” Journal of Software Engineering and Applications, vol. 7, pp. 422, 2014. [Google Scholar]
14. T. Aoki, A. Yamada, K. Aoyama, H. Saito and A. Tsuboi, “Automatic detection of erosions and ulcerations in wireless capsule endoscopy images based on a deep convolutional neural network,” Gastrointestinal Endoscopy, vol. s 89, pp. 357–363, 2019. [Google Scholar]
15. K. Weiss, T. M. Khoshgoftaar and D. Wang, “A survey of transfer learning,” Journal of Big Data, vol. 3, pp. 1–40, 2016. [Google Scholar]
16. N. Tajbakhsh, J. Y. Shin, S. R. Gurudu, R. T. Hurst and C. B. Kendall, “Convolutional neural networks for medical image analysis: Full training or fine tuning?” IEEE Transactions on Medical Imaging, vol. 35, pp. 1299–1312, 2016. [Google Scholar]
17. M. N. Noor and F. Haneef, “A review on big data and social network analytics techniques,” Researchpedia Journal of Computing, vol. 1, pp. 39–49, 2020. [Google Scholar]
18. M. N. Noor, M. Nazir, S. Rehman and J. Tariq, “Sketch-recognition using pre-trained model,” in Proc. NCECT, Islamabad, Pakistan, 2021. [Google Scholar]
19. G. L. H. Wong, A. J. Ma, H. Deng, J. Y. L. Ching and V. W. S. Wong, “Machine learning model to predict recurrent ulcer bleeding in patients with history of idiopathic gastroduodenal ulcer bleeding,” Alimentary Pharmacology & Therapeutics, vol. 49, pp. 912–918, 2019. [Google Scholar]
20. A. Majid, M. A. Khan, M. Yasmin, A. Rehman and A. Yousafzai, “Classification of stomach infections: A paradigm of convolutional neural network along with classical features fusion and selection,” Microscopy Researsch and Technique, vol. 83, pp. 562–576, 2020. [Google Scholar]
21. M. A. Khan, M. Rashid, M. Sharif, K. Javed and T. Akram, “Classification of gastrointestinal diseases of stomach from WCE using improved saliency-based method and discriminant features selection,” Multimedia Tools and Applications, vol. 78, pp. 27743–27770, 2019. [Google Scholar]
22. J. Y. Sun, S. W. Lee, M. C. Kang, S. W. Kim and S. Y. Kim, “A novel gastric ulcer differentiation system using convolutional neural networks,” in Proc. CBMS, Karlstad, Sweden, pp. 351–356, 2018. [Google Scholar]
23. X. Zhang, W. Hu, F. Chen, J. Liu and Y. Yang, “Gastric precancerous diseases classification using CNN with a concise model,” PLoS One, vol. 12, pp. e0185508, 2017. [Google Scholar]
24. S. Fan, L. Xu, Y. Fan, K. Wei and L. Li, “Computer-aided detection of small intestinal ulcer and erosion in wireless capsule endoscopy images,” Physics in Medicine & Biology, vol. 63, pp. 165001, 2018. [Google Scholar]
25. K. Pogorelov, K. R. Randel, C. Griwodz, S. L. Eskeland and T. de Lange, “Kvasir: A multi-class image dataset for computer aided gastrointestinal disease detection,” in Proc. MMSYS, Taipei, Taiwan, pp. 164–169, 2017. [Google Scholar]
26. M. H. Al-Adhaileh, E. M. Senan, F. W. Alsaade, T. H. H. Aldhyani and N. Alsharif, “Deep learning algorithms for detection and classification of gastrointestinal diseases,” Complexity, vol. 2021, p. 29434, 2021. [Google Scholar]
27. T. Y. Lin, P. Dollar, R. Girshick, K. He and B. Hariharan, “Feature pyramid networks for object detection,” in Proc. ICCV, Venice, Italy, pp. 2117–2125, 2017. [Google Scholar]
28. H. Jung, B. Lodhi and J. Kang, “An automatic nuclei segmentation method based on deep convolutional neural networks for histopathology images,” BMC Biomedical Engineering, vol. 1, pp. 1–12, 2019. [Google Scholar]
29. J. Peng, S. Kang, Z. Ning, H. Deng and J. Shen, “Residual convolutional neural network for predicting response of transarterial chemoembolization in hepatocellular carcinoma from CT imaging,” European Radiology, vol. 30, pp. 413–424, 2020. [Google Scholar]
30. P. Dwivedi, “Understanding and coding a resnet in keras,” Towards Data Science, 2019. [Online]. Available: https://towardsdatascience.com/understandingand-coding-a-resnet-in-keras-446d7ff84d33. [Google Scholar]
31. D. P. Kingma and J. Ba, “Adam: A method for stochastic optimization,” Preprint Arxiv, 2014. [Google Scholar]
32. S. Ruder, “An overview of gradient descent optimization algorithms,” Preprint Arxiv, 2016. [Google Scholar]
33. Y. Bengio, N. Boulanger-Lewandowski and R. Pascanu, “Advances in optimizing recurrent networks,” in Proc. ICASSP, Vancouver, Canada, pp. 8624–8628, 2013. [Google Scholar]
34. Y. Ho and S. Wookey, “The real-world-weight cross-entropy loss function: Modeling the costs of mislabeling,” IEEE Access, vol. 8, pp. 4806–4813, 2019. [Google Scholar]
35. S. Öztürk and U. Özkaya, “Residual LSTM layered CNN for classification of gastrointestinal tract diseases,” Journal of Biomedical Informatics, vol. 113, pp. 2289–2304, 2021. [Google Scholar]
36. I. M. Dheir and S. S. Abu-Naser, “Classification of anomalies in gastrointestinal tract using deep learning,” International Journal of Academic Engineering Research, vol. 6, pp. 417–431, 2022. [Google Scholar]
37. Y. Masmoudi, M. Ramzan, S. A. Khan and M. Habib, “Optimal feature extraction and ulcer classification from WCE image data using deep learning,” Soft Computing, vol. 26, pp. 1–14, 2022. [Google Scholar]
38. M. Ramzan, M. Habib and S. A. Khan, “Secure and efficient privacy protection system for medical records,” Sustainable Computing: Informatics and Systems, vol. 35, pp. 100717, 2022. [Google Scholar]
39. T. Sadad, A. Hussain, A. Munir, M. Habib and S. Ali Khan, “Identification of breast malignancy by marker-controlled watershed transformation and hybrid feature set for healthcare,” Applied Sciences, vol. 10, pp. 1900, 2020. [Google Scholar]
40. S. A. Khan, A. Hussain and M. Usman, “Reliable facial expression recognition for multi-scale images using weber local binary image based cosine transform features,” Multimedia Tools and Applications, vol. 77, pp. 1133–1165, 2018. [Google Scholar]
41. S. A. Khan, M. Ishtiaq, M. Nazir and M. Shaheen, “Face recognition under varying expressions and illumination using particle swarm optimization,” Journal of Computational Science, vol. 28, pp. 94–100, 2018. [Google Scholar]
Cite This Article
 Copyright © 2023 The Author(s). Published by Tech Science Press.
This work is licensed under a Creative Commons Attribution 4.0 International License , which permits unrestricted use, distribution, and reproduction in any medium, provided the original work is properly cited.
 Downloads
 Citation Tools