
 Submit a Paper
 Propose a Special lssue
 Open Access
ARTICLE

Adaptive Dynamic Dipper Throated Optimization for Feature Selection in Medical Data
1 Department of Information Technology, College of Computer and Information Sciences, Princess Nourah bint Abdulrahman University, P. O. Box 84428, Riyadh, 11671, Saudi Arabia
2 Department of Communications and Electronics, Delta Higher Institute of Engineering and Technology, Mansoura, 35111, Egypt
3 Faculty of Artificial Intelligence, Delta University for Science and Technology, Mansoura, 35712, Egypt
4 Department of Computer Sciences, College of Computer and Information Sciences, Princess Nourah bint Abdulrahman University, P. O. Box 84428, Riyadh, 11671, Saudi Arabia
5 Computer Engineering and Control Systems Department, Faculty of Engineering, Mansoura University, Mansoura, 35516, Egypt
6 Department of Computer Science, Faculty of Computer and Information Sciences, Ain Shams University, Cairo, 11566, Egypt
7 Department of Computer Science, College of Computing and Information Technology, Shaqra University, 11961, Saudi Arabia
8 Faculty of Computers and Artificial Intelligence, Benha University, Benha, 13518, Egypt
9 College of Computer and Information Sciences, Prince Sultan University, Riyadh, 11586, Saudi Arabia
10 Department of Civil Engineering, University of Science and Technology, Miami, 33101, USA
11 Department of Civil and Environmental Engineering, Florida International University, Miami, USA
12 Oral Biology Department, Faculty of Oral and Dental Medicine, Delta University for Science and Technology, Gamasa, Egypt
13 Faculty of Artificial Intelligence, Kafrelsheikh University, Kafrelsheikh, 33511, Egypt
* Corresponding Author: Nagwan Abdel Samee. Email:
Computers, Materials & Continua 2023, 75(1), 1883-1900. https://doi.org/10.32604/cmc.2023.031723
Received 25 April 2022; Accepted 08 June 2022; Issue published 06 February 2023
 View Full Text
 Download PDF
Abstract
The rapid population growth results in a crucial problem in the early detection of diseases in medical research. Among all the cancers unveiled, breast cancer is considered the second most severe cancer. Consequently, an exponential rising in death cases incurred by breast cancer is expected due to the rapid population growth and the lack of resources required for performing medical diagnoses. Utilizing recent advances in machine learning could help medical staff in diagnosing diseases as they offer effective, reliable, and rapid responses, which could help in decreasing the death risk. In this paper, we propose a new algorithm for feature selection based on a hybrid between powerful and recently emerged optimizers, namely, guided whale and dipper throated optimizers. The proposed algorithm is evaluated using four publicly available breast cancer datasets. The evaluation results show the effectiveness of the proposed approach from the accuracy and speed perspectives. To prove the superiority of the proposed algorithm, a set of competing feature selection algorithms were incorporated into the conducted experiments. In addition, a group of statistical analysis experiments was conducted to emphasize the superiority and stability of the proposed algorithm. The best-achieved breast cancer prediction average accuracy based on the proposed algorithm is 99.453%. This result is achieved in an average time of 3.6725 s, the best result among all the competing approaches utilized in the experiments.Keywords
The proper diagnosis of some crucial information is a critical challenge for bioinformatics or medical research [1]. In medicine, disease diagnosis is a demanding and challenging task. Many diagnostic hospitals and research institutes, as well as various websites, have a vast amount of medical diagnostic data. It is barely essential to categorize them to automate and speed up disease diagnosis. The medical planning officer’s expertise and skill in the medical profession are frequently used to diagnose the ailment. As a result, there are instances of inaccuracies, unintended biases, and the requirement for a lengthy time for a precise disease diagnosis [2].
Breast cancer affects more women than all other malignancies, according to the American Cancer Society. In 2017, around 252,710 women in the United States will be diagnosed with invasive breast cancer, while approximately 63,410 women will be diagnosed with in situ breast cancer. Breast cancer is more common in men than in women. In 2017, it was estimated that roughly 2470 males in the United States would be diagnosed with prostate cancer. According to another estimate, around 41,070 people would die in 2017 from this malignancy. Breast cancer affects 41,000 women in the United Kingdom each year, but just 300 males. The most frequent malignancy among women globally is breast cancer. Breast cancer is caused by the abnormal multiplication of specific breast cells. Several techniques have been developed for the reliable diagnosis of breast cancer. Breast cancer is detected through mammography, often known as breast screening. The status of a woman’s nipple is assessed using X-rays. Breast cancer is difficult to detect in its early stages because of the small size of the cancer cell when viewed from the outside. Mammography is a quick and painless procedure that can identify cancer in its early stages [3–5].
Ultrasound is a well-known tool for identifying breast cancer that uses sound waves to inspect the inside status of the body. The bounce of sound waves from a transducer that generates sound waves and is placed on the skin captures the echoes of the body’s tissues. The echoes are transformed to grayscale, which is a binary value that can be understood by a computer. F-fluorodeoxyglucose positron emission tomography (PET) imaging helps doctors see where a tumor is in the body. It works by looking for radiolabeled cancer-specific tracers. Dynamic magnetic resonance imaging (MRI) has been used to develop a detection tool for breast abnormalities. The modality forecasts the pace at which contrast enhancement occurs by boosting tumor angiogenesis. Magnetic reasoning imaging has been associated with contrast enhancement metastases in those with breast cancer. Elastography is an imaging-based technique that is fresh new. This method can be employed when the breast cancer tissue is greater than the surrounding parenchyma. To identify benign from malignant types, this approach employs a color map of probe compression [6–8].
The mortality of breast cancer can be reduced effectively if the diagnosis and detection are performed early. However, the lack of sufficient medical resources and inaccurate treatment make the timely diagnosis of breast cancer hard to achieve. Therefore, computer-aided diagnosis systems present an effective solution to radiologists and pathologists to help them achieve an efficient and accurate medical diagnosis. Currently, existing machine learning techniques offer accurate and effective assistance in diagnosing breast cancer. They can achieve low positive and negative classification rates. These machine learning techniques include ensemble learning, deep learning, computer vision, feature selection, and feature fusion. To generate highly accurate annotations for medical images, a substantial economic cost is usually required. In addition, the availability of a large set of samples is limited by individual privacy and ethical issues [9].
Moreover, the acquisition of high-quality samples is affected by the large gap between the fields of computer science and medicine. On the other hand, scientists tried to find the actual reasons causing breast cancer by studying the factors that can raise the probability of growing breast cancer in a woman. These risk factors include family background, age, genetic properties, smoking, gene variation, obesity, taking alcohol, etc. Based on these studies, four datasets have emerged as a collection of data describing the cases of normal and breast cancer based on these risk factors. These datasets are the breast cancer Wisconsin (diagnostic) data set, breast cancer Wisconsin (original) data set, breast cancer Coimbra data set, and breast cancer data set [10–13].
Prediction of breast cancer based on the data of these four datasets requires building a machine learning model that processes the risk factors to find the best decision. However, not all the risk factors have the same relevance in finding the best decision. Therefore, the process of feature selection of essential to keep only the most relevant risk factors in achieving better results. There are many feature selection methods in the literature. From these methods, the binary grey wolf optimization (bGWO), binary guided whale algorithm (bGWA), binary particle swarm optimization (bPSO), binary dipper throated optimization (bDTO), and many others. The efficiency of these feature selectors is usually evaluated in terms of the classifier that determines whether the selected feature can achieve the best prediction rates or not. On the other hand, these feature selection methods are based on parameter optimization algorithms that generate continuous values, converted to binary to match the feature selection problem [14].
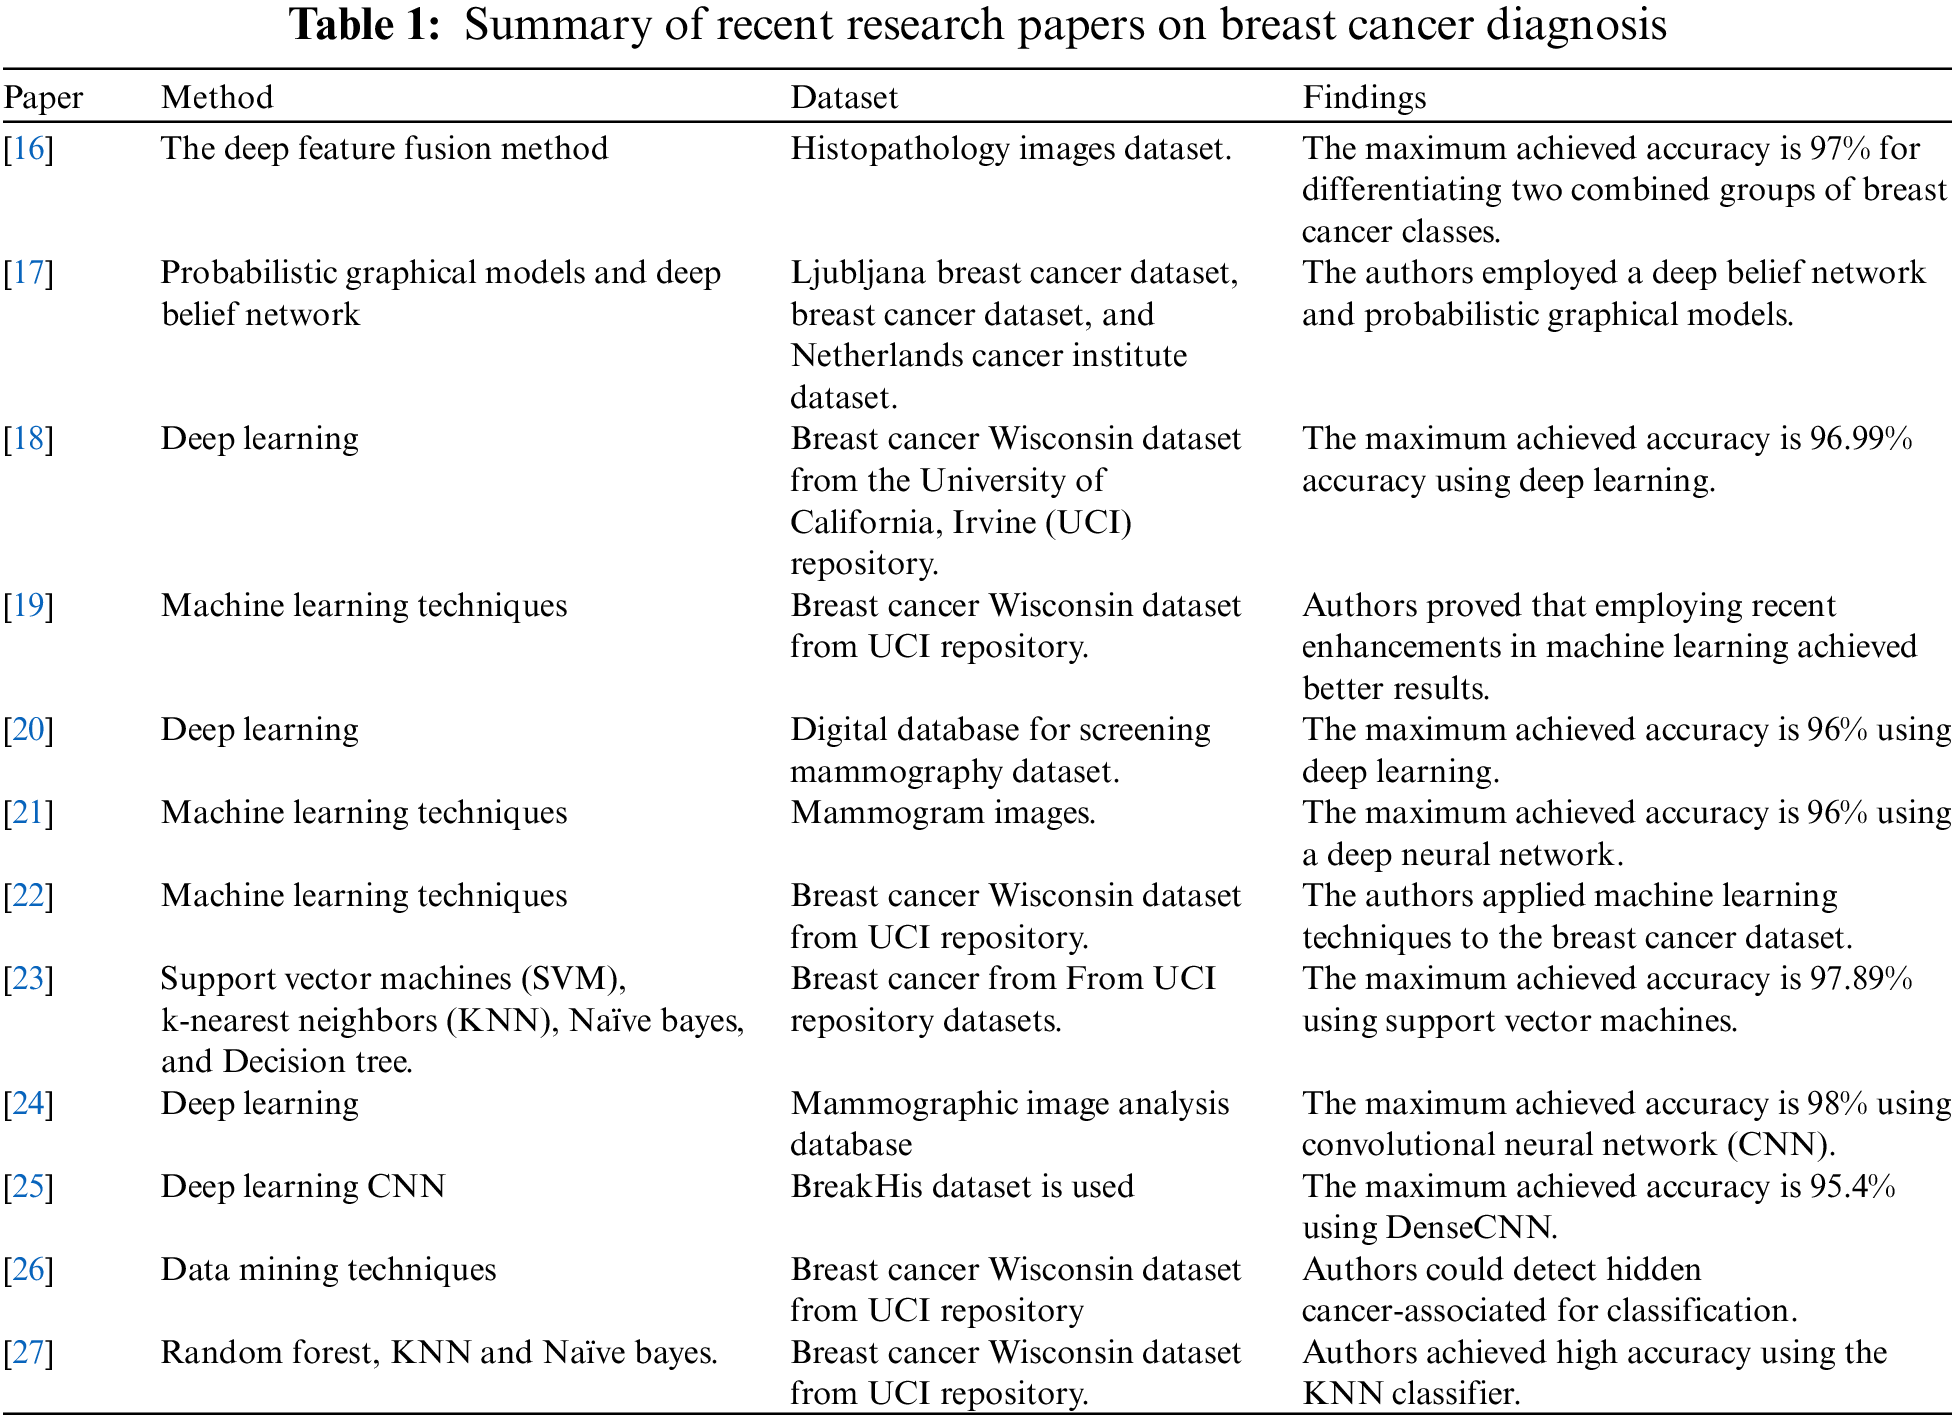
Parameter optimization is defined as the problem of finding the best parameter set that can achieve the highest classification/prediction values. The optimization problem can be utilized in the problem of breast cancer prediction by employing the exploration and exploitation processes of the optimizer to find the best set of risk factors that can be used in breast cancer prediction [15]. In addition, many hybrid optimization algorithms recently emerged to perform better than the single optimizer—these hybrid optimizers such as PSO-GWA and PSO-GWO. Consequently, binary hybrid optimizers have emerged for better feature selection and better classification accuracy. A summary of the research papers that addressed the task of breast cancer diagnosis is listed in Table 1. As presented in this table, the best accuracy achieved was 97.89%, and the speed of the corresponding approach is not available.
We propose in this paper a new feature selection algorithm for selecting the significant features from four breast cancer datasets publicly available in UCI Repository. The proposed algorithm is compared with a set of recently emerged feature selection algorithms in the literature. The achieved results proved the efficiency of the proposed algorithm in terms of speed and accuracy.
This paper is organized as follows. The materials and methods employed in this work are presented in Section 2. Section 3 illustrates the proposed feature selection algorithm, followed by a detailed explanation of the achieved experimental results in Section 4. The conclusions and future perspectives are finally presented in Section 5.
This section starts by presenting the datasets employed in the conducted experiments, then the basic algorithms used in developing and testing the proposed algorithm are explained.
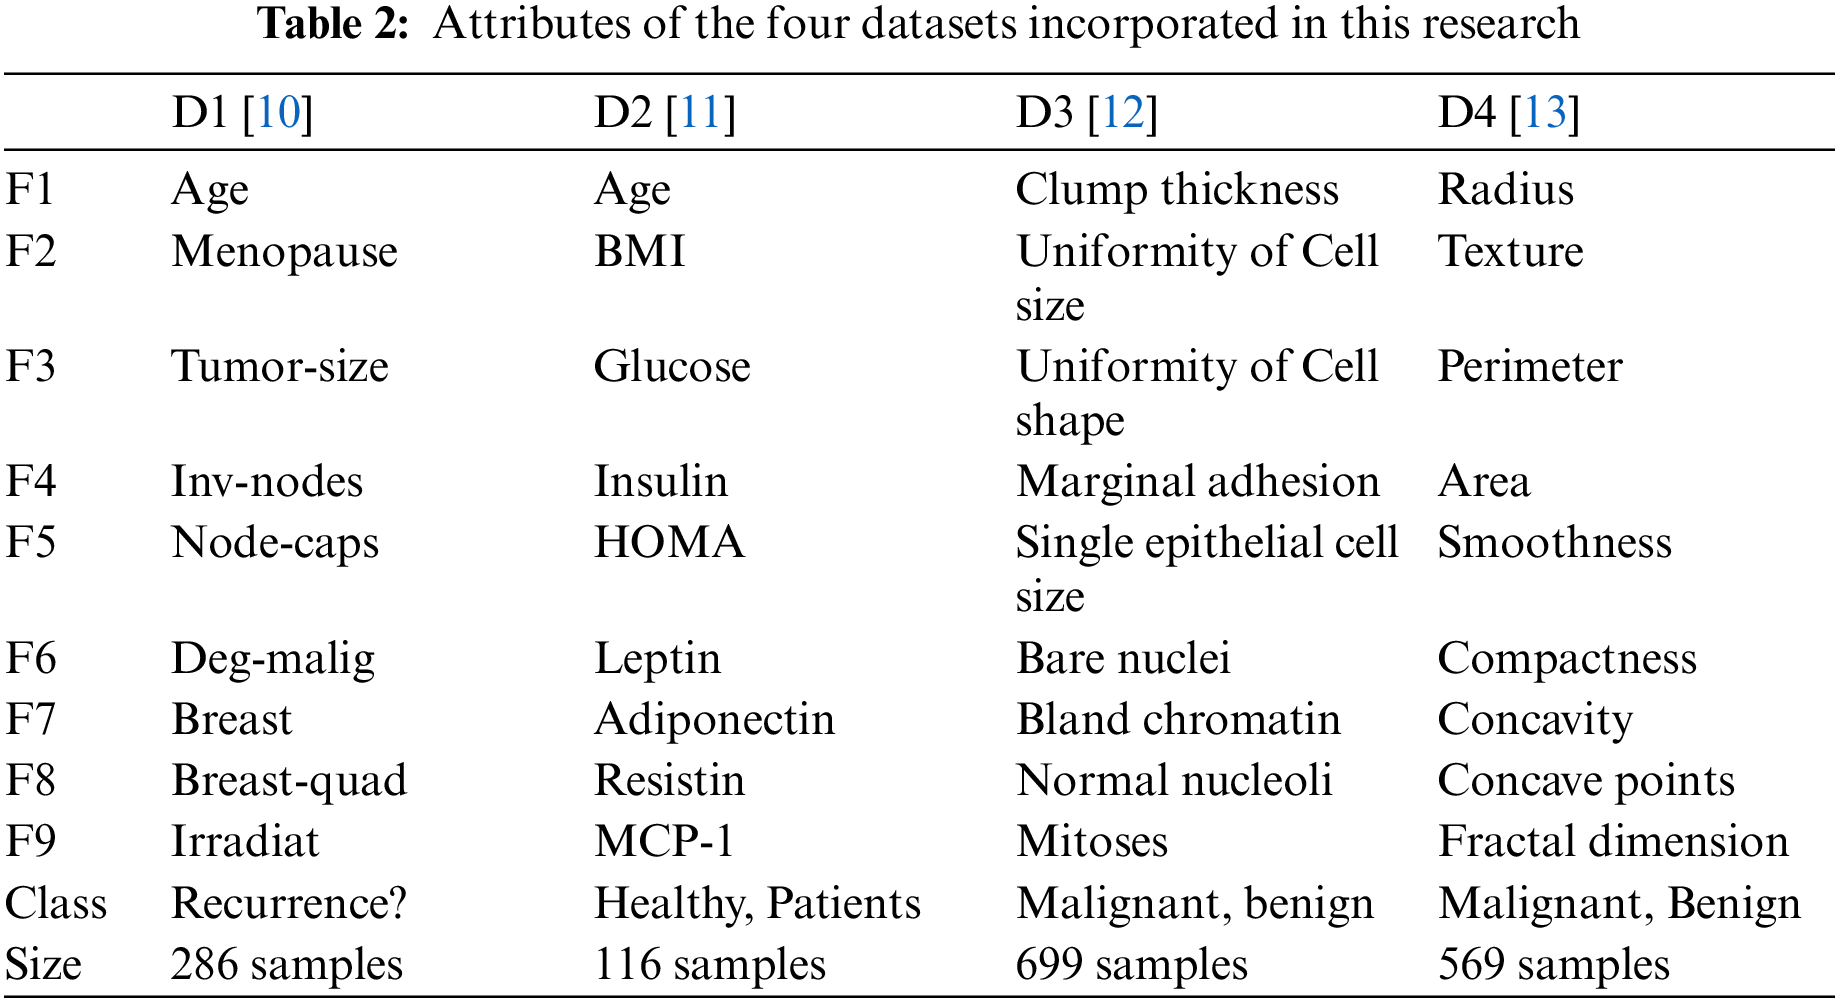
In this work, four datasets from the UCI repository are employed to evaluate the proposed approach. These datasets are the breast cancer data set, which is referred to as D1 [10], breast cancer data set, which is referred to as D2 [11], breast cancer Wisconsin (original) data set which is referred to as D3 [12], and breast cancer Wisconsin (diagnostic) data set which is referred as D4 [13]. The features of each dataset are listed in Table 2. As shown in the table, the first nine rows represent the dataset features (denoted by F1, F2, …, F9), whereas the last two rows represent the classes to which the feature values belong and the size of the dataset.
Before using the data of each dataset to learn the machine learning model and feature selector, two main preprocessing steps are applied to ensure the integrity of the recorded features. These preprocessing steps replace the null values in a column with the average of the surrounding values in the same feature column. In addition, a min-max scalar is employed to normalize the importance of the features to lay in the range between zero and one [28,29].
2.3 Dipper Throated Optimization Algorithm
The inspiration for the dipper throated optimization (DTO) algorithm is based on the dipper throated bird, which is renowned for its bobbing or dipping motions while perched and belongs to the Cinclidsae family of birds. The ability of a bird to dive, swim, and hunt beneath the surface sets it apart from other passerines. It can fly straight and rapidly with no stops or glides because of its tiny flexible wings. The dipper throated bird has a distinct hunting style, quick bowing motions, and a white breast. It rushes headlong into the water to get its prey, regardless of how turbulent or fast-flowing it is. As it descends and picks up pebbles and stones, aquatic invertebrates, aquatic insects, and tiny fish perish. The great white shark uses its hands to move on the ocean floor. By bending your body at an angle and traveling down the bottom of the water with your head lowered, you might be able to locate prey. It can also dive into the water and submerge itself, using its wings to propel itself through the water and stay submerged for an extended time. The DTO algorithm assumes that a flock of birds is swimming and flying about looking for food. More details about the DTO algorithm are explained in [30].
2.4 Guided Whale Optimization Algorithm
The guided whale (GW) optimization approach is effective in various optimization situations. According to the literature, GW is one of the most successful optimization approaches. On the other hand, its exploration capabilities may be restricted. For mathematical computations, let n as the number of variables or the dimension of the search space to be searched by the whales. If the agents’ positions (solutions) in the space search are updated over time, the best food solution will be determined. The update of the agents’ positions can be performed using the following equation.
where the found solution at iteration t is denoted by
The selection of essential features from the recorded features set is the first step in adequately training classification models. As a result, training time may be cut in half, and the classification model can be simplified significantly. Furthermore, by employing feature selection, overfitting may be prevented. To execute feature selection, the output solution from the continuous optimizer should be changed to a binary solution using the integers 0 and 1. To convert a continuous optimizer solution to a binary solution for feature selection, use the following function [33,34].
The quality of an optimizer’s output may be determined using fitness functions. The fitness function’s essential elements include classification and regression errors, as well as the features chosen for the input pictures. Rather than a solution based on a broad list of specific traits, select one with the lowest potential classification error rate [35–40]. The following equation is used to evaluate the quality of the specified attributes.
where
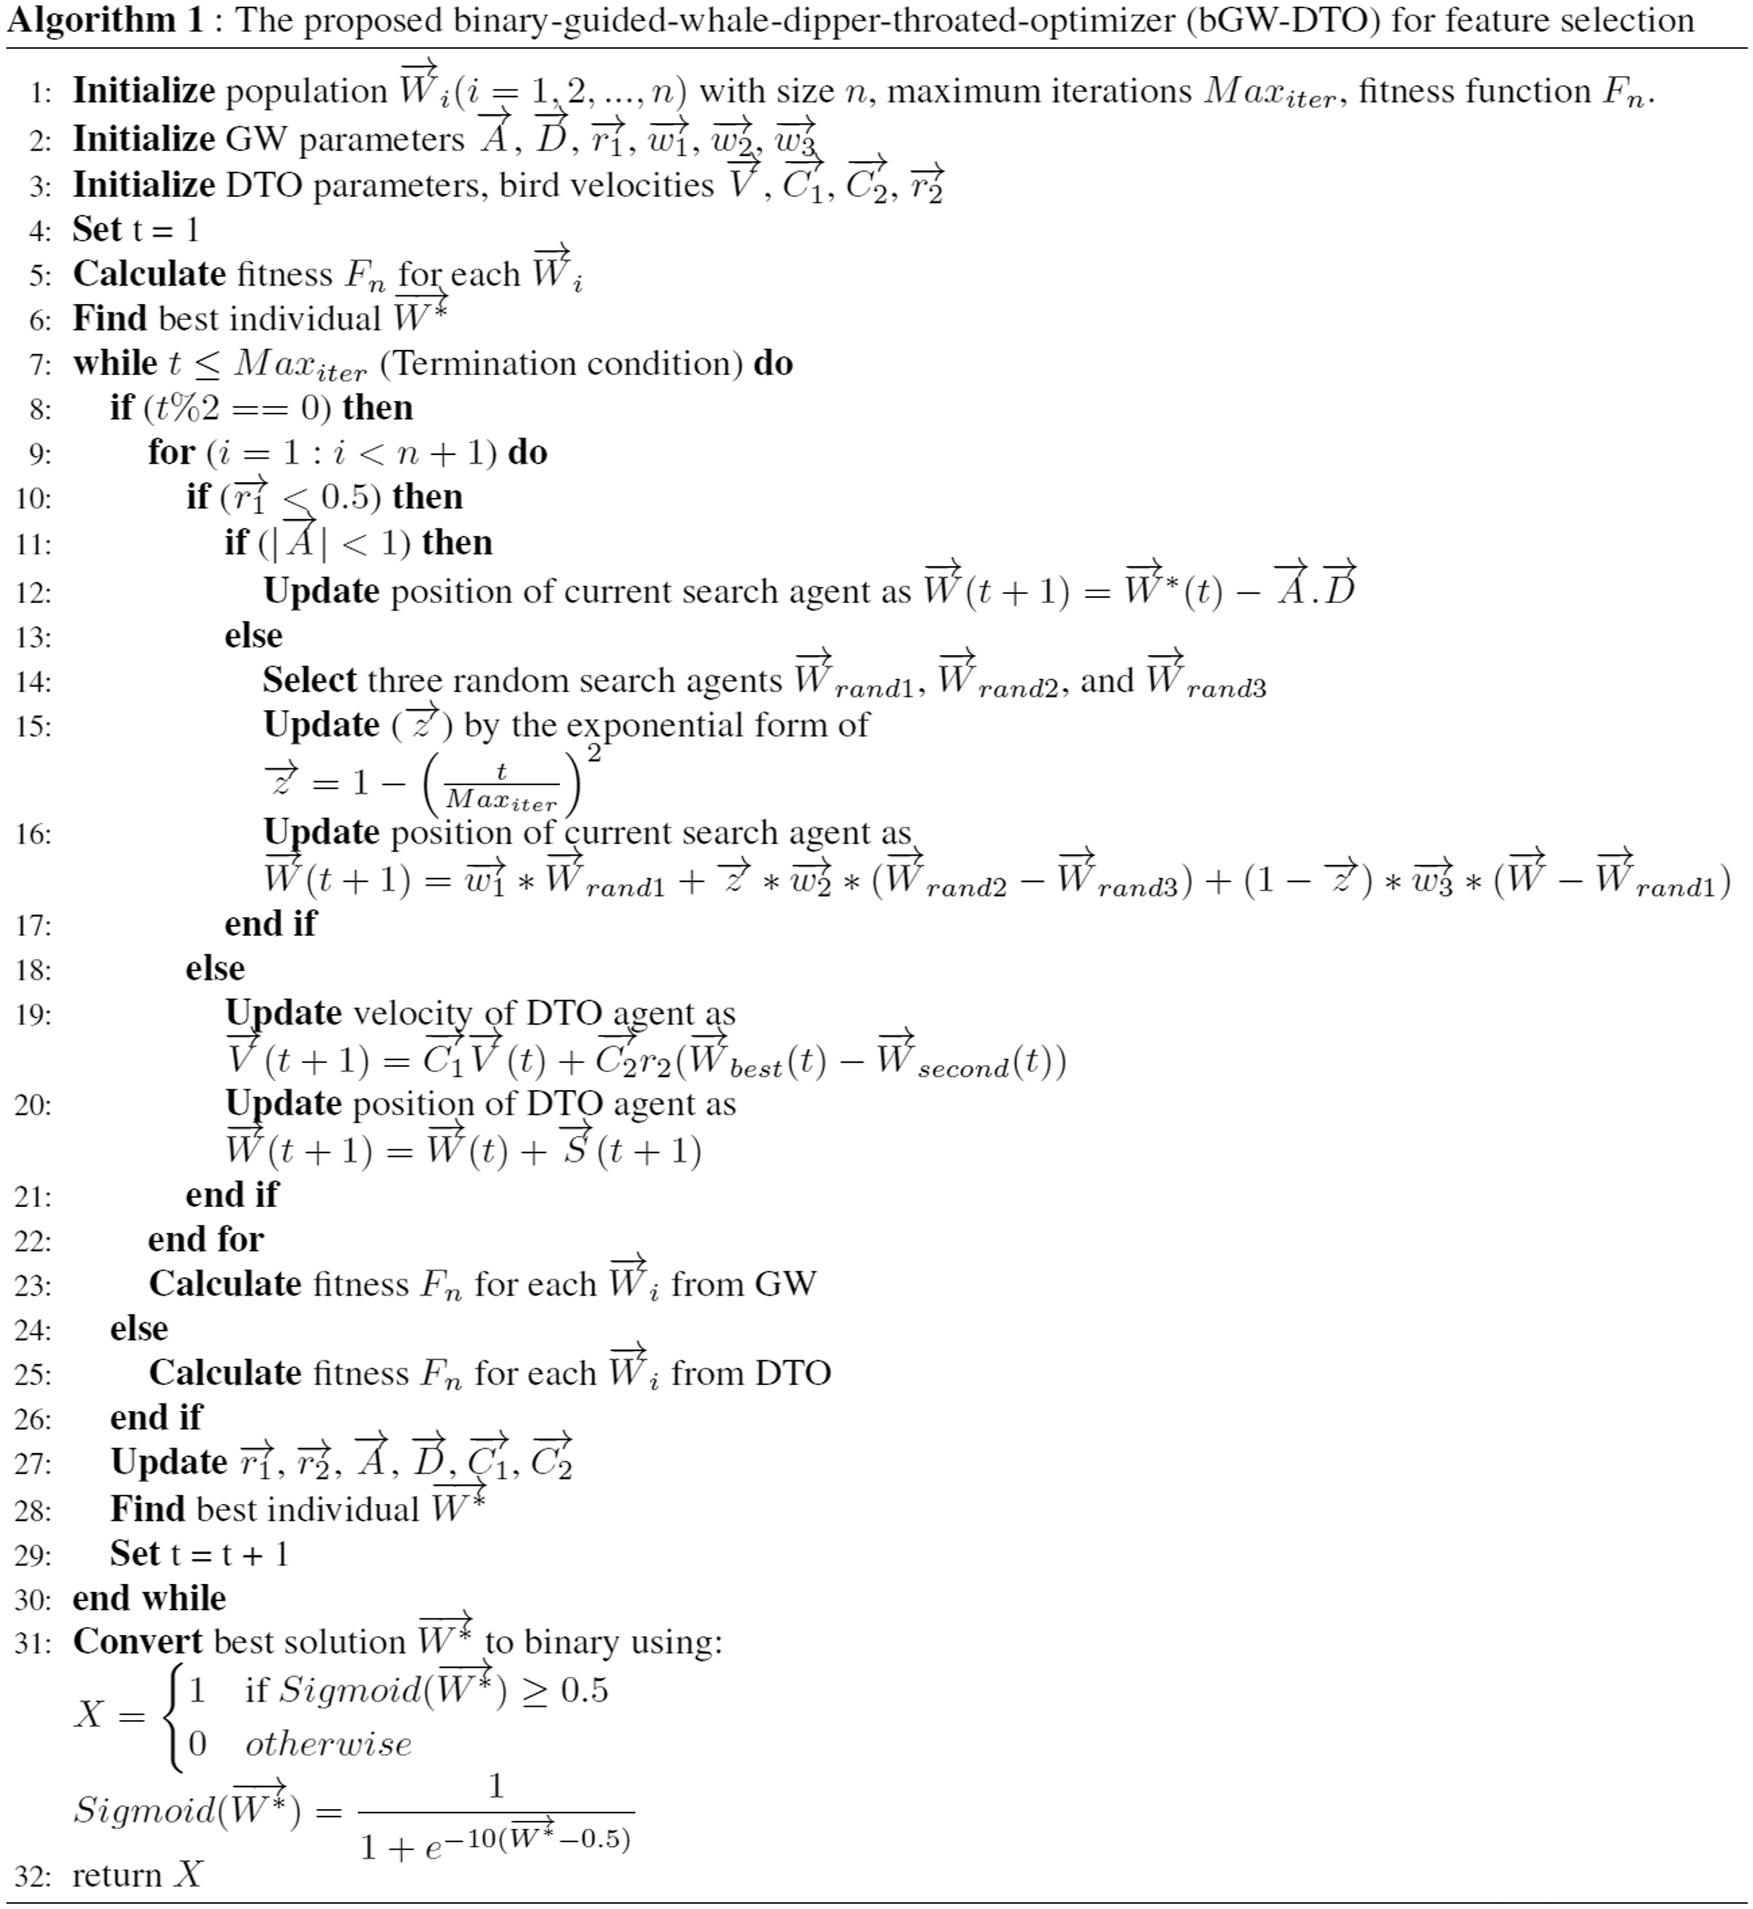
The details of the proposed binary guided whale dipper throated optimizer (bGW-DTO) for feature selection are depicted in Algorithm 1. To perform feature selection using this algorithm, the resulting solution is converted to a binary solution based on the sigmoid function, as shown in line 31 of the algorithm. In addition, the K-nearest neighbor is employed to assess the quality of the selected features that achieve the best fitness for the breast cancer diagnosis.
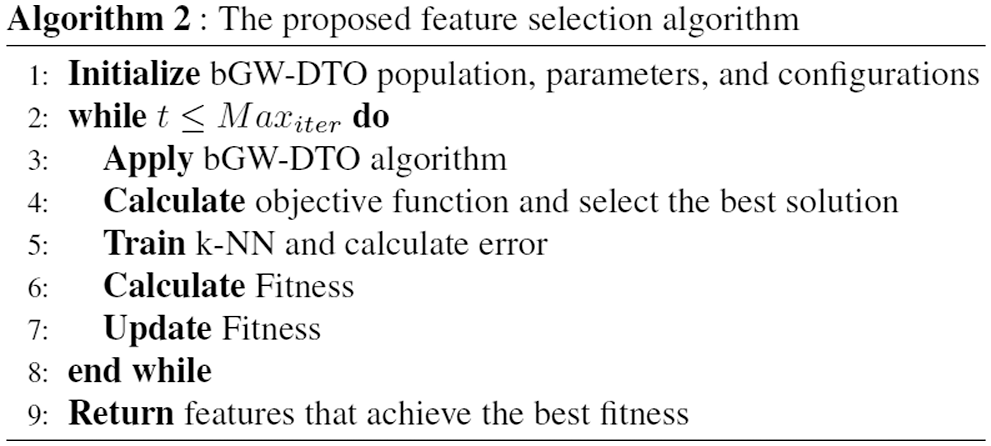
In addition, a high-level overview of the proposed feature selection algorithm is illustrated in Algorithm 2. In this algorithm, the process goes through iterations at which the bGW-DTO is performed to retrieve binary values representing the selected features. These selected features are assessed using k-NN with the help of a fitness function. At the end of these iterations, the algorithms return the set of features that achieve the best fitness among all other collections of features.
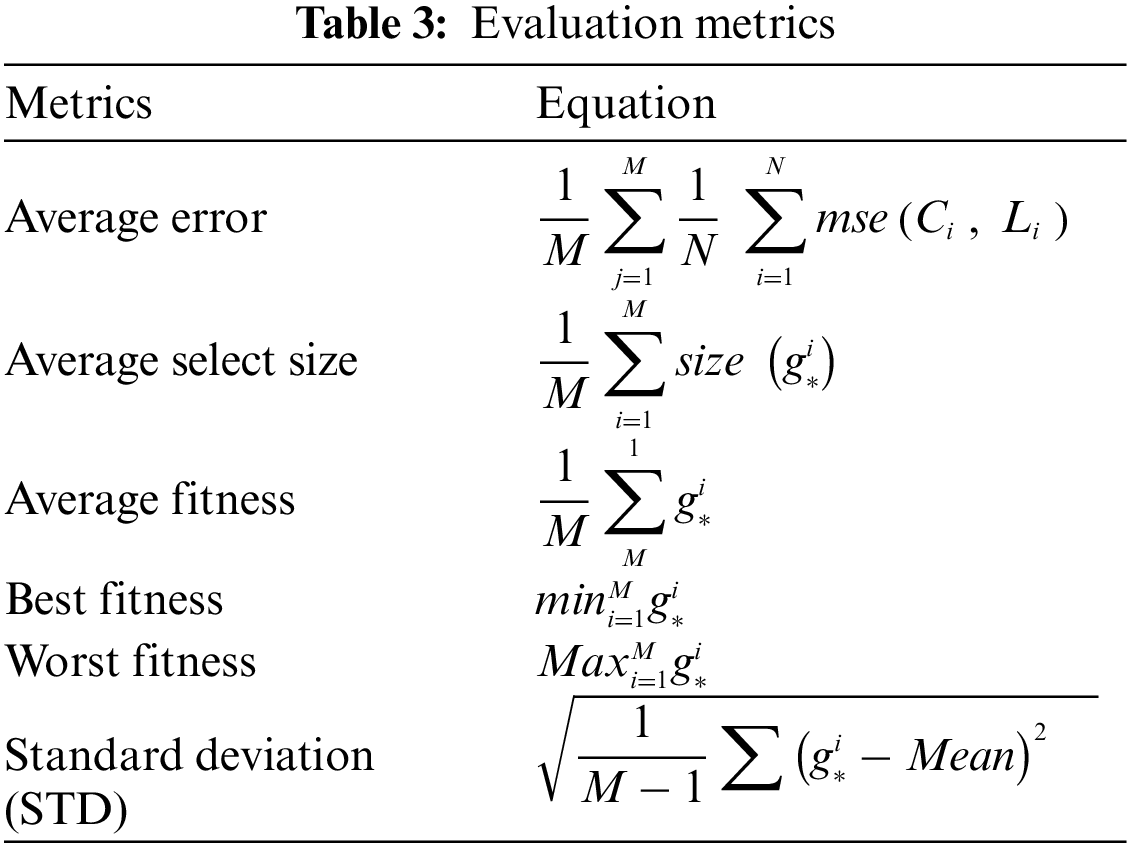
To evaluate the efficiency of the proposed algorithm, several experiments were conducted to assess its performance. The conducted experiments are based on several evaluation criteria presented in Table 3. These criteria include average error, best fitness, worst fitness, average fitness size, mean, and standard deviation.
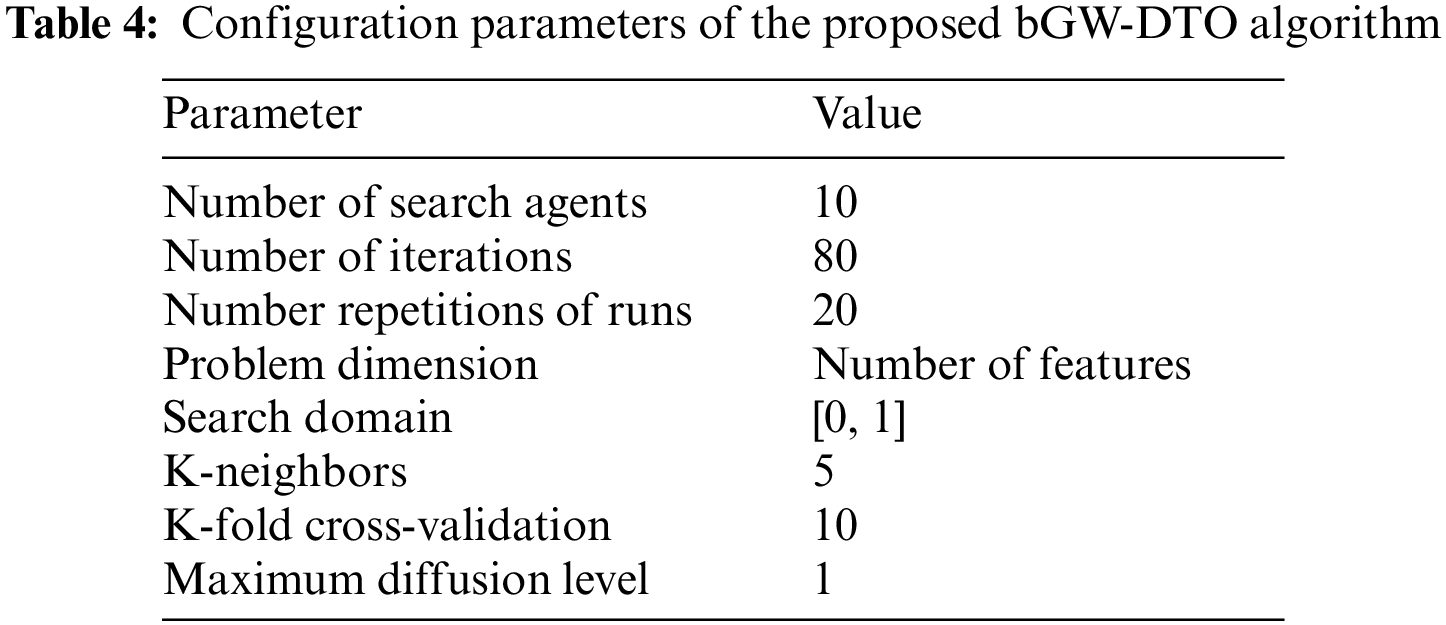
The configuration parameters of the proposed algorithm are presented in Table 4. These values are used as initial values to start the optimization algorithm. It can be noted that these parameters are set once, and their values are not changed during the running of the algorithm.
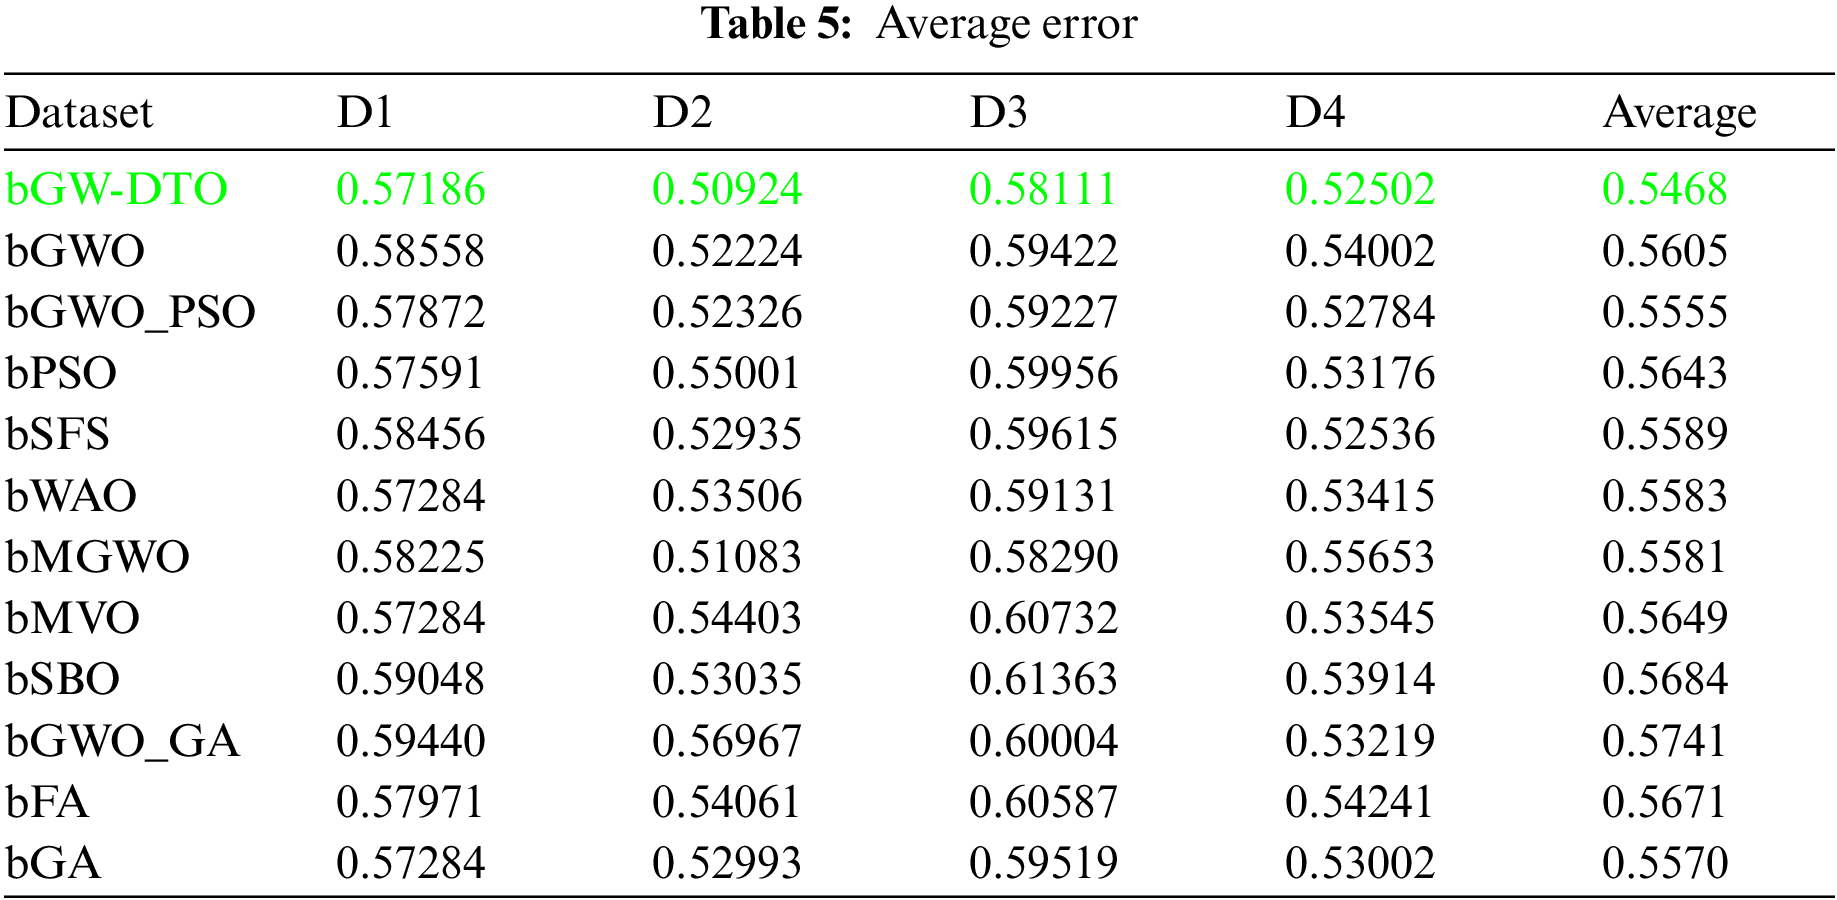
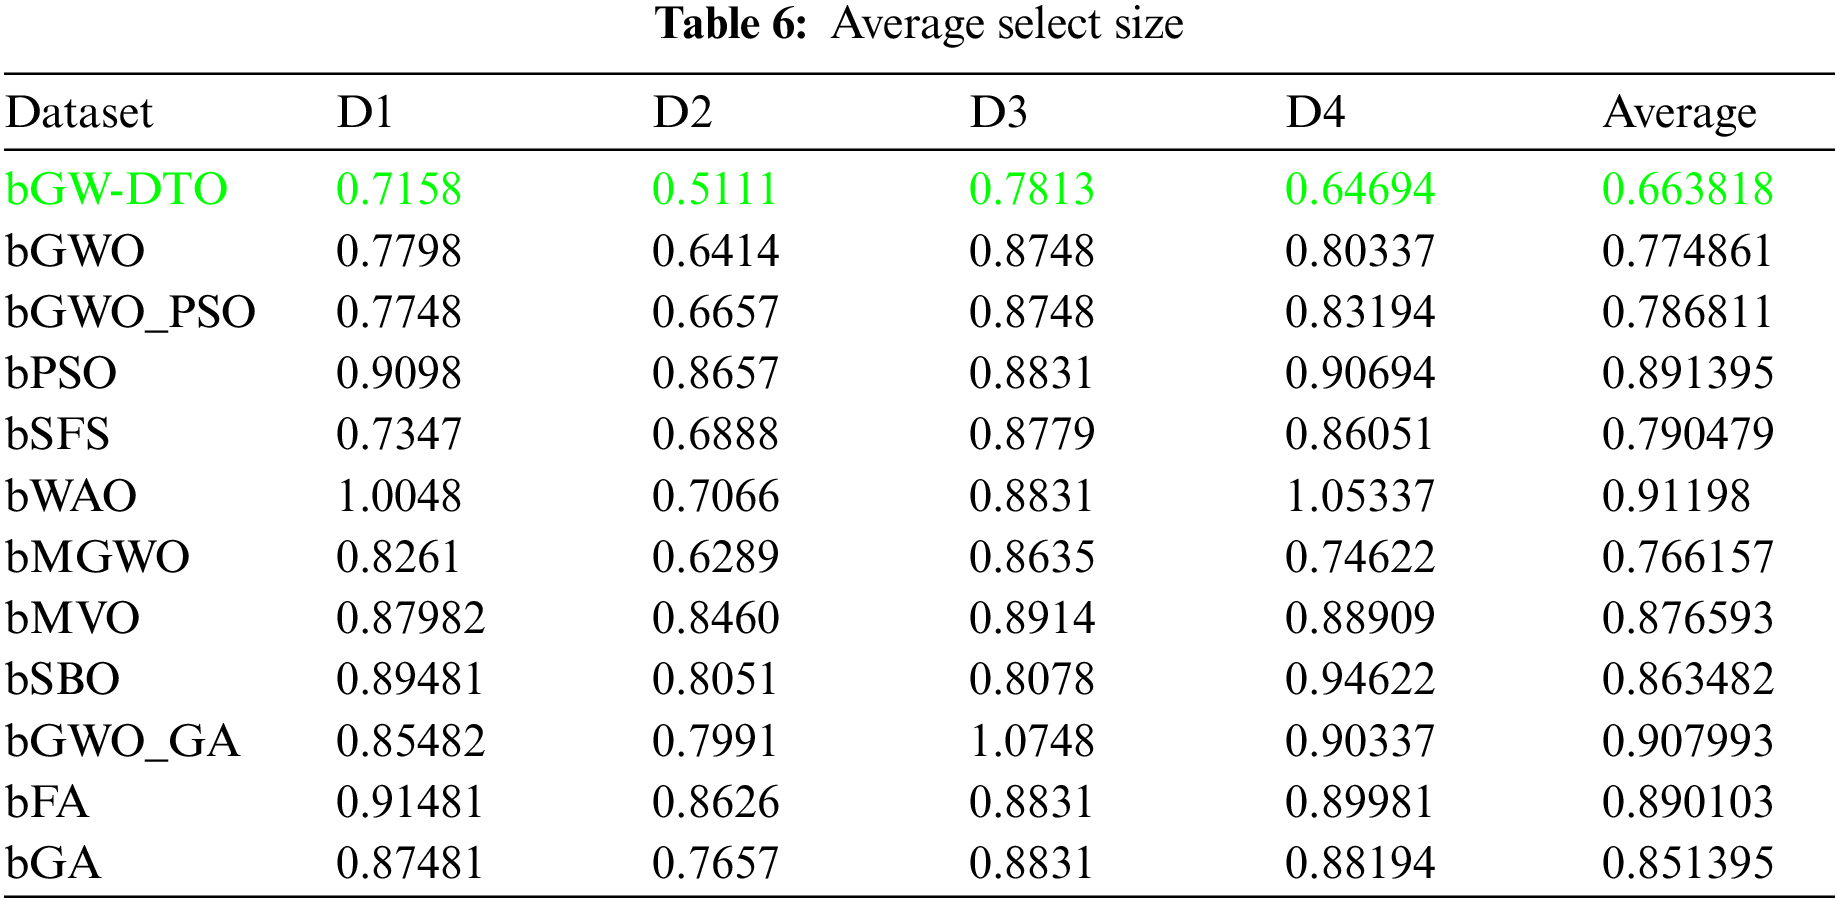
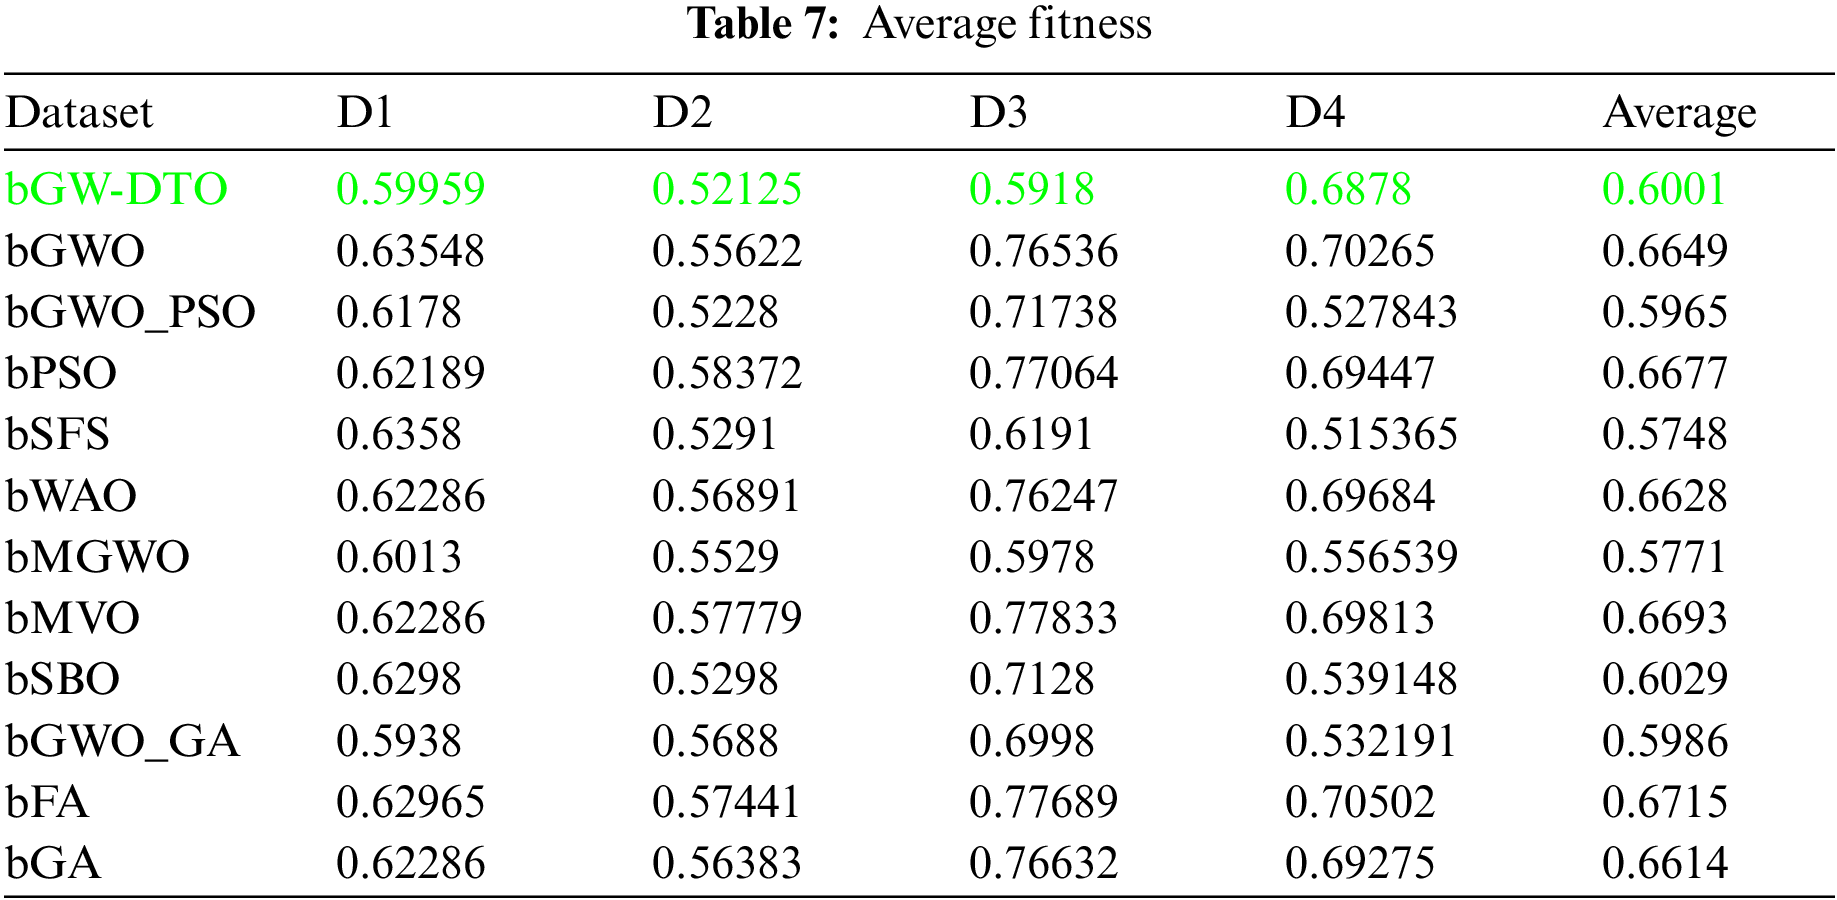
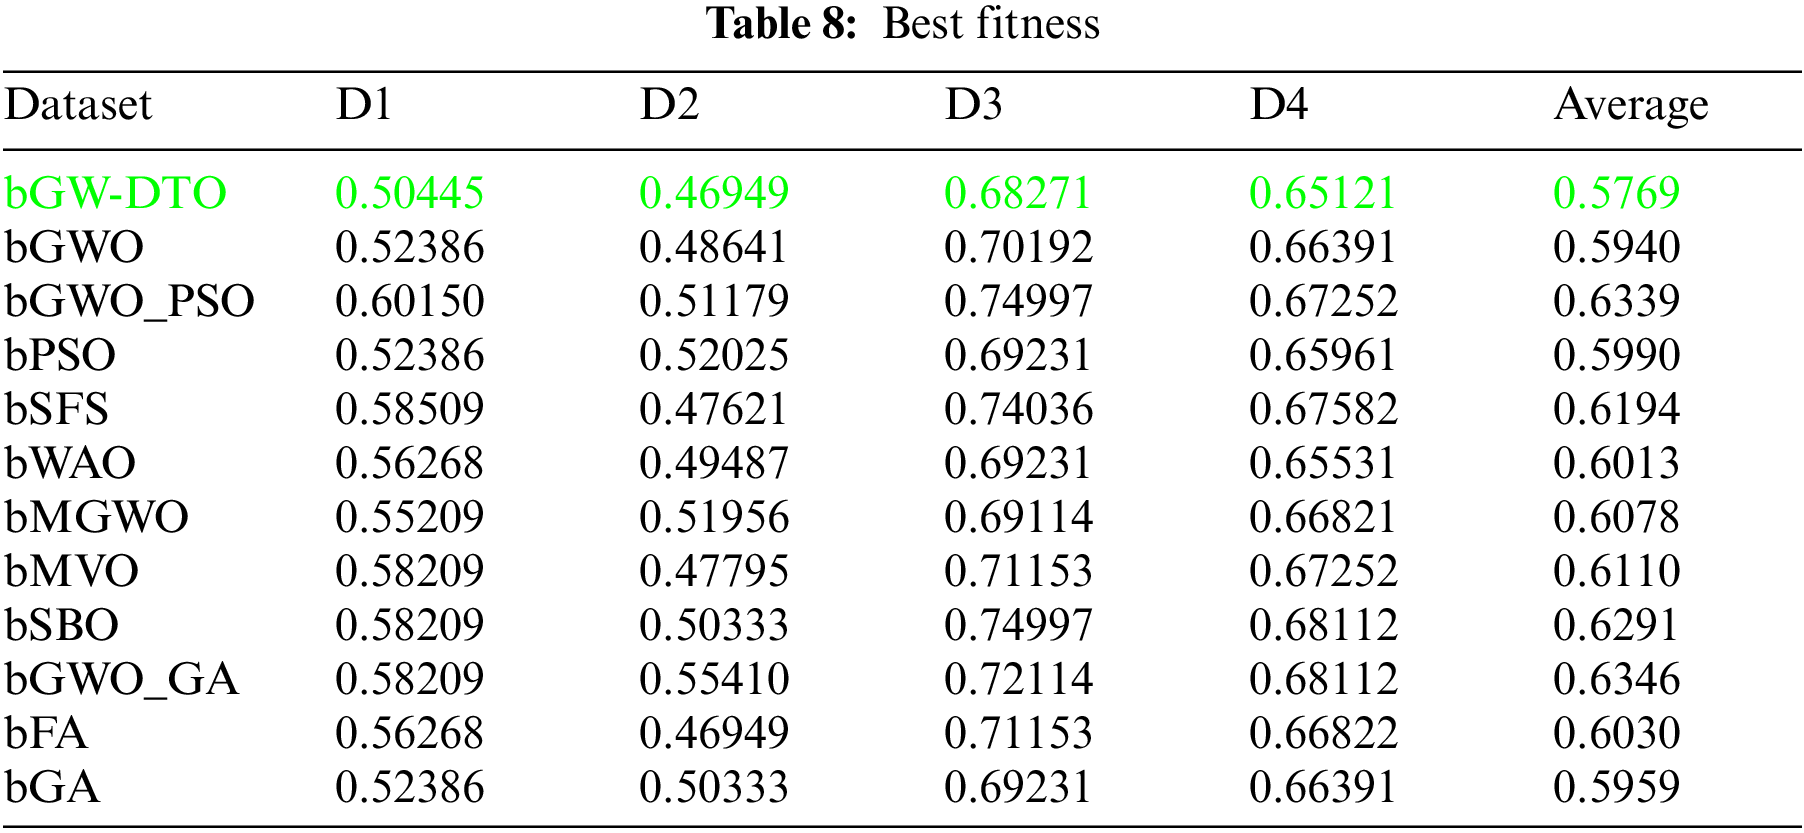
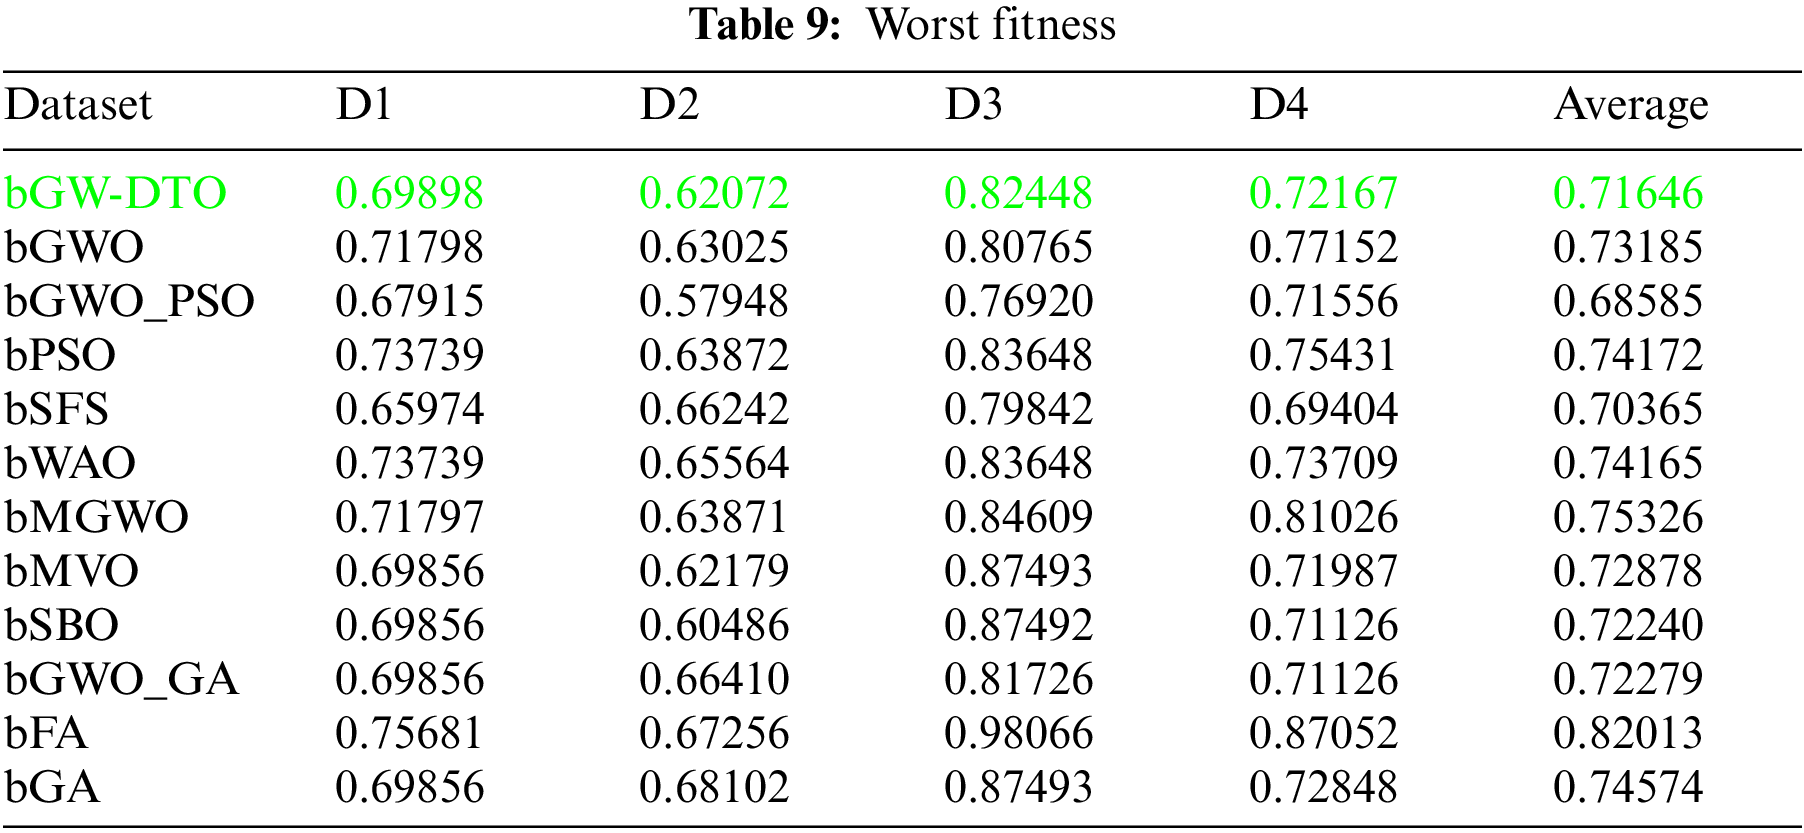
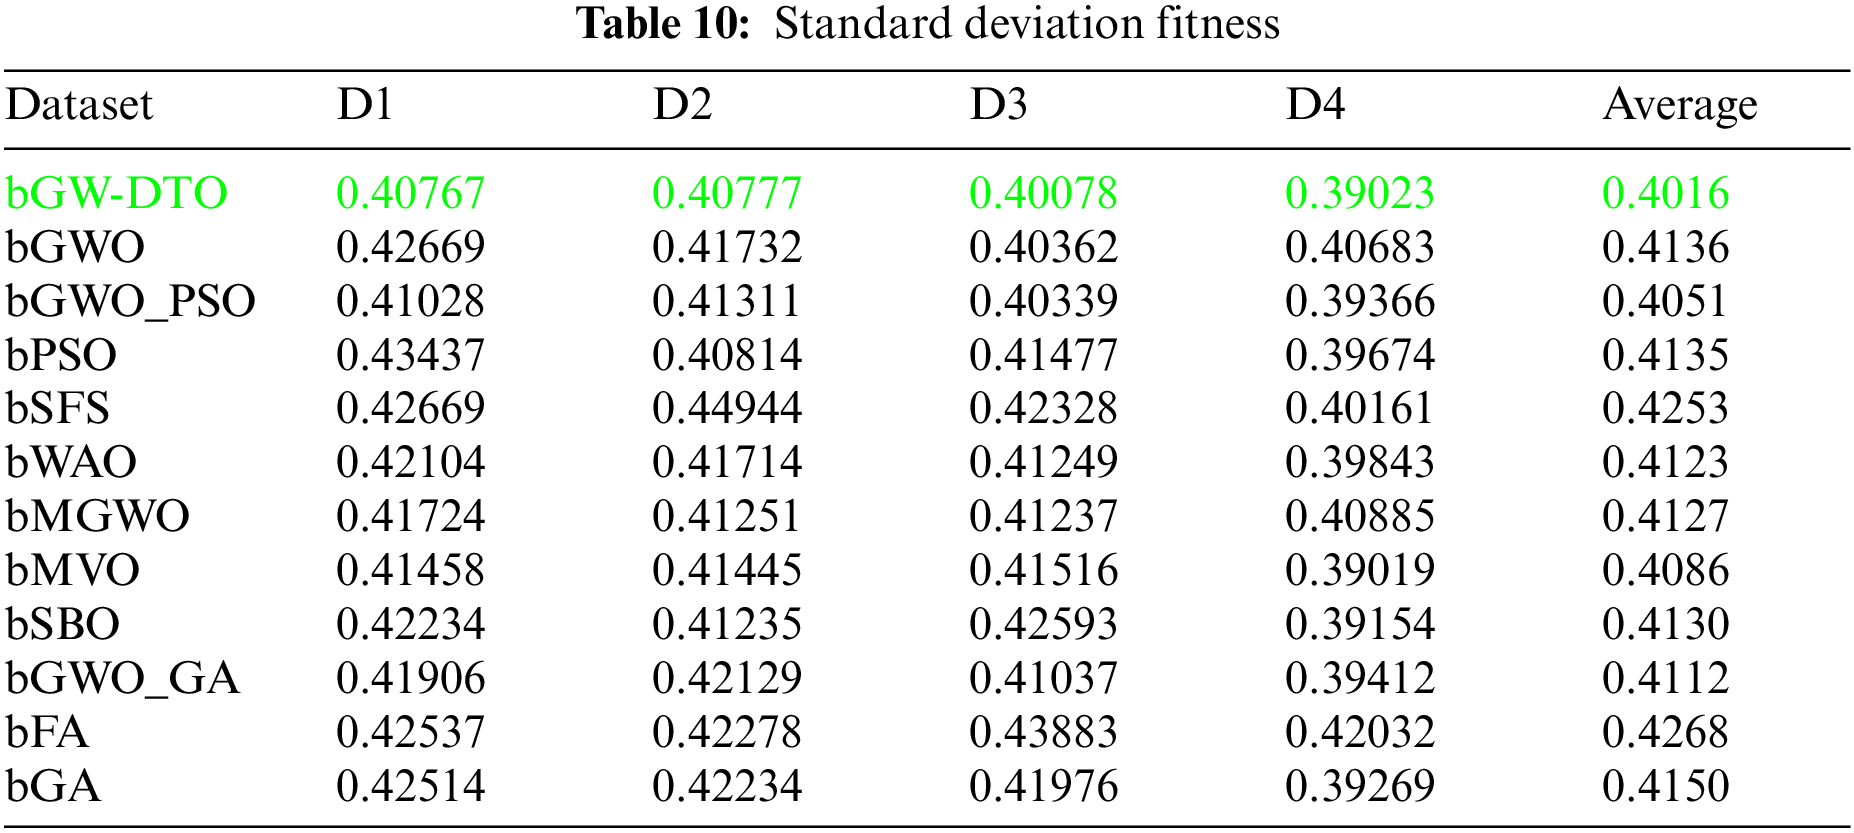
To prove the superiority of the proposed algorithm, a set of eleven feature selectors were applied to the same four datasets incorporated in the conducted experiments, and the results were recorded. Table 5 presented the average error resulting from selecting the best features using the proposed algorithm (bGW-DTO) and the other eleven approaches. As shown in the table, the proposed algorithm could achieve the minimum average error of (0.57186) for the dataset D1, (0.50924) for the dataset D2, (0.58111) for the dataset D3, and (0.52502) for the dataset D4. In addition, the overall average error is (0.5468), which is the minimum among all the employed feature extraction methods. In addition, a visual representation of the general average error is depicted, the minimum value is recorded by the proposed algorithm. Moreover, the average select size is presented in Table 6, the average fitness is presented in Table 7, the best fitness is presented in Table 8, the worst fitness is presented in Table 9, and the standard deviation in Table 10. As shown in these tables, the proposed algorithm has been able to find the superiority fitness for all datasets.
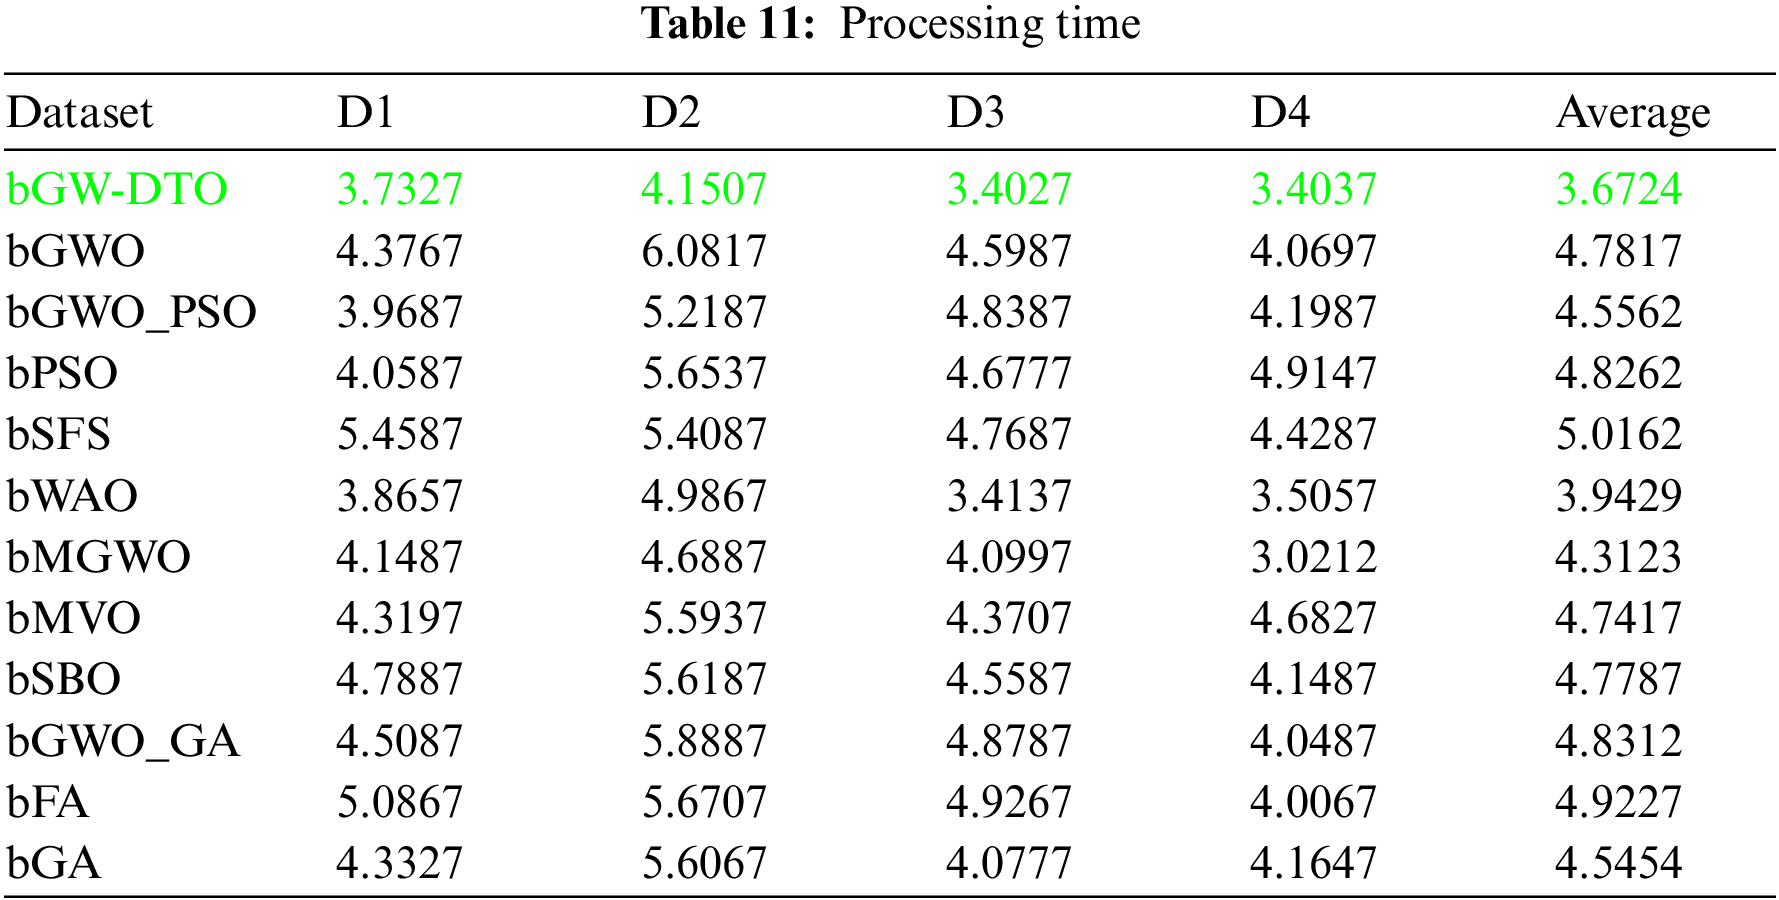
On the other hand, the speed of finding the single iteration performed for finding the best set of features is measured are recorded in Table 11. As shown in the table, the processing time of the proposed algorithm for D1 is (3.7327), for D2 is (4.1507), for D3 is (3.4027), and for D4 is (3.4037). In addition, the overall average processing time of the proposed algorithm is (3.6724). Based on these results, it can be noted that the proposed algorithm can perform the feature selection process in the shortest time among the other competing feature selection algorithms. It is clearly shown in this table that the proposed algorithm is considered the fastest when compared with the other eleven feature extraction algorithms.
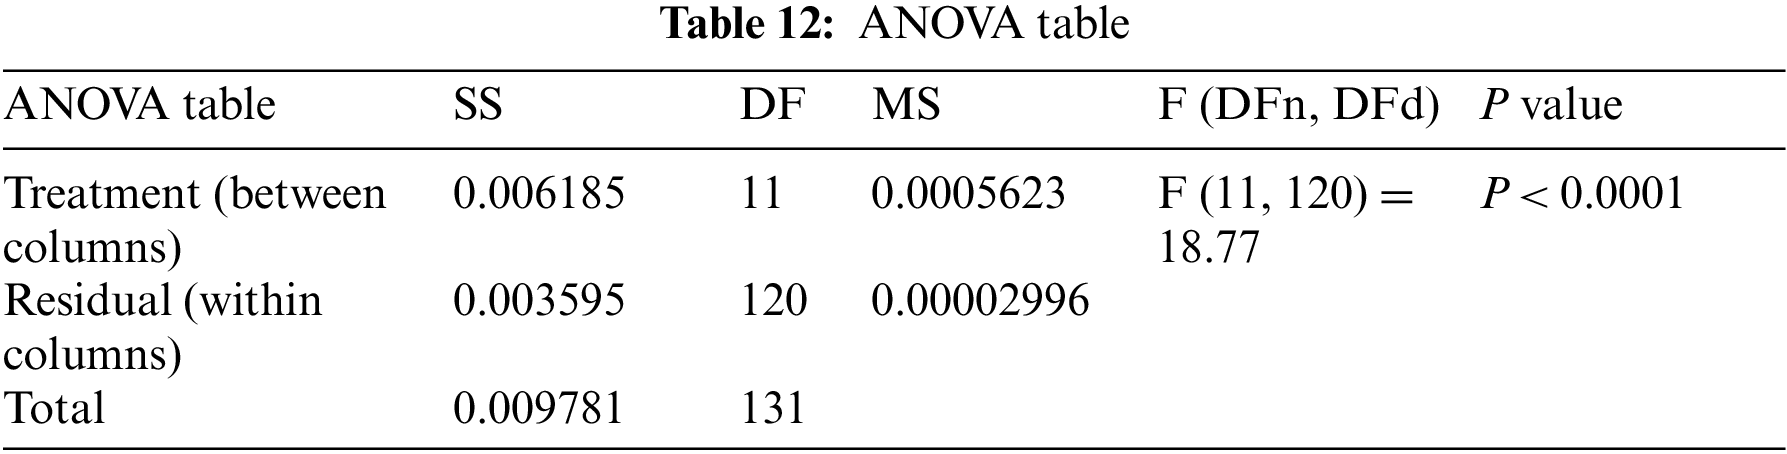
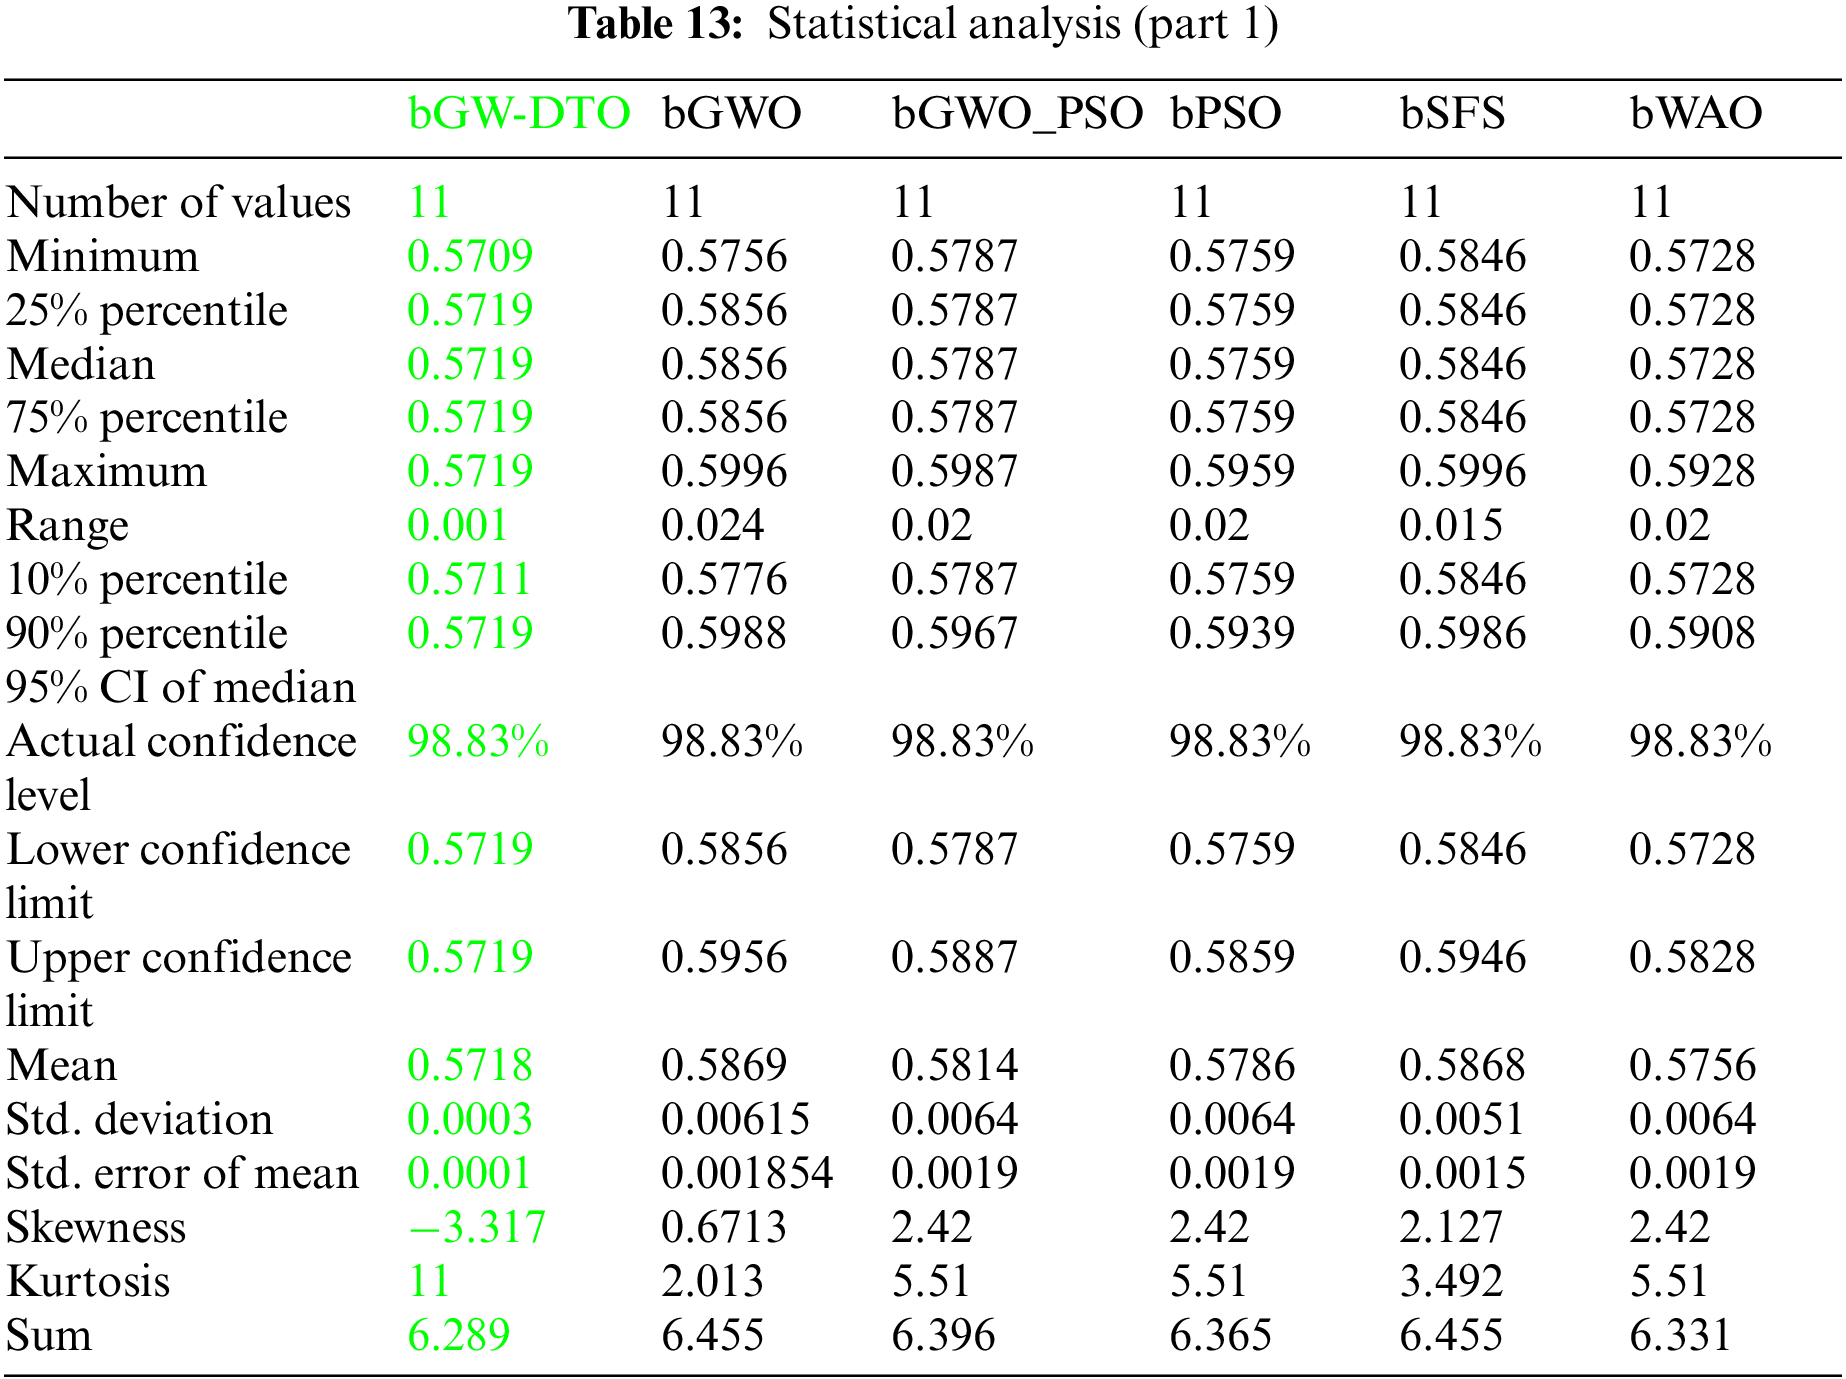
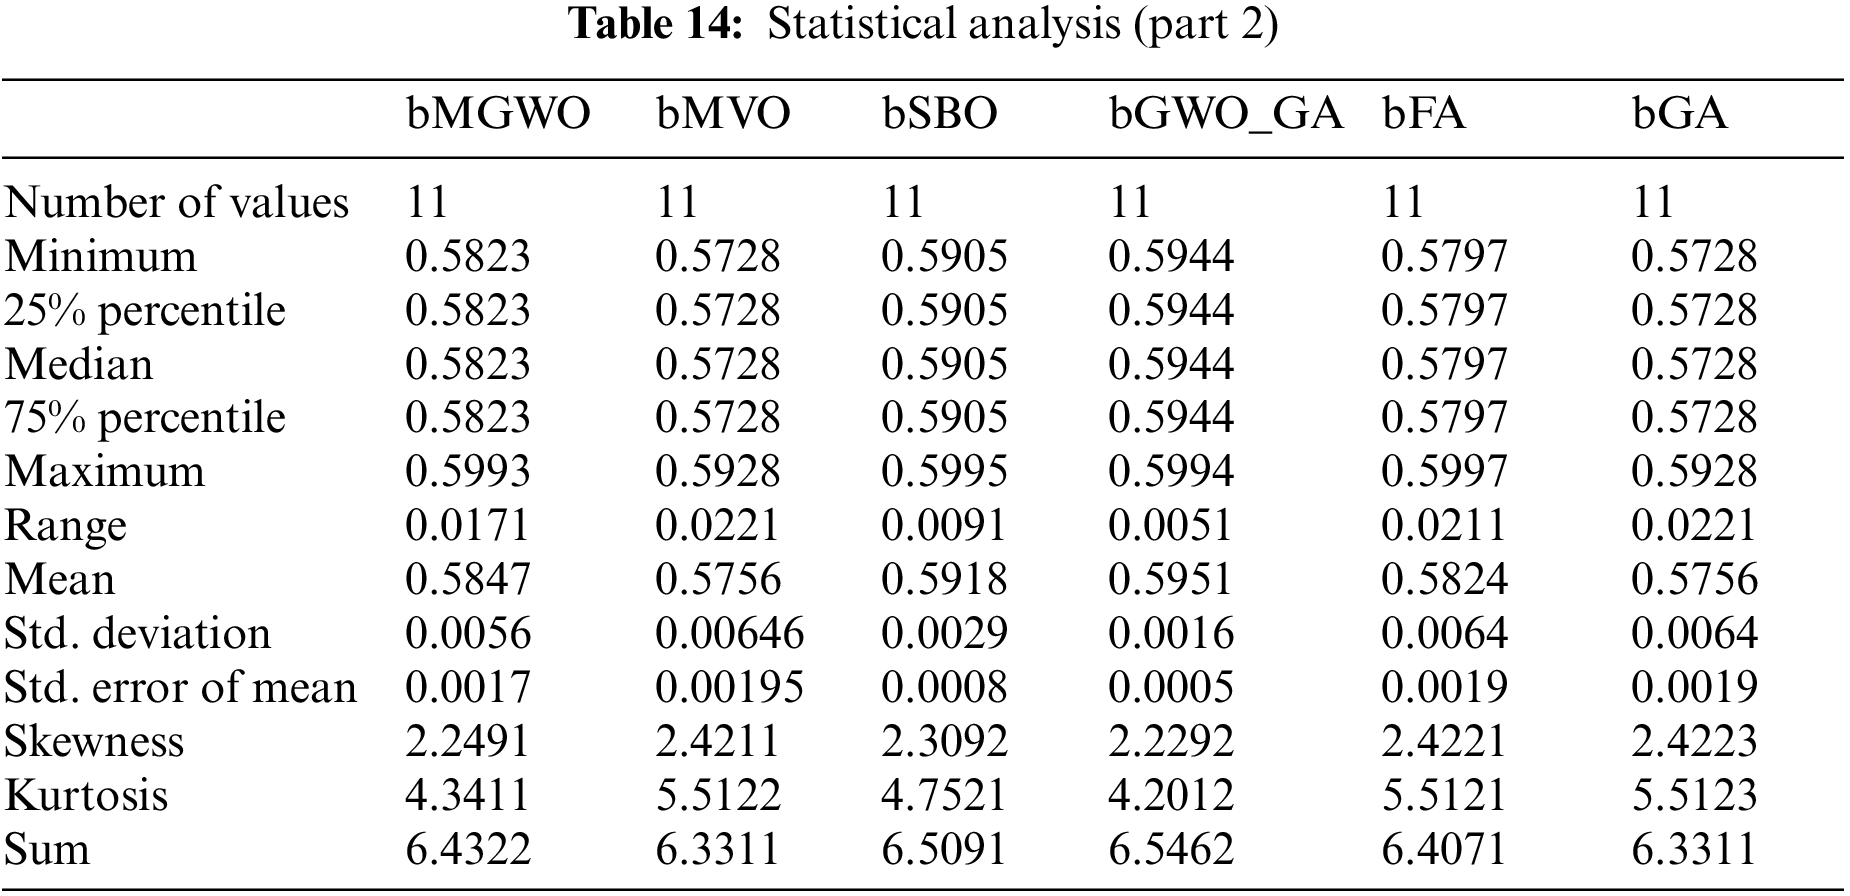
On the other hand, the statistical difference between the proposed bGW-DTO and the other competing algorithm is tested. To realize this test, a one-way analysis of variance (ANOVA) test is employed. Two main hypotheses are set in this test, namely, the null hypothesis and the alternate hypothesis. For the null hypothesis denoted by H0, the mean values of the algorithm is set equal, μbGW-DTO = μbGW = μbGW-PSO = μbSFS = μbPSO = μbWAO = μbMGWO = μbMVO = μbSBO = μbGW-GA = μbFA = μbGA). Whereas in the alternate hypothesis denoted by H1, the means of the algorithms are not equal. The results of the ANOVA test are presented in Table 12. As shown in the table, the expected effectiveness of the proposed algorithm is confirmed when compared with other feature selection methods. In addition, a statistical analysis of the achieved results is presented in Tables 13 and 14.
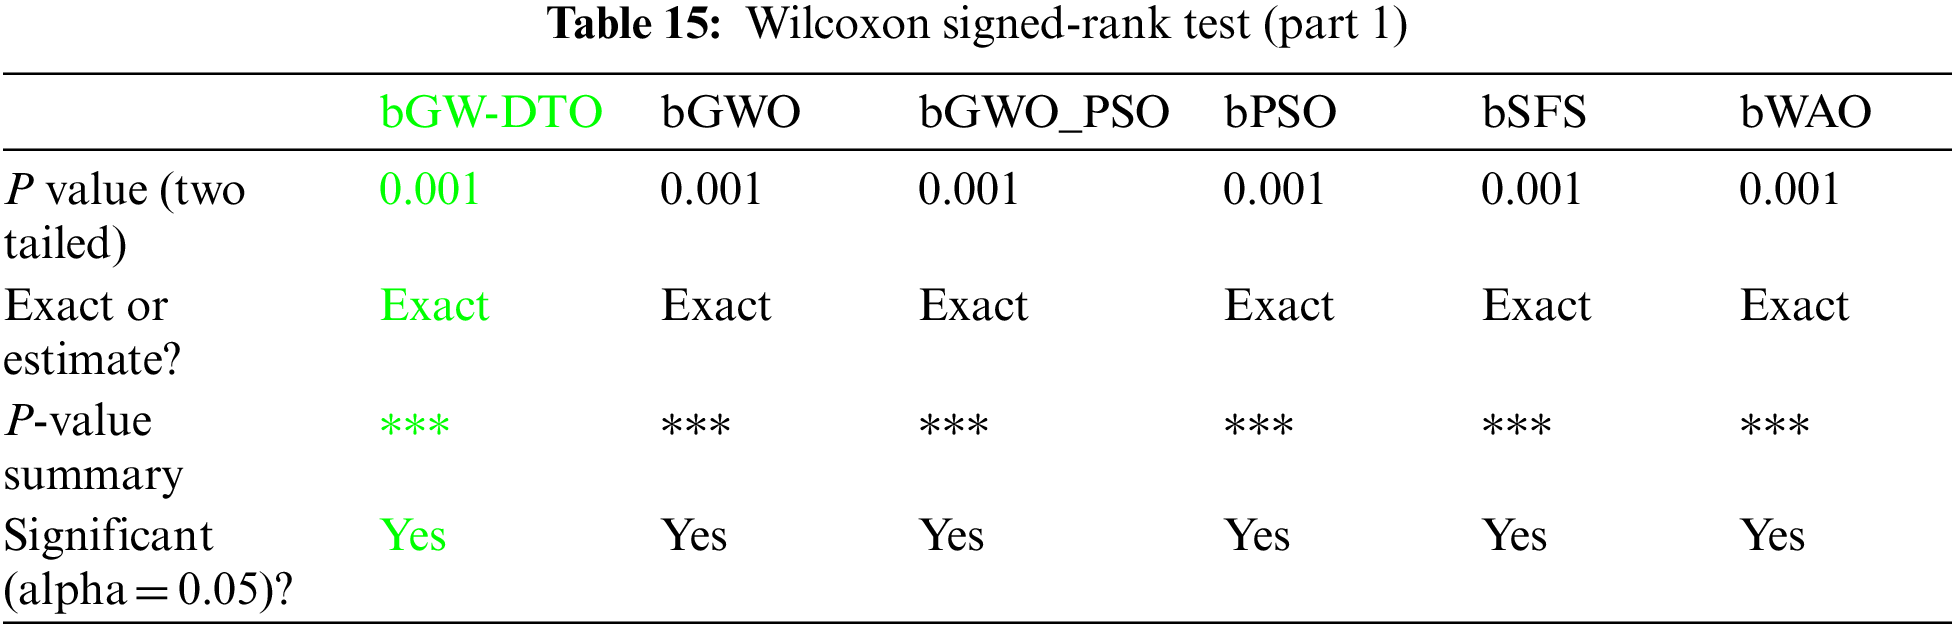
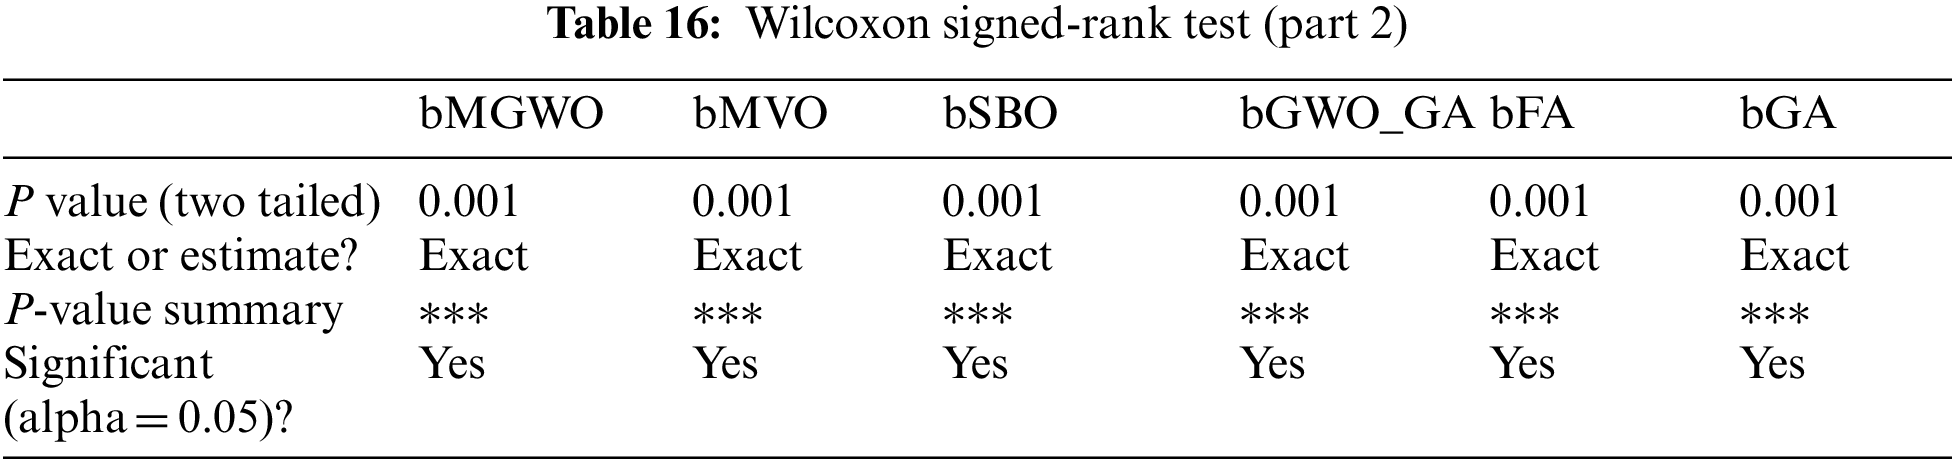
Moreover, the statistical difference between every two algorithms is performed to get the p-values between the proposed bGW-DTO algorithm and the other competing approaches to prove that the proposed method has a significant difference. To realize this test, Wilcoxon’s rank-sum test is employed. Two main hypotheses are set in this test, namely, the null hypothesis and the alternate hypothesis. For the null hypothesis denoted by H0, the mean values of the algorithm is set equal, μbGW-DTO = μbGW, μbGW-DTO = μbGW-PSO, μbGW-DTO = μbSFS, μbGW-DTO = μbPSO, μbGW-DTO = μbWAO, μbGW-DTO = μbMGWO, μbGW-DTO = μbMVO, μbGW-DTO = μbSBO, μbGW-DTO = μbGW-GA, μbGW-DTO = μbFA, and μbGW-DTO = μbGA). Whereas in the alternate hypothesis denoted by H1, the means of the algorithms are not equal. The results of Wilcoxon’s rank-sum test are presented in Tables 15 and 16. As shown in the table, the p-values are less than 0.05 between the proposed algorithm and other algorithms, confirming the superiority of the proposed bGW-DTO algorithm and its statistical significance.
A more investigation of the results achieved by the proposed algorithm is represented by the plots in Fig. 1. In this figure, four plots are depicted to emphasize the effectiveness of the proposed algorithm. The first plot is the residual plot, in which the predicted values are plotted with the residual error. In this plot, it can be shown that the residual error is minor and lies between -0.01 and 0.02, which indicates the high accuracy of the resulting values. The second plot is the QQ plot in which the actual and predicted values approximately fit a line, and this proves the effectiveness of the proposed algorithm. in which the proposed approach is shown to outperform the other methods.
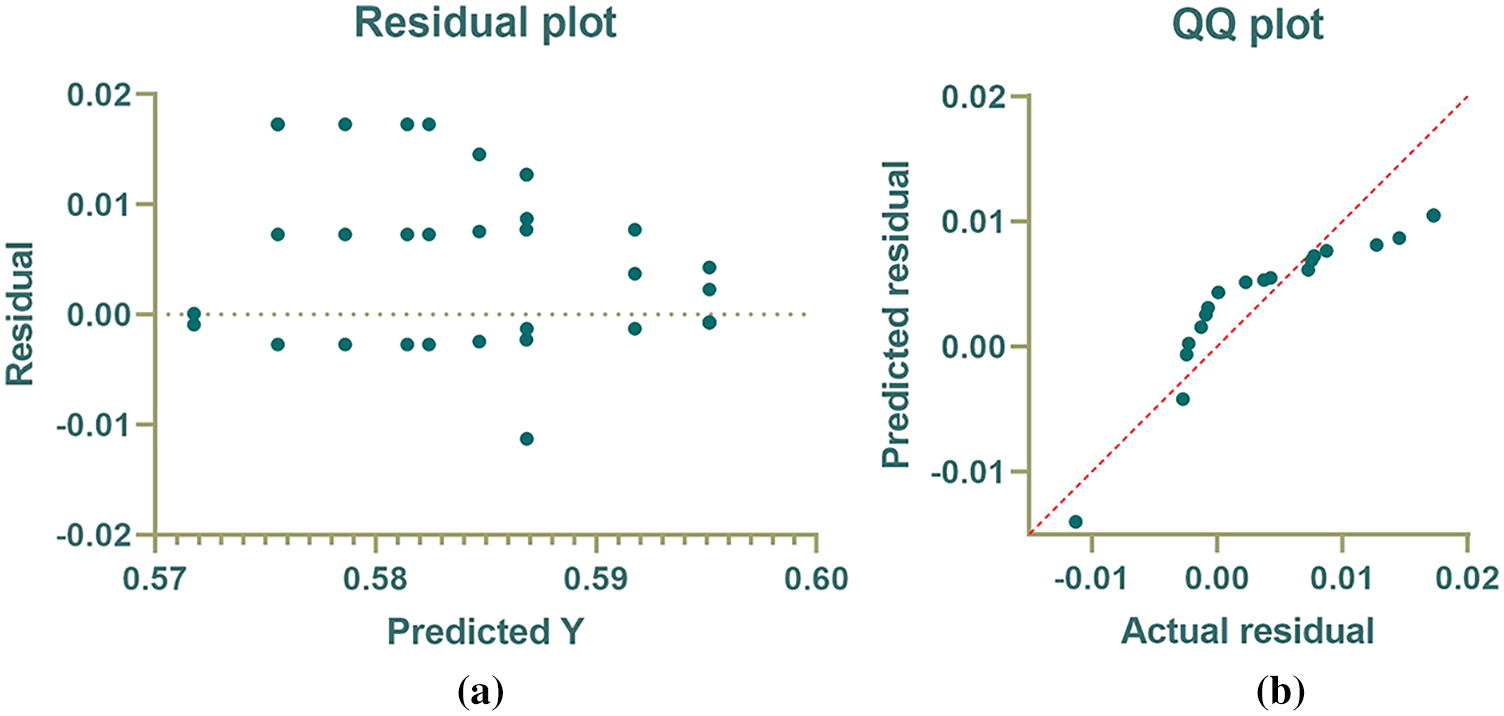
Figure 1: Analytical plots of the achieved results
Fig. 2 depicts the histogram of the average error of the achieved results using the proposed and other approaches. In this figure, the error values achieved by the proposed bGW-DTO are smaller than those achieved by the different methods. In addition, the number of occurrences of these error values is more enormous than the corresponding values reached in the other approaches. These results confirm the effectiveness of the proposed method in selecting the significant features that could achieve the minimum error values.
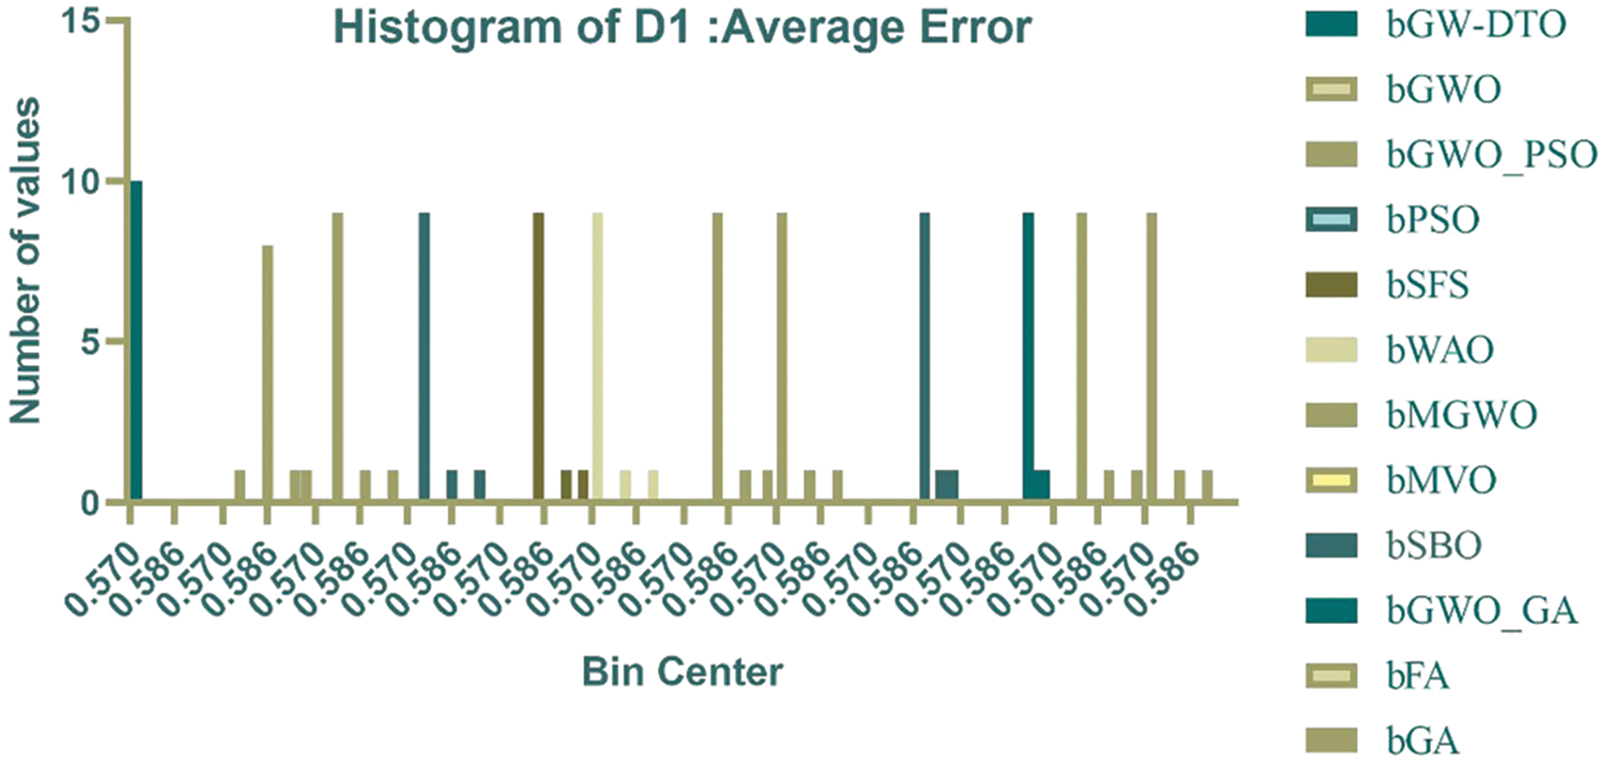
Figure 2: Histogram of the average error
In this paper, we proposed a new algorithm for feature selection based on a hybrid guided whale optimization algorithm and dipper throated optimizer. The proposed algorithm exploits the advantages of both optimizers in terms of exploration and exploitation properties. The proposed algorithm is applied to the problem of a breast cancer diagnosis. Four datasets from the UCI repository were incorporated in the conducted experiments. To prove the effectiveness of the proposed algorithm, a set of experiments were conducted and evaluated using several evaluation criteria. The achieved results showed the superiority of the proposed algorithm and its stability in classifying breast cancer cases. In addition, statistical analysis is performed in terms of the Wilcoxon and analysis of variance tests to emphasize the effectiveness of the proposed method. The overall results achieved by the proposed method outperform the corresponding results using the other eleven feature selection methods. The future perspective of this research is to evaluate the proposed algorithm using thermal images of breast cancer cases.
Acknowledgement: Princess Nourah bint Abdulrahman University Researchers Supporting Project Number (PNURSP2022R104), Princess Nourah bint Abdulrahman University, Riyadh, Saudi Arabia.
Funding Statement: Princess Nourah bint Abdulrahman University Researchers Supporting Project Number (PNURSP2022R104), Princess Nourah bint Abdulrahman University, Riyadh, Saudi Arabia.
Conflicts of Interest: The authors declare that they have no conflicts of interest to report regarding the present study.
References
1. A. Ibrahim, S. Mohammed, H. Ali and S. Hussein, “Breast cancer segmentation from thermal images based on chaotic salp swarm algorithm,” IEEE Access, vol. 8, pp. 122121–122134, 2020. [Google Scholar]
2. M. Etehadtavakol and E. Ng, “Breast thermography as a potential non-contact method in the early detection of cancer: A review,” Journal of Mechanics in Medicine and Biology, vol. 13, no. 2, pp. 1–20, 2013. [Google Scholar]
3. J. Shan, “A fully automatic segmentation method for breast ultrasound images,” Ph.D. dissertation, Department of Computer Science, Utah State Univ., Logan, UT, USA, 2011. [Google Scholar]
4. C. Sehgal, S. Weinstein, P. Arger and E. Conant, “A review of breast ultrasound,” Journal of Mammary Gland Biol Neoplasia, vol. 11, no. 2, pp. 113–123, 2006. [Google Scholar]
5. T. Nelson, L. Cervino, J. Boone and K. Lindfors, “Classification of breast computed tomography data,’’ Medical Physics, vol. 35, no. 3, pp. 1078–1086, 2008. [Google Scholar]
6. A. Jalalian, S. Mashohor, R. Mahmud, B. Karasfi, M. Iqbal Saripan et al., “Computer-assisted diagnosis system for breast cancer in computed tomography laser mammography (CTLM),” Journal of Digital Imaging, vol. 30, no. 6, pp. 796–811, 2017. [Google Scholar]
7. P. Pavithra, R. Ravichandran, S. Sekar and M. Manikandan, “The effect of thermography on breast cancer detection: A survey,’’ Systematic Reviews in Pharmacy, vol. 9, no. 1, pp. 10–16, 2018. [Google Scholar]
8. S. Prabha, C. Sujatha and S. Ramakrishnan, “Asymmetry analysis of breast thermograms using BM3D technique and statistical texture features,” in Proc. of Int. Conf. on Informatics, Electronics and Visualization, Dhaka, Bangladesh, pp. 1–4, 2014. [Google Scholar]
9. L. Silva, D. Saade, G. Sequeiros, A. Silva, A. Paiva et al., “A new database for breast research with infrared image,” Journal of Medical Image and Health Informatics, vol. 4, no. 1, pp. 92–100, 2014. [Google Scholar]
10. M. Tan and J. Schlimmer, M. Zwitter and M. Soklic, “Breast cancer data set,” 1988, Accessed: April. 1, 2022. [Online]. Available: https://archive.ics.uci.edu/ml/datasets/Breast+Cancer. [Google Scholar]
11. M. Patrício, J. Pereira, J. Crisóstomo, P. Matafome, M. Gomes et al., “Breast cancer coimbra data set,” 2018, Accessed: April. 1, 2022. [Online]. Available: https://archive.ics.uci.edu/ml/datasets/Breast+Cancer+Coimbra#. [Google Scholar]
12. O. Mangasarian and W. Wolberg, “Breast cancer Wisconsin (Original) data set,” 1990, Accessed: April. 1, 2022. [Online]. Available: https://archive.ics.uci.edu/ml/datasets/Breast+Cancer+Wisconsin+%28Original%29. [Google Scholar]
13. K. Bennett and O. Mangasaria, “Breast cancer Wisconsin (Diagnostic) data set,” 1992, Accessed: April. 1, 2022. [Online]. Available: https://archive.ics.uci.edu/ml/datasets/Breast+Cancer+Wisconsin+%28Diagnostic%29. [Google Scholar]
14. S. Mambou, P. Maresova, O. Krejcar, A. Selamat and K. Kuca, “Breast cancer detection using infrared thermal imaging and a deep learning model,” Sensors, vol. 18, no. 9, pp. 2799, 2018. [Google Scholar]
15. L. Ehsan and F. Mohammad, “Early breast cancer detection in thermogram images using AdaBoost classifier and fuzzy C-means clustering algorithm,” Middle East Journal of Cancer, vol. 7, no. 3, pp. 113–124, 2016. [Google Scholar]
16. A. Lashkari and M. Firouzmand, “Developing a toolbox for clinical preliminary breast cancer detection in different views of thermogram images using a set of optimal supervised classifiers,” Scientific Iranica, vol. 25, no. 3, pp. 1545–1560, 2018. [Google Scholar]
17. F. Li, C. Ou, Y. Gui and L. Xiang, “Instant edit propagation on images based on bilateral grid,” Computers Materials & Continua, vol. 61, no. 2, pp. 643–656, 2019. [Google Scholar]
18. N. Mohamed, “Breast cancer risk detection using digital infrared thermal images,” International Journal Bioinformatics and Biomedical Engineering, vol. 1, no. 2, pp. 185–194, 2015. [Google Scholar]
19. S. Kamath, K. Prasad and K. V. Rajagopal, “Segmentation of breast thermogram images for the detection of breast cancer: A projection profile approach,’’ Journal of Image and Graphics, vol. 3, no. 1, pp. 47, 2015. [Google Scholar]
20. H. Minh, M. Van and T. Lang, “Deep feature fusion for breast cancer diagnosis on histopathology images,” in 11th Int. Conf. on Knowledge and Systems Engineering (KSE), Da Nang, pp. 1–6, 2019. [Google Scholar]
21. M. Khadermi and S. Nedialkov, “Probabilistic graphical models and deep belief networks for prognosis of breast cancer,” in IEEE 14th Int. Conf. on Machine Learning and Applications, Miami, FL, USA, pp. 727–732, 2015. [Google Scholar]
22. P. Mekha and N. Teeyasuksaet, “Deep learning algorithms for predicting breast cancer based on tumor cells,” in Int. Conf. on Digital Arts, Media and Technology and 2nd ECTI Northern Section Conf. on Electrical, Electronics, Computer and Telecommunication Engineering, Nan, Thailand, pp. 343–346, 2019. [Google Scholar]
23. N. Rane, J. Sunny, R. Kanade and S. Devi, “Breast cancer classification and prediction using machine learning,” International Journal of Engineering Research & Technology, vol. 9, no. 02, pp. 576–580, 2020. [Google Scholar]
24. W. Fathy and A. Ghoneim, “A deep learning approach for breast cancer mass detection,” International Journal of Advanced Computer Science and Applications, vol. 10, no. 1, pp. 175–182, 2019. [Google Scholar]
25. R. Chtihrakkannan, P. Kavitha, T. Mangayarkarasi and R. Karthikeyan, “Breast cancer detection using machine learning,” International Journal of Innovative Technology and Exploring Engineering, vol. 8, no. 11, pp. 3123–3126, 2019. [Google Scholar]
26. S. Nallamala, P. Mishra and S. Koneru, “Breast cancer detection using machine learning way,” International Journal of Recent Technology and Engineering, vol. 8, no. 2S3, pp. 1402–1405, 2019. [Google Scholar]
27. A. Kumar, R. Sushil and A. Tiwari, “Comparative study of classification techniques for breast cancer diagnosis,” International Journal of Computer Science and Engineering, vol. 7, no. 1, pp. 234–240, 2019. [Google Scholar]
28. W. Wang, Y. Li, T. Zou, X. Wang, J. You et al., “A novel image classification approach via dense-MobileNet models,” Mobile Information Systems, vol. 2020, no. 1, pp. 1–8, 2020. [Google Scholar]
29. A. A. Abdelhamid and S. R. Alotaibi, “Robust prediction of the bandwidth of metamaterial antenna using deep learning,” Computers, Materials & Continua, vol. 72, no. 2, pp. 2305–2321, 2022. [Google Scholar]
30. A. Takieldeen, E., El-kenawy, E. Hadwan and M. Zaki, “Dipper throated optimization algorithm for unconstrained function and feature selection,” Computers, Materials & Continua, vol. 72, no. 1, pp. 1465–1481, 2022. [Google Scholar]
31. M. M. Eid, E.-S. M. El-kenawy and A. Ibrahim, “A binary sine cosine-modified whale optimization algorithm for feature selection,” in National Computing Colleges Conf., Taif, Saudi Arabia, pp. 1–6, 2021. [Google Scholar]
32. M. Hassib, I. El-Desouky, M. Labib and E.-S. M. El-kenawy, “WOA + BRNN: An imbalanced big data classification framework using whale optimization and deep neural network,” Soft Computing, vol. 24, no. 1, pp. 5573–5592, 2020. [Google Scholar]
33. A. Ibrahim, H. A. Ali, M. M. Eid and E.-S. M. El-Kenawy, “Chaotic harris hawks optimization for unconstrained function optimization,” in 2020 16th Int. Computer Engineering Conf. (ICENCO), Cairo, Egypt, IEEE, pp. 153–158, 2020. [Google Scholar]
34. A. A. Salamai, E.-S. M. El-kenawy and A. Ibrahim, “Dynamic voting classifier for risk identification in supply chain 4.0,” Computers, Materials & Continua, vol. 69, no. 3, pp. 3749–3766, 2021. [Google Scholar]
35. N. Prerita, A. Rana and A. Chaudhary, “Breast cancer detection using machine learning algorithms,” in Int. Conf. on Reliability, Infocom Technologies and Optimization (Trends and Future Directions) (ICRITO), Noida, India, pp. 114–118, 2021. [Google Scholar]
36. S. S. M. Ghoneim, T. A. Farrag, A. A. Rashed, E.-S. M. El-Kenawy and A. Ibrahim, “Adaptive dynamic meta-heuristics for feature selection and classification in diagnostic accuracy of transformer faults,” IEEE Access, vol. 9, no. 1, pp. 78324–78340, 2021. [Google Scholar]
37. E.-S. M. El-Kenawy, S. Mirjalili, A. Ibrahim, M. Alrahmawy, M. El-Said et al., “Advanced meta-heuristics, convolutional neural networks, and feature selectors for efficient COVID-19 X-ray chest image classification,” IEEE Access, vol. 9, no. 1, pp. 36019–36037, 2021. [Google Scholar]
38. E.-S. M. El-kenawy and M. Eid, “Hybrid gray wolf and particle swarm optimization for feature selection,” International Journal of Innovative Computing, Information & Control, vol. 16, no. 1, pp. 831–844, 2020. [Google Scholar]
39. W. Wang, X. Huang, J. Li, P. Zhang and X. Wang, “Detecting COVID-19 patients in X-ray images based on MAI-nets,” International Journal of Computational Intelligence Systems, vol. 14, no. 1, pp. 1607–1616, 2021. [Google Scholar]
40. Y. Gui and G. Zeng, “Joint learning of visual and spatial features for edit propagation from a single image,” The Visual Computer, vol. 36, no. 3, pp. 469–482, 2020. [Google Scholar]
Cite This Article
 Copyright © 2023 The Author(s). Published by Tech Science Press.
This work is licensed under a Creative Commons Attribution 4.0 International License , which permits unrestricted use, distribution, and reproduction in any medium, provided the original work is properly cited.
 Downloads
 Citation Tools