
 Submit a Paper
 Propose a Special lssue
 Open Access
ARTICLE

TinyML-Based Classification in an ECG Monitoring Embedded System
1 Department of Intelligence and Information, Seoul National University, Seoul, 08826, Korea
2 Nexon Korea Cop., Seongnam, Kyungki, 13487, Korea
3 Advanced CP Lab. Samsung Electronics, Suwon, Kyungki, 16677, Korea
4 Department of Electronic Engineering, Kyung Hee University, Yongin, Kyungki, 17104, Korea
5 Division of Information & Communication Engineering, Kongju National University, Cheonan, Chungcheongnam, 31080, Korea
* Corresponding Author: Yeunwoong Kyung. Email:
Computers, Materials & Continua 2023, 75(1), 1751-1764. https://doi.org/10.32604/cmc.2023.031663
Received 23 April 2022; Accepted 15 November 2022; Issue published 06 February 2023
 View Full Text
 Download PDF
Abstract
Recently, the development of the Internet of Things (IoT) has enabled continuous and personal electrocardiogram (ECG) monitoring. In the ECG monitoring system, classification plays an important role because it can select useful data (i.e., reduce the size of the dataset) and identify abnormal data that can be used to detect the clinical diagnosis and guide further treatment. Since the classification requires computing capability, the ECG data are usually delivered to the gateway or the server where the classification is performed based on its computing resource. However, real-time ECG data transmission continuously consumes battery and network resources, which are expensive and limited. To mitigate this problem, this paper proposes a tiny machine learning (TinyML)-based classification (i.e., TinyCES), where the ECG monitoring device performs the classification by itself based on the machine-learning model, which can reduce the memory and the network resource usages for the classification. To demonstrate the feasibility, after we configure the convolutional neural networks (CNN)-based model using ECG data from the Massachusetts Institute of Technology (MIT)-Beth Israel Hospital (BIH) arrhythmia and the Physikalisch Technische Bundesanstalt (PTB) diagnostic ECG databases, TinyCES is validated using the TinyML-supported Arduino prototype. The performance results show that TinyCES can have an approximately 97% detection ratio, which means that it has great potential to be a lightweight and resource-efficient ECG monitoring system.Keywords
Cardiovascular diseases (CVDs) have become the leading cause of death globally, accounting for an estimated 17.9 million lives in 2019 (i.e., 32% of all global deaths) [1]. Arrhythmia is considered as an important sign of CVDs. As a result, electrocardiogram (ECG) monitoring, which can detect arrhythmias, has attracted much attention [2]. However, it is difficult for short-term ECG monitoring to find arrhythmias because they occur intermittently. Therefore, continuous and long-term ECG monitoring, such as the Holter test, has become an essential test for medical checkups [3,4]. The Holter includes electrodes and an ECG machine where electrodes are placed at certain points on the chest and the abdomen and then connected to the ECG machine by wires. Then, ECG can be measured and recorded. The Holter monitor records ECG data for 24 or 48 h to detect intermittent arrhythmias. However, since ECG analysis is only available after 24 or 48 h, Holter cannot provide real-time feedback for abnormal heart activity. In addition, Holter requires large internal memory because it records all measured data during the whole test period. Moreover, the postprocessing such as big data analysis based on the machine learning (ML) [5–8] for long-term data can be a heavy task for the backend server, as well as for the medical staff. To mitigate this problem, an ECG monitoring device with a wireless module has been researched for real-time ECG analysis. It enables the transmission of ECG data to a gateway (e.g., a smartphone or a router) or server that can analyze the ECG data and receive the result of the analysis in real time [9–14]. The ECG analysis in the gateway or server includes a classification that classifies the input ECG data into normal and abnormal ECG data. Classification plays an important role in the ECG monitoring system because it can select useful data (i.e., reduce the size of the dataset) and identify abnormal data that can be used to detect the clinical diagnosis and guide further treatment. Since the classification requires computability, the ECG data are usually delivered to the gateway or server where the classification is performed based on its computing resource. However, real-time ECG data transmission continuously consumes battery and network bandwidth, which are expensive and have limited resources.
Meanwhile, according to the development of internet of things (IoT) technologies in terms of the communications [15–17], coverage [18–20], and security [21], tiny machine learning (TinyML) has recently emerged as a concept to deploy ML to embedded and resource-constrained IoT devices powered by microcontrollers (MCUs) [22,23]. This allows the devices to have a low service delay, reduced data transmission (i.e., low network bandwidth usage), energy efficiency, and low cost as a result of the MCU’s local computation without the help of external resources (e.g., server or gateway).
By using the benefits of TinyML, this paper introduces TinyCES: TinyML-based classification for ECG monitoring embedded systems. In TinyCES, an MCU-based low-power ECG monitoring device performs the classification by itself based on the machine-learning model, which can reduce the memory and network usage for the classification.
The key contributions of this paper can be listed as follows:
1) To the best of our knowledge, this is the first study to introduce the TinyML concept into the ECG monitoring system. Since the previous works on the ECG monitoring system require the transmission of ECG data to a gateway (e.g., a smartphone or a router) or server and the processing on them, the resources for the communications and computing should be supported. To mitigate the problems, the proposed scheme aims to process the ECG data within the embedded monitoring device by itself using the TinyML concept.
2) To support the reasonable classification accuracy even in the embedded monitoring device, this paper develops and optimizes a CNN model supported by TensorFlow Lite for microcontrollers using ECG data from the Massachusetts Institute of Technology (MIT)-Beth Israel Hospital (BIH) Arrhythmia and Physikalisch Technische Bundesanstalt (PTB) diagnostic ECG databases. The developed model has about 97% accuracy with small model size (i.e., 27 Kbytes), meaning that it has great potential to be a lightweight and resource-efficient ECG monitoring system.
3) For the feasibility test, we perform the Arduino-based implementation and show the superiority of the proposed scheme in terms of the average amount of network bandwidth usage and the average size of recorded ECG data. This means that the proposed scheme can be valuable guidelines for the advanced TinyML-based ECG monitoring system. The remainder of this paper is organized as follows. After related works on the TinyML and previous ECG monitoring systems are reviewed in Section 2, TinyCES is introduced in Section 3. Prototype evaluation is provided in Section 4. Finally, concluding remarks and future works are given in Section 5.
TinyML enables the integration of intelligence within embedded and resource-constrained systems. Along with the increasing trend for the artificial intelligence of things (AIoT), TinyML has been considered as an important paradigm [24]. The TinyML community has been leading the efforts to integrate ML into MCU-based small IoT devices. In addition, Ericsson, one of the biggest network companies, predicted that TinyML plays a platform role, such as TinyML-as-a-Service [25]. According to the benefits of TinyML in terms of energy efficiency, low cost, data security, and latency, there have been several efforts to apply TinyML to various services and applications [26–31]. Raza et al. [26] leveraged TinyML to provide intelligence to unmanned aerial vehicles (UAVs) with advanced decision-making capabilities. To complete the given mission in an energy-efficient way, the MCU included in the UAV hosts a set of ML inference tools and determines the moving direction based on self-learning. Piatkowaski et al. [27] developed a TinyML-based concept system that can detect whether the face mask is worn properly or not. This work proved that TinyML can also be utilized for complex computer vision tasks with acceptable accuracy. Kadir et al. [28] presented a TinyML model that can classify incoming audio data into adults and children. Even though the performance results can be dependent on the given various scenarios, this model is validated using the Arduino Nano 33 BLE sense microcontroller. Ooko et al. [29] developed a TinyML-based portable breath analysis check-up kit for the early detection of respiratory diseases. Without internet connectivity, this kit can locally configure the model and predict respiratory disease based on the model. Prado et al. [30] utilized TinyML in the autonomous driving system for mini vehicles, which have limited on-board storage and computability. Although the dynamic environments where the current distribution is different from that learned from the training are challenging in autonomous driving, they show that TinyML can improve the robustness and the energy efficiency with suitable decisions. As several review works predicted [31], one of the main candidate applications of TinyML will be wearable medical and healthcare devices. However, since integrating TinyML into medical and healthcare devices is an initial stage, there are very few works on it [31]. Furthermore, no previous work considered the TinyML-based ECG monitoring system.
Since the traditional ECG monitoring test Holter cannot provide real-time feedback for abnormal heart activity and can burden the backend server and medical staff due to long-term data analysis; many works have been conducted to enhance the ECG monitoring system [9–14,32–36]. As shown in Table 1, these can be categorized into 1) systemic approaches [9–14] and 2) algorithmic approaches [32–36]. Note that our work in this paper can be categorized into the systemic approach.

Liu et al. [9] implemented an Internet of Things (IoT)-based ECG monitoring system where real-time ECG data collection and accurate signal analysis are performed on the smartphone side, and then the results are delivered to the cloud application and the medical staff. Similarly, Satija et al. [10] provided an IoT-enabled ECG telemetry system. In this system, ECG data are continuously delivered to a smartphone through Bluetooth, and their quality assessment is implemented on the smartphone application. Ozkan et al. [11] demonstrated hardware and software designs for a wearable tele-ECG monitoring system based on textile threads. Smartphones in this system also play an interface role to deliver the ECG data to the server and show information to patients. Yang et al. [12] proposed an ECG monitoring system without an intermediate node, such as smartphones, where ECG data are collected from wearable sensors and transmitted directly to the IoT cloud using Wi-Fi via the Hypertext Transfer Protocol (HTTP) and Message Queuing Telemetry Transport (MQTT) protocol. In addition, Wan et al. [13] also addressed a problem of using the intermediate node for an ECG monitoring system because of the limited power consumption and introduced a real-time health monitoring system with data that are gathered from the sensor nodes and directly delivered to the cloud. Pathinarupothi et al. [14] developed a smart edge system that analyzed incoming ECG data and computed the aggregate alert score for patients. However, even though these works aimed to provide real-time ECG data processing based on edge, smartphone, and portable computing, they did not consider the processing in the MCU-based low-power computing by the monitoring device itself, which can reduce the time, memory, and network resources for the processing.
Celin et al. [32] introduced several types of classifiers, including a support vector machine (SVM), an AdaBoost classifier, an artificial neural network (ANN), and a naïve Bayes classifier, to classify the ECG data as normal or abnormal. Amirshahi et al. [33] employed a spiking neural network for an ECG classification algorithm that is accurate but energy-efficient. Li et al. [34] developed a parallel general regression neural network for ECG data classification, which shortens the data processing time. Laitala et al. [35] proposed an R-peak detection method based on a long short-term memory (LSTM) network that utilized the temporal features of continuous ECG data. Zahid et al. [36] presented a robust R-peak detection algorithm for noisy ECG data using a one-dimensional (1D) convolutional neural network (CNN) model. However, although these works provided model optimization methods, they assumed the server-based powerful task computing which requires the heavy data transmission from sensors to the server. This means that the stable resources for the communications and computing should be supported in these works.
3 TinyML-based Classification in an ECG Monitoring Embedded System (TinyCES)
Fig. 1 shows an overview of TinyCES, including four components: datasets, preprocessing, model design, and model conversion. Based on the ECG datasets, preprocessing is performed, which removes the noise, finds the R-peaks, and finally extracts the segments that can be input sources to the classification model. The CNN-based model is then trained by the input sources and is optimized on the low-power and embedded MCU to classify the input sources into normal and abnormal data. Finally, the developed model can be converted to be fit into the MCU, and the dataset is used for the test.
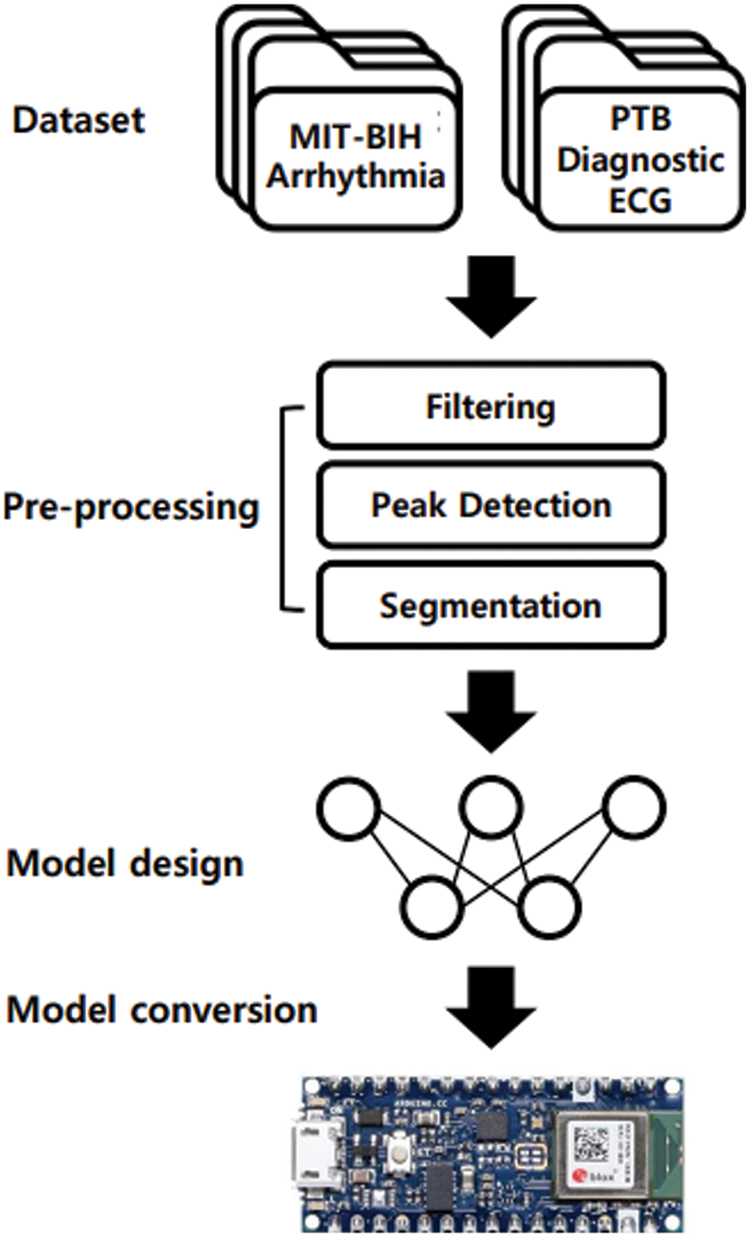
Figure 1: Overview of TinyCES
To implement our ECG classification model, this study uses two datasets: the MIT-BIH Arrhythmia [37] and PTB Diagnostic ECG databases [38]. Since the MIT-BIH Arrhythmia database has lots of available, representative, and well-characterized collections of ECGs [37], we utilize the dataset from the MIT-BIH database to develop and validate the preprocessing (i.e., filtering, peak detection, and segmentation). In addition, because the PTB diagnostic database provides the categorized ECG data (i.e., normal and abnormal) [38], the dataset from the PTB database is used to train and verify our classification model. Among 29,110 ECG segments from the PTB diagnostic ECG database dataset, we separate 72% into a training set, 8% into a validation set, and the remaining 20% into a test set. Note that the training and validation sets are used for the model design, and the test set is utilized for the test after the model conversion.
Fig. 2 shows an ECG segment including peaks of Q, R, S, and waves of P and T for normal ECG data, which can be a unit for handling ECG data. However, since practically measured ECG data are a sequence of ECG segments, it is important to determine the ECG segment in the continuous ECG data. Therefore, preprocessing is required to split the continuous ECG data into ECG segments. As mentioned in Section 3.1, ECG data from the MIT-BIH Arrhythmia dataset are used to configure the preprocessing pipeline. As a baseline for the ECG segment, we need to find the R peaks. Before detecting R peaks, a bandpass filter (BPF) is applied to the continuous ECG data to remove the noise. Figs. 3a and 3b present the raw ECG data as the input of the BPF and the filtered ECG data, which is the result of the BPF, respectively. After applying the BPF, R peaks can be found by using the Pan-Tompkins algorithm, as it is widely used to detect Q, R, and S peaks in each ECG segment [39]. Fig. 3c shows the results of R peak detection (i.e., the orange line). Based on the detection of the R peaks, the interval between the R peaks (i.e., RR interval) can be calculated. Consequently, segments can be configured by windowing the RR interval with the center of R peaks [40]. Finally, the Min Max scaler with a range from 0 to 1 is applied to the segments for normalization, as shown in Fig. 3d. Through this whole procedure for preprocessing, we can extract ECG segments from the continuous ECG data, which can be used as the training, validation, and test sets for our classification model.
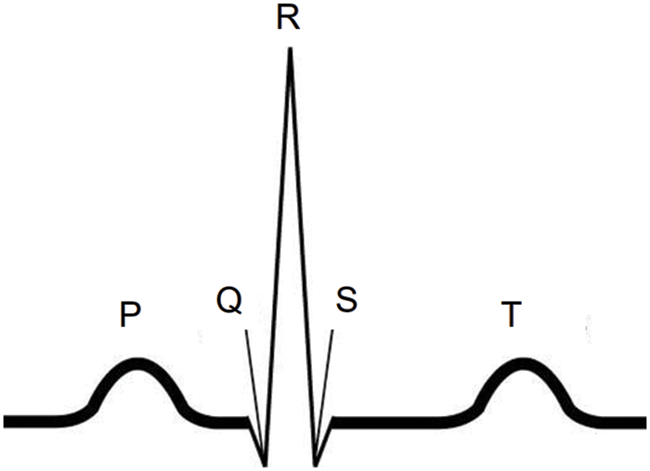
Figure 2: An ECG segment for normal ECG data
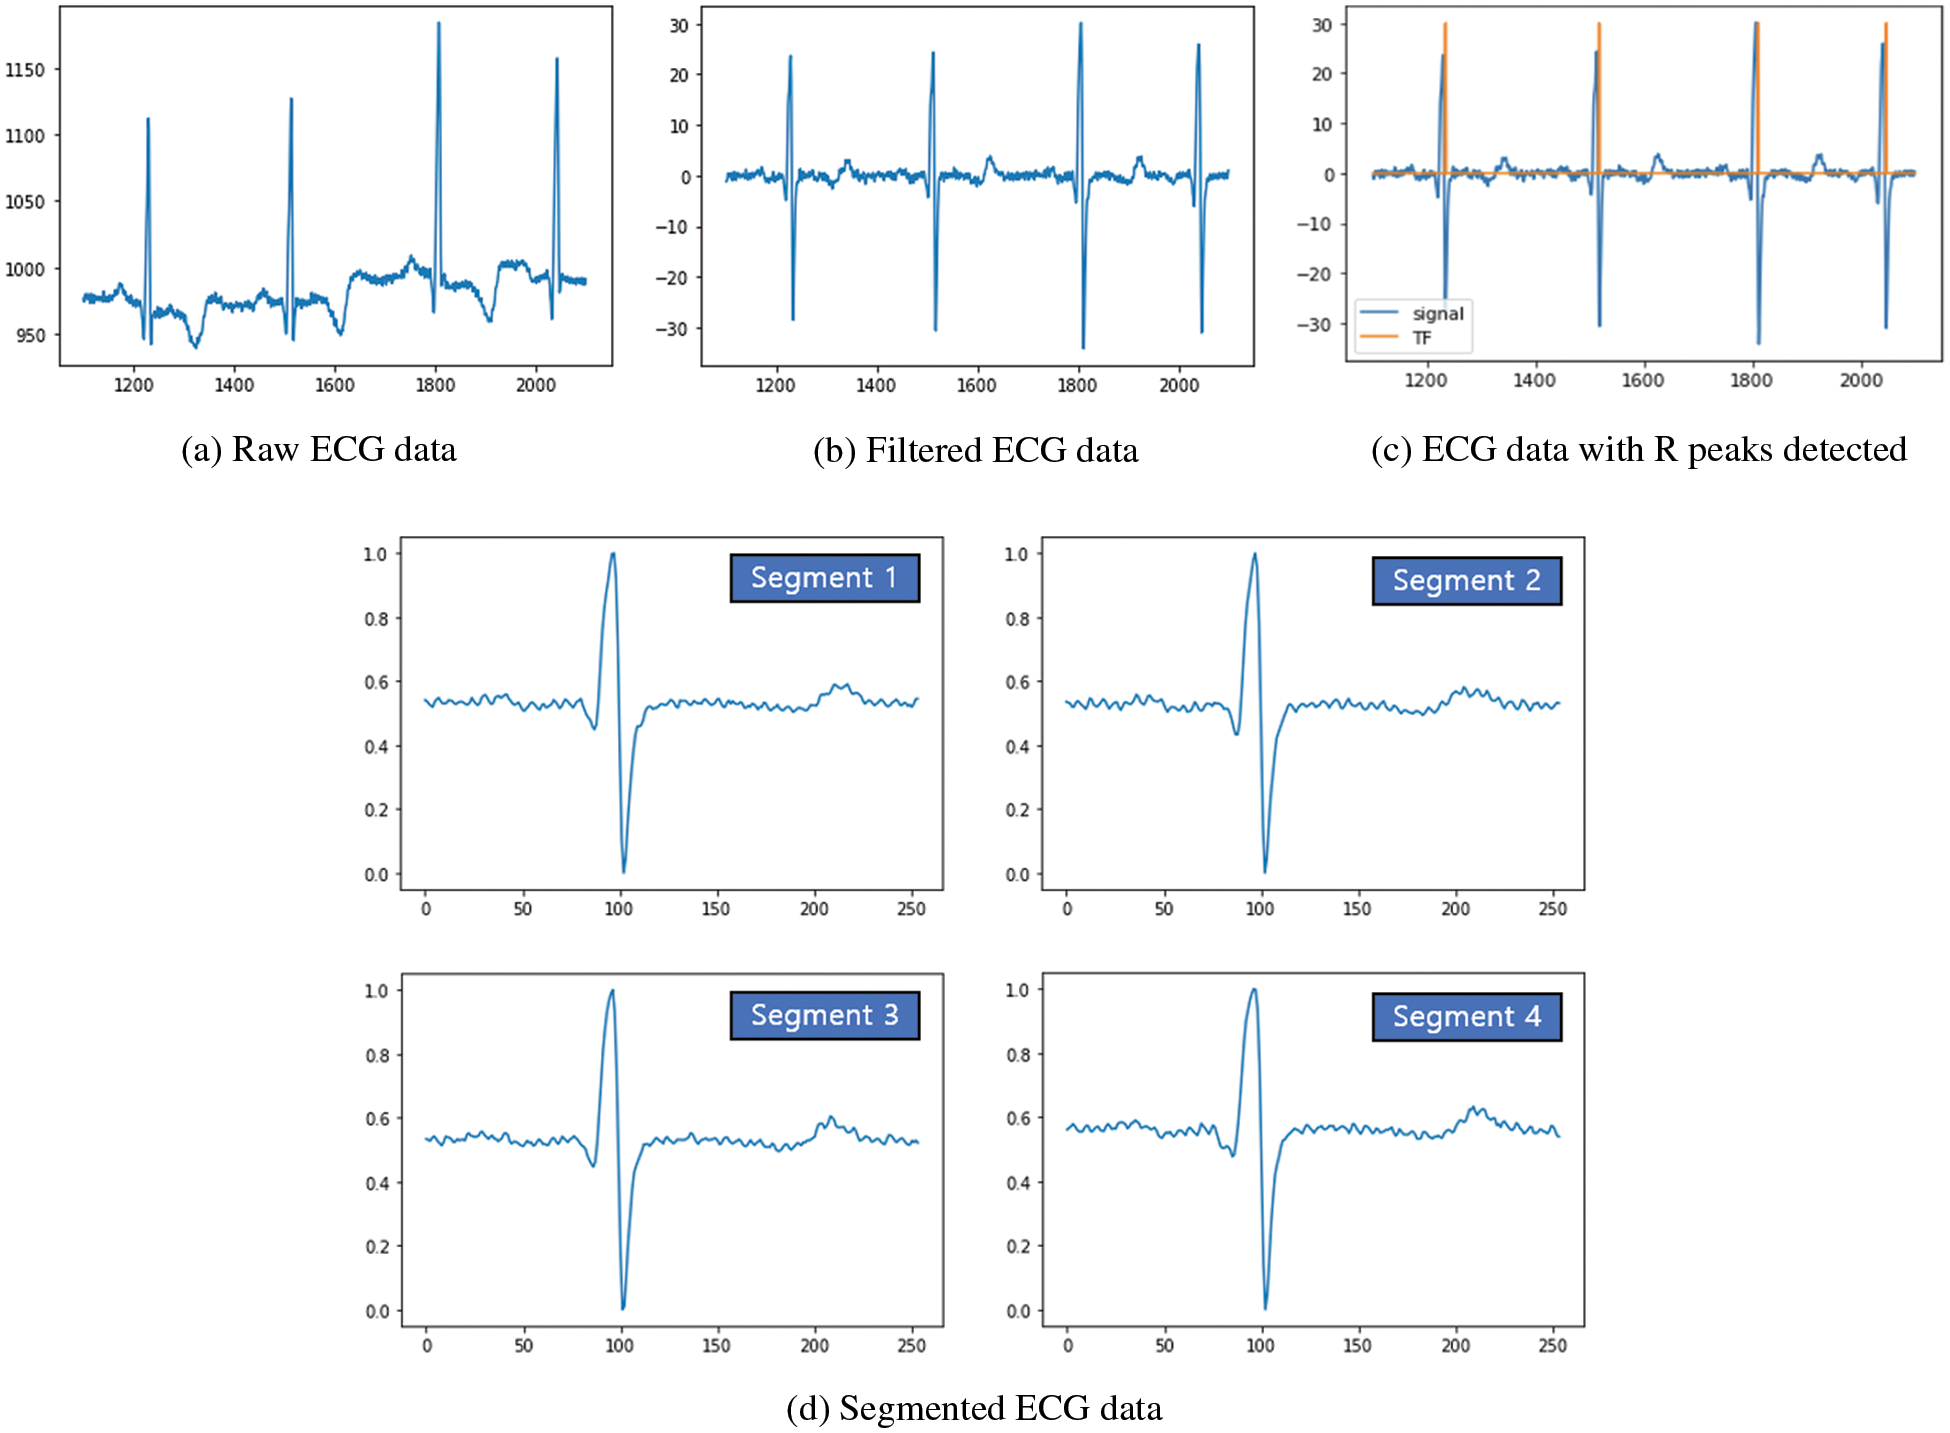
Figure 3: Preprocessing pipeline results of continuous ECG data
As the CNN model is widely used to analyze the layered data due to its feature extraction property [36,41], this paper also utilizes the CNN model to classify the normal and abnormal ECG segments. To build the CNN model, we utilize the Keras library (i.e., high-level application programmable interface (API) of TensorFlow) and PTB diagnostic ECG database dataset. Note that TinyCES aims to provide the classification in the MCU-based low-power ECG device by itself. This means that the model size should not be large because of the limited memory in the MCU. Fig. 4 shows the design of our CNN model. Since TensorFlow Lite for the Microcontroller only supports 2D layers, we need to transform the 1D vector data format of ECG segments to the 1xN 2D data format. The input source is the time series ECG segment data with a length of 180 because we set the maximum length of an ECG segment to 180 based on the heart rates of people. Consequently, each segment is padded with zeroes if the length of a segment is less than 180. The first layer of our model is a convolutional layer that has a rectified linear unit (ReLu) function as an activation function and 8 filters of size 4x1. Next to the convolutional layer, the max-pooling layer is used to subsample the outputs of the convolutional layer, and the drop-out layer is then applied to prevent overfitting. After that, the second convolutional layer, max-pooling layer, and drop-out layer, which are the same as the previous layers except that the second convolutional layer uses 16 filters of size 4x1, are utilized. Finally, the flatten layer and the two dense layers with the ReLu and sigmoid functions as activation functions are sequentially applied. The result value of the model ranges from 0 to 1. Particularly, if the result value is 0, it means that the ECG segment is absolutely an abnormal segment. However, if the result value is 1, it indicates that the ECG segment is exactly normal. To optimize the classification model, the binary cross-entropy loss function and Adam optimization algorithm with a learning rate of 0.001 are applied. In addition, we utilize the learning rate reducing algorithm known as ReduceLRonPlateau and early stopping to prevent the model from overfitting on the training data.
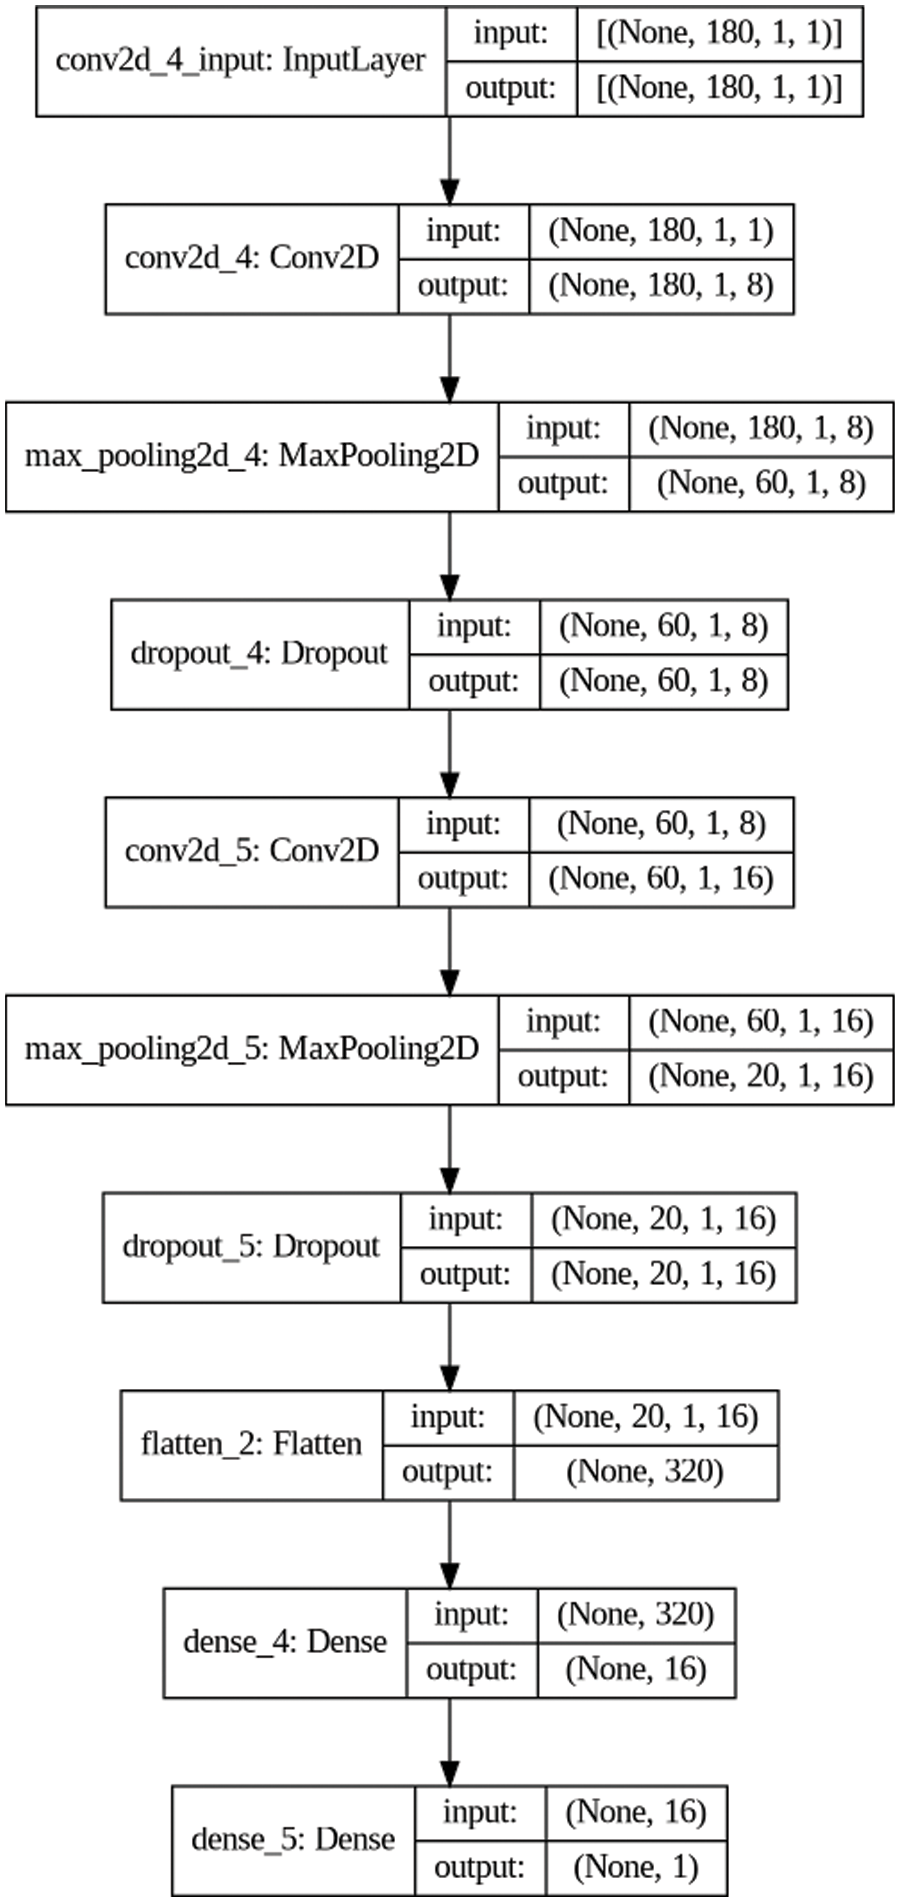
Figure 4: Design of our CNN model
Fig. 5 shows the accuracy and the loss curves over the training and validation data for the classification model. In Fig. 5, it can be observed that the accuracy increases and the loss decreases with the increase in epochs. Because there is no substantial improvement in accuracy and loss after epoch 25, 30 epochs are performed with early stopping. The accuracy and the loss of the training and validation data become approximately over 97% and under 10%, respectively, which means that the model is generalized well for both data.
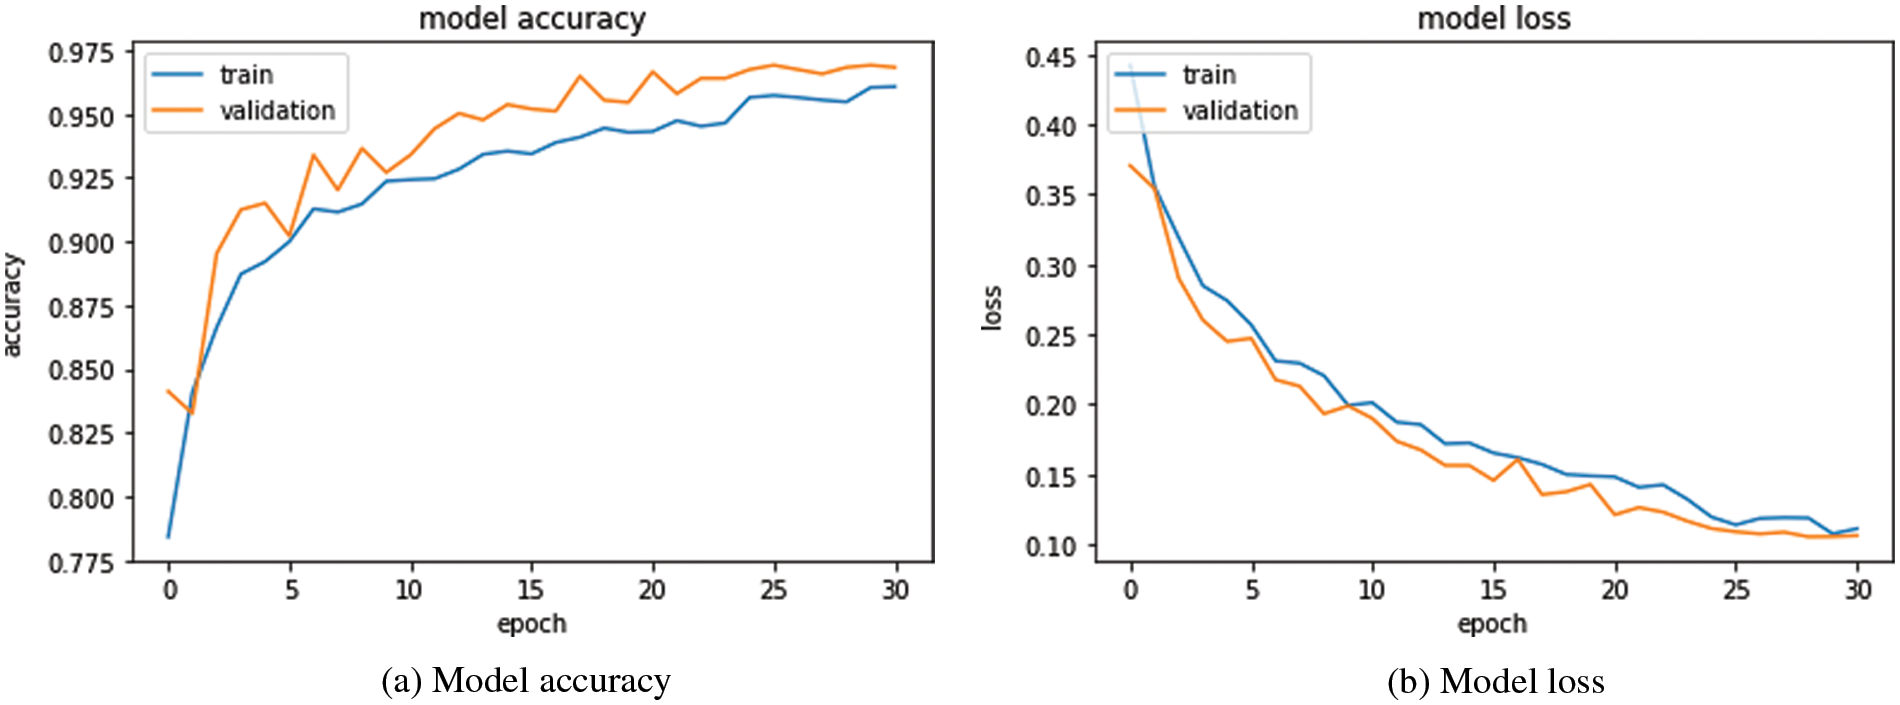
Figure 5: Accuracy and loss curves over training and validation data for the classification model
To show the feasibility of the developed classification model for the MCU-based low-power ECG device, we choose an Arduino Nano 33 Bluetooth Low Energy (BLE) Sense (ANBS) board [42] as a prototype for TinyCES. The reason for choosing this board is that the board includes the 32-bit Arm Cortex-M4 MCU, which can support the TensorFlow Lite for Microcontrollers [12,43]. In addition, the ANBS board is scalable as a prototype in terms of price (approximately $20), size (45 × 18 mm), connectivity (support of BLE), and capability (interworking with the ECG monitor [44]) [42]. Since the developed model is based on Keras (i.e., TensorFlow), the model needs to be converted into a TensorFlow Lite model which is specifically designed for the MCU-based model (e.g., reducing the file format and execution rates, etc.). Therefore, we use TensorFlow Lite converter which is widely used for the model conversion [45]. As a result of the conversion, the model expressed as a byte array in C++ language, which can be applied to ANBS, is created. The size of the converted model is 27,246 bytes, which can be small enough to be applicable to the MCU with limited random-access memory (RAM) capacity (e.g., RAM size of Arm Cortex-M4 MCU in ANBS is 256 KB [42]).
Based on the converted model, Fig. 6 describes the confusion matrix using 2,911 test data from the PTB diagnostic ECG database dataset. From the confusion matrix, there are four categories: true positive (TP), true negative (TN), false negative (FN), and false-positive (FP). TP (TN) means that the result from the model is normal (abnormal) and actual data are also normal (abnormal). However, FN (FP) means that the result from the model is abnormal (normal), while the actual data are normal (abnormal). According to TP and TN, the developed classification model has approximately 97% accuracy, which can be calculated by (TP + TN)/(TP + TN + FN + FP). In addition, the true negative recognition rate is about 98%, which can be obtained by (TN)/(TN + FN). Moreover, the true positive recognition rate is about 95%, which can be obtained by (TP)/(TP + FP). This means that the developed model is efficient to detect abnormal data, which can be more important than to detect normal data because of the alert situation and further treatment.
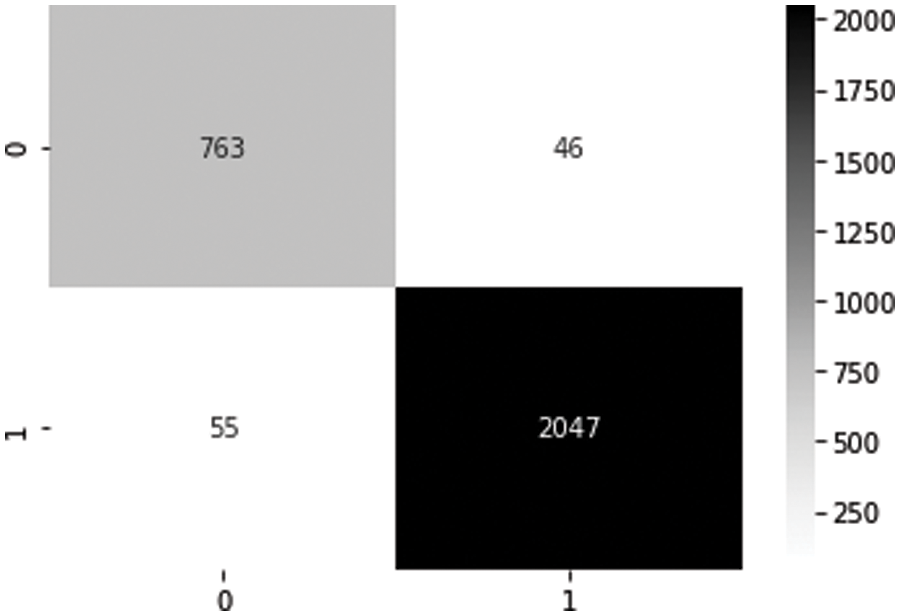
Figure 6: Confusion matrix
Based on the ANBS with the developed model, we configure the prototype of TinyCES as shown in Fig. 7. The prototype includes ECG lead lines with electrodes connected to an ECG monitor, which is a single-lead ECG monitor developed by Sparkfun [44]. The ECG monitor is connected to the ANBS, which includes memory to store ECG data and the BLE module to transmit the data to the gateway or server. In Fig. 7, the operation example includes four phases: 1) measurement; 2) classification; 3) transmission; and 4) record. For the measurement, three electrodes are attached to the right arm (RA), left arm (LA), and left leg (LL) positions on the body. During the measurement, real-time classification of incoming continuous ECG data into normal and abnormal ECG data is performed based on the model in Section 3.4. According to the classification, abnormal ECG data can be transmitted to a gateway in real time [10,46,47] (which need a gateway (e.g., a smartphone in [10,46] or a smart-hub in [47]) or server that can analyze the ECG data and receive the result of the analysis in real time) or recorded in the internal memory of the ANBS, as in a conventional Holter [3,4]. Note that transmission and recording can be conducted simultaneously or selectively depending on the system policy.
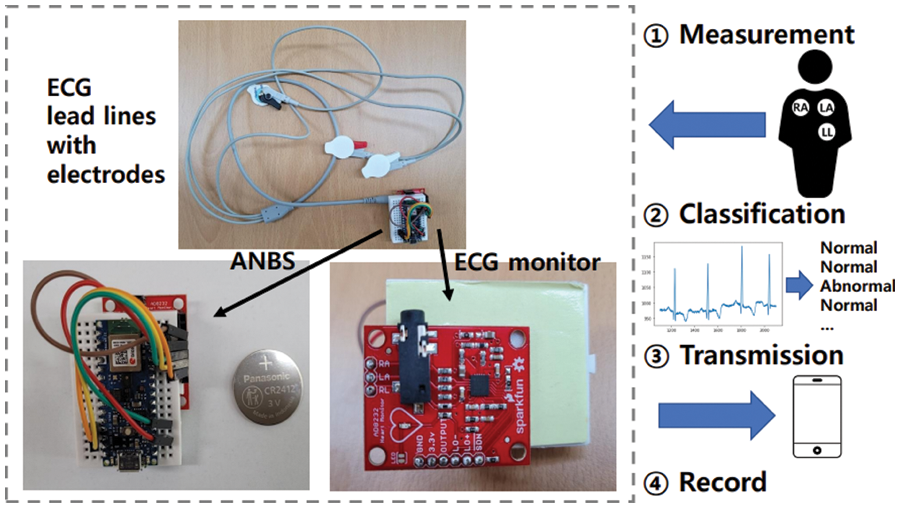
Figure 7: TinyCES prototype and operation example
To compare TinyCES with real-time feedback schemes (RTFs) [10,46,47] and a conventional Holter [3,4], several experiments are conducted with three volunteers who have no obvious heart disease and one medical technologist to verify the results. In addition, consent from the volunteers was obtained to use in the experimental results. TinyCES transmits the classified abnormal data to a smartphone through BLE and records the data into the internal memory. For a fair comparison, RTFs also use BLE to send the measured data to a smartphone. In each experiment, ECGs were measured from the volunteer for 24 h. Five experiments per volunteer were conducted, and the average value was utilized for the result.
Table 2 shows the average amount of network bandwidth usage of volunteers for TinyCES and RTFs. According to Table 2, it can be seen that the average amount of network bandwidth usage of TinyCES is reduced by approximately 96.71% compared to that of RTFs because the classification is performed in advance before the transmission. This means that TinyCES can enhance the overall network system performance from the perspective of wireless resource management. In addition, Table 3 represents the average size of recorded ECG data (i.e., internal memory usage) for TinyCES and Holter. From Table 3, it can be noted that TinyCES can reduce memory usage by approximately 96.23% compared to Holter. To provide a more compact and lightweight ECG monitoring device for patients, the physical size becomes necessarily limited. Therefore, the memory-efficient system design should be considered.


Based on the accuracy of the developed model and prototype evaluation, it can be noted that TinyCES works well even with the light portable device (i.e., ANBS) in terms of the classification (i.e., 97% accuracy) while maintaining low usage of network bandwidth and recording storage. In addition, as introduced above, the procedure of the conventional works includes the access to the network, data delivery from sensors to the server (or intermediate node), data processing, and result reception, which can be a time-consuming procedure according to the network and server status. Compared to that, the procedure of TinyCES only requires the classification by the monitoring device itself, which means that TinyCES has a benefit in terms of the time efficiency.
This paper proposes a TinyML-based classification (i.e., TinyCES) where the ECG monitoring device performs the classification by itself based on the machine-learning model, which can reduce the memory and network resource usages for classification. To demonstrate the feasibility, after we configure the model using ECG data from the MIT-BIH arrhythmia and the PTB diagnostic ECG databases, TinyCES is validated using the TinyML-supported Arduino prototype. The performance results show that the algorithm of TinyCES can have an approximately 97% detection ratio with small model size (i.e., 27 Kbytes), meaning that it has great potential to be a lightweight and resource-efficient ECG monitoring system. For future work, the accuracy depending on the specific type of abnormal ECG segment (e.g., sinus tachycardia, sinus bradycardia, sinus pause, atrial fibrillation, etc.) will be validated to extend the testing part. In addition, we will conduct the experiment with heart disease patients in the hospital to validate the feasibility of the developed model.
Acknowledgement: This research was supported by National Research Foundation (NRF) of Korea Grant funded by the Korean Government (MSIP) (No. 2022R1F1A1063183).
Funding Statement: This research was supported by National Research Foundation (NRF) of Korea Grant funded by the Korean Government (MSIP) (No. 2022R1F1A1063183).
Conflicts of Interest: The authors declare that they have no conflicts of interest to report regarding the present study.
References
1. S. Tiwari, A. Jain, A. K. Sharma and K. M. Almustafa, “Phonocardiogram signal based multi-class cardiac diagnostic decision support system,” IEEE Access, vol. 9, pp. 110710–110722, 2021. [Google Scholar]
2. F. Tueche, Y. Mohamadou, A. Djeukam, L. C. N. Kouekeu, R. Seujip et al., “Embedded algorithm for QRS detection based on signal shape,” IEEE Transactions on Instrumentation and Measurement, vol. 70, pp. 1–12, 2021. [Google Scholar]
3. S. Secinaro, D. Calandra, A. Secinaro, V. Muthurangu and P. Biancone, “The role of artificial intelligence in healthcare: A structured literature review,” BMC Medical Informatics and Decision Making, vol. 21, no. 125, pp. 1–23, 2021. [Google Scholar]
4. L. Shyu, Y. Wu and W. Hu, “Using wavelet transform and fuzzy neural network for VPC detection from the holter ECG,” IEEE Transactions on Biomedical Engineering, vol. 51, no. 7, pp. 1269–1273, 2004. [Google Scholar]
5. V. V. Kolisetty and D. S. Rajput, “Integration and classification approach based on probabilistic semantic association for big data,” Complex & Intelligent Systems, vol. 5, pp. 1–14, 2021. [Google Scholar]
6. R. Kaluri, D. S. Rajput, Q. Xin, K. Lakshmanna, S. Bhattacharya et al., “Roughsets-based approach for predicting battery life in IoT,” Intelligent Automation & Soft Computing, vol. 27, no. 2, pp. 453–469, 2021. [Google Scholar]
7. V. V. Kolisetty and D. S. Rajput, “A review on the significance of machine leaning for data analysis in big data,” Jordanian Journal of Computers and Information Technology, vol. 6, no. 1, pp. 41–57, 2020. [Google Scholar]
8. S. M. Basha and D. S. Rajput, “Survey on evaluating the performance of machine learning algorithms: Past contributions and future roadmap,” in Deep Learning and Parallel Computing Environment for Bioengineering Systems, Publisher Elsevier, MA, USA: Academic Press, pp. 174–185, 2019. [Google Scholar]
9. C. Liu, X. Zhang, L. Zhao, F. Liu, X. Chen et al., “Signal quality assessment and lightweight QRS detection for wearable ECG SmartVest system,’’ IEEE Internet of Things Journal, vol. 6, no. 2, pp. 1363–1374, 2018. [Google Scholar]
10. U. Satija, B. Ramkumar and S. Manikandan, “Real-time signal quality-aware ECG telemetry system for IoT-based health care monitoring,” IEEE Internet of Things Journal, vol. 4, no. 3, pp. 815–823, 2017. [Google Scholar]
11. H. Ozkan, O. Ozhan, Y. Karadana, M. Gulcu, S. Macit et al., “A portable wearable tele-ECG monitoring system,” IEEE Transactions on Instrumentation and Measurement, vol. 69, no. 1, pp. 173–182, 2019. [Google Scholar]
12. Z. Yang, Q. Zhou, L. Lei, K. Zheng and W. Xiang, “An IoT-cloud based wearable ECG monitoring system for smart healthcare,” Journal of Medical Systems, vol. 40, no. 286, pp. 1–11, 2016. [Google Scholar]
13. J. Wan, M. A. A. H. Al-awlaqi, M. Li, M. O’Grady, X. Gu et al., “Wearable IoT enabled real-time health monitoring system,” EURASIP Journal on Wireless Communications and Networking, vol. 298, pp. 1–10, 2018. [Google Scholar]
14. R. K. Pathinarupothi, P. Durga and E. S. Rangan, “IoT-based smart edge for global health: Remote monitoring with severity detection and alerts transmission,” IEEE Internet of Things Journal, vol. 6, no. 2, pp. 2449–2462, 2019. [Google Scholar]
15. B. Yin and J. Lu, “A Cost-efficient framework for crowdsourced data collection in vehicular networks,” IEEE Internet of Things Journal, vol. 8, no. 17, pp. 13567–13581, 2021. [Google Scholar]
16. S. M. He, K. Xie, K. X. Xie, C. Xu and J. Wang, “Interference-aware multisource transmission in multiradio and multichannel wireless network,” IEEE Systems Journal, vol. 13, no. 3, pp. 2507–2518, 2019. [Google Scholar]
17. Y. S. Luo, K. Yang, Q. Tang, J. Zhang and B. Xiong, “A Multi-criteria network-aware service composition algorithm in wireless environments,” Computer Communications, vol. 35, no. 15, pp. 1882–1892, 2012. [Google Scholar]
18. Z. F. Liao, J. B. Liang and C. C. Feng, “Mobile relay deployment in multihop relay networks,” Computer Communications, vol. 112, no. 1, pp. 14–21, 2017. [Google Scholar]
19. B. Yin and X. T. Wei, “Communication-efficient data aggregation tree construction for complex queries in IoT applications,” IEEE Internet of Things Journal, vol. 6, no. 2, pp. 3352–3363, 2018. [Google Scholar]
20. D. Cao, B. Zheng, B. Ji, Z. Lei and C. Feng, “A robust distance-based relay selection for message dissemination in vehicular network,” Wireless Networks, vol. 26, no. 3, pp. 1755–1771, 2020. [Google Scholar]
21. Z. Xu, W. Liang, K. C. Li, J. Xu and H. Jin, “A blockchain-based roadside unit-assisted authentication and key agreement protocol for internet of vehicles,” Journal of Parallel and Distributed Computing, vol. 149, pp. 29–39, 2021. [Google Scholar]
22. S. Soro, “TinyML for ubiquitous edge AI,” arXiv:2102.01255, 2020. [Google Scholar]
23. P. Warden and D. Situnayake, “Tinyml: Machine learning with tensorflow lite on Arduino and ultra-low-power microcontrollers,” in Newton, MA, USA: O’Reilly Media, pp. 27–85, 2019. [Google Scholar]
24. R. S. Iborra and A. F. Skarmeta, “TinyML-Enabled frugal smart objects: Challenges and opportunities,” IEEE Circuits and Systems Magazine, vol. 20, no. 3, pp. 4–18, 2020. [Google Scholar]
25. H. Doyu, “TinyML as a service and the challenges of machine learning at the edge,” Ericsson Tech. Rep., 2019. [Online]. Available: https:// www.ericsson.com/en/blog/2019/12/tinyml-as-a-service. [Google Scholar]
26. W. Raza, A. Osman, F. Ferrini and F. D. Natale, “Energy-efficient inference on the edge exploiting TinyML capabilities for UAVs,” MDPI Drones, vol. 5, no. 4, pp. 127, 2021. [Google Scholar]
27. D. Piatkowaski and K. Walkowiak, “TinyML-Based concept system used to analyze whether the face mask is worn properly in battery-operated conditions,” MDPI Applied Sciences, vol. 12, no. 1, pp. 484, 2022. [Google Scholar]
28. A. D. I. A. Kadir, A. A-Haiqi and N. M. Din, “A dataset and TinyML model for coarse age classification based on voice commands,” in Proc. IEEE Malaysia Int. Conf. on Communication (MICC), Virtual, Malaysia, pp. 75–80, 2021. [Google Scholar]
29. S. O. Ooko, D. Mukanyiligira, J. P. Munyampundu and J. Nsenga, “Edge AI-based respiratory disease recognition from exhaled breath signatures,” in Proc. IEEE Jordan Int. Joint Conf. on Electrical Engineering and Information Technology, Dead Sea, Jordan, pp. 89–94, 2021. [Google Scholar]
30. M. Prado, M. Rusci, A. Capotondi, R. Donze, L. Benini et al., “Robustifying the deployment of TinyML models for autonomous mini-vehicles,” MDPI Sensors, vol. 21, no. 4, pp. 1339, 2021. [Google Scholar]
31. V. Tsoukas, E. Boumpa, G. Giannakas and A. Kakarountas, “A review of machine learning and TinyML in healthcare,” in Proc. Pan-Hellenic Conf. on Informatics, Volos, Greece, pp. 69–73, 2021. [Google Scholar]
32. S. Celin and K. Vasanth, “ECG signal classification using various machine learning techniques,” Journal of Medical Systems, vol. 42, no. 241, pp. 1–11, 2018. [Google Scholar]
33. A. Amirshahi and M. Hashemi, “ECG classification algorithm based on STDP and R-STDP neural networks for real-time monitoring on ultra low-power personal wearable devices,” IEEE Transactions on Biomedical Circuits and Systems, vol. 13, no. 6, pp. 1483–1493, 2019. [Google Scholar]
34. P. Li, Y. Wang, J. He, L. Wang, Y. Tian et al., “High-performance personalized heartbeat classification model for long-term ECG signal,” IEEE Transactions on Biomedical Engineering, vol. 64, no. 1, pp. 78–86, 2017. [Google Scholar]
35. J. Laitala, M. Jiang, E. Syrjala, E. K. Naeini, A. Airola et al., “Robust ECG R-peak detection using LSTM,” in Proc. 35th Annual ACM Symp. on Applied Computing (SAC), Brno, Czech Republic, pp. 1104–1111, 2020. [Google Scholar]
36. M. U. Zahid, S. Kiranyaz, T. Ince, O. C. Devecioglu, M. E. H. Chowdhury et al., “Robust R-peak detection in low-quality holter ECGs using 1D convolutional neural network,” IEEE Transactions on Biomedical Engineering, vol. 69, no. 1, pp. 119–128, 2021. [Google Scholar]
37. G. B. Moody and R. G. Mark, “The impact of the MIT-BIH arrhythmia database,” IEEE Engineering in Medicine and Biology Magazine, vol. 20, no. 3, pp. 45–50, 2001. [Google Scholar]
38. N. Flores, R. L. Avitia, M. A. Reyna and C. Garcia, “Readily available ECG databases,” Journal of Electrocardiology, vol. 51, no. 6, pp. 1095–1097, 2018. [Google Scholar]
39. F. M. Dias, H. L. Monteiro, T. W. Cabral, R. Naji, M. Kuehni et al., “Arrythmia classification from single-lead ECG signals using the inter-patient paradigm,” Computer Methods and Programs in Biomedicine, vol. 202, pp. 1–10, 2021. [Google Scholar]
40. D. Makowski, T. Pham, Z. J. Lau, J. C. Brammer, F. Lespinasse et al., “Neurokit2: A python toolbox for neurophysiological signal processing,” Behavior Research Methods, vol. 53, pp. 1689–1696, Feb. 2021. [Google Scholar]
41. O. Cheikhrouhou, R. Mahmud, R. Zouari, M. Ibrahim, A. Zaguia et al., “One-dimensional CNN approach for ECG arrythmia analysis in fog-cloud environment,” IEEE Access, vol. 9, pp. 103513–103523, July 2021. [Google Scholar]
42. H. A-Mimi, A. A-Dahoud, M. Fezari and M. S. Daoud, “A study on new Arduino nano board for WSN and IoT applications,” International Journal of Advanced Science and Technology, vol. 29, no. 4, pp. 10223–10230, 2020. [Google Scholar]
43. E. Manor and S. Greenberg, “Custom hardware inference accelerator for TensorFlow lite for microcontrollers,” IEEE Access, vol. 10, pp. 73484–73493, 2022. [Google Scholar]
44. K. Ishii and N. Hiraoka, “Nail tip sensor: Toward reliable daylong monitoring of heart rate,” IEEJ Transactions on Electrical and Electronic Engineering, vol. 15, pp. 902–908, 2020. [Google Scholar]
45. M. Reda, R. Suwwan, S. Alkafri, Y. Rashed and T. Shanableh, “AgroAId: A mobile app system for visual classification of plant species and diseases using deep learning and TensorFlow lite,” Informatics, vol. 9, no. 3, pp. 1–42, 2022. [Google Scholar]
46. A. C-Atoche, K. C-Herrera, R. A-Ensenat, J. J. E-Lopez, J. V-Castillo et al., “Energy efficient framework for a AIoT cardiac arrhythmia detection system wearable during sport,” Applied Sciences, vol. 12, no. 5, pp. 1–14, 2022. [Google Scholar]
47. M. Donati, S. Panicacci, A. Ruiu, S. Dalmiani, P. Festa et al., “Exploiting biomedical sensors for a home monitoring system for paediatric patients with congenital heart disease,” Technologies, vol. 9, no. 3, pp. 1–20, 2021. [Google Scholar]
Cite This Article
 Copyright © 2023 The Author(s). Published by Tech Science Press.
This work is licensed under a Creative Commons Attribution 4.0 International License , which permits unrestricted use, distribution, and reproduction in any medium, provided the original work is properly cited.
 Downloads
 Citation Tools