
 Submit a Paper
 Propose a Special lssue
 Open Access
ARTICLE

Nondestructive Testing of Bridge Stay Cable Surface Defects Based on Computer Vision
1 Jiangsu Engineering Lab for IOT Intelligent Robots (IOTRobot), College of Automation, Nanjing University of Posts and Telecommunications, Nanjing, 210023, China
2 School of Mechanical Engineering, Southeast University Nanjing, 210096, China
3 Rubic Robotics Company, Alberta, Canada
* Corresponding Author: Xingsong Wang. Email:
Computers, Materials & Continua 2023, 75(1), 2209-2226. https://doi.org/10.32604/cmc.2023.027102
Received 10 January 2022; Accepted 04 March 2022; Issue published 06 February 2023
 View Full Text
 Download PDF
Abstract
The automatically defect detection method using vision inspection is a promising direction. In this paper, an efficient defect detection method for detecting surface damage to cables on a cable-stayed bridge automatically is developed. A mechanism design method for the protective layer of cables of a bridge based on vision inspection and diameter measurement is proposed by combining computer vision and diameter measurement techniques. A detection system for the surface damages of cables is de-signed. Images of cable surfaces are then enhanced and subjected to threshold segmentation by utilizing the improved local grey contrast enhancement method and the improved maximum correlation method. Afterwards, the data obtained through diameter measurement are mined by employing the moving average method. Image enhancement, threshold segmentation, and diameter measurement methods are separately validated experimentally. The experimental test results show that the system delivers recall ratios for type-I and II surface defects of cables reaching 80.4% and 85.2% respectively, which accurately detects bulges on cable surfaces.Keywords
The safe operation of a cable-stayed bridge influences the social stability and travel safety of people. As one of main stressed components of a cable-stayed bridge, cables are exposed to air for a long term, whose surface PE (polyethylene) protective layer is damaged to different extents. As a result, the internal steel wires are corroded, thus influencing the structural strength. Therefore, exploring the detection method for surface defects on cables is of great significance to guaranteeing the safety of a bridge.
At present, the detection methods for surface defects on cables mainly involve artificial detection, laser scanning, and computer-vision-based inspection. Computer-vision-based inspection offers the advantages of safety, low cost, and high efficiency and is widely applied in including rail surface defect detection [1], non-destructive testing of wire ropes [2,3], surface defect detection on metals [4], aero plane surface defect detection [5], corrosion detection in pipelines [6], and fabric surface defect detection [7].
The combination of vision inspection method and image mosaicking is extensively used [8–13]. Researchers identify surface damage by applying various methods (such as image mosaicking, statistical inference, and convolutional neural networks) after collecting surface images of bridges. Pham et al. [14,15] performed vision inspection on the 3-D structure of a steel bridge by designing a climbing robot and stitched captured pictures into a whole image by using image mosaicking. Guldur et al. [16] improved the vision inspection strategy by combining images with laser scanning. Potenza et al. [17] quantified defects in bridges by using color-based image processing method. Oh et al. [18] designed a robot for automatically detecting cracks and a machine vision system to detect cracks in a bridge. Xu et al. [19] designed a cable climbing repair robot system based on independent quadrilateral suspension, designed a supporting automatic repair mechanism, and realized a variety of functions including visual detection. Lee et al. [20] propose a machine vision system for automatic inspection of bridges. Adhikari et al. [21] proposed an innovative computer vision method to examine defects in a bridge by applying digital image analysis.
In terms of the vision inspection method for surface defects of cables of a bridge, Akutsu et al. [22,23] designed a semiautomatic robot to detect, measure, and annotate the defects of a bridge by combining data with different types of software such as computer aided design (CAD) routines. Li et al. [24,25] developed a vision-based distributed detection system to detect surface damage to cables and proposed the use of the effective scale-invariant feature transform (SIFT) algorithm to realize the mosaicking of multiple images with partially overlapped areas in different defect images. Ho et al. [26] explored an image-based damage detection system, which can automatically identify surface damage to cables through image processing technology and improve the image quality by using the image enhancement method and a noise elimination technique. The robot designed by Cho et al. [27] for detecting cables carries three cameras to photograph the surface of the cables. Yin et al. [28] study the camera positioning in visual detection, and designs a set of visual detection and image processing system to improve the flexibility and efficiency of camera positioning. Zhang et al. [29] also made some research on the security of data processing and the robustness of the system, which improved the stability of the system.
On the basis of analyzing the vision inspection processing method, a method for mechanism design based on diameter measurement was proposed in the study to detect the defects in cables. The rest of the study is organized as follows: Section 2 introduces the overall scheme of the defect detection system based on vision inspection and diameter measurement; Section 3 further analyses the principles and methods of vision inspection and diameter measurement; Section 4 outlines the experimental test and verification; Section 5 draws conclusions.
2 Overall Scheme for Detecting Surface Defects on Cables
In the research of cable climbing robot, our team has conducted more in-depth research [30]. The proposed defect detection system based on vision inspection and diameter measurement is composed of a cable-climbing robot, vision equipment, and a computer. The climbing robot carries four cameras and a diameter measurement instrument to detect cables (Fig. 1), which features the following functions: (1) performing all-round defection on the PE protective layer of cables; (2) automatically processing inspection data and screening information about defects; (3) providing an accurate location for each defect. The diameter measuring instrument model is ZM100, the measuring range reaches 500 mm, and the precision is
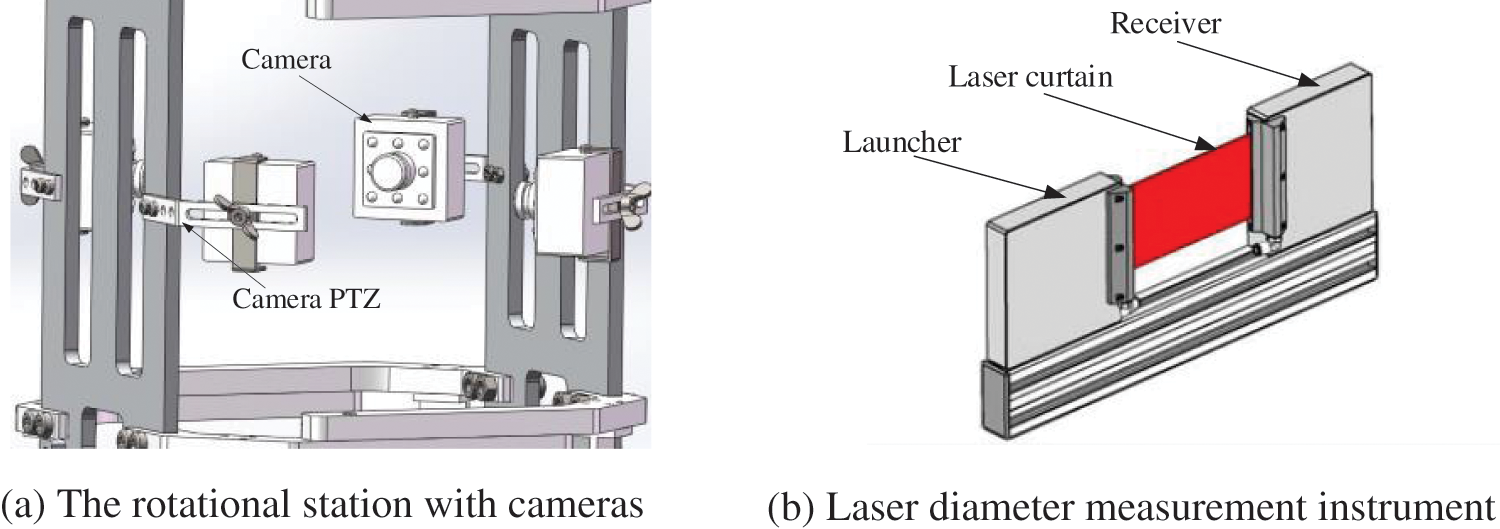
Figure 1: The detection mechanism for cable surfaces
The proposed climbing robot (Fig. 2a) works according to the scheme of wheeled climbing at two sides. The robot consists of two vehicles symmetrical to a cable and connectors. The climbing device driven by a motor is set in the active vehicle to provide climbing power to the robot. Independent parallel-link hitches are used for the four climbing wheels of the robot (Fig. 2b) to guarantee that the four V-shaped wheels are simultaneously pressed onto the surface of the cable, providing the clamping force of the mechanism for cables. In view of the universality of the climbing robot for cables with different diameters, a group of connected grooves (Fig. 2c) are set on the upper and lower connectors on the one side of the robot able to slide, which allows further regulation of the clamping radius of the robot by means of positioning bolts.
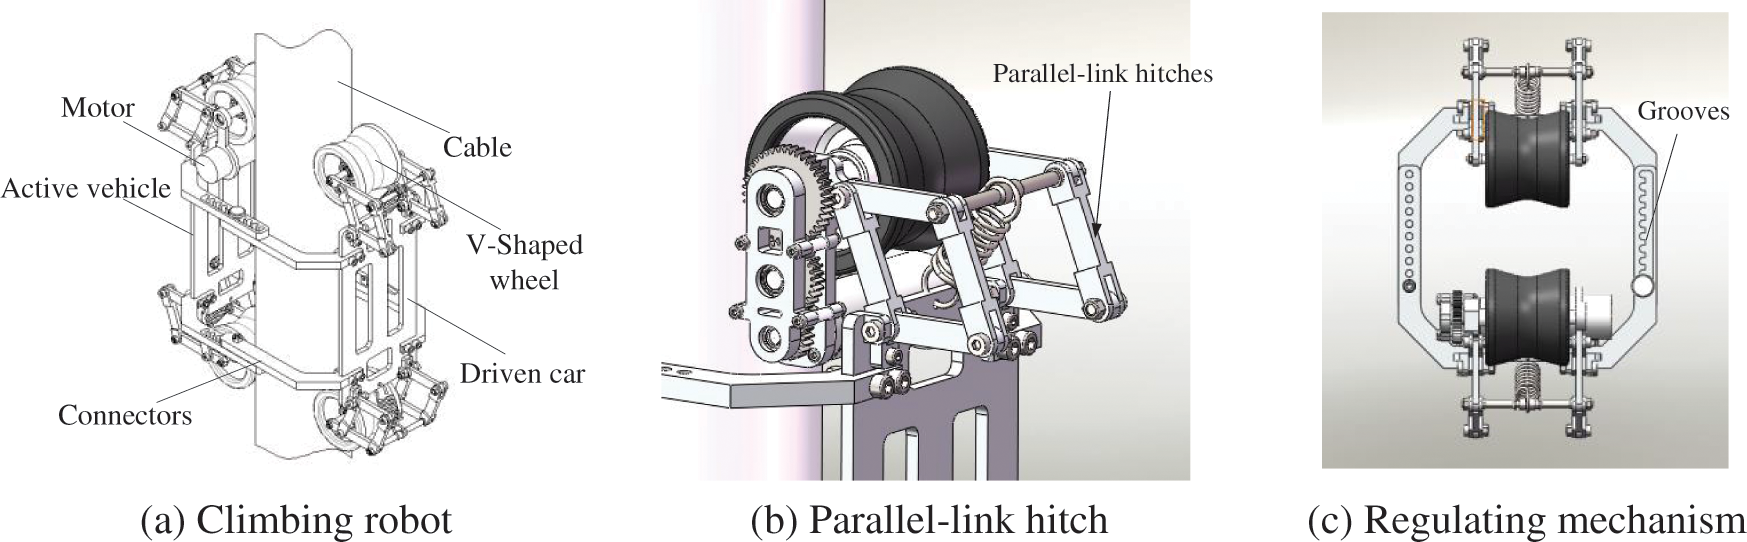
Figure 2: The whole structure of the robot for detecting cables
2.1 Vision Inspection Module for Cables
The four cameras carried by the climbing robot are used to acquire surface images of cables; the images taken from the four cameras are merged and stored on a secure digital (SD) memory card. Moreover, the information is transferred (in real-time) to the ground-based workstation through the wireless switching system for processing. The block diagram of the vision inspection system is shown in Fig. 3.
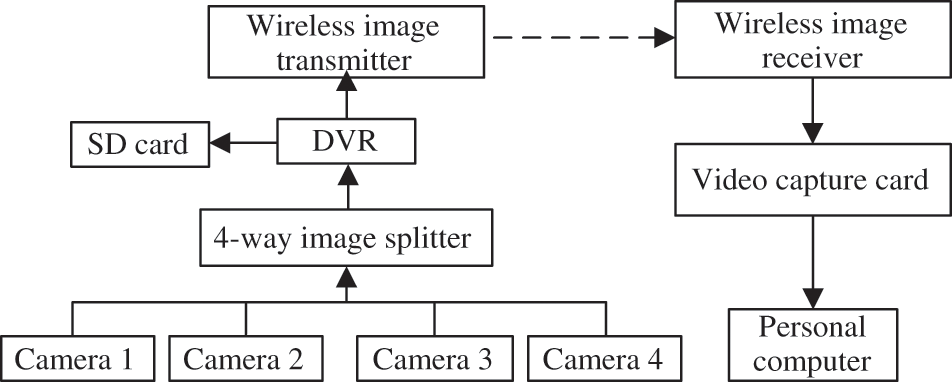
Figure 3: Block diagram of the vision inspection system for detecting cable surface defects
2.2 Diameter Measurement Module for Cables
The vision inspection system can detect cracking, pits, corrosion, etc. on the protective casings around each cable while it is difficult to perform quantitative analysis thereof. Considering this, a diameter measurement system for cables is designed, which mainly comprises a rotational platform and a diameter measurement instrument. The rotational platform mechanism is composed of a connecting sheet metal and a driving device (Fig. 4a), in which the connecting sheet metal aims to connect the climbing robot with the platform mechanism for diameter measurement. The rotational driving device consists of a large torque motor, a spur gear, and a crescent gear. The diameter measurement instrument is fixed on the crescent gear. To ensure accuracy of the diameter measurement instrument, it is necessary to use a group of V-shaped universal spheres as the benchmark of the diameter in one side of cables. The spring and three linear bearings are used to ensure that the group of V-shaped universal spheres can press against the cable (Fig. 4b) and at the same time the laser diameter measurement instrument is fixed by regulating the fixture. Under the driving effect of the motor, the crescent gear drives the diameter measurement instrument to move around the cables along the semi-circular guide to perform defect detection.
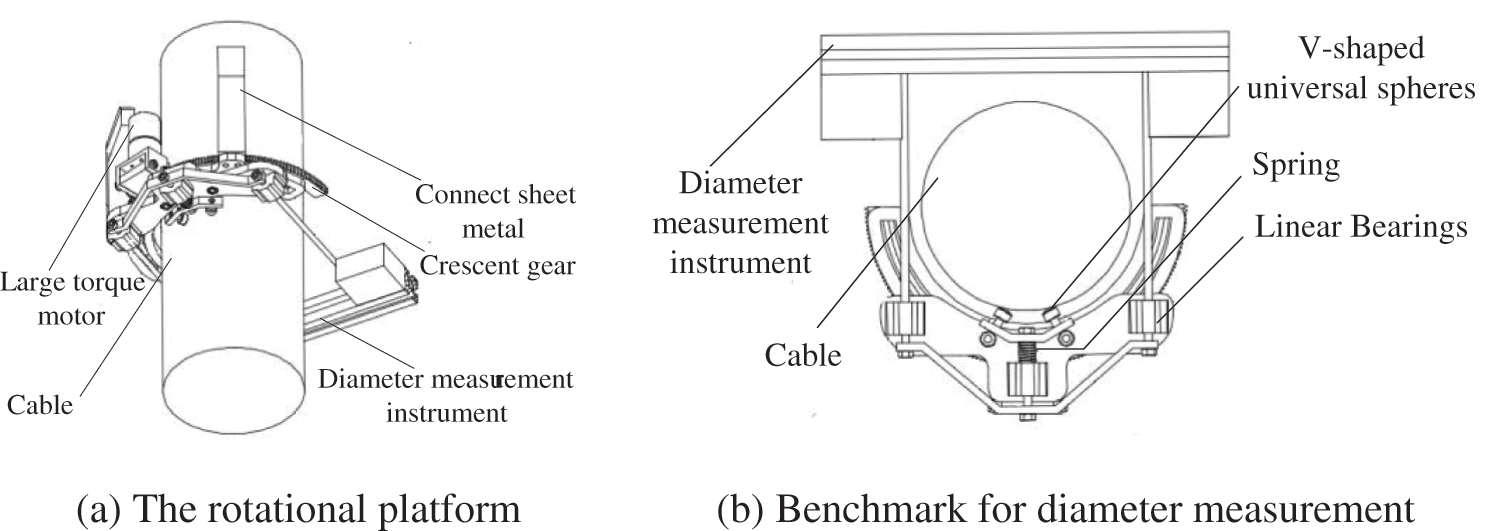
Figure 4: Diameter measurement module
3 Principles Underpinning Image Detection and Diameter Measurement for Surface Damage Assessment
To extract the information about the surface damage to such cables, it is necessary to process and analyze the collected images and data; to attain the information on bulges on the cable surfaces, it is also essential to process the acquired data relating to the cable diameter.
3.1 Image Processing and Analysis
The acquired surface images also contain areas beyond the cables and are subject to interference from vibration and light. Hence, an improved local grey contrast enhancement method and an improved maximum correlation method for threshold segmentation are proposed to improve the defect detection performance.
The main part is extracted from the original image by using image matting method (Fig. 5).
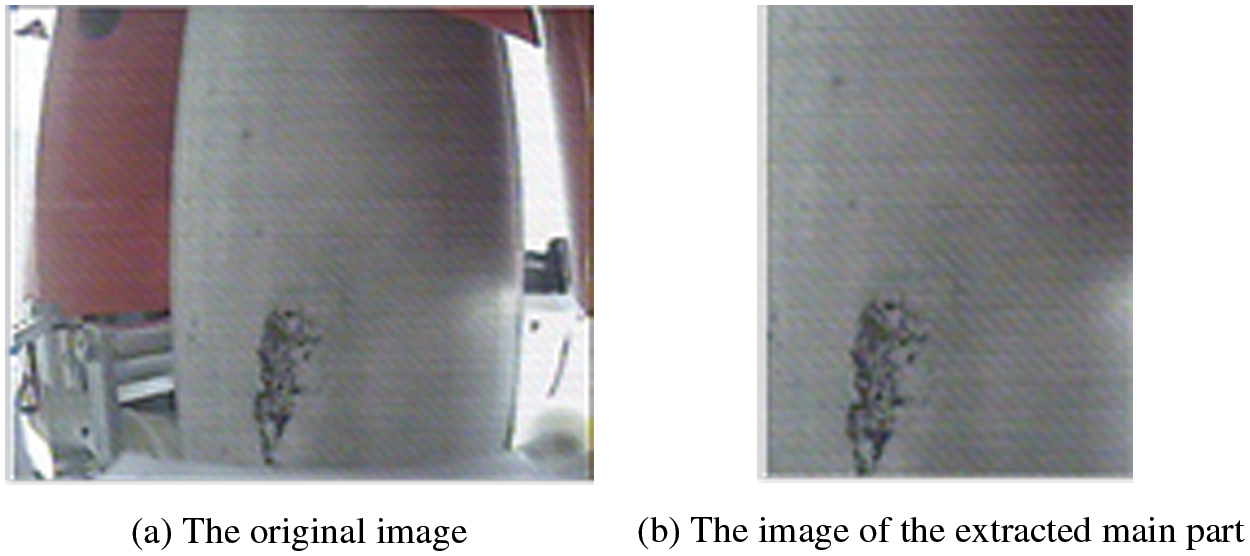
Figure 5: Extracting the part with cables from the original image
Considering the influences of light and different reflection characteristics of the cable surfaces, the surface defects of cables are possibly hidden and therefore it is necessary to highlight the defective areas on the cable surface through image enhancement. Although the light intensity of the defective areas possibly approaches, or is higher than, that of the background areas, the light and reflection characteristics of each small area both vary marginally when only considering localized small areas. Thus, the local grey contrast enhancement method is improved. At first, the extracted image of the cable areas is transformed into the grey scale image; the grey value of each pixel in the grey scale image is then transformed into the corresponding enhanced value.
The local grey contrast enhancement method proceeds as follows: the image collected by the robot is set as
where,
The image
The image with noises is set as
where, A and B separately denote multiplicative and additive noise signals.
The noisy image is transformed into
where,
By substituting Eq. (3) into Eqs. (4)–(6) is obtained when supposing that A and B are constants in the case that the window W is small enough.
where,
By substituting Eq. (7) into Eqs. (6) and (8) is attained:
According to Eq. (8), it is found that the image processed by the local grey contrast enhancement method is insensitive to multiplicative noise when ignoring additive noise. The insensitivity to the intensity of light source is then verified. If the model for the image
where,
where,
Generally, within a small area,
For two different windows
Generally, the grey level of the defective areas is lower than that of background areas. Furthermore, if an area corresponds to the background area, the pixel grey level thereof is larger than the average grey level within the local window. If the area corresponds to a defective area, the pixel grey level thereof is lower than the average grey level within the local window. Considering that the grey levels of the background areas are set as the same during threshold segmentation of images of cables, it is feasible to define the improved local grey contrast enhancement method as follows:
where, the grey level equals 0 when the pixel
The image with the enhanced local grey contrast shows the following characteristics: weakening the interference of multiplicative noises and being insensitive to the intensity of light sources. It can be supposed that the grey level of the defective areas is lower than that of the background areas for an image with the enhanced local grey contrast of small areas.
The curved surface taking the pixel grey level
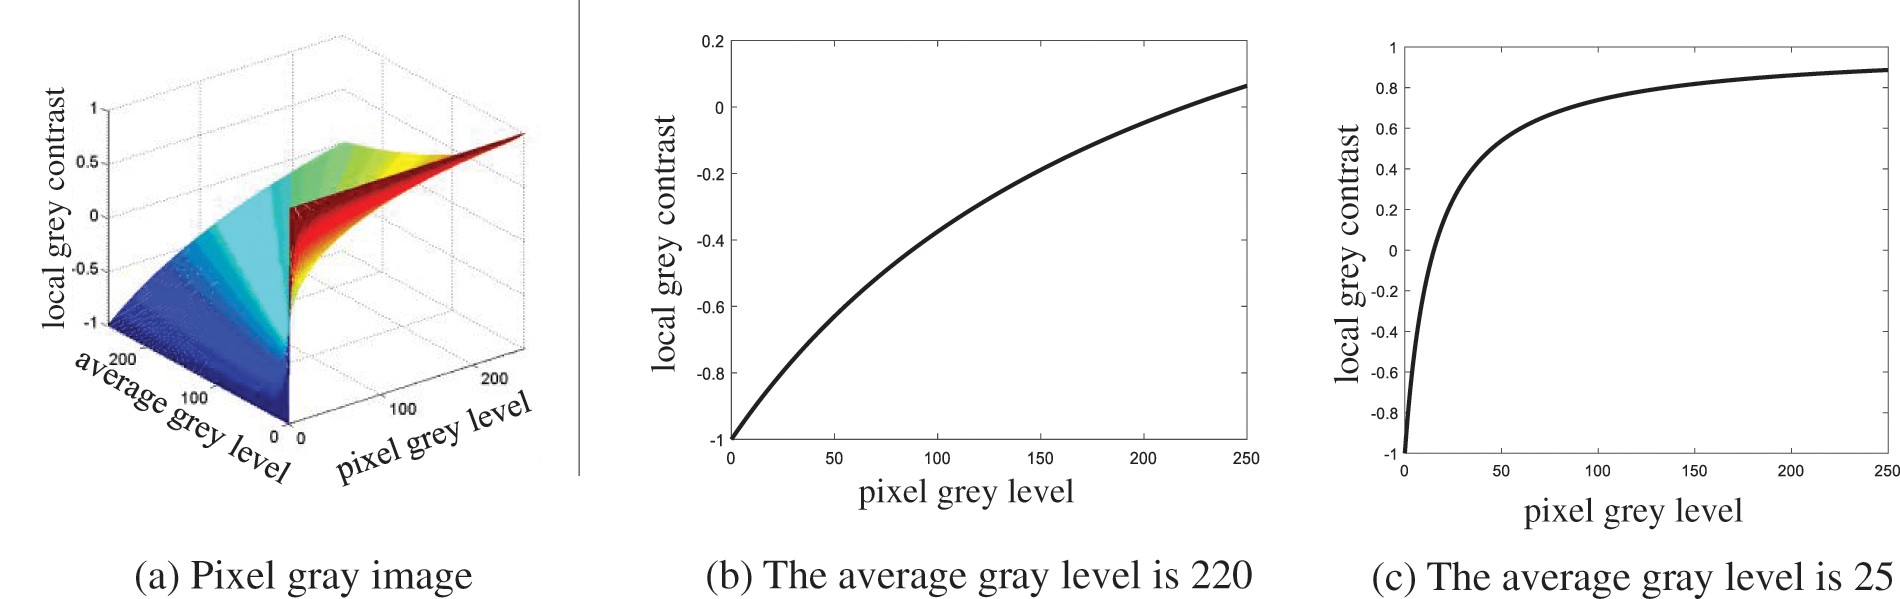
Figure 6: Analysis of the local grey contrast
After the images on the cable surface are enhanced, the pixels in the image mainly include defects, background, and noise. It is only necessary to detect the defective areas therein. The images are segmented by applying the improved maximum correlation method.
The maximum correlation method mainly describes as follows: for an image
By successively calculating the probability of each grey level, the probability distribution can be attained:
The probability distribution
where,
where,
The defective areas are small in the defect images. In view of this, the optimal threshold is greatly affected by the correlation function
Let the weight coefficient
thus, the improved maximum correlation method for threshold segmentation is defined as follows:
where, parameter
The improved maximum correlation method proposed in the study is defined by the product of the correlation function for defects and the weight coefficient
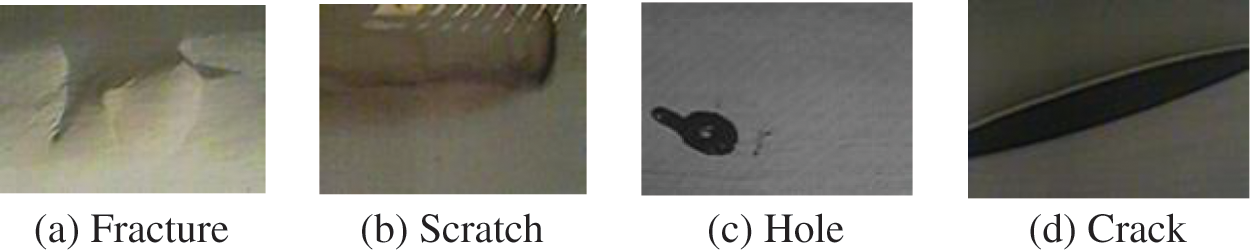
Figure 7: Surface damage to cables
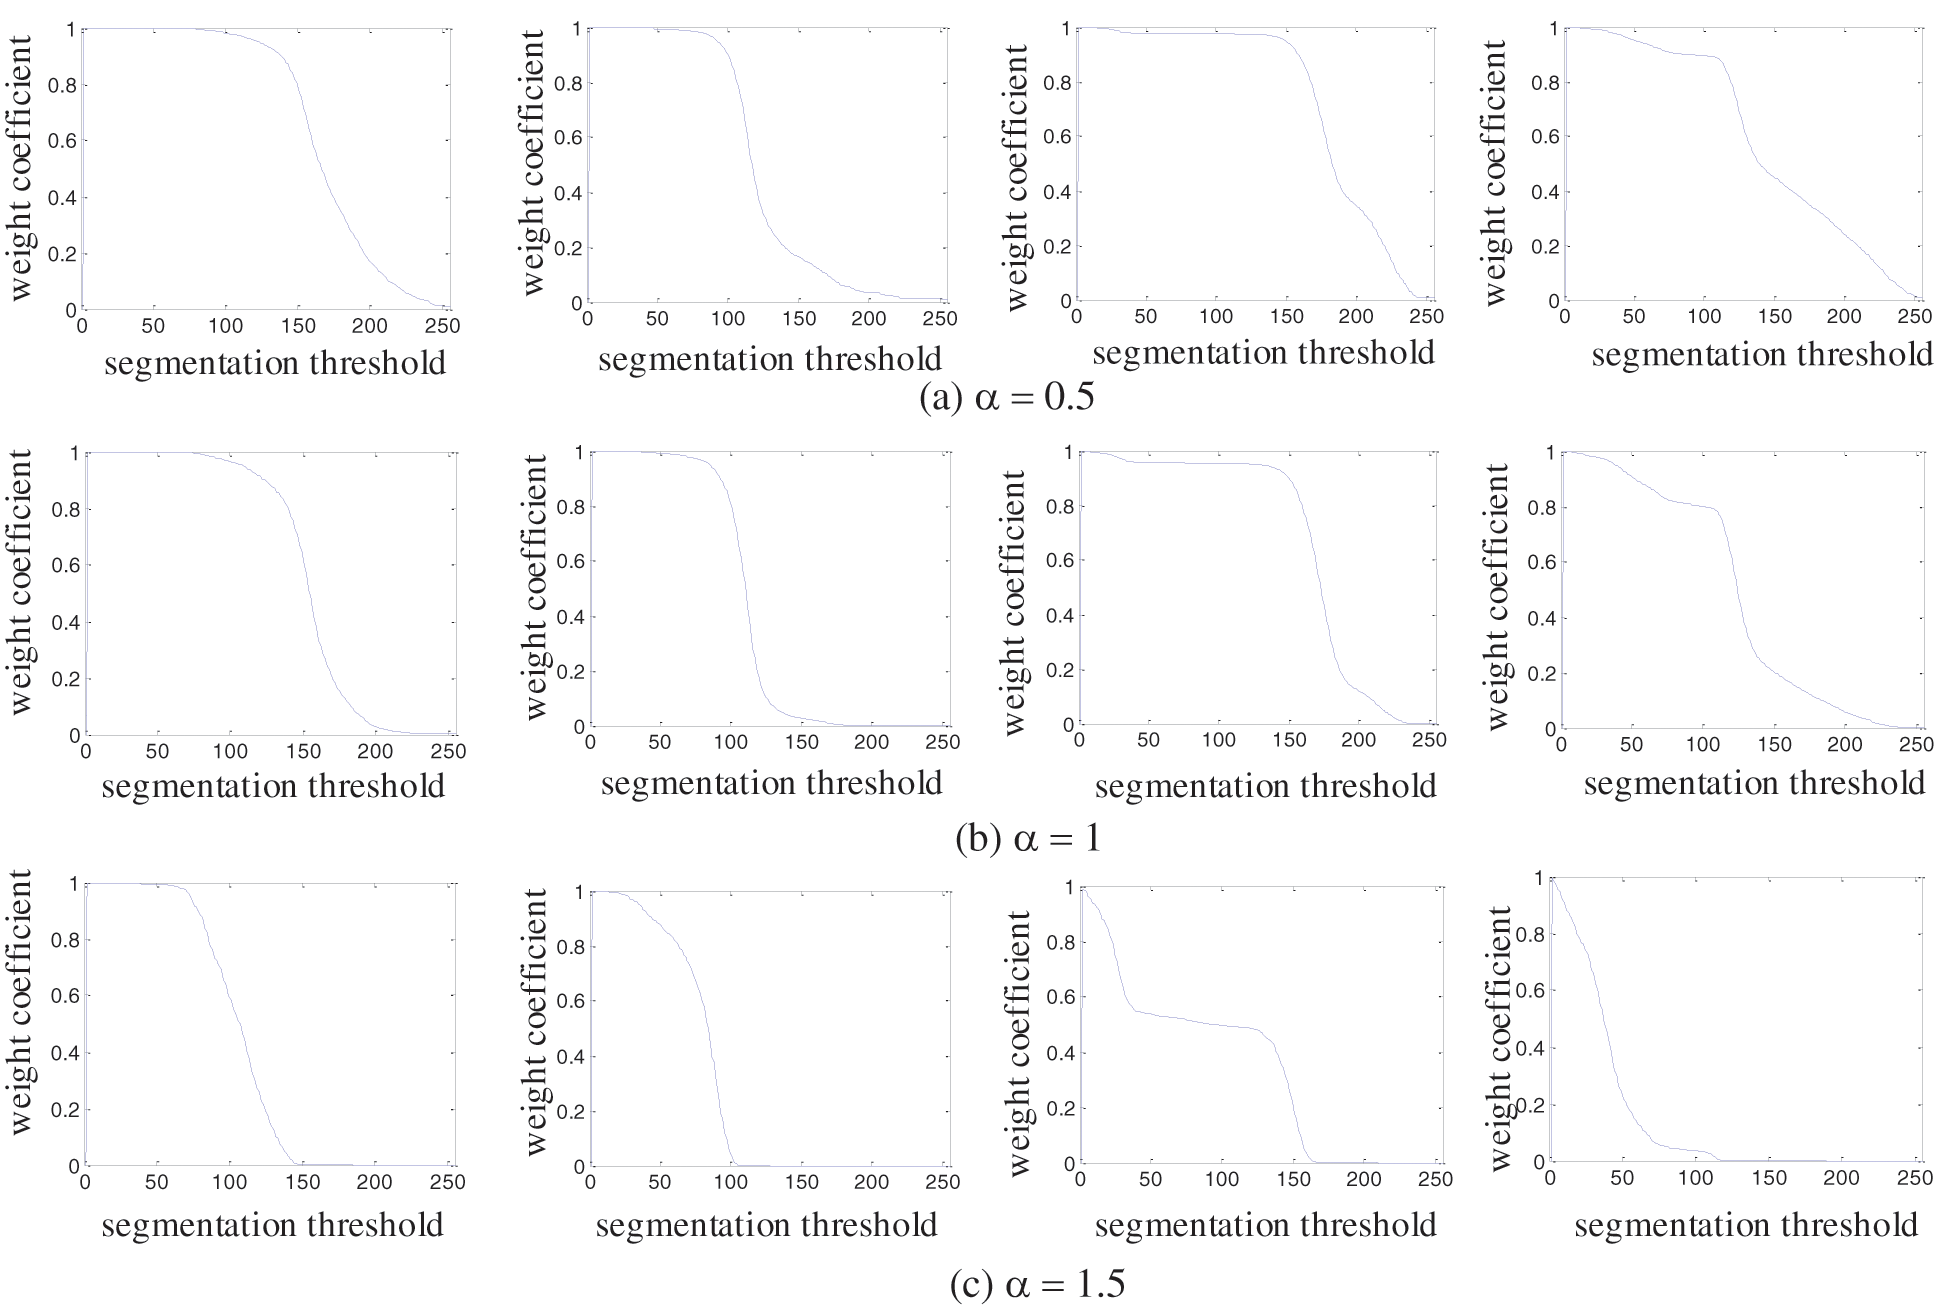
Figure 8: Changes in the weight coefficient with the segmentation threshold based on the improved maximum correlation method
Due to the presence of noise, and some rough areas on the cables, the image of the cable surface after segmentation does not always correspond to defects. It is necessary to judge further the segmented areas. The defects are judged by applying the statistical comparison method.
The specific method is described as follows: m images without surface defects are selected, then extracted, enhanced, and segmented to calculate the gradient values of the images after threshold segmentation. The pixel number
When the surface images
When
3.2 Data Processing Through Diameter Measurement
To attain an intuitive picture of the diameter of cables, it is necessary to process the data obtained through the diameter measurement of cables. A moving averaging method is proposed to analyze the measured data. The datum
The more accurately to express the measured result and inhibit the influence of the random error
The moving averaged sequence of
where, k denotes the moving length. The value of k is determined according to the sample size. The data obtained through diameter measurement are calculated by using the moving averaging method based on Eq. (26). Moreover,
A scheme for relative measurement is proposed based on the moving averaging method, that is, the mechanism first detects the surface of non-destructive cables to obtain a group of reference data; afterwards, the cables under equivalent conditions are measured based on the mechanism. The systematic measurement error and trend of the mechanism are acquired according to the reference data, based on which the measured data are processed. Compared with the ordinary filtering algorithm, the measurement method can better measure the surface conditions of cables to decrease systemic error and increase the measurement accuracy.
4.1 Data Processing Through Diameter Measurement
The test system includes a camera with a focal length of 2.8 mm, an Angle of 80°, and a shooting distance of 10 cm. An image splitter that supports NTSC/PAL dual video systems. Digital video recorder (DVR) with frame rate up to 30fps using Mpeg-4 video compression technology. a wireless image receiver, a wireless image transmitter, a video capture card, test cables, and a computer. Fig. 9 shows the main devices used for video capture.
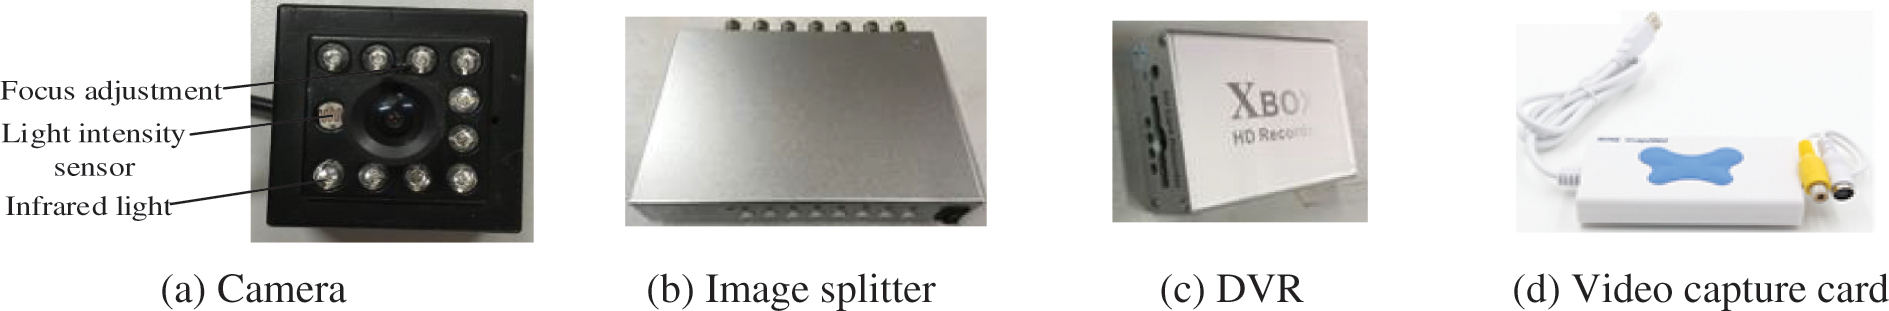
Figure 9: Devices for image capture
According to the level of damage to the cable surface, the images are divided into two types: separately containing a large (type-I) and a small (type-II) damage area of defects, which temporarily do not influence the cables. To evaluate the performance of the detection algorithm, the accuracy P and recall ratio R are used as performance indices, defined as follows:
where, T represents the number of the defect images correctly detected by using the algorithm; F and S denote the number of images without surface defects detected by using the algorithm and the total number of images of each type of defect. According to the definition, it can be found that the accuracy is inversely proportional to the recall ratio, however, it is essential to ensure detection of all defects on the cables of a bridge, thus, the recall ratio is more important than the accuracy.
4.2 Tests on Image Enhancement and Image Threshold Segmentation
To test the effect of the image enhancement method, the following test is designed: different images on the surface defects of the cables are selected and processed by separately using local grey contrast enhancement method and the improved grey contrast enhancement method. The results are shown in Fig. 10 wherein,
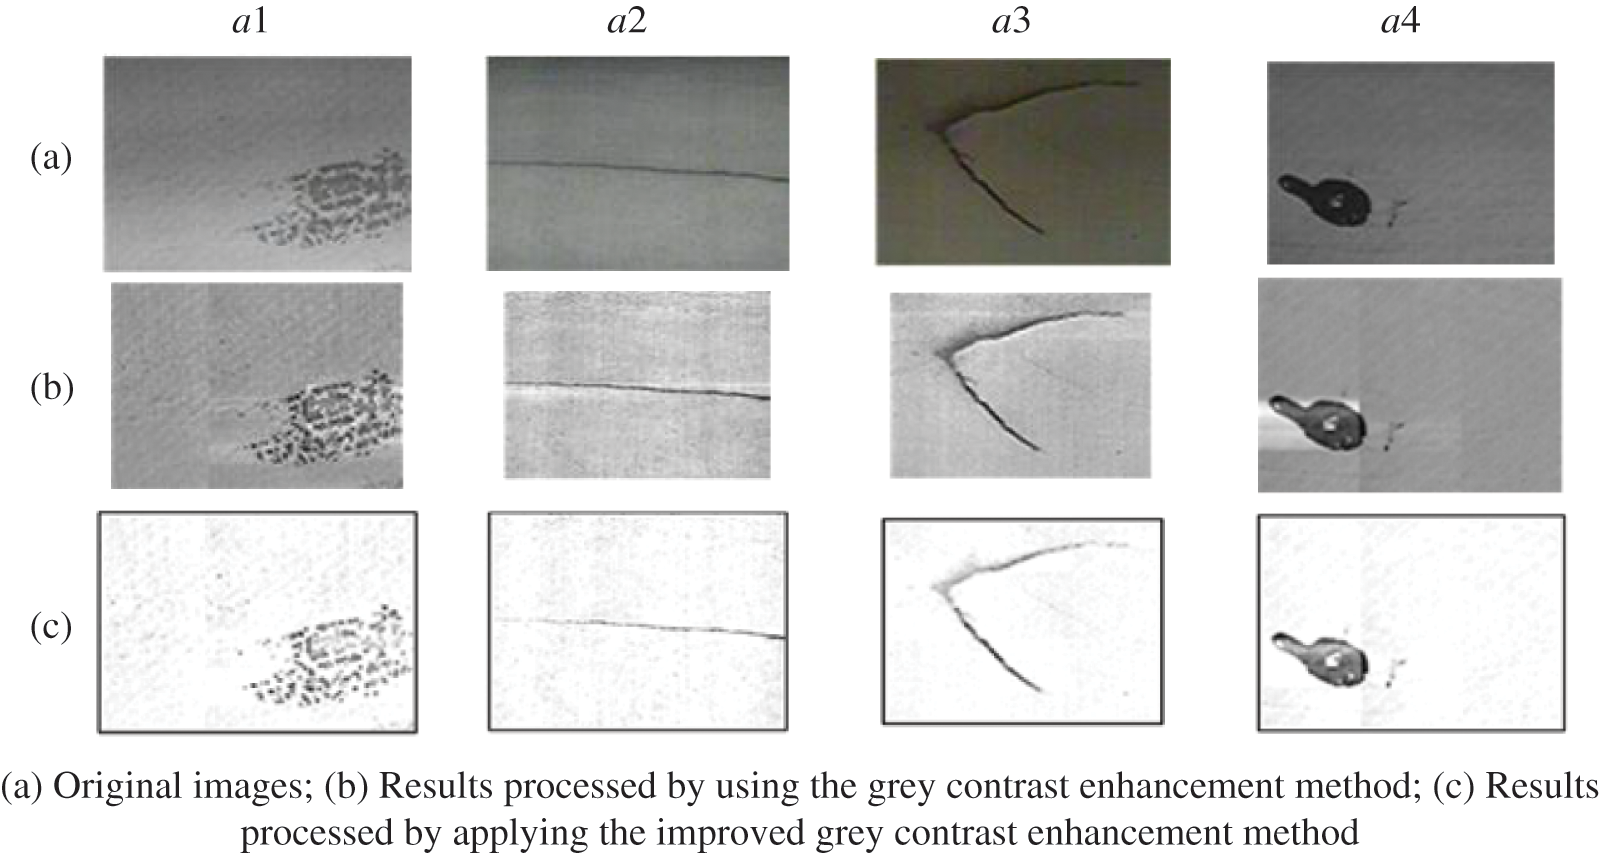
Figure 10: Test results
Aiming at the proposed threshold segmentation method, the following test is designed: different images of surface defects on cables are selected and then processed by applying the maximum correlation method and the improved maximum correlation method. The results are displayed in Fig. 11. The row a show the images of surface defects of cables. The rows b and c show the results of examples segmented based on the maximum correlation method and the improved maximum correlation method after the images are processed with the improved local grey contrast enhancement method. By comparing rows b and c, it can be found that the segmentation threshold t calculated by using the improved maximum correlation method is generally lower than that obtained when using the original method. This indicates that the improved method for threshold segmentation can better segment those parts of images pertaining to defects compared to the original method.
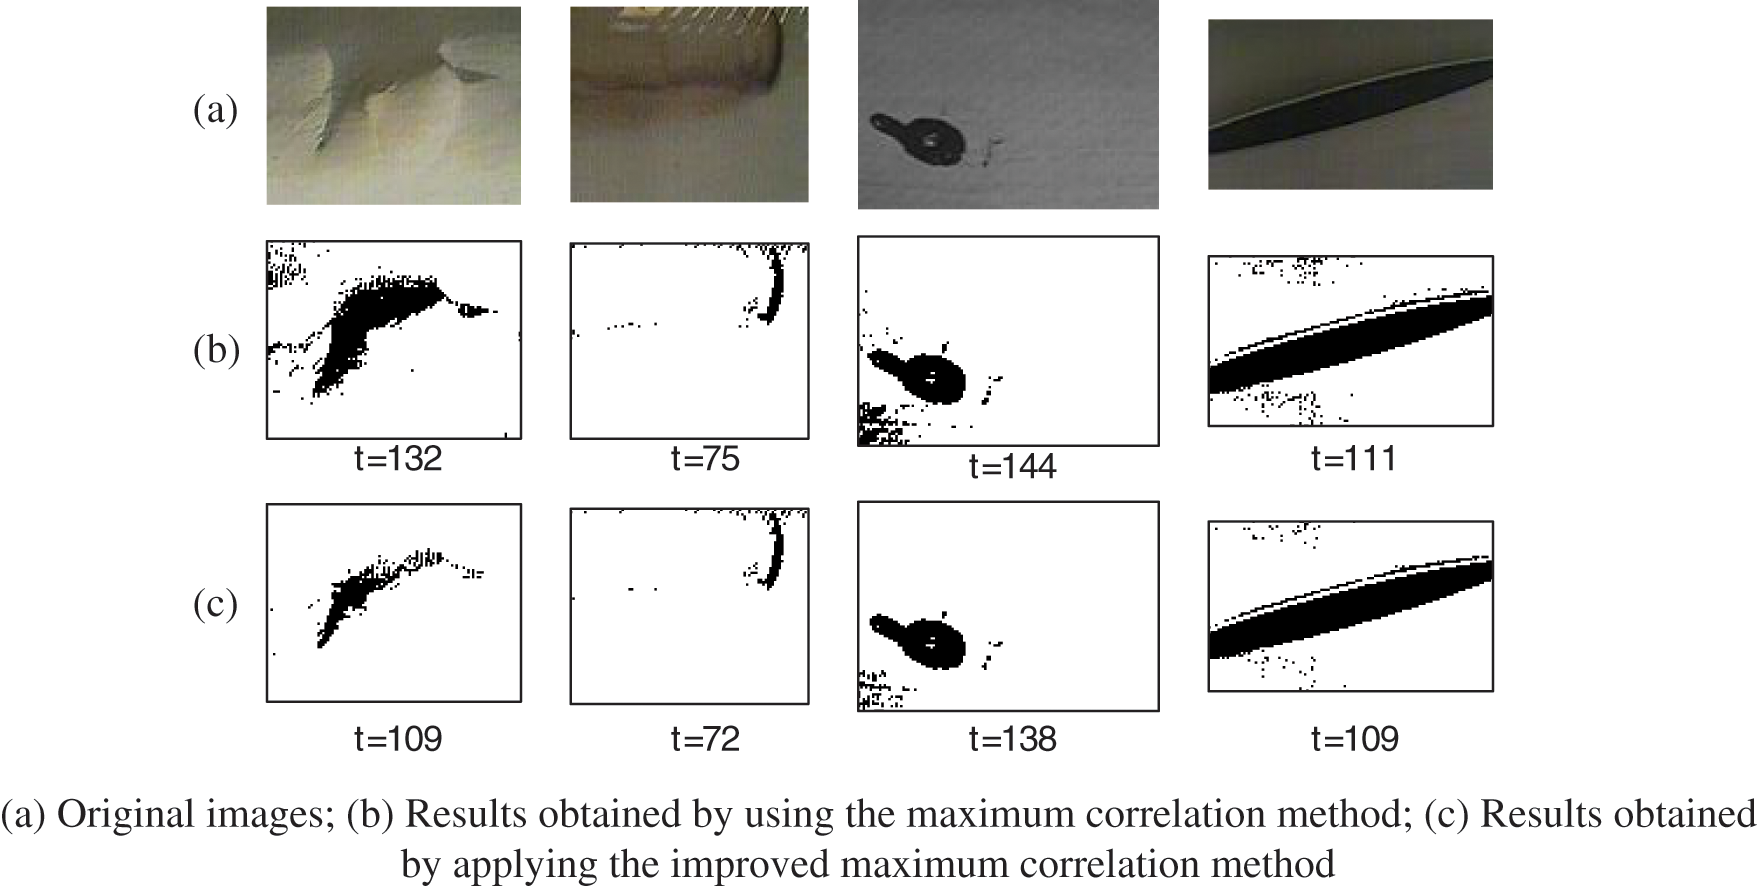
Figure 11: Results obtained using two methods of threshold segmentation (t: segmentation threshold)
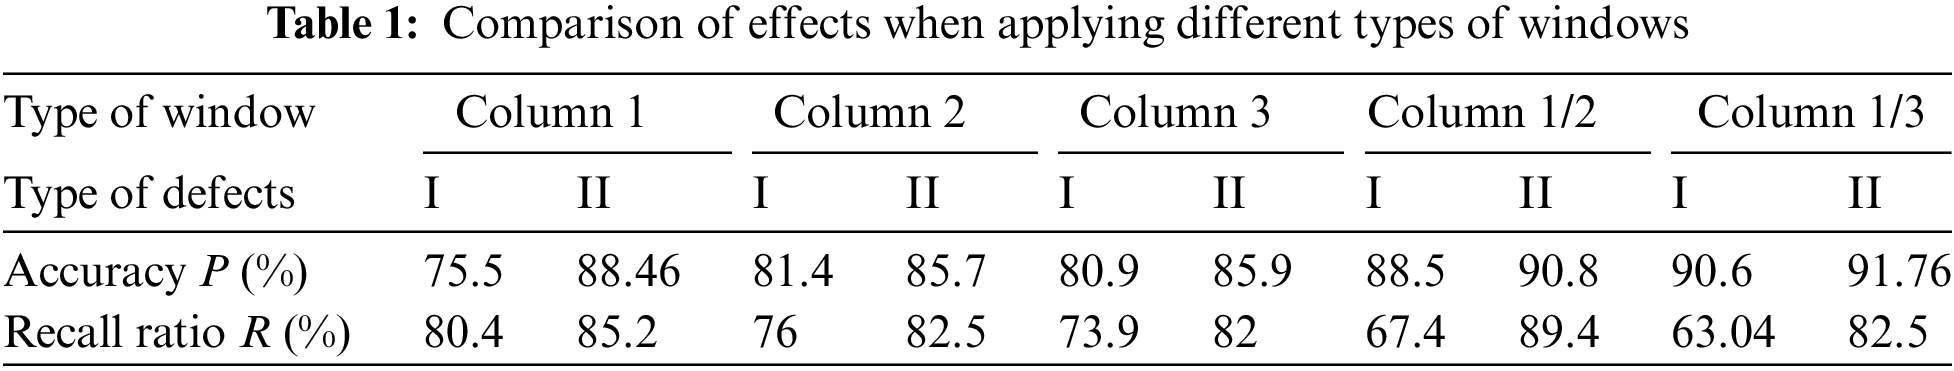
In the improved local grey contrast enhancement method, the accuracy and recall ratio changes across the different types of windows. Aiming at that problem, the test based on the control variate method is designed, that is, the improved maximum correlation method is applied as the threshold segmentation method during the test; moreover, the parameter
In the improved maximum correlation method for threshold segmentation, parameter
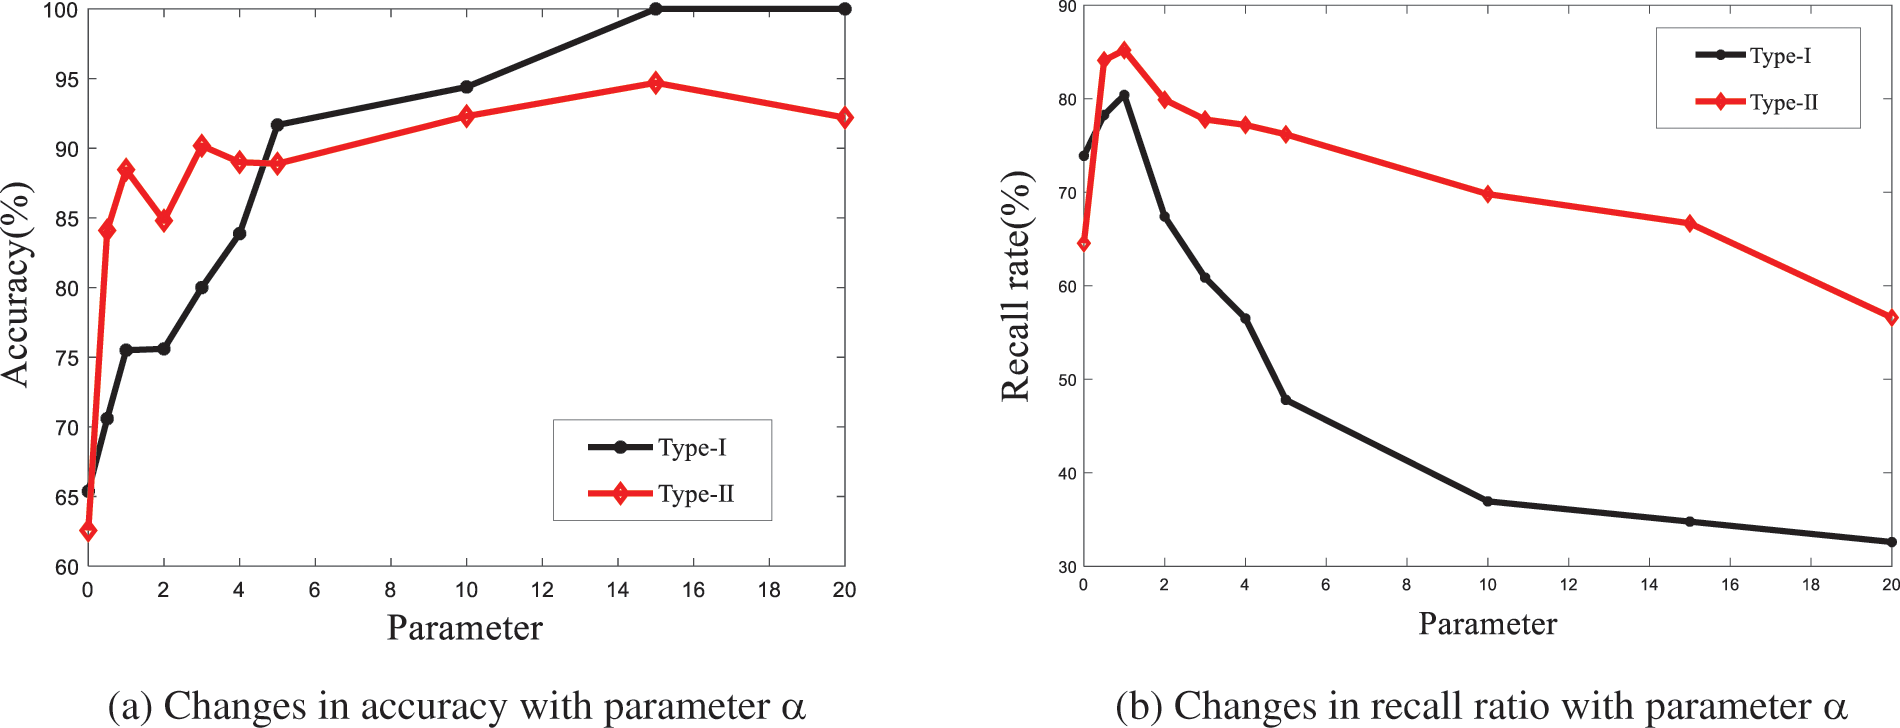
Figure 12: The influence of parameter
The recall ratio is more important relative to the accuracy. It can be seen from Fig. 12b that the recall ratio almost reaches a maximum when
4.3 Test on the Module for Diameter Measurement of Surface Damage to Cables
To detect the surface damage to cables, the test equipment designed and used for direct measurement is shown in Figs. 13a and 13b. The bulges on cables are simulated by pasting the paper with a certain thickness onto a polyvinyl chloride (PVC) pipe. The simulated bulges are measured through two methods: 1) circumferential measurement: the robot for detection climbed and drove the diameter measurement mechanism to the measuring points and then the rotational mechanism cyclically swung to perform the measurement. The width of the shielded laser screen is measured by using the diameter measurement instrument and recorded; 2) axial measurement: the detection mechanism swung to a certain angle and the robot scanned and detected the cable while climbing and recorded the data. Fig. 13c shows the picture of robot field test. The distribution of the raw data collected through the tests is shown in Fig. 14.
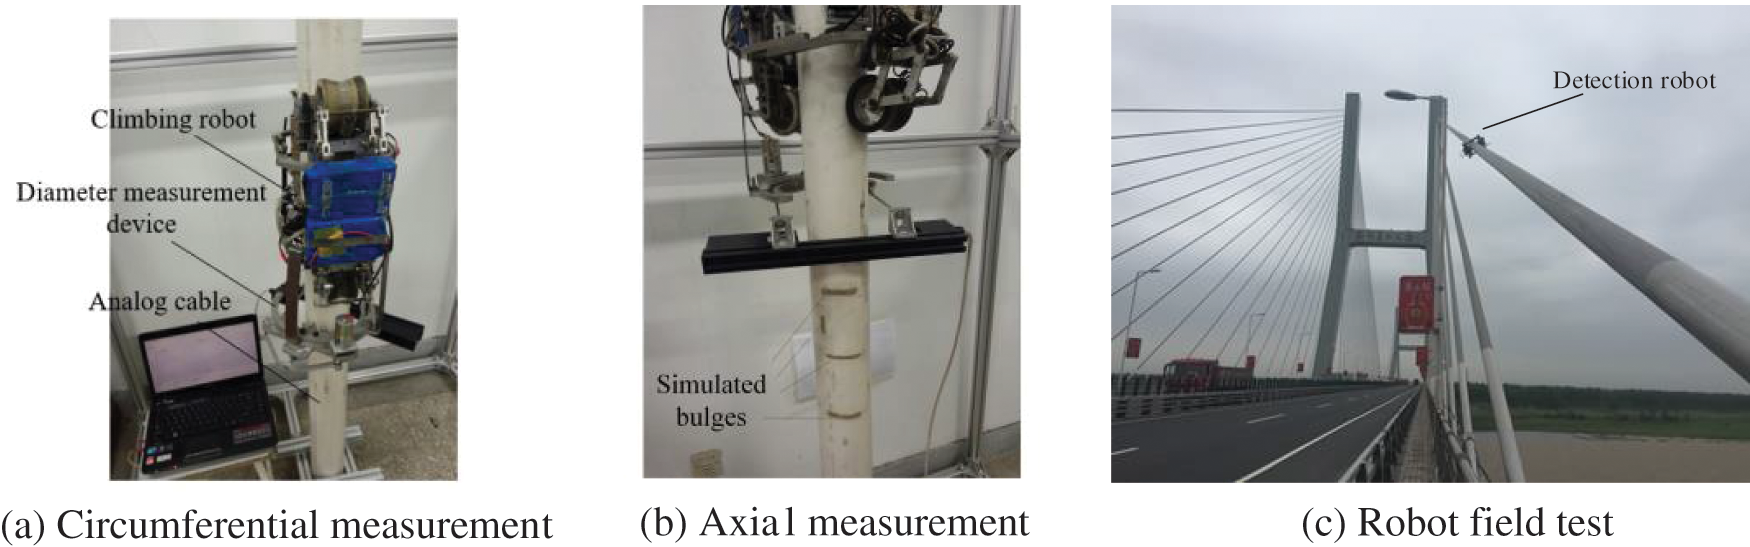
Figure 13: Diameter measurement test
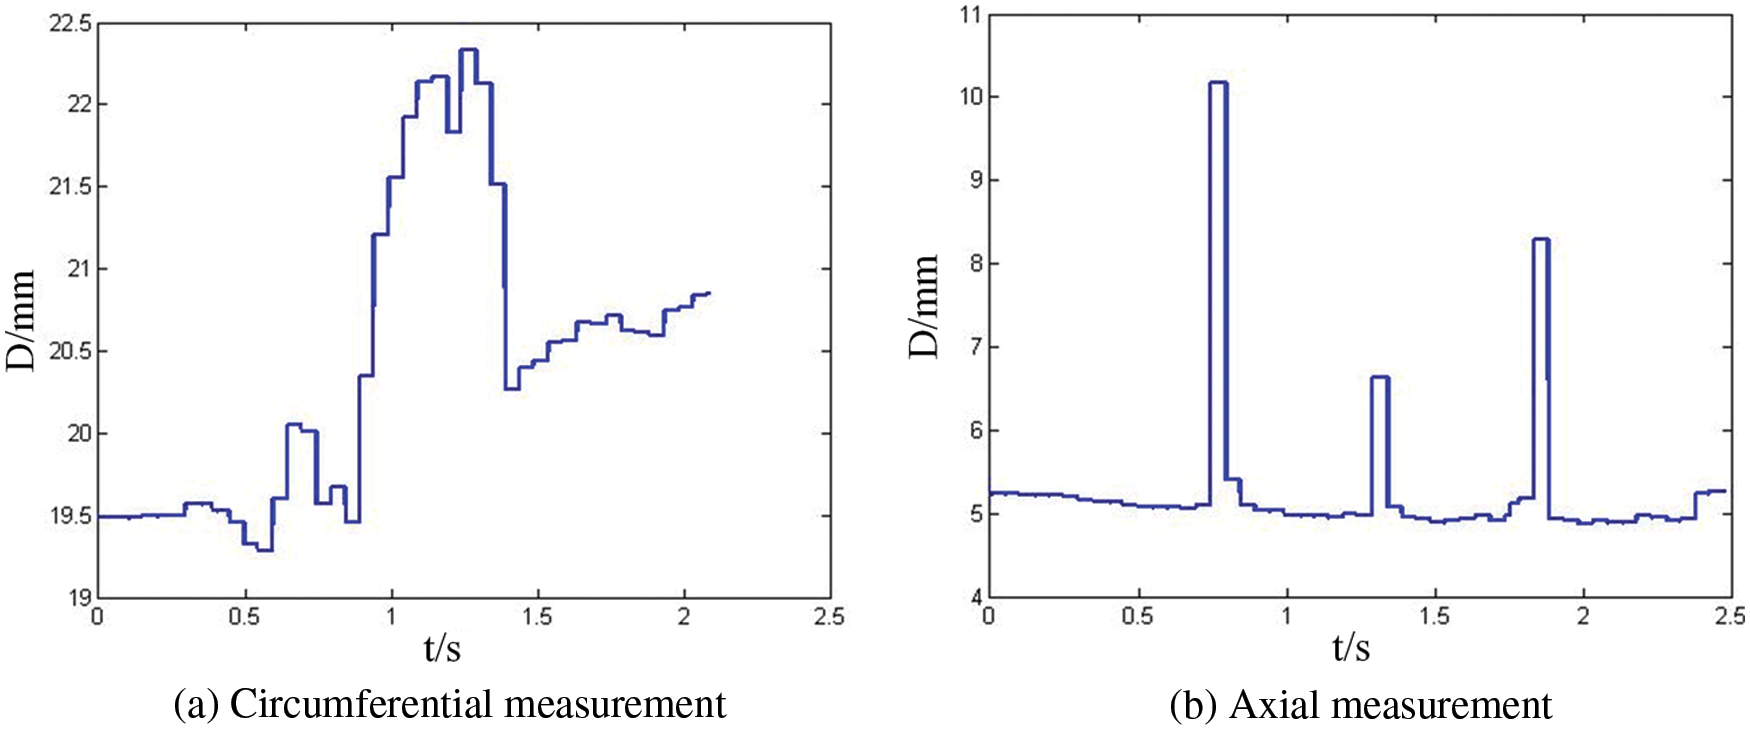
Figure 14: The distribution of the acquired raw data
For circumferential measurement, it can be seen from Fig. 14a that, although a certain benchmark mechanism is defined in the measurement system, the measured benchmark data are non-linear due to various reasons such as the uneven mechanism during the test. At two rotational limit angles of the platform, the deviation gradually increases, with the error being about 1 to 1.5 mm. For the axial measurement (Fig. 14b), the measured data are relatively stable. The height difference of three bulges set and the contour shapes of the bulges can be clearly observed; however, the measured values still fluctuate to some extent and therefore it remains necessary to process the measured data.
Fig. 15a compares the reference data and the measured data of bulges collected by the mechanism. By calculating the differences between the two types of data and then finding their moving averaged values, error signals are obtained, as shown in Fig. 15b. Through observation, it is found that the height of the bulge is 2.4 mm and the observable time of the bulge is about 0.6 s. On this basis, it is feasible to infer the shape of the bulge.
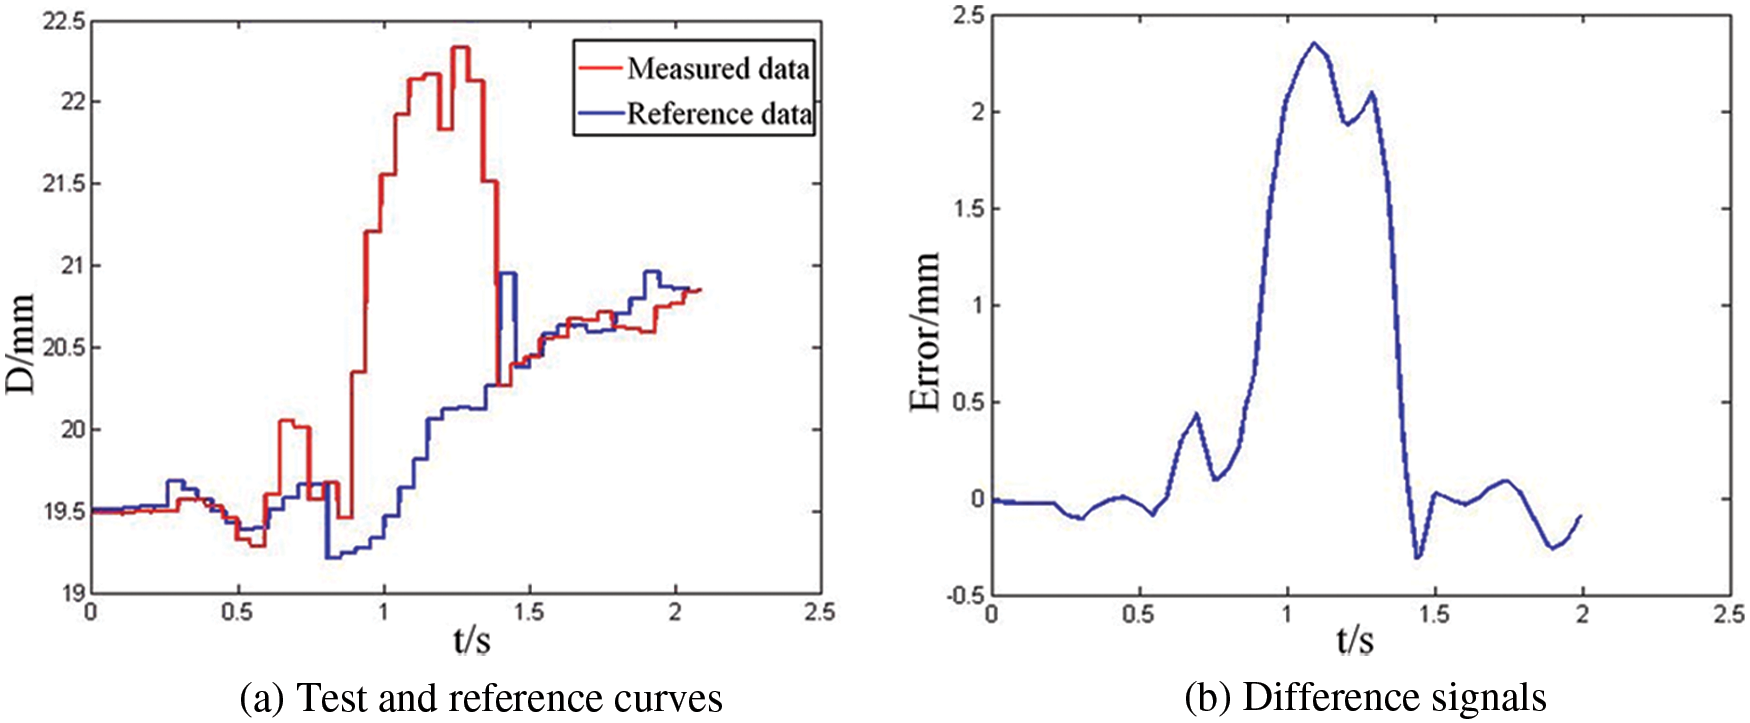
Figure 15: Relative measurement method
The deviations in data are low during longitudinal measurement, the signals are thus directly filtered based on the moving averaging method and the resulting images are shown in Fig. 16. The heights of bulges can be found from the figure. In addition, according to the measurement time of signals and the operating speed of the robot, it is feasible to infer the longitudinal width of bulges, and the measured heights of longitudinal bulges are 10.178, 6.638, and 8.288 mm, respectively.
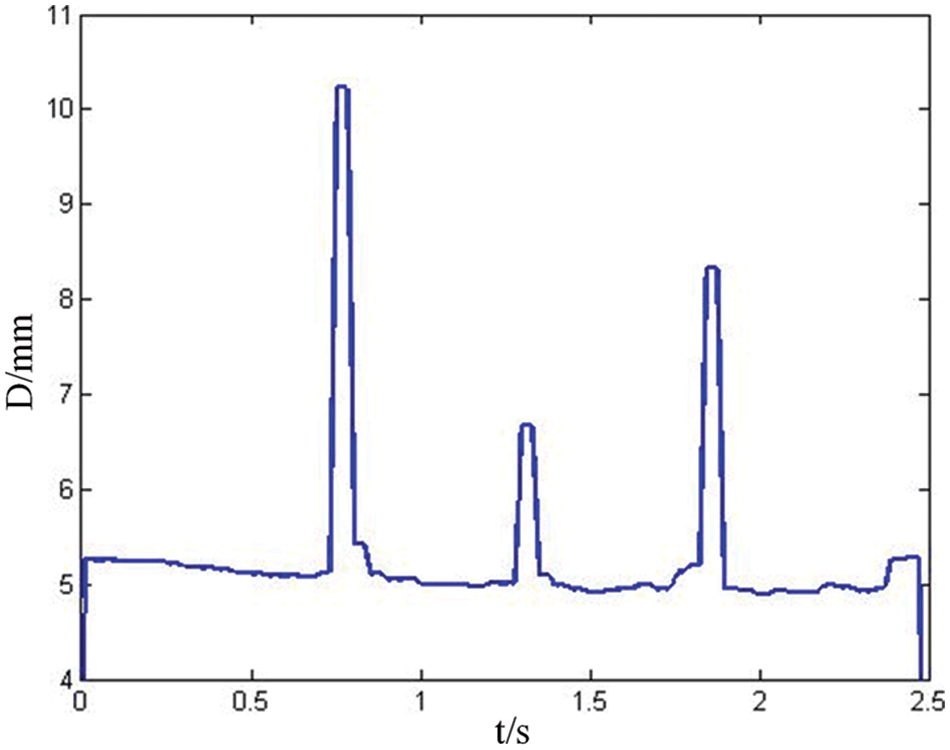
Figure 16: Data curves during longitudinal measurement
The above test results show that the heights and widths of the surface damages of cables can be acquired through circumferential and axial measurements based on the relative measurement method, thus effectively evaluating the damage to the protective casings of stay cables.
To overcome the difficulty in detecting the surface defects of cables of a bridge, a detection device and method for surface defects of cables is proposed based on computer vision and laser diameter measurement. The improved local grey contrast enhancement method and the improved maximum correlation method are proposed, and the data processing method (i.e., moving averaging method) used for diameter measurement is analyzed. The simulation and experimental verification of these methods on the damage measurement of cables are performed. The results reveal that the application of the improved local grey contrast method and the improved maximum correlation method for threshold segmentation allows better defect identification. Moreover, in the case that the size of the windows is
Funding Statement: This work was supported by the National Natural Science Foundation of China (Grant Nos. 52175100), the Natural Science Foundation of Jiangsu Province (Grant Nos. BK20201379), Jiangsu Provincial natural science research major project (Grant Nos. 21KJA460013) and six talent peaks project in Jiangsu Province (Grant Nos. JY-081).
Conflicts of Interest: The authors declare that they have no known competing financial interests or personal relationships that could have appeared to influence the work reported in this paper.
References
1. Q. Li and S. Ren, “A real-time visual inspection system for discrete surface defects of rail heads,” IEEE Transactions on Instrumentation and Measurement, vol. 61, no. 8, pp. 2189–2199, 2012. [Google Scholar]
2. P. Zhou, G. Zhou, Y. Li, Z. He and Y. Liu, “A hybrid data-driven method for wire rope surface defect detection,” IEEE Sensors Journal, vol. 99, pp. 1–1, 2020. [Google Scholar]
3. X. Huang, Z. Liu, X. Zhang, J. Kang, M. Zhang et al., “Surface damage detection for steel wire ropes using deep learning and computer vision techniques,” Measurement, vol. 161, pp. 107843, 2020. [Google Scholar]
4. J. P. Yun, D. Kim, K. H. Kim, S. J. Lee, C. H. Park et al., “Vision-based surface defect inspection for thick steel plates,” Optical Engineering, vol. 56, no. 5, pp. 053108, 2017. [Google Scholar]
5. B. Ramalingam, V. H. Manuel, M. R. Elara, A. Vengadesh, A. K. Lakshmanan et al., “Visual inspection of the aircraft surface using a teleoperated reconfigurable climbing robot and enhanced deep learning technique,” International Journal of Aerospace Engineering, vol. 1, pp. 1–14, 2019. [Google Scholar]
6. S. A. Idris, F. A. Jafar, Z. Jamaludina and N. Blar, “Improvement of corrosion detection using vision system for pipeline inspection,” Applied Mechanics and Materials, vol. 761, pp. 125–131, 2015. [Google Scholar]
7. Y. Li, J. Ai and C. Sun, “Online fabric defect inspection using smart visual sensors,” Sensors, vol. 761, pp. 4659–4673, 2013. [Google Scholar]
8. M. R. Saleem, J. W. Park, J. H. Lee and M. Z. Sarwar, “Instant bridge visual inspection using an unmanned aerial vehicle by image capturing and geo-tagging system and deep convolutional neural network,” Structural Health Monitoring, vol. 20, no. 4, pp. 1760–1777, 2020. [Google Scholar]
9. S. Albahli, H. T. Rauf, M. Arif, M. T. Nafis and A. Algosaibi, “Identification of thoracic diseases by exploiting deep neural networks,” Computers, Materials & Continua, vol. 66, no. 3, pp. 3139–3149, 2021. [Google Scholar]
10. Y. Li, W. Zhao, X. Zhang and Q. Zhou,“A two-stage crack detection method for concrete bridges using convolutional neural networks,” IEICE Transactions on Information and System, vol. 101, no. 12, pp. 3249–3252, 2018. [Google Scholar]
11. S. Husain, M. Imran, A. Ahmad, Y. Ahmad and K. Elahi, “A study of cellular neural networks with vertex-edge topological descriptors,” Computers, Materials & Continua, vol. 70, no. 2, pp. 3433–3447, 2022. [Google Scholar]
12. P. Prasanna, K. Dana, N. Gucunski and B. Basily, “Computer-vision based crack detection and analysis,” Proceedings of Spie the International Society for Optical Engineering, vol. 8345, pp. 115, 2012. [Google Scholar]
13. X. R. Zhang, X. Sun, X. M. Sun, W. Sun and S. K. Jha, “Robust reversible audio watermarking scheme for telemedicine and privacy protection,” Computers, Materials & Continua, vol. 71, no. 2, pp. 3035–3050, 2022. [Google Scholar]
14. N. H. Pham, H. M. La, Q. P. Ha, S. N. Dang, A. H. Vo et al., “Visual and 3D mapping for steel bridge inspection using a climbing robot,” in 33th Int. Symp. on Automation and Robotics in Construction, Auburn, Alabama, US, pp. 125–132, 2016. [Google Scholar]
15. A. Marchewka, P. Ziółkowski and V. Aguilar-Vidal, “Framework for structural health monitoring of steel bridges by computer vision,” Sensors, vol. 20, no. 3, pp. 700, 2020. [Google Scholar]
16. B. Guldur, Y. Yan and J. F. Hajjar, “Condition assessment of bridges using terrestrial laser scanners,” Proceedings of Structures Congress 2015, Portland, Oregon, April 23−25, 2015, pp. 355–366, 2015. [Google Scholar]
17. F. Potenza, C. Rinaldi, E. Ottaviano and V. Gayyulli, “A robotics and computer-aided procedure for defect evaluation in bridge inspection,” Journal of Civil Structural Health Monitoring, vol. 10, pp. 1–14, 2020. [Google Scholar]
18. J. K. Oh, G. Jang, S. Oh, J. H. Lee, B. L. Yi et al., “Bridge inspection robot system with machine vision,” Automation in Construction, vol. 18, no. 7, pp. 929–941, 2009. [Google Scholar]
19. F. Xu, S. Dai, Q. Jiang and X. Wang, “Design, analysis, and testing of a climbing robot to repair the cables on cable-stayed bridges,” Automation in Construction, vol. 129, pp. 103807, 2021. [Google Scholar]
20. J. H. Lee, J. M. Lee, H. J. Kim and Y. S. Moon, “Machine vision system for automatic inspection of bridges,” in 2008 Congress on Image and Signal Processing 27-30 May, vol. 3, IEEE, Sanya, Hainan, China, pp. 363–366, 2008. [Google Scholar]
21. R. S. Adhikari, O. Moselhi and A. Bagchi, “A study of image-based element condition index for bridge inspection,” ISARC, Proceedings of the International Symposium on Automation and Robotics in Construction, vol. 30, pp. 1, 2013. [Google Scholar]
22. A. Akutsu, E. Sasaki, K. Takeya, Y. Kobayashi, K. Suzuki et al., “A comprehensive study on development of a small-sized self-propelled robot for bridge inspection,” Structure and Infrastructure Engineering, vol. 13, no. 8, pp. 1056–1067, 2017. [Google Scholar]
23. Y. C. Chen, C. E. Yang and S. C. Kang, “A lightweight bridge inspection system using a dual-cable suspension mechanism,” Automation in Construction, vol. 46, pp. 52–63, 2012. [Google Scholar]
24. X. Li, C. Gao, Y. Guo, F. He and Y. Shao, “Cable surface damage detection in cable-stayed bridges using optical techniques and image mosaicking.” Optics & Laser Technology, vol. 110, pp. 36–43, 2019. [Google Scholar]
25. W. Jianlin and P. Jianping, “A method of background segmentation for surface defect of bridge cables,” Engineering of Surveying and Mapping, vol. 27, no. 7, pp. 24–29, 2018. [Google Scholar]
26. H. N. Ho, K. D. Kim, Y. S. Park and J. J. Lee, “An efficient image-based damage detection for cable surface in cable-stayed bridges,” Ndt & E International, vol. 58, pp. 18–23, 2013. [Google Scholar]
27. K. H. Cho, H. M. Kim, Y. H. Jin, F. Liu, H. Moon et al., “Inspection robot for hanger cable of suspension bridge: Mechanism design and analysis,” IEEE/ASME Transactions on Mechatronics, vol. 18, no. 6, pp. 1665–1674, 2013. [Google Scholar]
28. R. J. Yin and J. Yang, “Research on robot control technology based on vision localization,” Journal on Artificial Intelligence, vol. 1, no. 1, pp. 37–44, 2019. [Google Scholar]
29. X. R. Zhang, W. F. Zhang, W. Sun, X. M. Sun and S. K. Jha, “A robust 3-D medical watermarking based on wavelet transform for data protection,” Computer Systems Science & Engineering, vol. 41, no. 3, pp. 1043–1056, 2022. [Google Scholar]
30. F. Xu, Q. Jiang, Y. Lu and G. Jiang, “Modelling of a soft multi-chambered climbing robot and experiments,” Smart Materials and Structures, vol. 30, no. 3, pp. 1–17, 2021. [Google Scholar]
Cite This Article
 Copyright © 2023 The Author(s). Published by Tech Science Press.
This work is licensed under a Creative Commons Attribution 4.0 International License , which permits unrestricted use, distribution, and reproduction in any medium, provided the original work is properly cited.
 Downloads
 Citation Tools