
 Submit a Paper
 Propose a Special lssue
 Open Access
ARTICLE

Modeling CO2 Emission in Residential Sector of Three Countries in Southeast of Asia by Applying Intelligent Techniques
1 Clean Energy Research Group, Department of Mechanical and Aeronautical Engineering, Engineering III, University of Pretoria, Pretoria, South Africa
2 Department of Medical Research, China Medical University Hospital, China Medical University, Taichung, Taiwan
3 School of Electrical and Electronic Engineering, Universiti Sains Malaysia (USM), Nibong Tebal, 14300, Penang, Malaysia
4 Institute of Sustainable and Renewable Energy ISuRE, Faculty of Engineering, University, Malaysia Sarawak
5 Department of Renewable Energies, Faculty of New Sciences and Technologies, University of Tehran, Tehran, Iran
6 Center of Excellence in Applied Mechanics and Structures, Department of Civil Engineering, Faculty of Engineering, Chulalongkorn University, Bangkok, 10330, Thailand
* Corresponding Author: Jaroon Rungamornrat. Email:
Computers, Materials & Continua 2023, 74(3), 5679-5690. https://doi.org/10.32604/cmc.2023.034726
Received 25 July 2022; Accepted 13 September 2022; Issue published 28 December 2022
 View Full Text
 Download PDF
Abstract
Residential sector is one of the energy-consuming districts of countries that causes CO2 emission in large extent. In this regard, this sector must be considered in energy policy making related to the reduction of emission of CO2 and other greenhouse gases. In the present work, CO2 emission related to the residential sector of three countries, including Indonesia, Thailand, and Vietnam in Southeast Asia, are discussed and modeled by employing Group Method of Data Handling (GMDH) and Multilayer Perceptron (MLP) neural networks as powerful intelligent methods. Prior to modeling, data related to the energy consumption of these countries are represented, discussed, and analyzed. Subsequently, to propose a model, electricity, natural gas, coal, and oil products consumptions are applied as inputs, and CO2 emission is considered as the model’s output. The obtained R2 values for the generated models based on MLP and GMDH are 0.9987 and 0.9985, respectively. Furthermore, values of the Average Absolute Relative Deviation (AARD) of the regressions using the mentioned techniques are around 4.56% and 5.53%, respectively. These values reveal significant exactness of the models proposed in this article; however, making use of MLP with the optimal architecture would lead to higher accuracy.Keywords
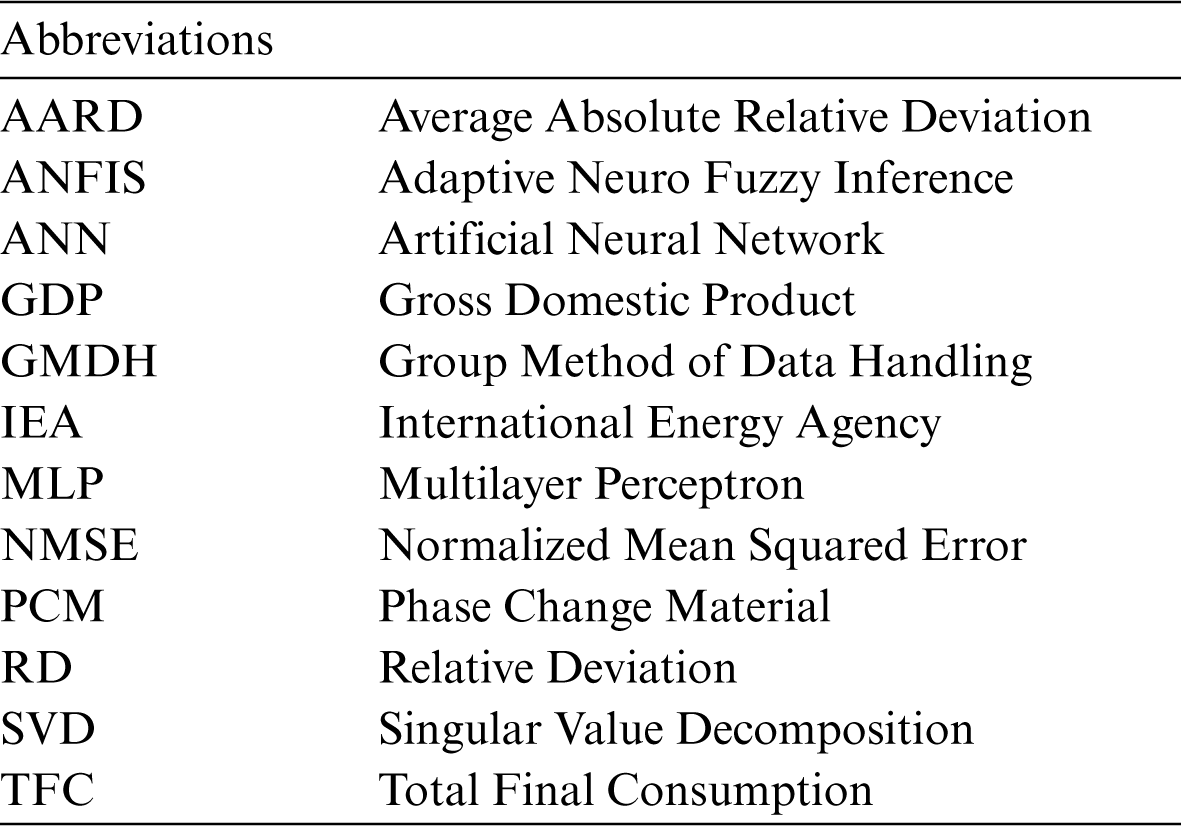
Fossil fuel consumption is the key factor of greenhouse gases emission in different sectors, including transportation, residential, industrial etc. In order to decrease the emission of these gases and their unfavorable consequences, different solutions such as decreasing energy consumption, using clean energy sources, and applying carbon capture technologies have been proposed [1–3]. According to data presented by International Energy Agency (IEA) [4], the industry and transport sectors are responsible for the highest total final consumption (TFC) and are followed by the residential sector, as shown in Fig. 1. In 2019, residential sector was responsible for 1969 Mt of CO2 emission in the world which is remarkable and shows its substantial role in the overall emission. Similar to the other sectors, different energy sources such as oil products, natural gas, and coal are usable in the residential sector, and CO2 emission would be affected by the types of energy consumption due to the dependency of emission on the fuel kind.
Figure 1: Shares of different sectors in TFC of the world in 2019 [4]
As indicated, energy consumption and applied technology significantly influence the emission of greenhouses in all sectors. Energy saving and applying clean technologies in the residential sector would decrease emissions. Given this, different strategies have been suggested for buildings and the residential sector. The use of phase change materials (PCMs) for thermal comfort is one of the proposed approaches for energy saving in buildings. For instance, Al-Rashed et al. [5] investigated the impact of using passive PCM technique in building envelopes by considering Kuwait climate conditions and found that using this technique in vertical load would be possible to save CO2 and energy by 198.65 kg/m2.year and 481 kWh/m2.year, respectively. Applying heat pumps integrated with renewable energy sources such as solar or geothermal is another technique for reducing emission and energy consumption. For instance, Kim et al. [6] found that utilizing a geothermal heat pump with thermal storage unit can lead to energy savings of around 77% for heating and approximately 20% in cooling compared with the conventional system. In another work [7], it was noticed that for their case study, Chinese cold region, employing geothermal heat pump utilizing spiral coil energy piles just consume 51%–62% of a conventional system based on the boiler. There are other techniques such as using laminated glasses with some special features that can cause energy savings and a decrease in emission of CO2 [8].
Due to the dependency of emission on energy consumption and the shares of various energy types, it could be possible to predict CO2 emission by using appropriate inputs such as consumption of energy sources. Owing to the high performance of intelligent techniques in modeling complex systems [9], it is possible to apply these techniques to environmental problems. For instance, Birjandi et al. [10] applied Artificial Neural Network (ANN) to estimate the CO2 emission of some countries in Southeast Asia and found the performance significant. Rezaei et al. [11] used Group Method of Data Handling (GMDH) for emission estimation of countries in Nordic countries and observed that the exactness is pinpointed. Ghalandari et al. [12] employed an intelligent technique for predicting CO2 emission in some European countries and obtained considerable accuracy with an R2 of 0.9999. Ali et al. [13] proposed a predictive model for the CO2 emission of some countries located in Southeast Europe and obtained an accurate output with an R2 of around 0.999. Based on the mentioned findings, it is concludable that these techniques can model CO2 emission in the residential sector. Ahmadi et al. [14] used GMDH to estimate the CO2 emission of some countries in the Middle East by considering energy-related factors and GDP and reached R2 of 0.9998. In another research, Ghazvini et al. [15] applied an intelligent technique based on support vector machine to model CO2 emission in G8 countries. They found that using an optimization algorithm to minimize the error affects the exactness of the predicted values. Jena et al. [16] used multilayer ANN to forecast CO2 emission of 17 countries that had a key role in the worldwide emission and observed an average of 96% forecasting accuracy, which was much more than the previous models.
Regarding the possibility of modeling complex problems using intelligent techniques, utilization of these methods can be extended to different fields of science, such as the environment. In this regard, this article focuses on the estimation of CO2 emission in three countries, including Indonesia, Vietnam, and Thailand, by considering the energy-related factors for the first time. Using the proposed models, CO2 emission can be forecasted in the future by considering different scenarios. In the first step, some of the key features of the energy-related parameters in these countries are represented and discussed. Afterward, GMDH is explained as one of the most applied methods in modeling CO2 emission. Finally, the CO2 emission of these countries are estimated by making use of GMDH and the estimated data are evaluated by utilizing some statistical criteria.
As noted in the introduction section, the residential sector is responsible for a significant portion of overall CO2 emission worldwide. The emission of greenhouse gases in this sector significantly depends on the energy consumption and share of each energy source in the total energy consumption. This article considers three cases, including Indonesia, Vietnam, and Thailand, located in Southeast Asia, and some of the most important data on the energy system of these countries, with a focus on the residential sector, are gathered from IEA and represented here [4]. As shown in Fig. 2, the CO2 emission of these countries has increased in recent decades, which can be mainly attributed to the development of industrial activities and economic growth. Between 2000 and 2019, CO2 emission in Indonesia, Vietnam, and Thailand increased from 255 to 583.4 Mt (128.78% increase), 44.2 to 282.3 Mt (538.68% increase), and 153.4 to 251.4 Mt (63.88% increase), respectively, while CO2 emission of the world in this period increased from 23240.1 to 33621.5 Mt (44.67% increase). In the following paragraphs, some of the key data on these countries’ energy systems and CO2 emission are represented.
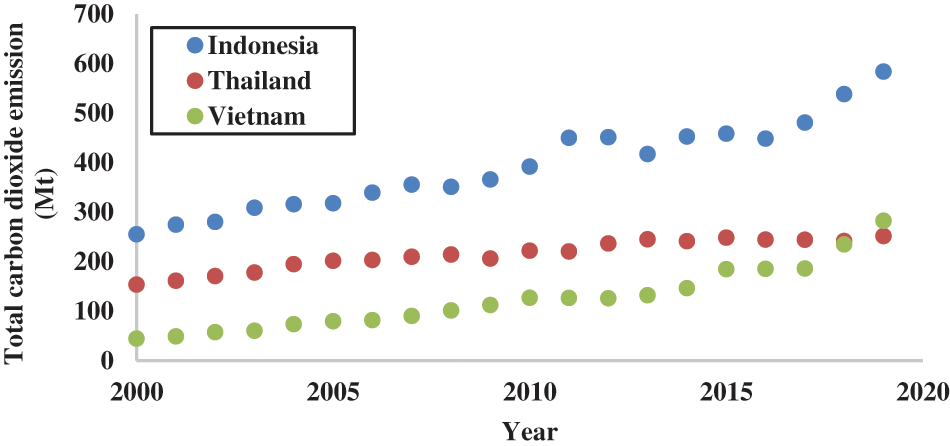
Figure 2: Total CO2 emission of the case studies between 2000 and 2019 [4]
Population in Indonesia had an increasing trend in recent decades that has increased from around 181,413,000 in 1990 to approximately 276,361,000 in 2021 [17] while in his period Gross Domestic Product (GDP) has increased from 106.14 billion USD to 1.19 trillion USD [18]. Increment in these indicators means a higher requirement for energy consumption. Indonesia has the highest production of biofuels in the world and is increasing efforts to exploit the potential of renewable energy. Access to electricity in this country has increased remarkably in recent years, which caused significant increment in the final electricity consumption, more than 821% from 1990 [19]. In Indonesia, the highest value of TFC in 2019 was in the hands of the industry sector, followed by the transport and residential sectors, respectively. Until 2010, the residential sector had the highest share in TFC of this country; however, the industry and transport sectors’ share in TFC has been increased after 2010. CO2 emission in the residential sector of this country was around 148 Mt in 2019, and TFC of this country in this sector was 1331291 TJ in 2019. Residential share in TFC of this country has decreased from 52.6% in 1990 to 19.8% in 2019, while shares of transport and industry have increased in these years. There are some energy-related plans in this country, such as the extension of the grid, promotion of off-grid solar systems and micro-hydro in addition to diesel generator and hybrid systems based on the solar system and diesel [19].
Population in Vietnam has increased from around 67,988,000 in 1990 to more than 98,168,000 in 2021 [17], while GDP has increased from 6.47 billion USD to 362.64billion USD in the mentioned period [18]. In Vietnam, the capacity of non-hydro renewable energy has been increased, and it is planned to reach 21% of total installed capacity in 2030 and reduce the share of coal-fired capacity from 52% to 43%. The government of Vietnam has started systematic policies in order to promote renewable energies since early 2000s, and this country became the 1st major East Asia developing economy that ceased the development of nuclear power plants in 2017 [20]. It is targeted to increase the share of renewable in the total primary energy supply to 15%–20% in 2030 and 25%–30% in 2050 [21]. Since 1990, the final electricity consumption of Vietnam has increased by more than 3350%, and the emission of CO2 has increased by more than 1500% [22]. The highest TFC in 2019 was owned by industry which was followed by the transport and residential sectors, respectively. Before 2008, this country’s highest share of TFC belonged to the residential sector. In 2019, CO2 emission and TFC~of~Vietnam in the residential sector were 42 Mt and 314161 TJ, respectively. Residential share in TFC of Vietnam was 59% in 1990 while it was decreased to 12.2% in 2019. In this period, industry share of this country increased from 28.5% to 53.6% [22].
In Thailand, the population has increased from about 56, 558,000 in 1990 to more than 69,950,000 in 2021 [17], and this country’s GDP has increased from 85.34 billion USD to 505.98 billion USD in the same period [18]. Thailand’s energy policy focuses on decreasing dependency on natural gas~to~improve energy security. In addition, according to the policy made in this country, it is planned to decrease energy intensity by 30% by 2036 compared with the level of 2010; furthermore, it is targeted to reach net zero emissions of greenhouse gases in 2050 by considering technology transfer/cooperation and financing availability [21]. Compared with the other countries considered here, final electricity consumption had lower growth from 1990 by the value of around 400%. Increment in CO2 emission of this country was approximately 210% from 1990 [23]. The industry owned the highest TFC value in 2019 in Thailand, followed by transport, non-energy use, and residential sectors, respectively. CO2 emission and TFC of the residential sector for Thailand in 2019 were 4 Mt and 398259 TJ, respectively. Residential share in TFC of Thailand was 26% in 1990, while it decreased to 9.3% in 2019 [23]. In Figs. 3 and 4, CO2 emission and TFC of these countries between 2000 and 2019 are illustrated, respectively.
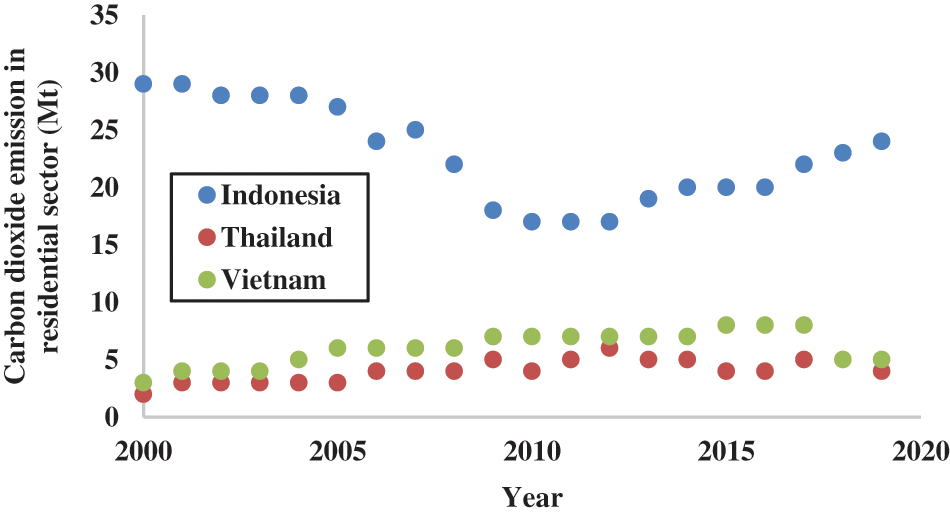
Figure 3: Carbon dioxide emission in residential sector of the countries between 2000 and 2019 [4]
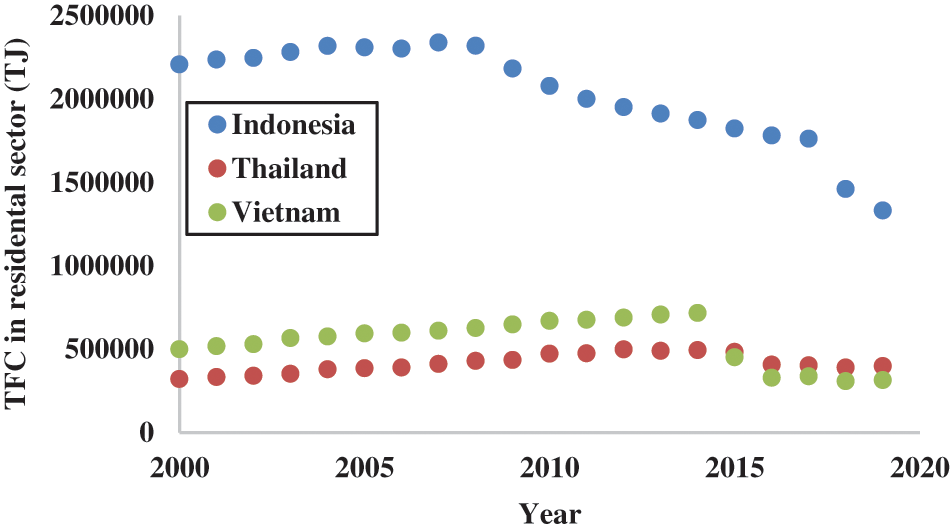
Figure 4: TFC in residential sector of the countries between 2000 and 2019 [4]
Due to the complexity of systems, mathematical correlations are not selected for modeling the systems and material features. Although they are so popular for modeling and possess advantages such as plain structure and usefulness, they cannot be applied to complicated systems. As, they lack the capability of taking the interrelation of determining variables of outputs into account. Thus, regarding the modeling of systems in which the complexity of input relationships is high, ANNs are viewed as appropriate intelligent procedures. Multilayer Perceptron (MLP) ANN is one of the conventional intelligent techniques used for regression and modeling. This type of ANN consists of three main layers: input, hidden, and output. It should be noted that only one or more layers can be applied in the network hidden layer. The layers of the network contain some neurons. The number of inputs and outputs determines the quantities of the neurons in these two layers, while there is no definite rule for the optimal number of neurons in the hidden layer. In the modeling procedure by using MLP, each neuron of a layer is passed into the subsequent layer’s neurons, and this regulation is applied to all of the layers except the layer that is considered as input. Each neuron has its own summing and activation functions. The weight factor is initially multiplied by the inputs, and the determined values are summed together. Subsequently, the summing function is used as the input of the activation function [24]. In the present article, we make use of the radial basis function as the activation function. To find the optimal architecture, different numbers of neurons in the range of 4–10 in this work are taken into account, and normalized MSE is used as the criterion for the selection of the best network.
GMDH is another technique used here for modeling. Generally, facing complicated systems comprising a set of data with several inputs and only one output, VKG (Voltera Kolmogorov Gabor) polynomials (Eq. (1)) can be applied in the modeling process [25,26].
With reference to Eq. (1),
Regarding Eq. (2), the unfamiliar parameters in GMDH algorithm are ratios of the polynomial. As Eq. (2) reveals, computing the output
Applying the partial derivative of Eq. (3) contributes to finding the minimum of the error. A system of linear equations
The approach taken to find an answer for the system of linear equations (
Based on Eq. (5),
Designing the GMDH Neural Network aims to prevent network divergence and create an association between the architecture and shape of the network and one or some numerical parameters so that they go through the same and reciprocal changes. Specific capabilities of evolution approaches like genetic algorithm have made them largely applicable in various phases of the neural network design process. Indeed, among all the capabilities of these methods, being able to find the optimal quantities and the eventuality of investigation in unpredictable spaces gives them this vast application.
In this study, the neural network and its coefficients are obtained by using GMDH Shell Software. For extensively identifying the GMDH Neural Networks, there should be no restriction on using contiguous layer for building the next level. The mentioned type of neural networks known as GS makes use of all the previous layers and the input layer as well [25–27].
In the current paper, the evaluation of the regressions was conducted through using various criteria, including the R-squared, Relative Deviation (RD), Normalized Mean Square Error (MSE), and Average Absolute Relative Deviation (AARD) being determined as:
where actual and predicted superscripts refer to the actual value and corresponding predicted ones, respectively.
To estimate CO2 emission of the considered countries, Indonesia, Thailand and Vietnam, available data between 2000 and 2019 are used. Model inputs for the estimation are electricity consumption, oil products, coal, and natural gas in the residential sector. For network training, 70% of gathered data are used, and the others are applied for the test. It should be noted that the data are divided into these two groups randomly in order to prevent any bias. In the case of making use of MLP, to find the optimal state, the number of neurons is varied and compared based on NMSE. As provided in Table 1, the network with six neurons in the hidden layer is the one with the maximum exactness. In Fig. 5, the estimated data by the obtained models are provided. It is noticeable that estimated values are very close to the actual ones for both models, optimal MLP and GMDH, revealing pinpoint exactness of the regression and its reliability in prediction. The R2 value is one of the main criteria used for the assessment of model exactness, and a closer value to 1 indicates higher accuracy. R2 of training, test and overall datasets for MLP and GMDH are 0.9985 & 0.9995 & 0.9987 and 0.9984 & 0.9989 & 0.9985, respectively.
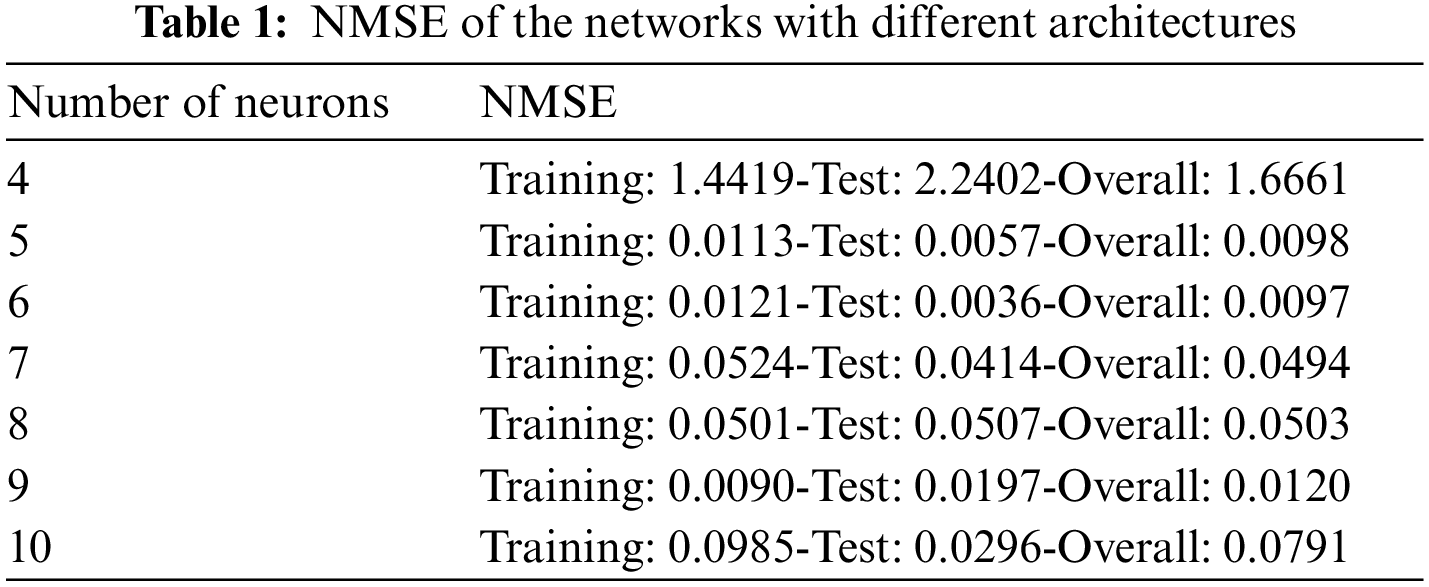
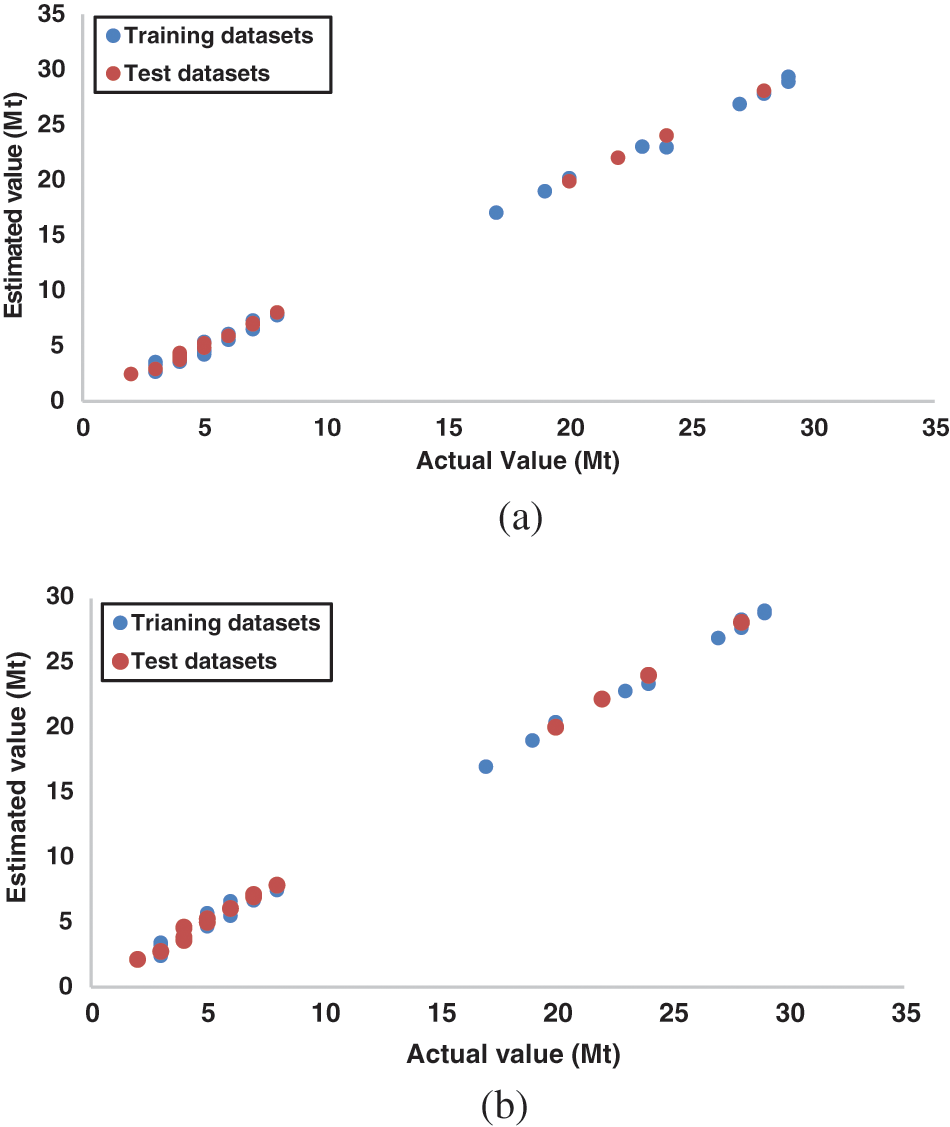
Figure 5: Estimated value vs. actual data for a) MLP and b) GMDH
Besides R2, there are some other criteria for the assessment of the model and its performance. In this regard, Relative Deviation (RD) is applied as another criterion. In Fig. 6, RD vs. actual values are shown. The highest values of the RD are approximately 17.6% and 20% for the MLP and GMDH, respectively, while most of them are in the range of
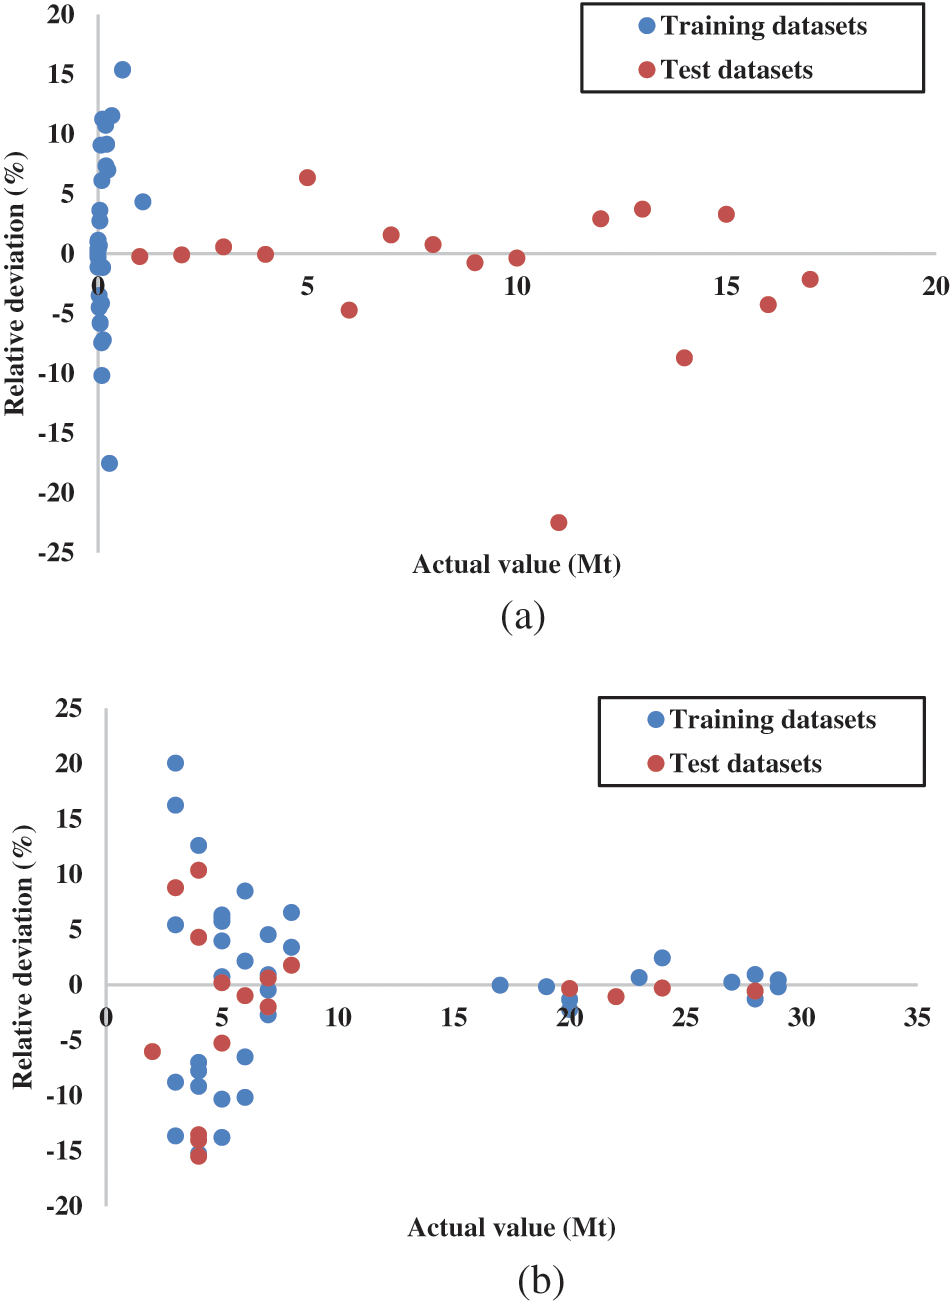
Figure 6: RD vs. actual value of CO2 emission of the countries for a) MLP and b) GMDH
The last criterion employed for the evaluation of the model in the estimation of CO2 emission in the residential sector of the countries is NRMSE. Determined values of NRMSE for the training, test, and overall datasets of MLP and GMDH are around 0.0121 & 0.0036 & 0.0097 and 0.0124 & 0.0094 & 0.0116, respectively, as shown in Fig. 7. Since the lower value of this parameter, closer to zero, means more perfectness, the obtained values show acceptability of the model in term of accuracy. On the basis of the quantities of the applied criteria for evaluation, it can be noted that the present model is acceptable for estimation of residential sector CO2 emission and can be used for prediction by considering different scenarios based on the consumption of natural gas, oil products, electricity and coal in this sector.
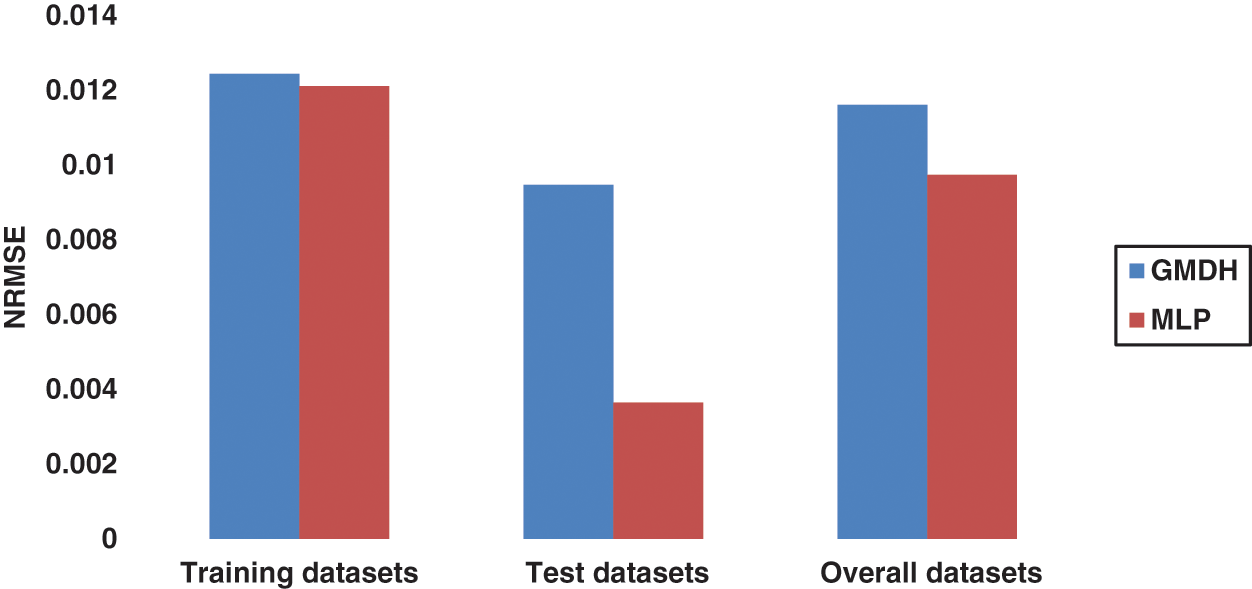
Figure 7: NMSE of different datasets
5 Suggestions for the Future Works
In the previous section, “results and discussion,” the proposed models were investigated and assessed by applying various statistical indexes, including NMSE, RD, AARD, and R2. Although the proposed models have high exactness, their accuracy can be further improved by making use of different optimization algorithms to regulate hyperparameters. In addition, it would be an attainable idea to consider more cases from different regions of the world to reach models with more comprehensiveness. Furthermore, future studies can consider sensitivity analysis in order to find the importance of different variables utilized as the inputs. Moreover, it would be useful to apply other machine learning approaches such as Adaptive Neuro Fuzzy Inference (ANFIS) in the upcoming works and compare the results with the current study. Aside from other approaches and techniques, testing other functions in the structure of the current network can be useful in finding a more accurate model.
The present article focuses on the estimation of CO2 emission in the residential sector of three countries in Southeast Asia, including Indonesia, Vietnam, and Thailand. In this regard, the energy system of these countries, with a focus on the residential sector, was briefly discussed. Literature review on the energy system of the countries revealed that all of them have focused and invested in systems with lower emission of CO2 for the future years, and it is planned to implement policies that would lead to cleaner energy systems. Subsequently, data related to the consumption of oil products, electricity, coal, and natural gas in the residential sector were gathered in different years. Finally, GMDH and MLP were employed to estimate CO2 emission based on the consumption of the mentioned energy sources. Comparison between the actual and estimated CO2 emission in the residential sector demonstrated acceptable accuracy of the models, using MLP and GMDH, with R2 of around 0.9987 and 0.9985, respectively. Furthermore, the AARDs of the models obtained by MLP and GMDH were 4.56% and 5.53%, with a maximum relative deviation of around 17.6% and 20%, respectively. NRMSEs of the present model used for estimation are around 0.0097 and 0.0116 for the models obtained by MLP and GMDH, respectively, which is another evidence of the pinpoint accuracy of the model obtained in this study. Comparing the mentioned statistical indexes demonstrates that using MLP with the optimal architecture can provide prediction with higher accuracy in comparison with GMDH.
Acknowledgement: The authors thank the Ministry of Higher Education Malaysia for the Fundamental Research Grant Scheme (FRGS) awarded for the project (FRGS/1/2020/TK0/UNIMAS/03/4). The authors also acknowledge Universiti Malaysia Sarawak for the financial support of this project.
Funding Statement: This work was funded by the Ministry of Higher Education Malaysia under the Fundamental Research Grant Scheme No. FRGS/1/2020/TK0/UNIMAS/03/4.
Conflicts of Interest: The authors declare that they have no conflicts of interest to report regarding the present study.
References
1. P. R. Díaz-Herrera, G. Ascanio, A. Romero-Martínez, A. M. Alcaraz-Calderón and A. González-Díaz, “Theoretical comparison between post-combustion carbon capture technology and the use of blue and green H2 in existing natural gas combined cycles as CO2 mitigation strategies: A study under the context of Mexican clean energy regulation,” International Journal of Hydrogen Energy, vol. 46, no. 2, pp. 2729–2754, 2021. [Google Scholar]
2. K. Yoshida, H. B. Rijal, K. Bohgaki, A. Mikami and H. Abe, “Energy-saving and CO2-emissions-reduction potential of a fuel cell cogeneration system for condominiums based on a field survey,” Energies, vol. 14, no. 20, pp. 6611, 2021. [Google Scholar]
3. K. Almutairi, M. Alhuyi Nazari, M. Salem, M. M. Rashidi, M. El Haj Assad et al., “A review on applications of solar energy for preheating in power plants,” Alexandria Engineering Journal, vol. 61, no. 7, pp. 5283–5294, 2022. [Google Scholar]
4. IEA (2019“Data and statistics,” International Energy Agency, 2019. [Online]. Available online at: https://www.iea.org/data-and-statistics/. [Google Scholar]
5. A. A. A. A. Al-Rashed, A. A. Alnaqi and J. Alsarraf, “Energy-saving of building envelope using passive PCM technique: A case study of Kuwait city climate conditions,” Sustainable Energy Technologies and Assessments, vol. 46, pp. 101254, 2021. [Google Scholar]
6. M. J. Kim, B. M. Seo, J. M. Lee, J. M. Choi and K. H. Lee, “Operational behavior characteristics and energy saving potential of vertical closed loop ground source heat pump system combined with storage tank in an office building,” Energy and Buildings, vol. 179, pp. 239–252, 2018. [Google Scholar]
7. T. You and H. Yang, “Feasibility of ground source heat pump using spiral coil energy piles with seepage for hotels in cold regions,” Energy Conversion and Management, vol. 205, pp. 112466, 2020. [Google Scholar]
8. V. R. Maduru and S. Shaik, “Laminated glazing for buildings: Energy saving, natural daylighting, and CO2 emission mitigation prospective,” Environmental Science and Pollution Research, vol. 29, no. 10, pp. 14299–14315, 2021. [Google Scholar]
9. M. M. Rashidi, M. Alhuyi Nazari, I. Mahariq, M. E. H. Assad, M. E. Ali et al., “Thermophysical properties of hybrid nanofluids and the proposed models: An updated comprehensive study,” Nanomaterials, vol. 11, no. 11, pp. 3084, 2021. [Google Scholar]
10. A. Komeili Birjandi, M. Fahim Alavi, M. Salem, M. E. H. Assad and N. Prabaharan, “Modeling carbon dioxide emission of countries in southeast of Asia by applying artificial neural network,” International Journal of Low-Carbon Technologies, vol. 17, pp. 321–326, 2022. [Google Scholar]
11. M. H. Rezaei, M. Sadeghzadeh, M. Alhuyi Nazari, M. H. Ahmadi and F. R. Astaraei, “Applying GMDH artificial neural network in modeling CO2 emissions in four nordic countries,” International Journal of Low-Carbon Technologies, vol. 13, no. 3, pp. 266–271, 2018. [Google Scholar]
12. M. Ghalandari, H. Forootan Fard, A. Komeili Birjandi and I. Mahariq, “Energy-related carbon dioxide emission forecasting of four European countries by employing data-driven methods,” Journal of Thermal Analysis and Calorimetry, vol. 144, no. 5, pp. 1999–2008, 2020. [Google Scholar]
13. N. Ali, M. E. H. Assad, H. F. Fard, B. A. Jourdehi, I. Mahariq et al., “CO2 emission modeling of countries in southeast of Europe by using artificial neural network,” in Proc. SPIE 12120, Sensing for Agriculture and Food Quality and Safety XIV, SPIE Defense + Commercial Sensing, 2022, Orlando, Florida, United States. vol. 12120, pp. 121200, 2022. [Google Scholar]
14. M. H. Ahmadi, H. Jashnani, K. W. Chau, R. Kumar and M. A. Rosen, “Carbon dioxide emissions prediction of five Middle Eastern countries using artificial neural networks,” Energy Sources, Part A: Recovery, Utilization and Environmental Effects, vol. 41, pp. 1–13, 2019. [Google Scholar]
15. M. Ghazvini, M. D. Madvar, M. H. Ahmadi, M. H. Rezaei, M. El Haj Assad et al., “Technological assessment and modeling of energy-related CO2 emissions for the G8 countries by using hybrid IWO algorithm based on SVM,” Energy Science & Engineering, vol. 8, no. 4, pp. 1285–1308, 2020. [Google Scholar]
16. P. R. Jena, S. Managi and B. Majhi, “Forecasting the CO2 emissions at the global level: A multilayer artificial neural network modelling,” Energies, vol. 14, no. 19, pp. 6336, 2021. [Google Scholar]
17. World Bank, “Population, total,” WorldBank, 2022. [Online]. Available online at: https://data.worldbank.org/indicator/SP.POP.TOTL. [Google Scholar]
18. World Bank, “GDP (current US$),” WorldBank, 2022. [Online]. Available online at: https://data.worldbank.org/indicator/NY.GDP.MKTP.CD. [Google Scholar]
19. IEA (2019“Indonesia.” International Energy Agency, 2019. [Online]. Available online at: https://www.iea.org/countries/indonesia. [Google Scholar]
20. N. H. Nguyen, B. Van Doan, H. Van Bui and Q. Le Luu, “Renewable energy policy in Vietnam,” In New Challenges and Solutions for Renewable Energy: Japan, East Asia and Northern Europe; Midford, P., Moe, E., Eds.; Springer International Publishing: Cham, Switzerland, 2021; pp. 247–277. [Google Scholar]
21. IEA (2022“Southeast Asia energy outlook 2022,” International Energy Agency, 2022. [Online]. Available online at: https://www.iea.org/reports/southeast-asia-energy-outlook-2022. [Google Scholar]
22. IEA (2019“Viet Nam.” International Energy Agency, 2019. [Online]. Available online at: https://www.iea.org/countries/viet-nam. [Google Scholar]
23. IEA (2019“Thailand,” International Energy Agency, 2019. [Online]. Available online at: https://www.iea.org/countries/thailand. [Google Scholar]
24. M. Kahani, M. H. Ahmadi, A. Tatar and M. Sadeghzadeh, “Development of multilayer perceptron artificial neural network (MLP-ANN) and least square support vector machine (LSSVM) models to predict nusselt number and pressure drop of TiO2/water nanofluid flows through non-straight pathways,” Numerical Heat Transfer; Part A: Applications, vol. 74, no. 4, pp. 1190–1206, 2018. [Google Scholar]
25. M. Zoqi, M. Ghamgosar, M. Ganji and S. Fallahi, “Application of GMDH and genetic algorithm in fraction in biogas from landfill modeling,” Journal of Environmental Science and Technology, vol. 18, no. 3, pp. 1–12, 2016. [Google Scholar]
26. A. Komeilibirjandi, A. H. Raffiee, A. Maleki, M. Alhuyi Nazari and M. Safdari Shadloo, “Thermal conductivity prediction of nanofluids containing CuO nanoparticles by using correlation and artificial neural network,” Journal of Thermal Analysis and Calorimetry, vol. 139, no. 4, pp. 2679–2689, 2020. [Google Scholar]
27. M. H. Ahmadi, M. A. Ahmadi, M. Mehrpooya and M. A. Rosen, “Using GMDH neural networks to model the power and torque of a stirling engine,” Sustainability (Switzerland), vol. 7, no. 2, pp. 2243–2255, 2015. [Google Scholar]
Cite This Article
 Copyright © 2023 The Author(s). Published by Tech Science Press.
This work is licensed under a Creative Commons Attribution 4.0 International License , which permits unrestricted use, distribution, and reproduction in any medium, provided the original work is properly cited.
 Downloads
 Citation Tools