
 Submit a Paper
 Propose a Special lssue
 Open Access
ARTICLE

A Metaheuristic Technique for Cluster-Based Feature Selection of DNA Methylation Data for Cancer
1 Centre for Artificial Intelligence & Robotics, Malaysia-Japan International Institute of Technology, Universiti Teknologi Malaysia, Kuala Lumpur, 54100, Malaysia
2 Department of Computer Engineering, Arab Academy for Science, Technology and Maritime Transport, Cairo, 2033, Egypt
3 Department of Mechanical Precision Engineering, Malaysia-Japan International Institute of Technology, Universiti Teknologi Malaysia, Kuala Lumpur, 54100, Malaysia
* Corresponding Author: Noureldin Eissa. Email:
Computers, Materials & Continua 2023, 74(2), 2817-2838. https://doi.org/10.32604/cmc.2023.033632
Received 23 June 2022; Accepted 01 August 2022; Issue published 31 October 2022
 View Full Text
 Download PDF
Abstract
Epigenetics is the study of phenotypic variations that do not alter DNA sequences. Cancer epigenetics has grown rapidly over the past few years as epigenetic alterations exist in all human cancers. One of these alterations is DNA methylation; an epigenetic process that regulates gene expression and often occurs at tumor suppressor gene loci in cancer. Therefore, studying this methylation process may shed light on different gene functions that cannot otherwise be interpreted using the changes that occur in DNA sequences. Currently, microarray technologies; such as Illumina Infinium BeadChip assays; are used to study DNA methylation at an extremely large number of varying loci. At each DNA methylation site, a beta value (β) is used to reflect the methylation intensity. Therefore, clustering this data from various types of cancers may lead to the discovery of large partitions that can help objectively classify different types of cancers as well as identify the relevant loci without user bias. This study proposed a Nested Big Data Clustering Genetic Algorithm (NBDC-GA); a novel evolutionary metaheuristic technique that can perform cluster-based feature selection based on the DNA methylation sites. The efficacy of the NBDC-GA was tested using real-world data sets retrieved from The Cancer Genome Atlas (TCGA); a cancer genomics program created by the National Cancer Institute (NCI) and the National Human Genome Research Institute. The performance of the NBDC-GA was then compared with that of a recently developed metaheuristic Immuno-Genetic Algorithm (IGA) that was tested using the same data sets. The NBDC-GA outperformed the IGA in terms of convergence performance. Furthermore, the NBDC-GA produced a more robust clustering configuration while simultaneously decreasing the dimensionality of features to a maximum of 67% and of 94.5% for individual cancer type and collective cancer, respectively. The proposed NBDC-GA was also able to identify two chromosomes with highly contrasting DNA methylations activities that were previously linked to cancer.Keywords
Non-communicable diseases (NCDs) are ailments that cannot be transmitted directly from one individual to another; such as cancer, stroke, and diabetes. Although these diseases are currently the leading cause of death worldwide [1], cancer is expected to top this list in the near future. Even though early diagnosis is key to better cancer prognosis and survival, this still proves challenging as some of the most lethal forms of cancer do not exhibit clinical symptoms due to the non-specific nature of the disease. Furthermore, as cancer can mimic other non-malignant diseases [2–4], it renders traditional methods of differential diagnosis costly and challenging. Cancer death rates are swiftly increasing worldwide. In 2015, the World Health Organization (WHO) concluded that cancer was the leading cause of death among people aged under 70 in 91 countries. Globally, one out of five men and one out of six women will develop cancer during their lifetime while one out of eight men and one out of eleven women will die from it.
Cancer is also increasing the burden on countries over the world. This can be attributed to many factors, of which population growth and aging are most prominent. This is especially evident in countries that are experiencing rapid socio-economic growth as there is a clear transition from cancer caused by poverty-related conditions to cancer related to the modern lifestyle of industrialized countries. More than half of the combined cancer deaths among both men and women are estimated to occur in Asia as its population accounts for 60% of the whole world.
1.2 Significance of DNA Methylation
The significant increase in cancer-related mortality worldwide warrants the identification of precise and accurate biomarkers that can be used to ameliorate and refine the diagnosis process. Epigenetics is the study of phenotypic changes that do not alter DNA sequences. This means that phenotypic variations can change the activity of a DNA segment without changing its sequence. Therefore, it can be used to study various gene functions that cannot be interpreted using traditional changes in DNA sequences. The field of cancer epigenetics has grown rapidly over the past few years as epigenetic alterations are known to exist in all types of human cancers [5]. One of these alterations is DNA methylation; an epigenetic process that regulates gene expression by employing DNA methylation binding proteins (MBDs) or transcription factors (TFs), which are involved in gene repression [6,7]. In general, DNA methylation occurs in two of the four bases of DNA; cytosine and adenine. However, in mammals, DNA methylation predominantly occurs in what is known as CpG dinucleotides, where a cytosine nucleotide is followed by a guanine nucleotide. These CpG sites exist in genomic regions known as CpG islands. To date, researchers still face a challenge clustering and analyzing these methylation data due to their sheer size. For instance, the human genome assembly under the auspices of the Human Genome Project (HGP) currently possesses about 30 × 106 CpG dinucleotides that can exist in either an unmethylated or methylated state. Therefore, the number of possible methylation arrangements is huge. Although the wealth of knowledge that can be extracted from the genome can vastly enrich our understanding, its infinite possibilities make statistical analysis more difficult and complicated [8,9]. Therefore, the proposed solution for this problem relies on machine learning; a form of analysis that automates the building of analytical models; as it has already displayed unparalleled performance in problem solving applications ranging from academia to industry [10].
Machine learning generally relies on two types of techniques: (1) supervised learning, in which the system is trained using a labelled set of input data before the algorithm predicts the output from the input data, and (2) unsupervised learning, in which the system makes use of hidden patterns in unlabeled inputs. As such, the inputs and outputs are unknown in the unsupervised technique. One of the most popular uses of unsupervised machine learning is clustering, in which related objects are grouped together to reveal similar structures in the unlabeled data. It is one of the most important dynamic data mining techniques and is used in many applications.
Most clustering algorithms are designed to evaluate certain mathematical correlations for features within a data set to ensure that the features contained in the same cluster are distinct from those contained in other clusters.
Another major challenge is the rapid growth of the number and size of available data sets. These enormous data sets are now available due to the utilization of newer technologies; such as Illumina Infinium BeadChip assays [11], that provide extremely high throughput at relatively cheap prices and can be used multiple times for different patients. Therefore, the availability of such huge amounts of raw data poses a problem for traditional methods of data mining and analysis [12].
The aim of this research is (1) to present a metaheuristic technique (NBDC-GA) that can perform simultaneous feature selection and clustering of very big data sets using a metaheuristic approach where the number of clusters does not need to be specified a priori, and (2) introduce a new crossover operator/fitness function combination that can help the genetic algorithm achieve a better separation for the clustering configurations.
The rest of this paper is organized as follows. Section 2 presents the problem statement. A literature review of clustering and feature selection using metaheuristic algorithms is provided in Section 3. In Section 4, the proposed NBDC-GA is demonstrated. The experimental results of the tests conducted are highlighted and discussed in Section 5. Finally, the conclusion is stated in Section 6.
As previously mentioned, a measurable value, known as the beta value (β), is used to reflect methylation intensity at different loci for each DNA methylation site [13]. This value is usually generated by the aforementioned Illumina BeadChip assays and is calculated as follows:
where Mn is the methylated allele intensity and Un is the unmethylated allele intensity, both at location n.
As the data set was expected to be very big and as not all the data might be valuable to our research, feature selection was implemented to alleviate the complexity of the calculations and select only features that were relevant to our objective. Furthermore, examining the effect of CpG methylation on gene expression is challenging due to technical limitations as well as an incomplete biological understanding of the process [14]. As such, the degree of correlations differs significantly between studies. Also, determining the ideal number of clusters is crucial and many of traditional clustering techniques; such as k-means; require this parameter to be specified in advance.
To reiterate the problem statement, it is evident that the prevalence of huge data sets brings to naught the application of traditional data clustering and feature selection algorithms and proves them to be inefficient. Therefore, it is crucial to develop an accurate clustering algorithm that is capable of handling enormous amounts of data without a predetermined number of clusters.
Over the years, many researchers have favored the use of metaheuristic techniques in clustering as they are better suited for solving non-convex clustering problems than other clustering techniques; such as k-means algorithms [15].
To that end, Gajawada et al. [16] proposed an optimal clustering genetic algorithm (OCGA) with which to identify the optimal number of clusters. The OCGA managed to determine a suitable number of clusters using a relatively smaller number of iterations than previous algorithms. However, the OCGA relied on only a single validity measure; i.e., Dunn’s function; to test the optimum number of clusters. Furthermore, the two data sets used to test the algorithm were very small, each consisting of only 955 and 1686 points. The algorithm was also unable to identify the optimum clustering configuration for the second case as it provided a smaller number of clusters (5) instead of the actual number of clusters (15). Moreover, the study did not to use statistical methods; such as confidence interval; which was important as the results were based on the average output of multiple runs.
Chowdhury et al. [17] suggested a heuristic ant colony-based technique that could detect the number of clusters in different shapes. Thus, neither the number of clusters nor their structure needed to be specified a priori. However, the performance of this algorithm depended heavily on the size of the data set and proved to be counterproductive for extremely big data sets. Therefore, the authors recommended that the pheromone parameter (of the ant colony) required further enhancement.
Oh et al. [18] used unsupervised clustering techniques to analyze the microDNA array gene expression data of 177 patients with colorectal cancer to determine a gene expression signature that could differentiate between patients with good prognoses post-treatment and those who did not. The study successfully isolated a gene signature that was associated with overall survival. All the statistical analyses were performed using the R language environment.
Ren et al. [19] aimed to discover subtypes of colon cancer using unique biological characteristics to isolate a set of novel biomarkers that could be used to reflect the clinical or biological characteristics of each cancer subtype. The k-nearest neighbors (KNN) algorithm was used to perform clustering analysis while individual analyses were conducted to uncover subtypes at two different molecular levels using 153 colon cancer samples retrieved from The Cancer Genome Atlas (TCGA) data portal.
Celli et al. [20] proposed the BIGBIOCL algorithm that applies supervised classification to relatively large data sets. The algorithm was tested on real-life data retrieved from the TCGA database. The authors recommended that the supervised classification model required further enhancement to avoid loose information as it built its classification model based on 70% of the input and reserved 30% of the data for testing. However, to increase precision, the model could be readjusted to build a classification model using 100% of the input with further validation of the results.
Singh et al. [21] provided a brief review of the importance of feature selection in improving the classification accuracy of gene expression data. The study concluded that each “feature selection algorithm reacts differently, therefore, using a single technique across multiple data sets is infeasible”.
Baur et al. [22] designed a new feature selection algorithm based on sequential feature selection (SFS). The algorithm used various classification techniques; such as support vector machine (SVM) learning models, the k-nearest neighbors (KNN) algorithm, decision trees (DTs), and naïve Bayes (NB) classifiers; to select DNA methylation probes that were most significant for gene expression. The KNN (K = 1, 1NN) algorithm performed best as it yielded the most consistent results. The results also showed that genes that are highly susceptible to the DNA methylation process are actually “enriched for Gene Ontology terms” related to different biological processes.
As it has become increasingly apparent that DNA methylation data could predict the recurrence of lymph node (LN) cancer before clinical symptoms appear, Wu et al. [23] suggested a feature selection technique that used clinical DNA methylation data to identify biomarkers for lymph node (LN) metastasis. Their technique used a 3-steps feature selection method that exploited the different clinical properties of the methylation data. It consisted of feature selection with differential methylation region (DMR), feature selection with minimum-redundancy maximum-relevance (mRMR), and feature selection with a genetic algorithm. The three-step feature selection technique was found to significantly improve prediction performance.
Liu et al. [24] used two feature extraction techniques; i.e., optimal mean-based block robust feature extraction (OMBRFE) and optimal mean based robust feature extraction (OMRFE); to identify the feature genes of advanced colorectal cancer. The OMRFE technique performed better on integrated data than older conventional methods. A block ideology was then introduced into the OMRFE technique. Different regularization parameters were used on different genomic feature data in the colorectal cancer integrated data. The OMBRFE technique was found to be more effective than previous feature extraction methods, as well as OMRFE, at identifying feature genes on colorectal cancer integrated data. The authors also emphasized that conventional feature extraction method that are usually effective at processing gene expression data; such as penalized matrix decomposition (PMD), robust principal component analysis (RPCA), or even the OMRFE; cannot be applied to certain data sets, such as those provided by The Cancer Genome Atlas (TCGA). This is because as multiple features are grouped together into one data set, conventional feature extraction methods fall short as they are designed to process a single type of genomic feature. Therefore, novel methods that can deal with such data sets need to be studied and uncovered.
Active learning is a form of supervised machine learning techniques that can decrease the number of samples required to train the classification model, as it can select the data it learns from. This technique is promising for bioinformatics research where classified samples are usually expensive to acquire and require a lot of time and resources. In this regard, Sun et al. [25,26] proposed an active learner with lexicalized dependency path (LDP) to provide more control over the extraction model by the developer. They tested their LDP model on both simulated, and real active learning. The results have shown that the real active learning experiments of LDPs outperformed the simulated experiments by 2%. The proposed system has proven the benefits of collaborative involvement of the developer in the extraction model.
Although the aforementioned studies shed light on the process of (meta) heuristic clustering and classification and while most of them generated good results, they mainly suffered from complexity and performance issues when dealing with extremely big data sets, which is the case with epigenetic data sets, such as DNA methylation microarrays. Moreover, the literature lacks a unified method that can simultaneously extract relevant features and perform clustering. It is also evident that the software and tools used to execute a technique are of the utmost, if not as, important as the methodology itself. Therefore, the scalability of the application software and its ability to handle and process data sets is very crucial. Additionally, most studies on clustering and classification of DNA methylation data required that the number of clusters be determined a priori. They also either relied mainly on clusters calculated by previous studies or implemented supervised classification according to the labels found in some of the data sets; such as the chromosome number or the genomic coordinates.
4.1 Relevance of the Metaheuristic NBDC-GA Technique
The metaheuristic NBDC-GA proposed in this paper uses an evolutionary learning technique that simultaneously performs feature selection to decrease the data dimensionality as well as clustering to find hidden patterns of meaningful information based on the beta value (β) at the different DNA methylation CpG loci. Evolutionary learning techniques are search-based algorithms used to solve optimization problems in the field of machine learning. As previously mentioned, the biological process of CpG methylation is not completely understood. Therefore, a metaheuristic technique is a suitable option to solve this problem due to its superb global searchability.
4.2 System Architecture and Description
An evolutionary metaheuristic system based on a genetic algorithm (GA) [27] was proposed, in which two genetic algorithms (GAs) worked together to extract features and cluster data. The logical arrangement of these two GA(s) was a nested hierarchy, where the objective function of the inner-layer GA fed the outer GA layer. This way, as one of the GAs conducts unsupervised clustering by exploiting the mathematical resemblance and elemental structure of the data, the other GA serves as a feature extraction/selection layer. In the clustering GA, the size of the chromosome depends on the number of samples in the data set. Initially, the chromosome is divided into a random collection of logical clusters with random sizes. During the evolution of the GA, the clusters are expected to converge to optimum partitions. As each single chromosome represents all entries in the data set, the genes will consist of integer numbers that correspond to each patient’s entry in the data set. The actual features corresponding to each patient will be retrieved and used during the calculations. As for the feature selection GA, the size of the chromosome is determined by the number of features in the given data set (e.g., CpG methylation sites). As the chromosome consists of binary values, features that are selected will be assigned ‘1’ and passed on to the clustering GA while features that are not selected will be assigned ‘0’. Two layering solutions were initially considered for the GAs. In the first solution, the clustering GA is assigned as the outer-layer. Each chromosome is initialized with random clusters carrying the whole data set, including all the existing features. A whole generation of the feature selection GA (inner-layer) is forked for each chromosome which will, in turn, modify the features of the already clustered data by either adding or removing them before the fitness is then re-evaluated. Fig. 1 illustrates a system where the outer-layer is the clustering GA.

Figure 1: First option: outer-layer performs clustering and the inner-layer performs feature selection
The system consisted of mock chromosomes containing random clusters with random sizes and a mock data set of 10 patients and eight features. These mock values were used to demonstrate the proposed architecture on a smaller scale. The fitness value of each chromosome was calculated without any feature selection in order to minimize differences within the same cluster and maximize differences between other clusters. In the illustrated example, the inner-layer GA, which is responsible for feature selection, excluded features F2, F3, F7, and F8 from patients in clusters found in the first outer chromosome before the fitness value was re-evaluated. The GA continued to converge until the optimum features or max generations were reached. The second layering solution sets the feature selection GA as the outer-layer. Each outer-layer chromosome is initialized with random features, and for each one of these outer chromosomes, a whole run of the inner-layer GA is forked in an attempt to cluster the data based only on the selected features. Fig. 2 illustrates this option, where the outer-layer acts as the feature selection GA. In this system, there were eight mock outer-layer chromosomes that corresponded with the number of features in the data set. Unlike the first solution, only features F1, F4, F5, and F6 were selected from the data and passed on to the inner-layer GA. The GA continued to converge until the optimum features or max generations were reached. Similar in design to the clustering GA suggested in the first solution, the inner-layer holds the clustering GA. The fitness was calculated for each chromosome based on the selected features only. The final fitness value corresponded to the best clustering configuration based on the subset of selected features.

Figure 2: Second option: outer-layer performs feature selection and the inner-layer performs clustering
The second layering solution was selected for the following two reasons. Firstly, clustering data without eliminating any entries is significantly more computationally intensive, especially since the fitness value will need to be recalculated after the features inside the clusters have been modified by the inner-layer GA. This requires a re-evaluation of the objective function to calculate the fitness. Secondly, clustering data without prior feature selection will yield worse results as irrelevant features will be considered noise during the clustering process [28,29].
This nested hierarchy identifies the clustering process as a major part that reflects the feature selection process. A candidate random group of features was first selected and used to cluster the data. The separation of the formed clusters was then evaluated using the proposed fitness function, where a better separation of clusters signifies a better selection of features. For the outer-layer feature selection GA, a standard single-point crossover operator was implemented. A random point on both parent chromosomes was selected using a roulette-wheel operator and the genes to its right were swapped. The mutation operator was non-uniform and relied on both the average and the best fitness of the latest generation to calculate probability. The maximum probability was set to 5% and worked by flipping the bits corresponding to each feature. Elitism was used to transfer the fittest individual to the newer generation in order to maintain the best fitness. The fitness value of the outer-layer GA was not independently evaluated. It was, instead, retrieved and multiplied by the number of features from the inner-layer GA after it had completed its convergence. This was to study the direct effect of the inner-layer GA (clustering) on the feature selection GA and how it impacted the dimensionality of the data. Ward’s hierarchical method, illustrated in Fig. 3, was used to design the fitness function of the inner-layer GA (clustering).

Figure 3: Illustration of ward’s method
This maximized the inter-cluster distance (in-between different clusters) while minimizing the intra-cluster distance (inside the same cluster). This method depends on a variance analysis approach, in which the goal is to generally minimize the variance within clusters. However, a major drawback of Ward’s method is that it tends to break down the clustering configuration into smaller ones. Nevertheless, this can be mitigated by using the proposed mutation operator to merge neighboring clusters.
Therefore, two values; α and γ which represent inter-and intra-cluster distances, respectively; were calculated in order to evaluate the fitness of each chromosome.
where
where
where
As seen above,
where N is the number of clusters inside the cth chromosome and K is the total number of samples. A higher value indicates better fitness for the chromosome, which indicates better clusters separation.
For the crossover, a modified maximal perseverance (MPX) operator; a subtype of the edge recombination family of operators; was used. The MPX operator was originally designed by Mühlenbein et al. for the traveling salesman problem (TSP) [31]. This operator was used to explicitly transfer the edges of the parents to the offspring. Although the offspring produced by this operator always contain all alleles (loci) common to the two parents, they can still generate new edges on their own. Therefore, this operator was used to retain the edges between the clustering groups while still allowing the forging of new local edges.
An MPX operator starts by removing a random substring from one of the two parents (first parent) before removing the remaining items from the first parent from the other second parent. The remaining items from the second parent are then consecutively added to the first parent. This way, many unique offspring can be generated from the same two parents depending on the substring location chosen and its size. As the goal is to maximise the distance between the clusters, the MPX operator first selects the cluster with the shortest distance from the overall centre then calculates a random cut-off index relative to the cluster as well as a random size. This way, the crossover operator completely or partially replaces the chosen cluster and substitutes it with the cluster from the other parent. This was done to the two selected parents and the offspring with the highest fitness was chosen. The crossover probability was set at 30%. Fig. 4 illustrates the operation of the MPX operator.

Figure 4: Illustration of the MPX operator between two parents
In this example, the 3rd cluster was assumed to have the shortest distance and, therefore, chosen. A random index of 2 and a size of 3 were calculated. Therefore, substrings 10, 3, 4 were picked and removed from Parent A. The remaining items (1, 8, 9, 7, 2, 6, 5) were then removed from Parent B before the remaining items were consecutively inserted into Parent A. Elitism was also used with the inner-layer GA. This was extremely important to ensure that only the most fit inner-layer chromosome would attach to its corresponding outer-layer chromosome and to avoid maintain the achieved clustering configuration throughout the outer-layer convergence process. A Roulette-wheel operator was used to select fit individuals. For the mutation, a non-uniform operator similar to what was implemented in the outer-layer GA, was used. However, the mutation operator used with the inner-layer GA worked by either splitting or merging neighboring clusters. The probability of the mutation operator increased with the convergence of the GA and could reach a maximum probability of 10%. This was done to avoid being plunged into a clustering local minimum as the GA converges to its optimal solution.
Fig. 5 shows a pseudo-code for the implementation of the MPX operator. The CalculateCentroid function calculates the centroid of a given chromosome while the Dist function calculates the inter-distance between the given cluster and the given centroid. The IndexOfMin function returns the index of the cluster with the shortest distance and the PerformSwap function calculates the random distance and size then swaps the clusters of the given chromosomes based on the calculated values. Finally, the CalculateFitness function re-evaluates the fitness of the newly produced offspring.

Figure 5: Pseudo-code implementation for the MPX operator
4.3 Software Package Description
This section briefly describes the functionality of the developed application. A software package; MetaMethyLib; was developed to implement the proposed NBDC-GA. The core of the application was written using Microsoft .NET framework and C# programming language. The software package is also capable of retrieving DNA methylation data from The Cancer Genome Atlas (TCGA) server and constructing a unified data set. The application was designed to be modular, with each module handling a specific task; such as GA implementation, graphical user interface (GUI), data exporting, data set building, etc. Fig. 6 depicts the workflow of the developed MetaMethyLib application. As handling big data sets and applying the suggested technique will be very computationally taxing, the application was developed with a compatible parallel-processing architecture that allows each outer-layer chromosome, in each generation, to be converged independently using a logical CPU core to achieve the highest possible performance.

Figure 6: Workflow of the MetaMethyLib software package
This was accomplished with the help of .NET framework Task Parallel Library (TPL). Additionally, to achieve even better performance and to increase the scalability of the developed software as well as its ability to handle larger data sets, a network kernel that allows the GA to evolve over the network was developed. This network kernel allows the GA to distribute the convergence workload over a group of connected network clients (i.e., network daemons). The host manages and dynamically executes the process of starting and terminating these daemons throughout the convergence process. Furthermore, more network daemons can be added or removed from the workload queue at any time during the convergence process. However, these daemons must be deployed on computers participating in the convergence of the proposed system and they must have access to the data set. Otherwise, the host will need to send the data set over the network before the convergence starts, which will result in additional delays. The network daemons will first check the hardware specifications of the client system that they are deployed on and send the information back to the host so it can calculate the workload that each client can handle. After receiving the data from the host, each daemon completes the required calculations and sends the results back to the primary host. The host tracks all the chromosomes sent to the network daemons and maintains an active connection with each of them. If the host detects a disconnection or if the network daemon stops responding, the host will reroute the data to another network daemon or evolve it locally if no free network daemons are found. The architecture of the NBDC-GA enables it to be evolved over the network, where each outer-layer chromosome can be converged independently. The results of each outer generation are then aggregated by the host before traditional GA evolving techniques; such as crossover, mutation, etc.; are executed. Fig. 7 shows a pseudo-code for the operation of the inner-layer GA and Fig. 8 portrays a simplified implementation of the outer-layer GA.

Figure 7: Simplified pseudo-code for the operation of the inner-layer GA

Figure 8: Simplified pseudo-code for the operation of the outer-layer GA
The inner-layer GA was used by the outer-layer GA to evaluate the fitness of each outer-layer chromosome.
5 Experimental Results and Discussion
This section consists of two sub-sections: the first section delves deeper into the description of the data set while the second presents the results and the discussion.
5.1 Description of the Data Set
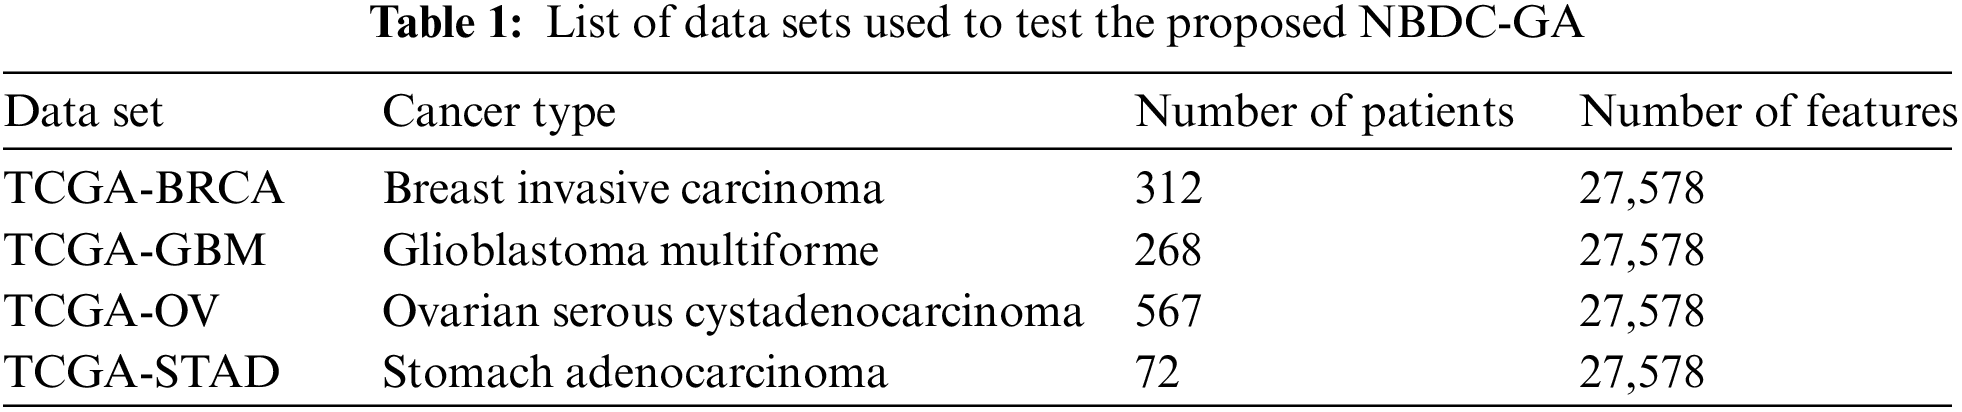
The proposed NBDC-GA was tested using real-world data sets that were constructed using data retrieved from the TCGA portal, currently known as Genomic Data Commons (GDC). As previously mentioned, beta (β) values reflect the level of DNA methylation. As such, the DNA methylation file of each patient included a column containing floating point values that represented the β values and many rows that represented the different CpG locations. These CpG locations acted as the main features for the clustering process. The different types of cancers that were used to test the NBDC-GA are listed in Tab. 1. The metadata files required to download the TCGA samples are attached as supplementary file suppl. 1 (TCGASampleID.zip). The developed MetaMethyLib software processed the raw data sets to deal with some missing methylation values as experimental DNA methylation data usually suffers from data loss. To that end, a simple linear regression method was used because it has been proven reliable for such applications [32]. However, samples with more than 10% missing features were completely rejected. The unified data set for each cancer type was constructed by transposing the column in each patient’s DNA methylation file into rows in the unified data set file. By doing this for all the patients, the unified data set ended up with a huge matrix where the rows corresponded to the different patients and the columns represented the different CpG sites along with any necessary additional features. Additional features; such as ethnicity, age, year of diagnosis, etc.; can be retrieved from the TCGA portal. It is noteworthy that DNA methylation data does not exclusively contain cancer-related information only. Therefore, the unified data set had to include only the DNA methylation data of patients who were confirmed sufferers of the investigated types of cancer. This ensured that the NBDC-GA would able to find similar features across different patients.
The NBDC-GA tested the data set of each cancer type five times before the results were averaged. The outer-layer GA was set to run for 100 generations while the inner-layer GA was set to run for 200 generations per each outer-layer chromosome. As GA is a type of stochastic probabilistic search technique, statistical validity methods were used to validate the precision of the experiments. The algorithm’s performance was also compared with that of the more recent metaheuristic Immuno-Genetic Algorithm (IGA) proposed by Moussa et al. [33]. It was tested the same number of times (five) using the same unified data sets. The number of generations for the IGA was set to 100.
All the experiments were performed on a high-performance computer that had an Intel Cascade Lake processor with 16 vCPU and 64 GB of RAM. This computer acted as the host while eight other computers, each with an Intel i7 9750H processor and 16 GB of RAM; served as network daemon clients that helped with the convergence process. Tab. 2 shows a runtime comparison of the two techniques. Although the IGA finished earlier for all data sets, it only performs clustering and runs for 100 generations only. The NBDC-GA, on the other hand, employs a nested hierarchy that performs both clustering as well as feature selection.

Furthermore, depending on the population size, each full generation consists of hundreds of inner generations. Therefore, the runtime ratio between the overall study time and the individual generation time of the NBDC-GA outperformed the IGA. This can be attributed to the different manners of implementation that both techniques employ, where the IGA does not implement any sort of parallel processing unlike the NBDC-GA. Moreover, the decrease in the number of features throughout the convergence process also helped decrease the overall study time of the NBDC-GA. This will be elaborated further. Fig. 9 compares the convergence results of the NBDC-GA and the IGA.

Figure 9: Comparison of NBDC-GA and IGA convergence for all data sets
Fig. 10 shows the number of clusters produced by the NBDC-GA and the IGA. The vertical green bars in the NBDC-GA graphs denote the error range based on a 95% confidence interval (0.05 significance). The results ensured that the average value of the best fitness was not statistically different from the true average. The results of the NBDC-GA also showed better convergence performance. A key indicator was the manner in which the average fitness of the population changed for each generation. Although the average fitness of the whole population fluctuated in the NBDC-GA, it still held an upward prevailing direction. This meant that most of the chromosomes increased in fitness with each generation; a reflection of the clustering configurations that they represent and an indication of better separation. While the best fitness increased in the IGA, the average fitness of the whole population fluctuated with no visible trendline direction. This transformed the GA more into a random search technique. This could be due to the random mutation and crossover strategies of the previous IGA and because the data set was used with maximum dimensionality, without feature selection. The NBDC-GA found more clusters in the data sets, which was an expected due to the behavior of Ward’s method [34].

Figure 10: Comparison of the average number of clusters for all data sets
This algorithm starts with a large number of clusters with small sizes and, as the GA converges to its optimum solution, the clustering configuration is broken up into a larger number of smaller clusters. Tab. 3 shows the average number of clusters that each technique found upon completion of the convergence process. Due the probabilistic nature of evolutionary algorithms, a further statistical analysis was conducted on the number of clusters produced by NBDC-GA to determine its precision.

Fig. 11 shows a 95% confidence interval in the resulting clusters throughout the entire convergence process for all the selected cancer types along with an exponential trendline.

Figure 11: Confidence interval (95%) of the resulting clusters throughout the convergence process using NBDC-GA
Based on the exponential trendline of the confidence intervals, the probability of finding the same number of clusters for each run increased as the GA evolved. This meant that uncertainty in the number of clusters decreases. The 95% confidence intervals were 22 ± 1.1, 19 ± 0.63, 21 ± 0.65, and 21 ± 1.15 for TCGA-BRCA, TCGA-GBM, TCGA-OV and TCGA-STAD, respectively. Fig. 12 shows the surface plot for all generations and all cancer types of the outer-layer GA and illustrates changes in the dimensionality of the features. This demonstrated the direct effect of the inner-layer GA on the outer-layer GA that is responsible for feature selection since, as previously mentioned, the outer-layer GA does not have a separate fitness function. The inner-layer GA contributed to a reduction in the dimensionality of the features held by the outer-layer GA.

Figure 12: Surface plot illustrating changes in the dimensionality of the data
Tab. 4 illustrates the changes in data dimensionality after the system completed the convergence process.

As previously stated, the biological understanding of the DNA methylation process is still in its infancy. However, the Illumina database retains references that can provide more information about individual CpG methylation loci; such as their chromosomes’ number. Therefore, every feature that is commonly present in the types of cancers investigated in the study were extracted to analyze the selected features and their impact on the chromosomes. The number of common features that were extracted (CpG loci) was 1,515. Based on the CpG loci information provided by the Illumina’s database, the amount of DNA methylation activity that took place inside each individual chromosome was calculated. Fig. 13 highlights the normalized percentage of DNA methylation that took place inside each chromosome.

Figure 13: Distribution of DNA methylation for each individual chromosome
The red bars indicate the error percentage based on a 5% confidence value. Based on the selected features, the analysis shows that the largest chromosome 1 had increased levels of DNA methylation (9.7 ± 0.38%) while chromosome 21 had the lowest percentage of DNA methylation (1.14 ± 0.16%) for the selected cancer types.
Chromosome 21 encodes microRNA and can affect several other mechanisms that induces cancer development, and although the genes and mechanisms associated with these molecular features remain largely unidentified, it is established that hypomethylation in chromosome 21 is associated with trisomy (extra copy of the chromosome) which is found in primary cancer samples [35]. As for chromosome 1, it has been established that the inactivation of the second allele of chromosome 1p CHD5 in neuroblastoma, which is a type of primary cancer that develops from immature nerve cells, is the result of epigenetic silencing by CHD5 promoter hypermethylation [36,37].
This paper presented a Nested Big Data Clustering Genetic Algorithm (NBDC-GA); a new evolutionary metaheuristic capable of performing both feature selection and clustering. The algorithm employed Ward’s hierarchical clustering method in a nested GA configuration along with a modified maximal perseverance crossover (MPX) operator and a modified mutation operator. MetaMethyLib; a software package framework with which to implement the NBDC-GA was developed. With the ability to use parallelism and network-based convergence, MetaMethyLib takes advantage of remote devices to enhance the performance of the convergence process and decrease its runtime. The NBDC-GA was tested using real-life data retrieved from The Cancer Genome Atlas (TCGA). Its performance was then compared with that of a recently published metaheuristic technique known as Immuno-Genetic Algorithm (IGA). The exact same data set was used to test the system with IGA due to its compatibility and readiness to accept the data without any modifications. The results showed that NBDC-GA outperformed the IGA in terms of the of the population’s average fitness throughout the entire convergence process. This was further validated using a 95% confidence interval. The suggested technique was able to decrease the dimensionality of features to a maximum of 67% and of 94.5% for individual cancer type and collective cancer, respectively. The NBDC-GA was also able to detect relatively abnormal regions of DNA methylation activities in two different chromosomes. In the future, these features can be used to classify and distinguish normal cancer from malignant tissues. This can be achieved by means of supervised machine learning since the samples retrieved from TCGA contain labels related to their malignancy status. Another important aspect about this research and other related work, is the ability to translate it to clinical practice. While it is evident that recent advances in DNA sequencing technologies provided unparalleled opportunities for this field, only a handful of them have been successfully translated into clinical practice in the field of oncology. The reasons for this include the lack of standardization protocol, the need for rigorous pre-analytical processing scheme and the accuracy of DNA methylation measurements. The establishment of an epigenetic biomarker that targets clinical practices is therefore a complicated process that may only begin with the identification of an epigenetic signature [38].
Acknowledgement: We would like to acknowledge Arab Academy for Science and Technology and Universiti Teknologi Malaysia for their support in supervising this work, and for giving continuous access to the laboratories to conduct this research.
Funding Statement: The authors received no specific funding for this study.
Conflicts of Interest: The authors declare that they have no conflicts of interest to report regarding the present study.
References
1. W. H. O. (WHOWorld Health Statistics 2018: Monitoring Health for the SDGs, 2018. [Online]. Available: https://www.who.int/gho/publications/world_health_statistics/2018/en/. [Google Scholar]
2. G. K. Homrich, C. F. Andrade, R. C. Marchiori, G. D. S. Lidtke, F. P. Martins et al., “Prevalence of benign diseases mimicking lung cancer: Experience from a university hospital of Southern Brazil,” Tuberculosis and Respiratory Diseases, vol. 78, no. 2, pp. 72–77, 2015. [Google Scholar]
3. T. Rath, R. Atreya, W. Geißdörfer, R. Lang, A. Nägel et al., “A severe case of tuberculosis radiologically and endoscopically mimicking colorectal cancer with peritoneal carcinomatosis,” Case Reports in Gastrointestinal Medicine, vol. 2017, no. 2017, pp. 4, 2017. [Google Scholar]
4. G. Watte, R. G. Tonietto, A. G. D. Bello, C. B. Severo, F. D. M. Oliveira et al., “Infection mimicking cancer: Retrospective analysis of 147 cases, emphasizing fungal etiology,” European Respiratory Journal, vol. 44, no. Supl. 58, pp. 2512, 2014. [Google Scholar]
5. S. B. Baylin and P. A. Jones, “Epigenetic determinants of cancer,” Cold Spring Harbor Perspectives in Biology, vol. 8, no. 9, pp. a019505, 2016. [Google Scholar]
6. L. D. Moore, T. Le and G. Fan, “DNA methylation and Its basic function,” Neuropsychopharmacology, vol. 38, no. 1, pp. 23–28, 2013. [Google Scholar]
7. H. Zhu, G. Wang and J. Qian, “Transcription factors as readers and effectors of DNA methylation,” Nat. Rev. Genet., vol. 17, no. 9, pp. 551–565, 2016. [Google Scholar]
8. T. H. Bestor, J. R. Edwards and M. Boulard, “Notes on the role of dynamic DNA methylation in mammalian development,” PNAS, vol. 112, no. 22, pp. 6796–6799, 2015. [Google Scholar]
9. J. R. Edwards, A. H. O’Donnell, R. A. Rollins, H. E. Peckham, C. Lee et al., “Chromatin and sequence features that define the fine and gross structure of genomic methylation patterns,” Genome Research, vol. 20, no. 7, pp. 972–980, 2010. [Google Scholar]
10. B. Tang, Z. Pan, K. Yin and A. Khateeb, “Recent advances of deep learning in bioinformatics and computational biology,” Frontiers in Genetics, vol. 10, pp. 214, 2019. [Google Scholar]
11. M. Bibikova, B. Barnes, C. Tsan, V. Ho, B. Klotzle et al., “High density DNA methylation array with single CpG site resolution,” Genomics, vol. 98, no. 4, pp. 288–295, 2011. [Google Scholar]
12. C. S. Greene, J. Tan, M. Ung, J. H. Moore and C. Cheng, “Big data bioinformatics,” J. Cell Physiol., vol. 229, no. 12, pp. 1896–1900, 2014. [Google Scholar]
13. C. S. Wilhelm-Benartzi, D. C. Koestler, M. R. Karagas, B. C. Christensen, K. T. Kelsey et al., “Review of processing and analysis methods for DNA methylation array data,” British Journal of Cancer (BJC), vol. 109, pp. 1394–1402, 2013. [Google Scholar]
14. M. D. Long, D. J. Smiraglia and M. J. Campbell, “The genomic impact of DNA CpG methylation on gene expression; relationships in prostate cancer,” Biomolecules, vol. 7, no. 1, pp. 15, 2017. [Google Scholar]
15. A. M. Bagirov, N. Karmitsa and S. Taheri, “Metaheuristic clustering algorithms,” in Partitional Clustering via Nonsmooth Optimization. Unsupervised and Semi-Supervised Learning, Cham, Switzerland: Springer International Publishing, Chapter no. 6, pp. 165–183, 2020. [Online]. Available: https://link.springer.com/chapter/10.1007/978-3-030-37826-4_6. [Google Scholar]
16. S. Gajawada, D. Toshniwal, N. Patil and K. Garg, “Optimal clustering method based on genetic algorithm,” in Proc. of the Int. Conf. on Soft Computing for Problem Solving, New Delhi, India, pp. 295–303, 2012. [Google Scholar]
17. A. Chowdhury and S. Das, “Automatic shape independent clustering inspired by ant dynamics,” Swarm and Evolutionary Computation, vol. 3, pp. 33–45, 2012. [Google Scholar]
18. S. C. Oh, Y. Y. Park, E. S. Park, J. Y. Lim, S. M. Kim et al., “Prognostic gene expression signature associated with two molecularly distinct subtypes of colorectal cancer,” Gut, vol. 61, no. 9, pp. 1291–1298, 2012. [Google Scholar]
19. Z. Ren, W. Wang and J. Li, “Identifying molecular subtypes in human colon cancer using gene expression and DNA methylation microarray data,” International Journal of Oncology, vol. 48, no. 2, pp. 690–702, 2015. [Google Scholar]
20. F. Celli, F. Cumbo and E. Weitschek, “Classification of large DNA methylation datasets for identifying cancer drivers,” Big Data Research, vol. 13, pp. 21–28, 2018. [Google Scholar]
21. R. K. Singh and M. Sivabalakrishnan, “Feature selection of gene expression data for cancer classification: A review,” Procedia Computer Science, vol. 50, pp. 52–57, 2015. [Google Scholar]
22. B. Baur and S. Bozdag, “A feature selection algorithm to compute gene centric methylation from probe level methylation data,” PLoS One, vol. 11, no. 2, pp. e0148977, 2016. [Google Scholar]
23. J. Wu, Y. Xiao, C. Xia, F. Yang, H. Li et al., “Identification of biomarkers for predicting lymph node metastasis of stomach cancer using clinical DNA methylation data,” Epigenetic Biomarkers in Cancer, vol. 2017, pp. 1–7, 2017. [Google Scholar]
24. J. Liu, Y. Cheng, X. Wang, L. Zhang and H. Liu, “An optimal mean based block robust feature extraction method to identify colorectal cancer genes with integrated data,” Scientific Reports, vol. 7, pp. 8584, 2017. [Google Scholar]
25. H. Sun and R. Grishman, “Lexicalized dependency paths based supervised learning for relation extraction,” Computer Systems Science and Engineering, vol. 43, no. 3, pp. 861–870, 2022. [Google Scholar]
26. H. Sun and R. Grishman, “Employing lexicalized dependency paths for active learning of relation extraction,” Intelligent Automation & Soft Computing, vol. 34, no. 3, pp. 1415–1423, 2022. [Google Scholar]
27. S. A. G. Shirazi and M. B. Menhaj, “A new genetic based algorithm for channel assignment problems,” in Computational Intelligence, Theory and Applications, Berlin, Germany, Springer, pp. 85–91, 2006. [Google Scholar]
28. R. Dash and R. Dash, “Comparative analysis of k-means and genetic algorithm based data clustering,” International Journal of Advanced Computer and Mathematical Sciences, vol. 3, no. 2, pp. 257–265, 2012. [Google Scholar]
29. Y. Yang, “A clustering method based on PSO-GA optimization algorithm,” Revista de la Facultad de Ingeniería U.C.V, vol. 32, no. 10, pp. 85–91, 2017. [Google Scholar]
30. T. Caliński and J. Harabasz, “A dendrite method for cluster analysis,” Communications in Statistics, vol. 3, pp. 1–27, 1974. [Google Scholar]
31. H. Mühlenbein, M. Gorges-Schleuter and O. Krämer, “Evolution algorithms in combinatorial optimization,” Parallel Computing, vol. 7, no. 1, pp. 65–85, 1988. [Google Scholar]
32. P. D. Lena, C. Sala, A. Prodi and C. Nardini, “Missing value estimation methods for DNA methylation data,” Bioinformatics, vol. 35, no. 19, pp. 3786–3793, 2019. [Google Scholar]
33. D. A. Moussa, N. S. Eissa, H. Abounaser and A. Badr, “Design of novel metaheuristic techniques for clustering,” IEEE Access, vol. 6, pp. 77350–77358, 2018. [Google Scholar]
34. O. Akman, T. Comar, D. Hrozencik and J. Gonzales, “Data clustering and self-organizing maps in biology,” in Algebraic and Combinatorial Computational Biology, Cambridge, Massachusetts, United States of America (USAAcademic Press, Chapter no. 11, pp. 351–374, 2019. [Online]. Available: https://doi.org/10.1016/B978-0-12-814066-6.00011-8. [Google Scholar]
35. A. Laurent, R. Kotecha and S. Malinge, “Gain of chromosome 21 in hematological malignancies: Lessons from studying leukemia in children with down syndrome,” Leukemia, vol. 34, no. 8, pp. 1984–1999, 2020. [Google Scholar]
36. T. Fujita, J. Igarashi, E. R. Okawa, T. Gotoh, J. Manne et al., “CHD5, A tumor suppressor gene deleted from 1p36.31 in neuroblastomas,” JNCI: Journal of the National Cancer Institute, vol. 100, no. 13, pp. 940–949, 2008. [Google Scholar]
37. V. Kolla, T. Zhuang, M. Higashi, K. Naraparaju and G. M. Brodeur, “Role of CHD5 in human cancers: 10 years later,” Cancer Research, vol. 74, no. 3, pp. 652–658, 2015. [Google Scholar]
38. W. Wagner, “How to translate DNA methylation biomarkers into clinical practice,” Frontiers in Cell and Developmental Biology, vol. 10, pp. 854797, 2022. [Google Scholar]
Appendix A. Software Availability
MetaMethyLib can be accessed on GitHub page: https://github.com/smnoureldini/MetaMethyLib
Cite This Article
 Copyright © 2023 The Author(s). Published by Tech Science Press.
This work is licensed under a Creative Commons Attribution 4.0 International License , which permits unrestricted use, distribution, and reproduction in any medium, provided the original work is properly cited.
 Downloads
 Citation Tools