
 Submit a Paper
 Propose a Special lssue
 Open Access
ARTICLE

An Intelligent Hazardous Waste Detection and Classification Model Using Ensemble Learning Techniques
1 Department of Computer Science, College of Sciences and Humanities-Aflaj, Prince Sattam bin Abdulaziz University, Saudi Arabia
2 Department of Information Systems, College of Computing and Information System, Umm Al-Qura University, Saudi Arabia
3 Department of Information Systems, College of Computer and Information Sciences, Princess Nourah bint Abdulrahman University, P.O. Box 84428, Riyadh, 11671, Saudi Arabia
4 Department of Computer Science, College of Science and Arts at Muhayel, King Khalid University, Muhayel Aseer, Saudi Arabia
5 Department of Computer Science, Faculty of Computers and Information Technology, Future University in Egypt, New Cairo, 11835, Egypt
6 Department of Computer and Self Development, Preparatory Year Deanship, Prince Sattam bin Abdulaziz University, AlKharj, Saudi Arabia
* Corresponding Author: Mesfer Al Duhayyim. Email:
Computers, Materials & Continua 2023, 74(2), 3315-3332. https://doi.org/10.32604/cmc.2023.033250
Received 12 June 2022; Accepted 09 August 2022; Issue published 31 October 2022
 View Full Text
 Download PDF
Abstract
Proper waste management models using recent technologies like computer vision, machine learning (ML), and deep learning (DL) are needed to effectively handle the massive quantity of increasing waste. Therefore, waste classification becomes a crucial topic which helps to categorize waste into hazardous or non-hazardous ones and thereby assist in the decision making of the waste management process. This study concentrates on the design of hazardous waste detection and classification using ensemble learning (HWDC-EL) technique to reduce toxicity and improve human health. The goal of the HWDC-EL technique is to detect the multiple classes of wastes, particularly hazardous and non-hazardous wastes. The HWDC-EL technique involves the ensemble of three feature extractors using Model Averaging technique namely discrete local binary patterns (DLBP), EfficientNet, and DenseNet121. In addition, the flower pollination algorithm (FPA) based hyperparameter optimizers are used to optimally adjust the parameters involved in the EfficientNet and DenseNet121 models. Moreover, a weighted voting-based ensemble classifier is derived using three machine learning algorithms namely support vector machine (SVM), extreme learning machine (ELM), and gradient boosting tree (GBT). The performance of the HWDC-EL technique is tested using a benchmark Garbage dataset and it obtains a maximum accuracy of 98.85%.Keywords
Exposure to toxic and hazardous waste can cause significant impacts on the atmosphere and also on human wellbeing. When waste of any type, either from industries or households, decomposes, it can pollute the environment. To be more specific, mining wastes, sewage slug, electronic & electric wastes, and many others contaminate the environment and, in turn, affect human health in various forms [1]. Any hazardous or toxic substances entering the human body cause harmful effects in all groups, from fetuses, infants, teenagers, elders, and the elderly. However, the severity of these effects varies are the challenging factors due to the impact of toxic substances and hazardous wastes [2]. Inhalation, absorption, and dermal (skin) touch are the three main routes of exposure. Waste and the related risk have become an increasingly major challenge in ecological protections. There arises increasing attention in waste management across the globe, both in the developments of technology for minimizing the quantity and those associated with their economic and disposal uses. The primary cause for excessive waste production can be illogical material management.
The garbage gathering in landfilling might be employed as secondary raw material, the values of which are evaluated at hundreds of millions of dollars. 35% is iron, zinc, lead, and other metal; 25% of overall amounts of coal; and 40% is associated with the elements like slag, ash, aggregates, rock waste, etc. [3,4]. Constraining the amount of produced waste to levels which ensure balance among sanitary waste, raw material, and ecological is impossible without wide-ranging synchronization of technology also the way of people living with the working and formation of environmental structures in the region [5]. Action intended for decreasing the mass of generated waste and located in the surrounding must involve minimizing waste production from end to end, replacing traditionally used raw materials non-waste technologies/the use of modern low-waste, and recycling raw material [6]. The targeting scheme to solve the problems of waste generation polluted the natural environments are low and waste-free technology.
Techniques like Big Data, cloud computing (CC), Internet of Things (IoT), and artificial intelligence (AI) could be used for waste reduction [7]. Firstly, wet and dry wastes are segregating, and electromagnetic technique is employed for sorting iron comprising material. But, visual approaches are employed for segregating the plastic garbage [8,9]. In optical arranging, camera is applied for identifying distinct waste segments according to the visual properties, like texture/shape, color. The model makes triangle through the camera images over the base laser beam, it is also known as triangulation scanning [10]. Spectral imaging is an integration of computer image processing and spectral reflection measurement technologies.
This study concentrates on the design of hazardous waste detection and classification using ensemble learning (HWDC-EL) technique to reduce toxicity and improve human health. The HWDC-EL technique intends to detect the multiple classes of wastes, particularly hazardous and non-hazardous wastes. Moreover, the HWDC-EL technique derives an ensemble of three feature extractors using the Model Averaging technique namely discrete local binary patterns (DLBP), EfficientNet, and DenseNet121. Furthermore, the flower pollination algorithm (FPA) based hyperparameter optimizers are used to optimally adjust the parameters involved in the EfficientNet and DenseNet121 models. Lastly, a weighted voting-based ensemble classifier is derived using three machine learning techniques namely support vector machine (SVM), extreme learning machine (ELM), and gradient boosting tree (GBT). The performance of the HWDC-EL technique is tested using a benchmark Garbage dataset and the results are scrutinized relating to different aspects.
Hussain et al. [11] propose IoT based intelligent bins with machine learning (ML) and deep learning (DL) models for managing the garbage disposal also for predicting the air pollutants existing in the bin environments. The smart bins are related to IoT based servers, that carry out the necessary computations to predict the bin status also to predict air quality on the basis of realtime data. Researchers investigated conventional models (KNN) and logistic regression (LR) as well as a non-conventional method for making an alert message about status of the bin and predict the sum of air pollutants carbon monoxide (CO) existing in the atmosphere at a certain case. Cao et al. [12] proposed a recognition and garbage classification method on the basis of transfer learning (TL) approach that migrates the present InceptionV3 method recognition tasks on Imagenet datasets for the identification of garbage. Firstly, rise the dataset via data augmentation. Next, construct a convolution neural network (CNN) according to the source models and alter the NN parameter according to the training effects.
In Yang et al. [13], a CNN is trained by huge amounts of negative and positive samples. To adopt better for detecting objects, the topology of CNN is enhanced. The windows of suspicious hazardous articles are inputted to the enhanced CNN for detecting hazardous objects, and the false detection rate (FDR) is decreased when preserving the original detection rates. Ziouzios et al. [14] suggested a cloud-related classification method for automated machines in recyclable factories having ML model. Hua et al. [15] investigated with Keras, for creating a CNN, and OpenCV, to make realtime videos, which identify dangerous wastes from other recycling materials. With help of ML method, these models are capable of categorizing distinct recyclable material with an accuracy of around 90%. An object within the video receives predictions for three classifiers that include nonhazardous, batteries, and syringes waste. Adedeji et al. [16] suggested a smart waste material categorization system, i.e., presented by employing fifty layers residual net pretrain (ResNet-50) CNN models i.e., an ML tools and serve as an extractor, as well support vector machine (SVM) i.e., leveraged for classification.
Nowakowski et al. [17] investigate an image detection scheme for the classification and identification of waste electronic and electrical equipment’s from an image. The primary objective is to assist data interchange about the wastes to be gathered from individual or waste gathering points, thus using smartphones and wide acceptance. A new technique of identification and classification with neural network (NN) is presented to image analyses: a DL-CNN has been used for classifying the types of e-waste, and a fast region based convolution neural network (RCNN) method has been employed for detecting the size and category of the waste equipment in an image. Chu et al. [18] recommends a sorting waste disposal model manually of an individual in urban public areas. Though several models are available in the literature, there is still a need of ML and DL models to effectively handle the massive quantity of increasing waste. Therefore, waste classification becomes a crucial topic which helps to categorize waste into hazardous or non-hazardous ones and thereby assist in the decision making of the waste management process.
In this study, a novel HWDC-EL algorithm can be extracted for hazardous waste classification and detection. The HWDC-EL algorithm intends to detect the multiple classes of wastes, particularly hazardous and non-hazardous wastes. The overall working of the HWDC-EL technique involves two major stages namely ensemble learning based feature extraction and weighted voting based classification. Fig. 1 exemplifies the overall block diagram of proposed HWDC-EL model. The detailed operational principle of these processes is discussed in the succeeding sections.
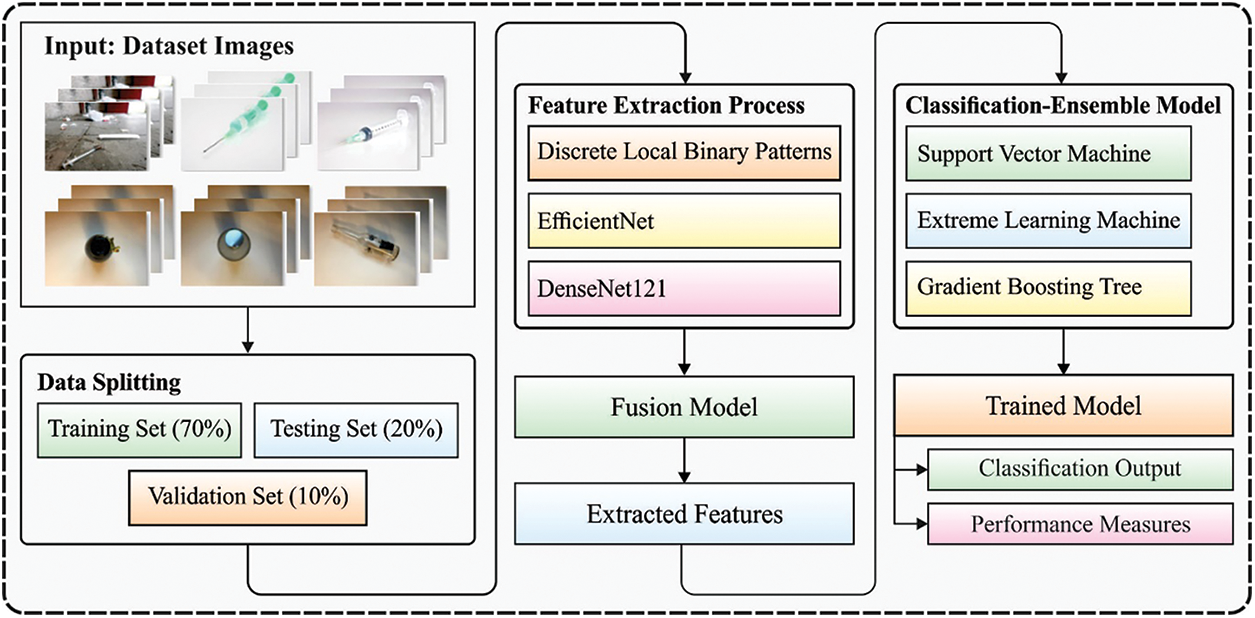
Figure 1: Overall block diagram of HWDC-EL model
3.1 Design of Ensembling Learning Based Feature Extraction Process
At the initial stage, the input images are fed into the feature extractor for generating a feature vector set. In this study, an ensemble of 3 feature extraction algorithms like DLBP, EfficientNet, and DenseNet121 algorithms are employed by Model Averaging technique.
Local binary pattern (LBP) model provides a descriptors for few images with the gray level of all the pixels. In classical versions, pixels are deliberated by the eight nearby to him, thus forming a square of 3 × 3 pixels. Next, for all these 8 adjacent, their relationships having central pixels are calculated: when the grey levels are higher compared to the central pixels, they were interchanged with one, or else with zero [19]. The resulting binary patterns are later converted into a decimal value. The
whereas P represents a pixel closer to the central ones,
It is noted that the numbers of neighbor and the radius are parameter which is altered and aren’t static.
DLBP model is proposed by Kobayashi [20], as an altered form of LBP. It aims for discovering, per pixels patch, the optimum thresholds divide pixel inside it. The thresholds are acquired by minimalizing a remaining error computed by:
With:
A residual error
When the threshold can be established, the weight of all the pixels patch on last histogram are assessed as:
whereas C indicates a constant that serve for managing this case whereas
EfficientNet [21] is a type of CNN which employs an exclusive scaling method scales each dimension, viz., width, and resolution implementing compound coefficients. The EfficientNet outperforms various other advanced models on ImageNet datasets classification tasks and doesn’t saturate when the number of trainable parameters is increased. Here, the EfficientB7 model is used.
Dense Convolutional Network (DenseNet) is a class of neural networks where every layer obtains input from each layer behind it and forwards its own feature map to each succeeding layer. In DenseNet, each layer acquires the knowledge of each preceding layer in a feedforward manner. A DenseNet using L layer has L(L + 1)/2 connection compared to just L connection in a traditional convolutional network [22].
3.1.4 Hyperparameter Optimization
In order to tune the hyperparameters involved in the EfficientNet and DenseNet-121 models, the FPA is applied to it. The self-pollination, biotic pollination, cross-pollination, and abiotic pollination models are represented in optimization fields and induced in a flower pollination method. Flower reliability was determined as a precise solution that might be a visible one. In another case, local pollinations are performed within a smaller area of a unique flower was performed in shading water. Global pollination occurs with a possibility are called a switch possibility. Once the phases are removed, local pollination could be interchanged [23]. In FPA model, it consists of 4 rules as follows:
• Cross and Live pollinations are called global pollination as well as the carrier of pollen pollinator apply the levy fight.
• Self and Abiotic pollinations are denoted by local pollination.
• Pollinator is insect, i.e., capable of advancing flower constancy. It is determined as the production possibility to 2 employed flowers.
• The transmission of global and local pollinations can handled by a switch possibility.
• Henceforth, the 1st & 3rd rules are given below:
•
The ensemble algorithm employed in this study is Model Averaging [24]. In this method, each classifier contribution will remain equal for computation of the final prediction. Unweighted averaging may be a reasonable ensemble to same base learner of similar performances.
3.2 Design of Weighted Voting Based Ensemble Classification Process
During classification procedure, the feature vectors were passed into classifier module which involves three models namely SVM, GBT, and ELM. In addition, a weighted voting based ensemble classification process is adopted to predict the final class of the applied input image.
Initially, SVM model was proposed by Vapnik in 1995, also it is becoming optimum method for classifying data. It contains a solid theoretical foundation depending upon the integration among basic risk minimalization principles. The major advantage of SVM is the high generalization ability and global optimization furthermore, it overcomes the over-fitting problem and provides sparse solutions compared with the present approaches like artificial neural network (ANN) in classification. In normal linear classification problems, e.g., 1,
Subjected to:
While C indicates the standardization variable;
It must be pointed out that the non-linear classifiers might be represented by
whereas
whereas
The term boosting mentions that a family of techniques which change weak learners to strong learners, kind that weak learners are only somewhat superior to an arbitrary selection, but strong learners have an almost perfect efficiency. The Gradient Boosting method has been ML approach which is utilized in combined regression as well as classification issues. These techniques generate the predictive method in the procedure of ensemble to weak predictive techniques that are commonly equivalent to decosopm tree (DT) under the specific case utilized. This technique creates the method in stages as other boosting techniques along with generalization these by optimizing random differentiable loss functions. There are several works which utilize AI approaches.
The ensemble can be created from the stage-wise procedure with gradient descent in function space. The last method is a function which gets as input the vector of attribute
ELM is proposed by Professor Huang, this approach employs single hidden layer feed forwared network structure, i.e., provided N trained sample and contain L standard NN method is formulated by:
Whereas
Eq. (17) is formulated by
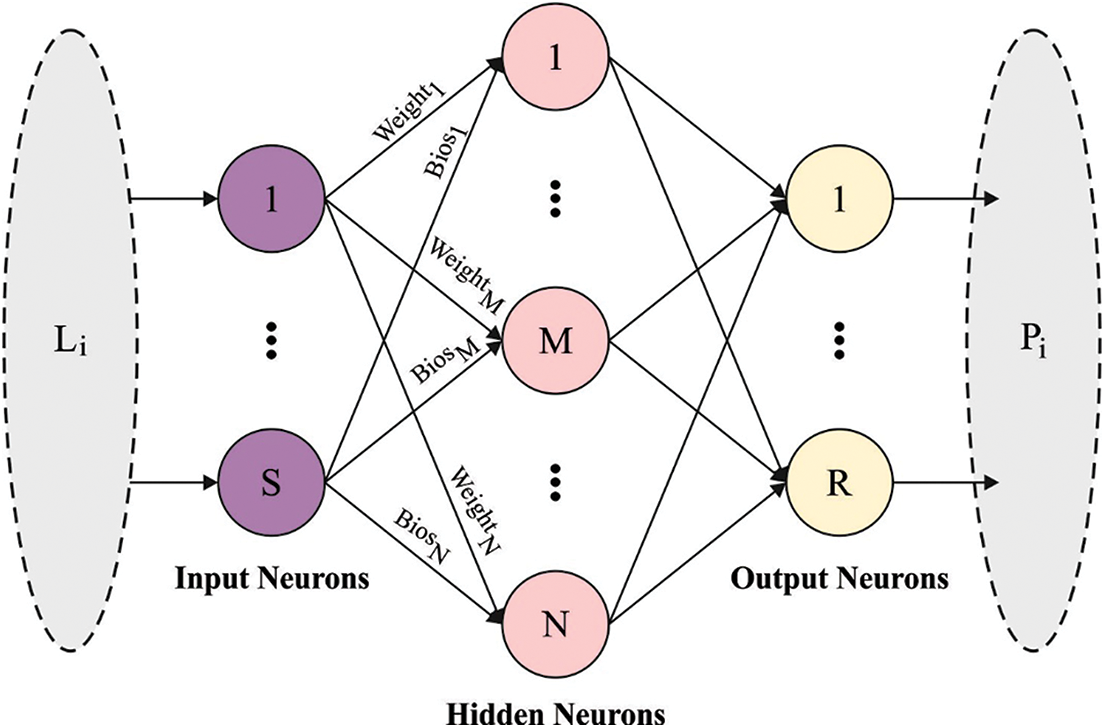
Figure 2: ELM structure
Like LSSVM, the optimization problems are expressed in the following:
Now
Using Moore Penrose generalized inverse matrix
3.2.4 Weighted Voting Based Ensembling Process
At the weighted voting-related ensemble technique, the ML approaches were compiled. The voting technique was trained with all individuals’ vectors and the respective 10-fold crows validation accuracy is later evaluated as FF [28]. Given the amount of classes as n and D base classifier algorithms to vote, the predictive class
where
This section analyses the performances of the HWDC-EL algorithm on the garbage classification dataset and some Hazardous images collected from Google (available at https://www.kaggle.com/asdasdasasdas/garbage-classification). The dataset includes two major classes namely Non-hazardous and hazardous. In addition, plastic, paper, metal, and glass waste comes under Non-hazardous class whereas Syringes come under Hazardous class. Fig. 3 shows the sample test images. The classification results are investigated in three ways namely training, testing, and validation datasets. Each class holds a set of 260 images and the dataset includes a total of 1300 images. The parameter setting is given as follows: learning rate: 0.001, activation function, sigmoid, momentum: 0.4, and error: 0.001.
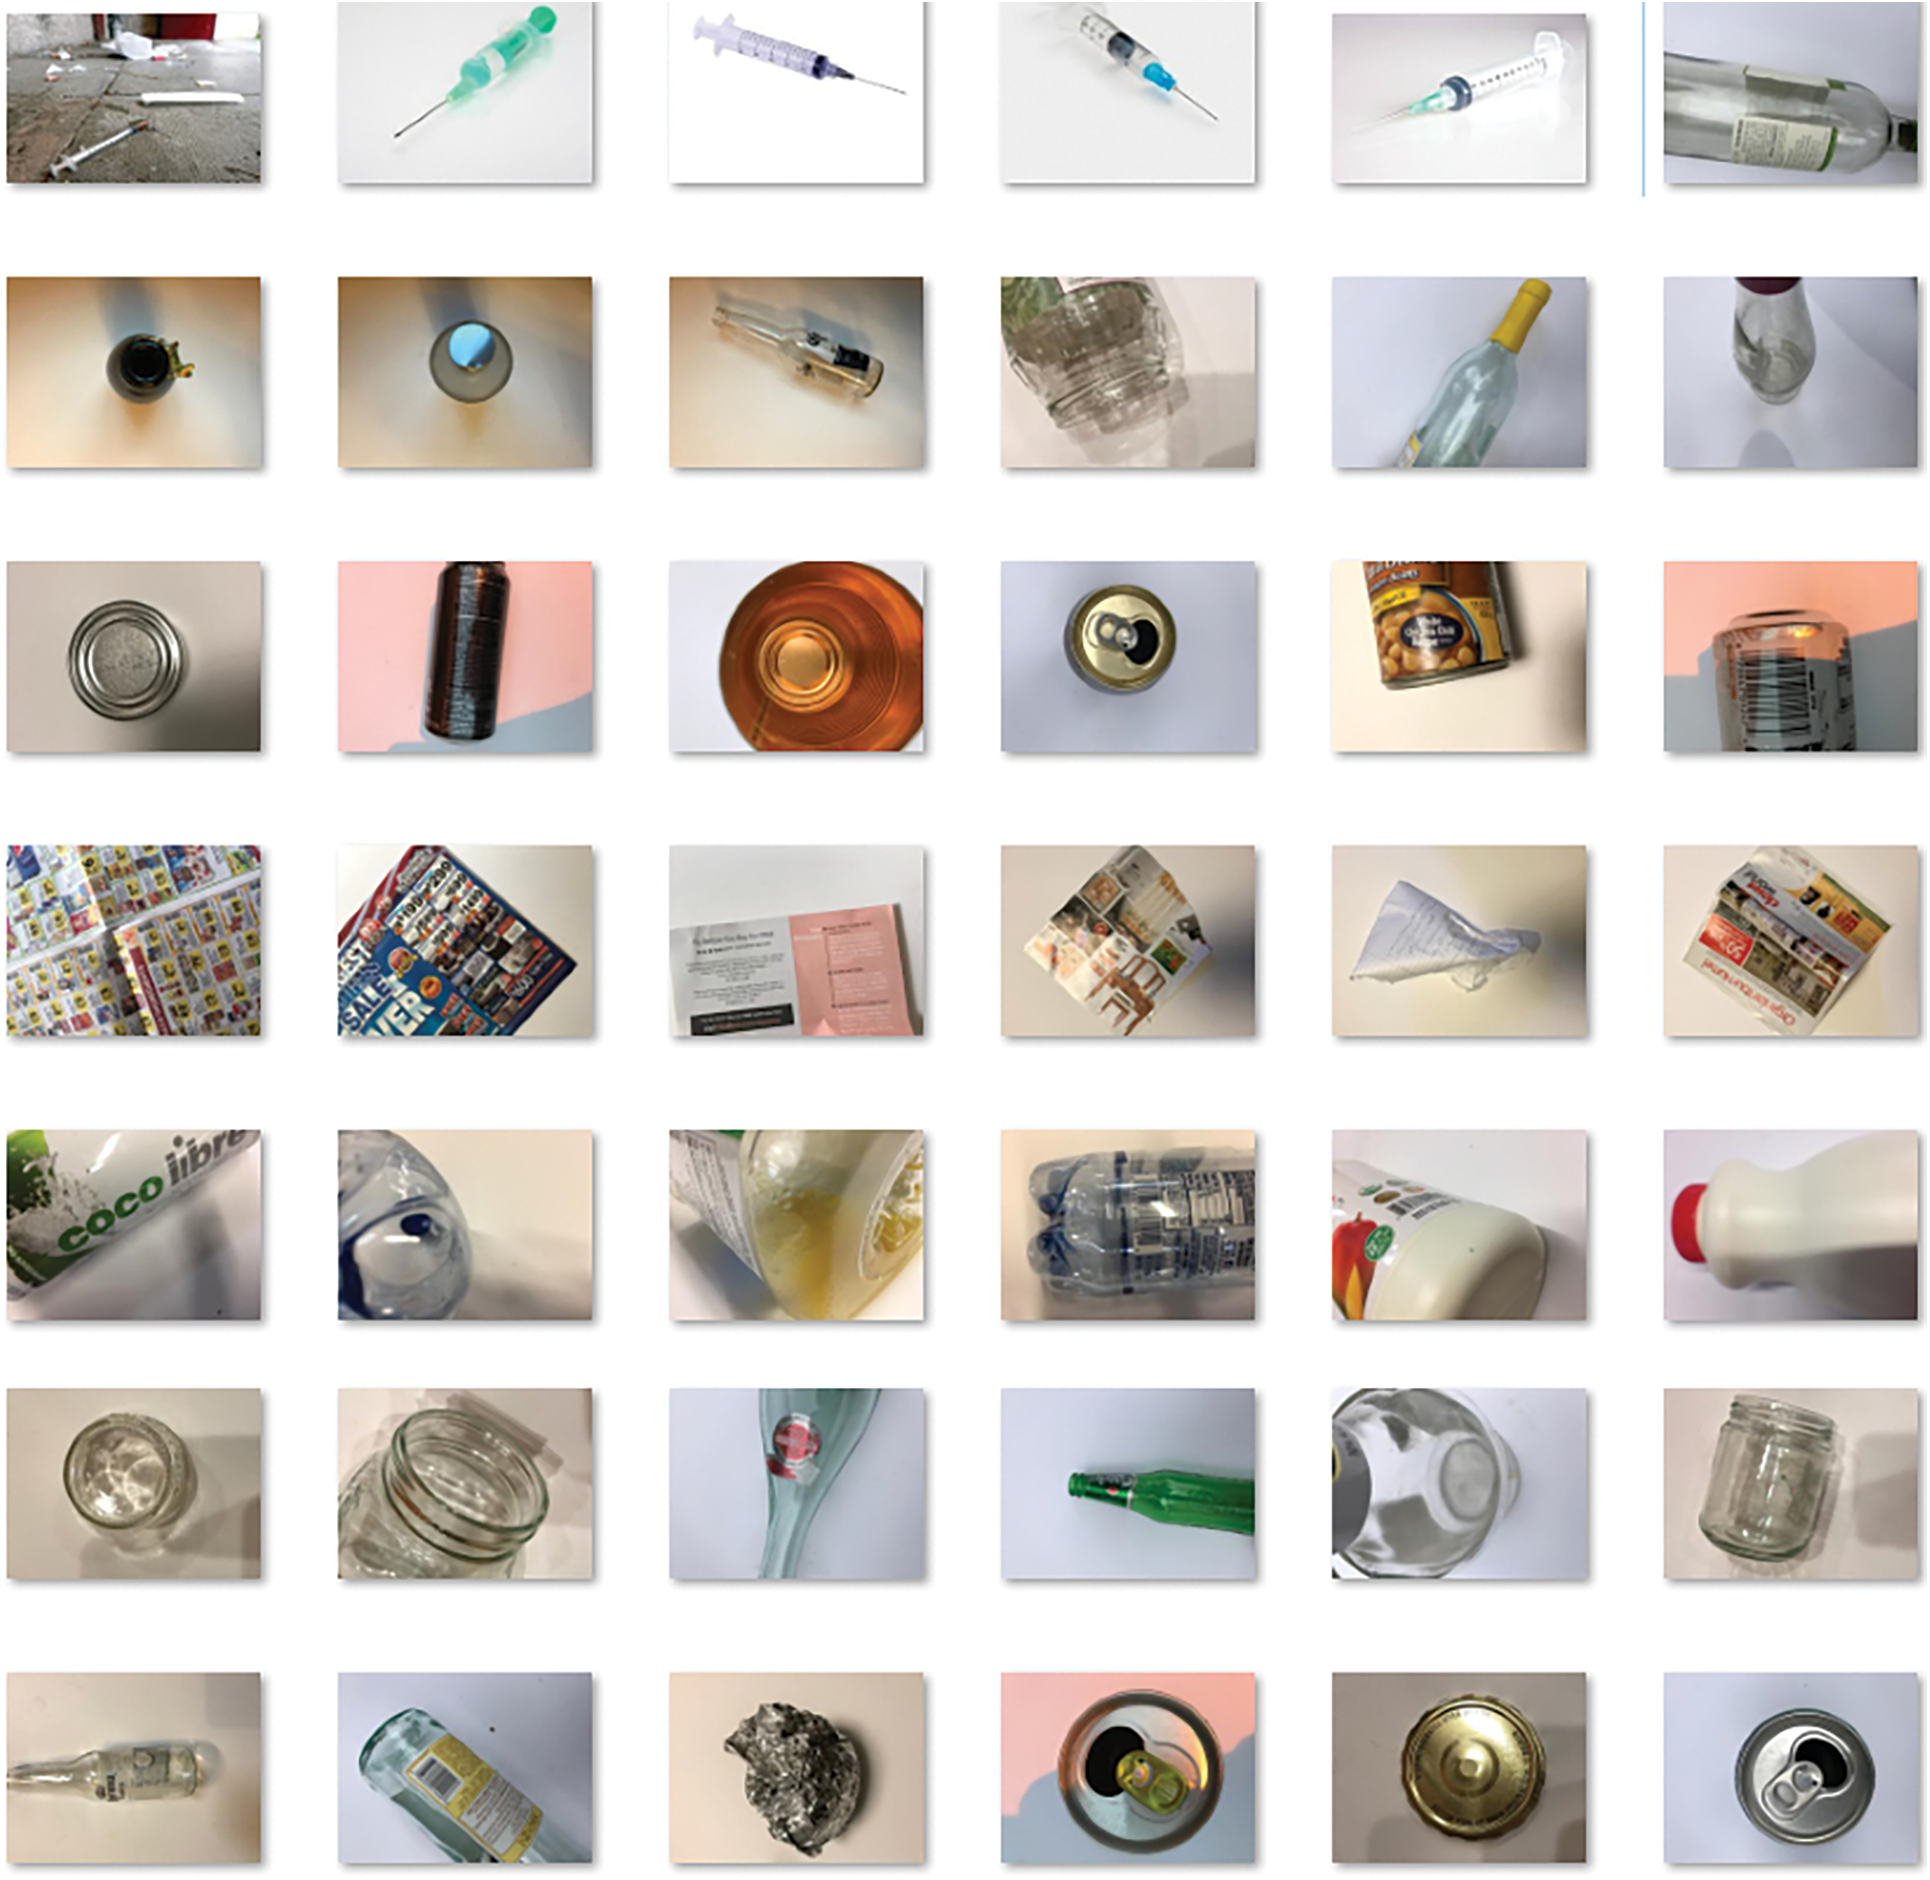
Figure 3: Sample test image
Fig. 4 shows the confusion matrix of the HWDC-EL method on the applied 70% of training dataset. The figure portrayed the HWDC-EL technique has proficiently categorized 172 instances into Plastic, 174 instances into Paper, 174 instances into Metal, 175 instances into Glass, and 175 instances into Syringe.

Figure 4: Confusion matrix of HWDC-EL model on training dataset (70%)
The classification results obtained by the HWDC-EL technique on the detection of multiple classes on the applied 70% of the training dataset are given in Tab. 1. The results portrayed that the HWDC-EL technique has categorized all the waste objects effectively. For instance, the HWDC-EL technique has identified the ‘plastic’ class with the

Fig. 5 showcases the confusion matrix of the HWDC-EL algorithm on the applied 20% of training dataset. The figure demonstrated the HWDC-EL approach contains has proficiently categorized 51 instances into Plastic, 49 instances into Paper, 50 instances into Metal, 50 instances into Glass, and 50 instances into Syringe.
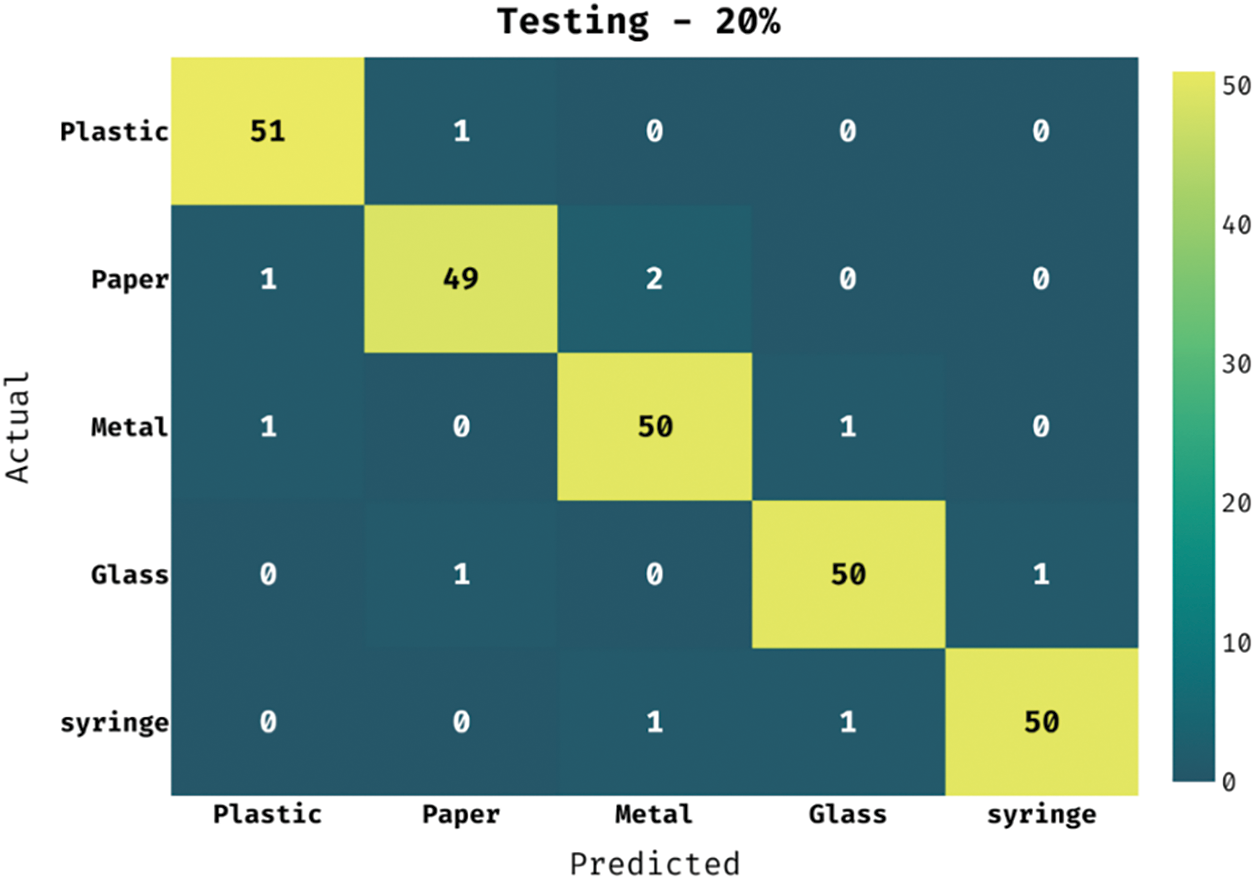
Figure 5: Confusion matrix of HWDC-EL model on training dataset (20%)
The classification results gained by the HWDC-EL method on the detection of multiple classes on the applied 20% of the training dataset are provided in Tab. 2. The outcomes exhibited that the HWDC-EL technique has categorized all the waste objects effectually. For instance, the HWDC-EL manner has identified the ‘plastic’ class with the

Fig. 6 depicts the confusion matrix of the HWDC-EL manner on the applied 10% of training dataset. The figure demonstrated the HWDC-EL method has proficiently categorized 25 instances into Plastic, 26 instances into Paper, 24 instances into Metal, 25 instances into Glass, and 24 instances into Syringe.
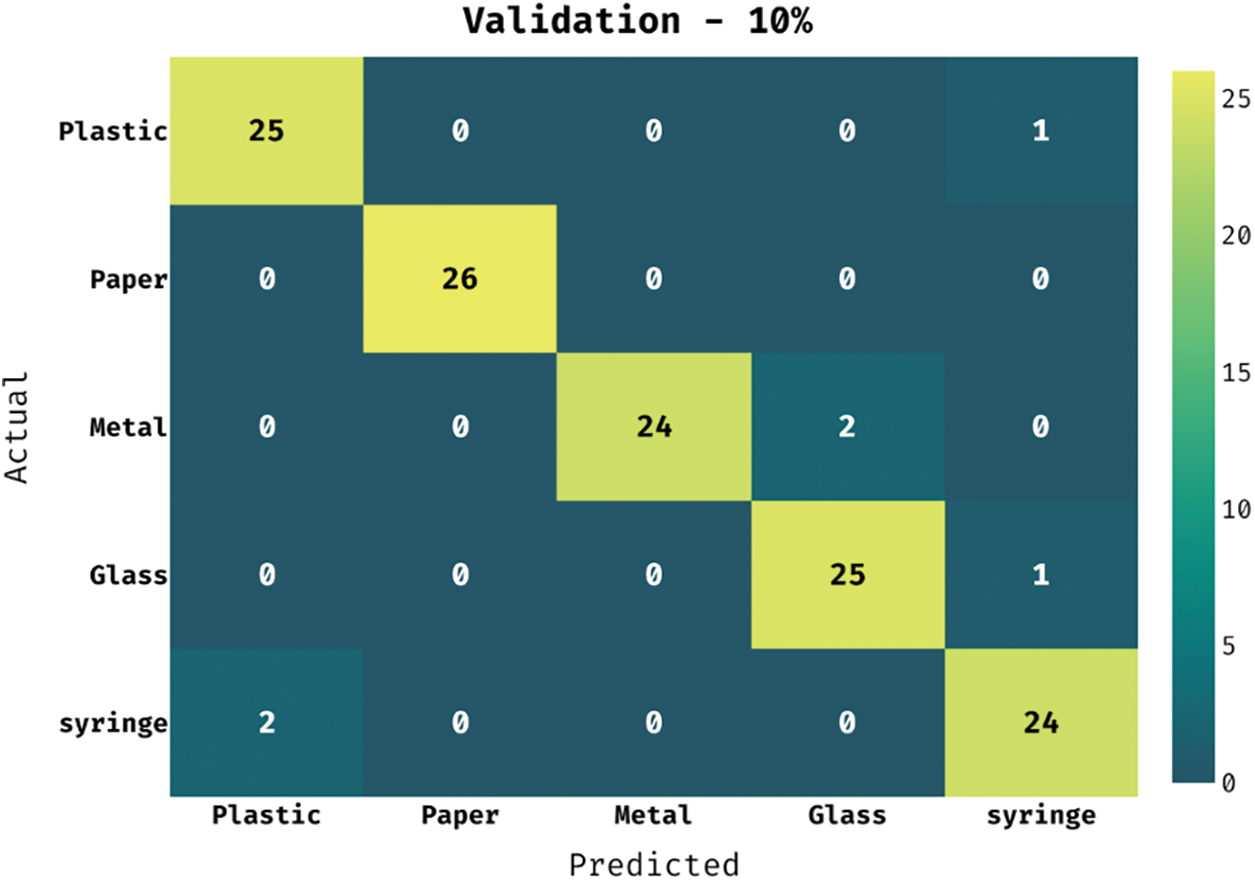
Figure 6: Confusion matrix of HWDC-EL model on training dataset (10%)
The classification outcomes reached by the HWDC-EL method on the detection of multiple classes on the applied 10% of the training dataset are given in Tab. 3. The outcomes outperformed that the HWDC-EL method has categorized all the waste objects efficiently. For instance, the HWDC-EL algorithm has identified the ‘plastic’ class with the

Also, the HWDC-EL method has identified the ‘metal’ class with the
Fig. 7 depicts the accuracy graph of the HWDC-EL method on the applied dataset. The figure depicted the HWDC-EL method has established an increasing training and validation accuracy. In addition, it is evident that the validation accuracy is superior to training accuracy.
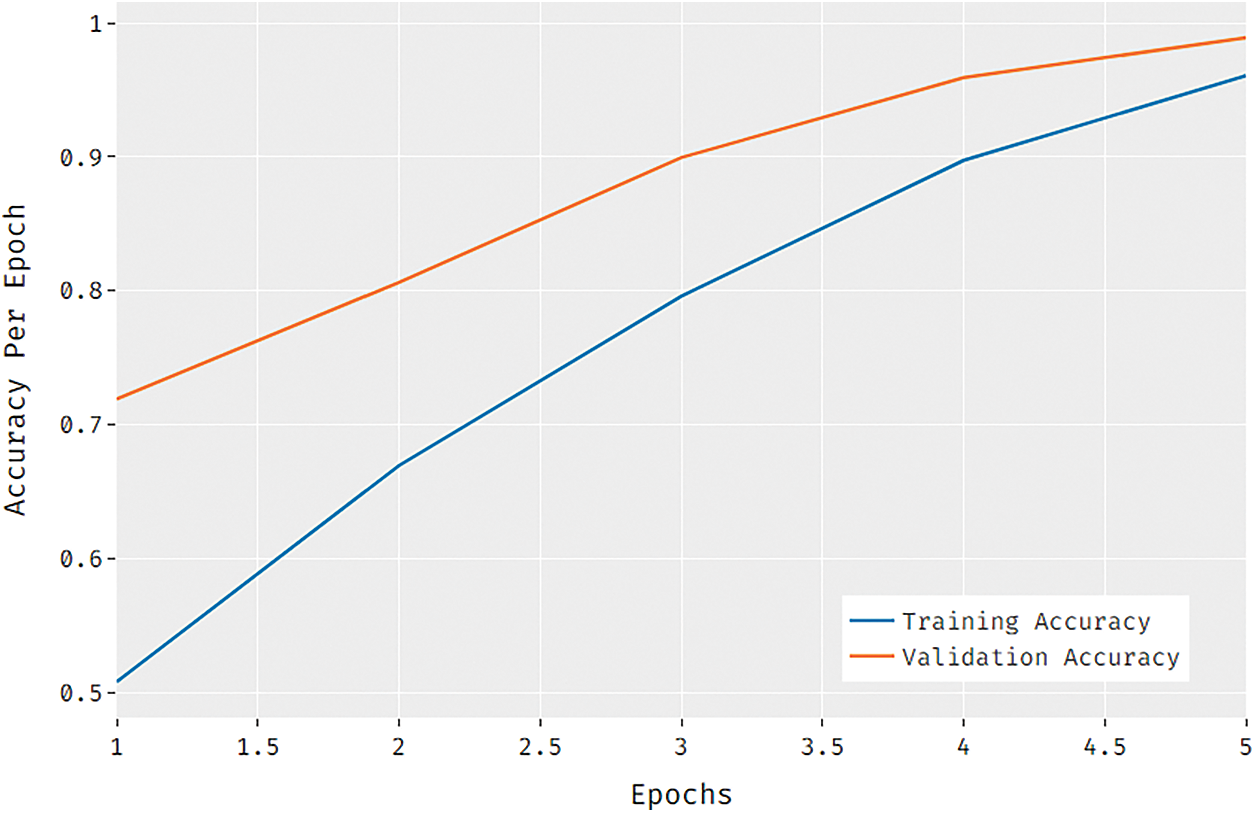
Figure 7: Accuracy analysis of HWDC-EL model
Fig. 8 demonstrates the loss graph of the HWDC-EL technique on the applied dataset. The figure depicted the HWDC-EL technique has accomplished a reduced training and validation loss. Moreover, it is demonstrated the validation loss is lower compared to training loss.
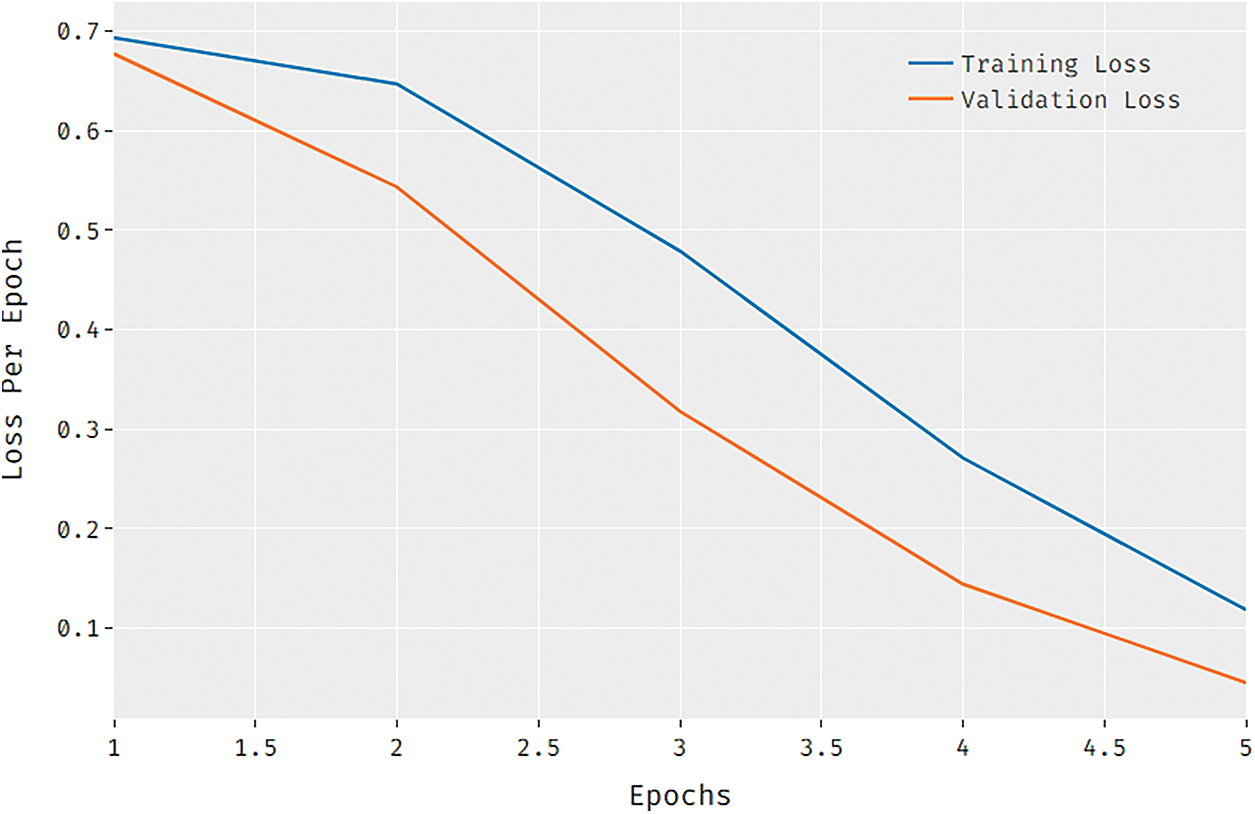
Figure 8: Loss analysis of HWDC-EL model
The multi-class performance is converted into binary classes namely Hazardous and Non-hazardous waste. Fig. 9 shows the confusion matrices obtained by the HWDC-EL technique on binary classification process. On the applied training set of 70%, the HWDC-EL technique has effectually classified 179 instances into Hazardous and 721 instances into Non-hazardous waste. Moreover, on the applied training set of 20%, the HWDC-EL approach has effectively classified 51 instances into Hazardous and 206 instances into Non-hazardous waste. Furthermore, on the applied training set of 10%, the HWDC-EL methodology has efficiently classified 26 instances into Hazardous and 102 instances into Non-hazardous waste.

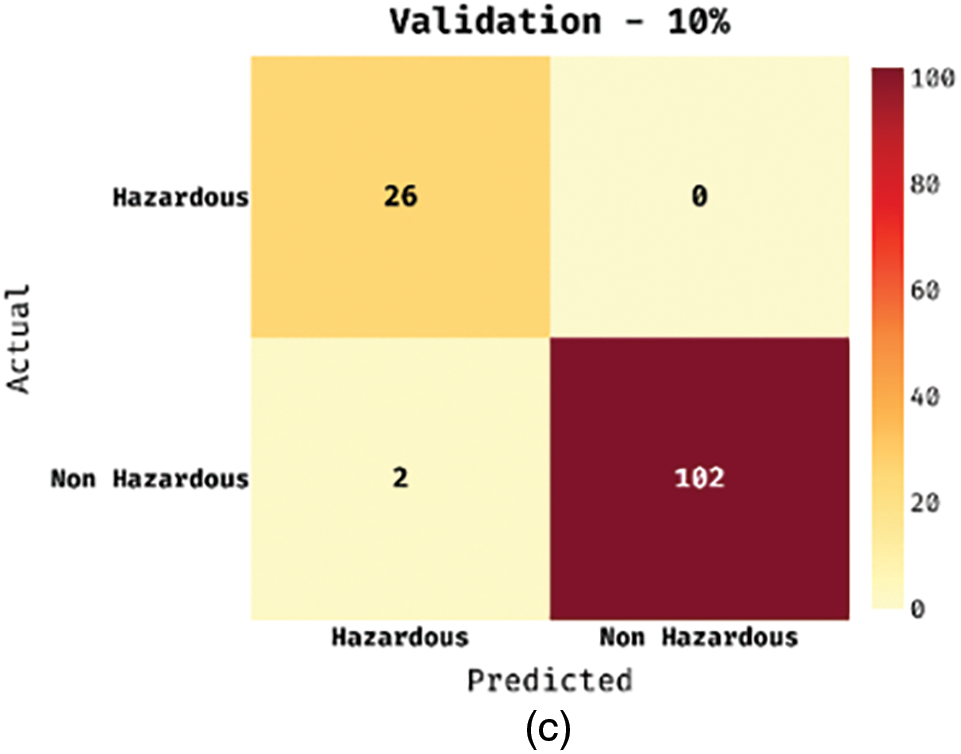
Figure 9: Multiclass analysis of HWDC-EL model
Tab. 4 grants the binary classification results analyses of the HWDC-EL method. On the training set, the HWDC-EL technique has obtained effective outcome with the recall of 0.9835, precision of 0.9624, F-score of 0.9728, and accuracy of 0.9890. Also, on the testing set, the HWDC-EL manner has gained effectual outcomes with the recall of 0.9808, precision of 0.9623, F-score of 0.9714, and accuracy of 0.9885. Besides, on the validation set, the HWDC-EL method has achieved efficient results with the recall of 1.0000, precision of 0.9286, F-score of 0.9630, and accuracy of 0.9846.

To assure the maximum classification performances of the HWDC-EL method, a brief comparison study is made in Fig. 10. The presented HWDC-EL technique has resulted in a maximum accuracy of 98.46% and 98.85% on the classification of multiclass and binary classes respectively. The HWDC-EL method has achieved maximum classification performances and was a proper tool for hazardous waste classification.
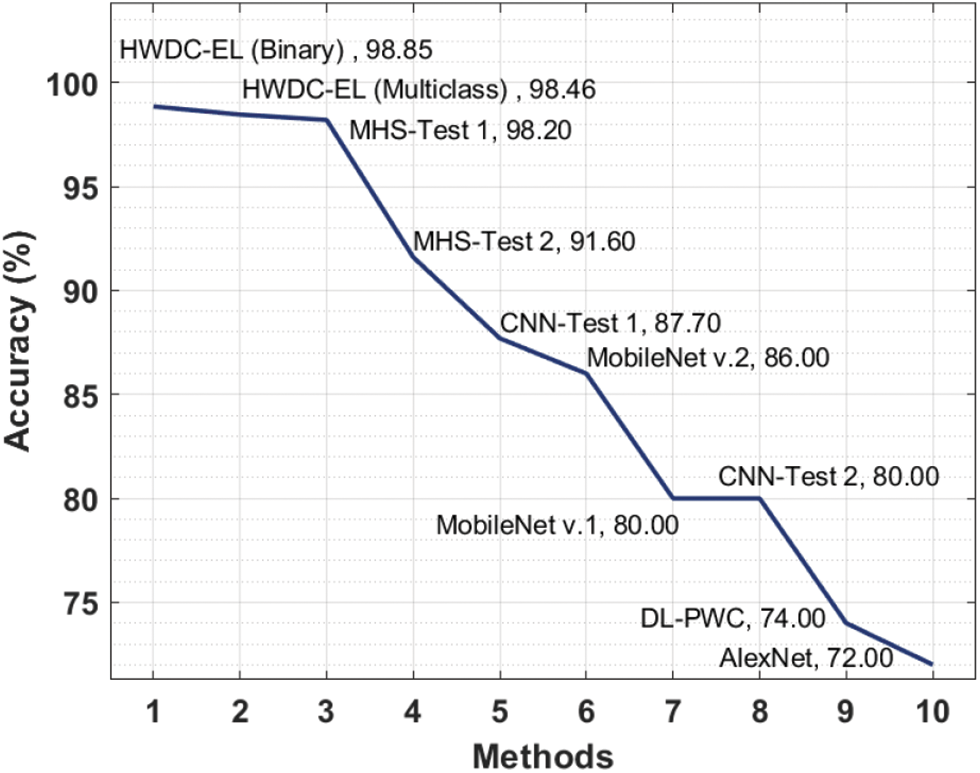
Figure 10: Accuracy analysis of HWDC-EL model with existing approaches
In this study, a new HWDC-EL system is derived for hazardous waste detection and classification. The HWDC-EL technique intends to detect the multiple classes of wastes, particularly hazardous and non-hazardous wastes. The HWDC-EL technique has derived an ensemble of feature extraction processes namely DLBP, EfficientNet, and DenseNet121. Moreover, hyperparameter optimization of EfficientNet and DenseNet121 algorithms takes place using FPA. Finally, a weighted voting based ensemble classifier is derived using SVM, ELM, and GBT models. The experimental validation of the HWDC-EL technique is validated by the use of a benchmark Garbage dataset and the results are inspected interms of diverse aspects. In future, the presented HWDC-EL technique was extended to the design of waste collection scheduling and route planning approaches.
Funding Statement: The authors extend their appreciation to the Deanship of Scientific Research at King Khalid University for funding this work under Grant Number (RGP 2/209/42). Princess Nourah bint Abdulrahman University Researchers Supporting Project Number (PNURSP2022R136), Princess Nourah bint Abdulrahman University, Riyadh, Saudi Arabia. The authors would like to thank the Deanship of Scientific Research at Umm Al-Qura University for supporting this work by Grant Code: (22UQU4210118DSR27).
Conflicts of Interest: The authors declare that they have no conflicts of interest to report regarding the present study.
References
1. J. Bobulski and M. Kubanek, “Deep learning for plastic waste classification system,” Applied Computational Intelligence and Soft Computing, vol. 2021, pp. 1–7, 2021. [Google Scholar]
2. H. I. Abdel-Shafy and M. S. M. Mansour, “Solid waste issue: Sources, composition, disposal, recycling, and valorization,” Egyptian Journal of Petroleum, vol. 27, no. 4, pp. 1275–1290, 2018. [Google Scholar]
3. J. Radziewicz, “Problemy gospodarki odpadami w polsce,” https://rme.cbr.net.pl/index.php/archiwum-rme/13-nr-42/ekologia-i-srodowisko/12-problemy-gospodarki-odpadami-w-polsce. 2019. [Google Scholar]
4. F. S. Alsubaei, F. N. Al-Wesabi and A. M. Hilal, “Deep learning-based small object detection and classification model for garbage waste management in smart cities and IoT environment,” Applied Sciences, vol. 12, no. 5, pp. 1–18, 2022. [Google Scholar]
5. S. P. Gundupalli, S. Hait and A. Thakur, “A review on automated sorting of source-separated municipal solid waste for recycling,” Waste Management, vol. 60, pp. 56–74, 2017. [Google Scholar]
6. F. N. Al-Wesabi, M. Obayya, M. Hamza, J. S. Alzahrani, D. Gupta et al., “Energy aware resource optimization using unified metaheuristic optimization algorithm allocation for cloud computing environment,” Sustainable Computing: Informatics and Systems, vol. 35, pp. 100686, 2022. [Google Scholar]
7. F. Pita and A. Castilho, “Influence of shape and size of the particles on jigging separation of plastics mixture,” Waste Management, vol. 48, pp. 89–94, 2016. [Google Scholar]
8. S. Pandu, A. Francis, P. Sekhar, P. Vijayarajan, A. A. Albraikan et al., “Artificial intelligence based solar radiation predictive model using weather forecasts,” Computers, Materials & Continua, vol. 71, no. 1, pp. 109–124, 2022. [Google Scholar]
9. J. Huang, T. Pretz and Z. Bian, “Intelligent solid waste processing using optical sensor based sorting technology,” Image and Signal Processing (CISP), vol. 4, pp. 1657–1661, 2010. [Google Scholar]
10. S. Pieber, M. Meirhofer, A. Ragossnig, L. Brooks, R. Pomberger et al., “Advanced waste-splitting by sensor based sorting on the example of the MTPlant oberlaa,” Tagungsband Zur, vol. 10, pp. 695–698, 2010. [Google Scholar]
11. A. Hussain, U. Draz, T. Ali, S. Tariq, M. Irfan et al., “Waste management and prediction of air pollutants using IoT and machine learning approach,” Energies, vol. 13, no. 15, pp. 3930, 2020. [Google Scholar]
12. L. Cao and W. Xiang, “Application of convolutional neural network based on transfer learning for garbage classification,” in 2020 IEEE 5th Information Technology and Mechatronics Engineering Conf. (ITOEC), Chongqing, China, pp. 1032–1036, 2020. [Google Scholar]
13. S. Yang, J. Sun, Y. Duan, X. Li and B. Zhang, “Dangerous object detection by deep learning of convolutional neural network,” in Second Target Recognition and Artificial Intelligence Summit Forum, Changchun, China, SPIE, pp. 88, 2020. [Google Scholar]
14. D. Ziouzios, D. Tsiktsiris, N. Baras and M. Dasygenis, “A distributed architecture for smart recycling using machine learning,” Future Internet, vol. 12, no. 9, pp. 141, 2020. [Google Scholar]
15. D. Hua, J. Gao, R. Mayo, A. Smedley, P. Puranik et al., “Segregating hazardous waste using deep neural networks in real-time video,” in 2020 10th Annual Computing and Communication Workshop and Conf. (CCWC), Las Vegas, NV, USA, pp. 1016–1022, 2020. [Google Scholar]
16. O. Adedeji and Z. Wang, “Intelligent waste classification system using deep learning convolutional neural network,” Procedia Manufacturing, vol. 35, pp. 607–612, 2019. [Google Scholar]
17. P. Nowakowski and T. Pamuła, “Application of deep learning object classifier to improve e-waste collection planning,” Waste Management, vol. 109, pp. 1–9, 2020. [Google Scholar]
18. Y. Chu, C. Huang, X. Xie, B. Tan, S. Kamal et al., “Multilayer hybrid deep-learning method for waste classification and recycling,” Computational Intelligence and Neuroscience, vol. 2018, pp. 1–9, 2018. [Google Scholar]
19. L. Nanni, E. D. Luca, M. L. Facin and G. Maguolo, “Deep learning and handcrafted features for virus image classification,” Journal of Imaging, vol. 6, no. 12, pp. 143, 2020. [Google Scholar]
20. T. Kobayashi, “Discriminative local binary pattern for image feature extraction,” in Int. Conf. on Computer Analysis of Images and Patterns, CAIP 2015: Computer Analysis of Images and Patterns, Lecture Notes in Computer Science Book Series, Springer, Cham, vol. 9256, pp. 594–605, 2015. [Google Scholar]
21. M. Tan and Q. Le, “Efficientnet: Rethinking model scaling for convolutional neural networks,” in Int. Conf. on Machine Learning, Long Beach, California, pp. 6105–6114, 2019. [Google Scholar]
22. P. Bansal, R. Kumar and S. Kumar, “Disease detection in apple leaves using deep convolutional neural network,” Agriculture, vol. 11, no. 7, pp. 617, 2021. [Google Scholar]
23. X. S. Yang, “Flower pollination algorithm for global optimization,” in Int. Conf. on Unconventional Computing and Natural Computation UCNC 2012: Unconventional Computation and Natural Computation, Lecture Notes in Computer Science Book Series, Berlin, Heidelberg, Springer, vol. 7445, pp. 240–249, 2012. [Google Scholar]
24. M. F. J. Steel, “Model averaging and its use in economics,” Journal of Economic Literature, vol. 58, no. 3, pp. 644–719, 2020. [Google Scholar]
25. M. Y. Cho and T. T. Hoang, “Feature selection and parameters optimization of svm using particle swarm optimization for fault classification in power distribution systems,” Computational Intelligence and Neuroscience, vol. 2017, pp. 1–9, 2017. [Google Scholar]
26. V. Flores and B. Keith, “Gradient boosted trees predictive models for surface roughness in high-speed milling in the steel and aluminum metalworking industry,” Complexity, vol. 2019, pp. 1–15, 2019. [Google Scholar]
27. K. Hu, Z. Zhou, L. Weng, J. Liu, L. Wang et al., “An optimization strategy for weighted extreme learning machine based on pso,” International Journal of Pattern Recognition and Artificial Intelligence, vol. 31, no. 1, pp. 1751001, 2017. [Google Scholar]
28. Y. Zhang, H. Zhang, J. Cai and B. Yang, “A weighted voting classifier based on differential evolution,” Abstract and Applied Analysis, vol. 2014, pp. 1–6, 2014. [Google Scholar]
Cite This Article
 Copyright © 2023 The Author(s). Published by Tech Science Press.
This work is licensed under a Creative Commons Attribution 4.0 International License , which permits unrestricted use, distribution, and reproduction in any medium, provided the original work is properly cited.
 Downloads
 Citation Tools