
 Submit a Paper
 Propose a Special lssue
 Open Access
ARTICLE

Log Anomaly Detection Based on Hierarchical Graph Neural Network and Label Contrastive Coding
School of Cyber Science and Engineering, Sichuan University, Chengdu, 610000, China
* Corresponding Author: Yijia Xu. Email:
Computers, Materials & Continua 2023, 74(2), 4099-4118. https://doi.org/10.32604/cmc.2023.033124
Received 08 June 2022; Accepted 02 September 2022; Issue published 31 October 2022
 View Full Text
 Download PDF
Abstract
System logs are essential for detecting anomalies, querying faults, and tracing attacks. Because of the time-consuming and labor-intensive nature of manual system troubleshooting and anomaly detection, it cannot meet the actual needs. The implementation of automated log anomaly detection is a topic that demands urgent research. However, the prior work on processing log data is mainly one-dimensional and cannot profoundly learn the complex associations in log data. Meanwhile, there is a lack of attention to the utilization of log labels and usually relies on a large number of labels for detection. This paper proposes a novel and practical detection model named LCC-HGLog, the core of which is the conversion of log anomaly detection into a graph classification problem. Semantic temporal graphs (STG) are constructed by extracting the raw logs’ execution sequences and template semantics. Then a unique graph classifier is used to better comprehend each STG’s semantic, sequential, and structural features. The classification model is trained jointly by graph classification loss and label contrastive loss. While achieving discriminability at the class-level, it increases the fine-grained identification at the instance-level, thus achieving detection performance even with a small amount of labeled data. We have conducted numerous experiments on real log datasets, showing that the proposed model outperforms the baseline methods and obtains the best all-around performance. Moreover, the detection performance degrades to less than 1% when only 10% of the labeled data is used. With 200 labeled samples, we can achieve the same or better detection results than the baseline methods.Keywords
System logs collect information about hardware, software, and system problems and monitor events occurring in the system. Operators can use it to check the causes of errors or to seek out traces left by attackers. However, with the rapid development of information technology and network scale, a large number of logs with complex and variable behaviors means that fault location is inefficient and cannot be found quickly and accurately using only operator manual inspection. Automation of log anomaly detection is part of the current challenge. It can monitor logs in real-time, assist operators in locating the root cause of faults, and improve the efficiency of operations and maintenance.
Log anomaly detection aims to accurately detect abnormal entries in the system logs, and it is essentially a sequence prediction task. Most existing research uses sequence detection models that assume that log sequences follow specific intrinsic patterns. A log sequence that deviates from normal mode is considered an anomalous sequence. These approaches follow the same framework: log parsing, sequence extraction, feature representation, and anomaly detection. For example, QLLog [1] utilized the normal log sequence to train the Q-learning model to construct the Q-table and used the Q-values to determine if a log sequence is abnormal. InterpretableSAD [2] proposed a log data enhancement strategy to automatically generate potential anomalous sequences and trained the detection model, solving the shortage of labeled data.
Although the existing research has achieved good results in some scenarios, there are still some problems: (1) In previous research, semantic sequences were obtained after extracting log sequences and template semantics, and were then input into a temporal convolutional network (TCN) for training [3,4]. The data processed in this way is one-dimensional. The features extracted based on TCN are limited to the temporal dimension, which means they cannot explore the complex structural features presented in log data. In contrast, the graph structure can naturally represent the complex associations between objects and elements, which can better mine the semantic, temporal, and structural features. (2) Existing research focuses only on labels, dividing methods into supervised and unsupervised learning according to whether labels are used for training. However, few researchers have investigated the utilization of labels, although they may have thought about it in their research outlook [5]. Suppose that better detection performance can be obtained by using fewer labeled samples. In that case, the label feature can be fully utilized to facilitate model training and alleviate the labeling and labor consumption problems caused by the large and complicated log data to a certain extent.
To address the above challenges, this paper proposes a graph neural network (GNN) based log anomaly detection model named LCC-HGLog, which combines the strengths of Label Contrastive Coding and Hierarchical Graph Neural Network. A graph representation is constructed based on the time-series within the log events, and the semantic vectors obtained from the log templates are used as node attributes. The combination of hierarchical graph neural network refines the structure of the log semantic temporal graph to ensure the integrity of the topological information. Thus, the semantic, temporal and structural features of the raw logs are fully explored, and feature learning is performed in multiple dimensions to achieve a more accurate detection effect. The model learns better instance-level discriminative information by introducing label contrastive coding, thus making fuller use of label features. High detection performance is also achieved on small labeled sample datasets, taking full advantage of supervised learning while eliminating the need for large sample labeling.
The contributions of this work are summarized as follows:
• This paper proposes a new log composition method to extract the sequences and semantics in logs and construct them as log semantic temporal graphs to deeply explore the complex associations of log data. Specifically, the raw logs are partitioned to obtain sequences of log events. Using log templates as nodes, the semantic features of the templates are attributes of the nodes, and the relationships between log event sequences form edge connections. Thus, log anomaly detection is converted into a graph classification problem.
• This paper proposes a log anomaly detection model named LCC-HGLog. A graph classifier HP-SAGE composed of a sample and aggregate convolution operator (SAGE) and a hierarchical graph pooling operator is built to learn graph structure more finely and get better classification results. Label contrastive coding is introduced to employ label features more efficiently and thoroughly at the instance-level, allowing for comparative performance with fewer labeled samples.
• This paper conducts extensive experiments on two datasets to evaluate LCC-HGLog. The results show that the proposed model is superior to the baseline methods, and the F1-score is above 99% in both datasets. It can competently combat the imbalance problem in the Hadoop Distributed File System (HDFS) dataset and achieve high accuracy for all classification categories. Furthermore, over 97% accuracy can be achieved using only 200 labeled samples.
The remaining paper is structured as follows: Section 2 presents the related work, and Section 3 introduces the technical background. Section 4 describes the details of the proposed log anomaly detection model LCC-HGLog. Section 5 presents the experiments and analyses. Section 6 summarizes the conclusion and proposes future work.In recent years, log anomaly detection has become a hot research topic. Many kinds of approaches have been proposed, broadly classified into rule-based, sequence-based, and graph-based anomaly detection methods.
The rule-based anomaly detection method is to design regular expressions by counting the frequency of keyword occurrences in massive logs combined with expert experience. Then, it detects log anomalies according to the degree of rule matching. Reference [6,7] are examples of creating rule sets by analyzing log events, which can determine anomalous entries. However, limited by expert knowledge, the rule-based method may be imperfect, with low automation and high labor costs. In addition, it needs to be updated from time to time. Otherwise, new types of anomalies cannot be found.
The sequence-based anomaly detection method extracts the execution sequence characteristics of log data, assuming that these sequences follow a specific execution pattern. LogCluster [8] and Log3C [9] used clustering algorithms to group log sequences into a knowledge base, and only the representative log sequences need to be examined, improving recognition efficiency. However, this anomaly detection strategy is too coarse-grained. It depends heavily on the clustering effect, but the primary purpose of the clustering algorithm is clustering and not for anomaly detection. Sequence-based deep learning modeling has gradually become a hot research topic since Du et al. [10] proposed DeepLog. Wang et al. [11] introduced a multiscale single-class recurrent neural network named OC4Seq for detecting anomalies in discrete log event sequences. However, they encoded the templates using one-hot vectors and could not learn the semantic similarity between different templates. To solve the above problem, Meng et al. [12] proposed Template2Vec, which can learn the semantic similarity between templates. However, Template2Vec cannot process new vocabulary out-of-vocabulary in the log. Through empirical studies, Zhang et al. [13] showed that log data was unstable and proposed LogRobust, which solved the problem of log data instability by extracting semantic vectors of log events. Le et al. [14] omitted log parsing. They detected anomalies by representing raw log messages as semantic vectors, which were input to a transformer model. Nevertheless, it is based on a weighted aggregation of word vectors, which may lose the semantic relations of word order and cannot maintain a unique representation. To solve this problem, Liu et al. [15] designed a theme word order-preserving method to ensure the log word order and unique representation. They used long short-term memory (LSTM) to extract the temporal features of sequence data. Considering that deep learning algorithms require high computational power and it is difficult to achieve real-time detection on edge devices, Wang et al. [3] proposed LightLog. This lightweight log anomaly detection method constructed a low-dimensional semantic vector and trained a lightweight TCN model.
In recent years, research targeting graphs has received increasing attention due to the ability of graph structures and algorithms to more naturally represent the association relationships of data. The graph-based log anomaly detection method reconstructs the execution order in the raw log into a graph representation. Jia et al. [16] mined time-weighted control flow graphs (TCFG) from logs. Using log templates as nodes, edge relations were obtained by computing frequent successor groups and immediate successors for each template. The normal execution flow between the modeled logs was modeled, and an exception alert was issued when the input deviated from the hybrid graph model. The precision of service topology mining and the recall of TCFG mining can be further improved by using more advanced methods for anomaly detection. Liu et al. [17] proposed a heterogeneous graph embedding-based network attack detection method called Log2vec, which converted log entries into heterogeneous graphs based on their relationships and learned graph representations using graph embedding algorithms. Wan et al. [18] proposed a graph-based model named GLAD-PAW, adding a position-aware weighted graph attention layer and converting log sequences into session graphs. It is the first study to apply graph neural networks to the task of log anomaly detection.
Another way to classify anomaly detection is to divide it into supervised and unsupervised learning. To solve the issue of lack of labeled log data, some unsupervised log anomaly detection methods [19–21] have been proposed, which have two significant steps: anomaly scoring and anomaly decision. However, unsupervised learning methods do not make full use of labeling features, and the algorithms do not know the exact output in advance, so the effectiveness is doubtful. Yang et al. [22] combined the advantages of supervised and unsupervised learning. They proposed a semi-supervised method of probabilistic label estimation based on historical anomaly information and benefited from the idea of positive-unlabeled learning.
In summary, this paper differs from the above work in the following ways. First, log data processing in the above studies is primarily one-dimensional, making exploring more complex associations among log data challenging. However, this paper abstracts the graph structure from log events and adds semantic features compared to GLAD-PAW, thus allowing better log anomaly detection by combining semantic, temporal and structural features. Second, a classifier with hierarchical graph learning and label contrastive encoding is introduced to thoroughly learn and exploit the whole graph structure and label features. Take advantage of the unique advantages of graph neural networks in learning the topology of graphs to solve the problem of data imbalance. This paper focuses on label utilization, aiming to achieve high detection performance in small labeled sample datasets and alleviate the problem of time-consuming and laborious data labeling.
Anomaly detection is sorting out instances that significantly deviate from the majority of data [23]. Log anomaly detection identifies log entries in system logs that do not conform to the normal pattern of the system. Possible errors, faults, or failures in the software system are typical forms of anomaly manifestations [24].
Due to the massive success of deep learning in areas such as images and text, researchers have started to focus on modeling graph data with deep learning. Thanks to the research on graph data modeling methods [25–28], this paper transforms log anomaly detection into a graph classification problem. There are two major categories of graph classification methods: similarity-based and graph neural network-based [29]. After converting the raw logs into the graph structure, graph neural network-based methods first perform multiple feature transformations on these graphs employing convolutional operations and then perform pooling operations to reduce the scale of the graphs. It can be repeated several times, resulting in a complete graph representation for classification. Thus, the category label of the unknown graph can be predicted, which is a graph binary classification problem. More specifically, it is possible to express that the research objective is to learn a classification function
With success in self-supervised representation learning in computer vision, contrastive learning is gradually gaining the attention of researchers. Intuitively, contrastive learning can be regarded as learning by comparison. It focuses on learning the standard features between similar instances and distinguishing the differences between non-similar instances. Fig. 1 shows a simple contrastive learning framework. The dataset is divided into a positive sample set, an anchor point, and a negative sample set. Contrastive learning is designed to learn an encoder by contrastive losses. The encoder draws the encoding results of positive samples and anchor points closer together, making the encoding results of negative samples and anchor points far away. The formula is expressed as follows:
where
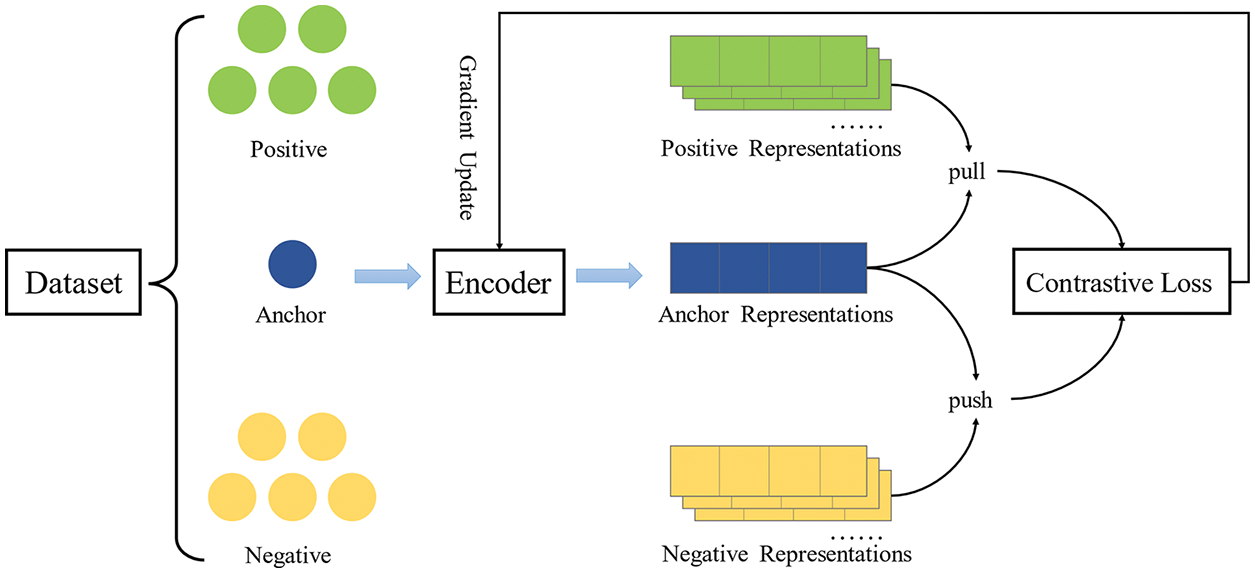
Figure 1: A framework for contrastive learning
In this section, a log anomaly detection framework named LCC-HGLog is introduced. Inspired by GNN [30], LCC-HGLog utilizes graph neural networks for log anomaly detection. Fig. 2 shows the framework of LCC-HGLog, which is comprised of three components: log event sequence extraction, semantic temporal graph construction and anomaly detection. As mentioned earlier, log sequences and semantics are essential features for detecting log anomalies. First, log event sequences are extracted from raw logs by log parsing and log partition (Section 4.1). The graph structure can combine the features and structures of nodes to learn better graph representations through propagation and aggregation. After obtaining the semantic vector of logs from the semantic embedding, this paper constructs the semantic temporal graph as the input for the next step (Section 4.2). A hierarchical graph neural network to further learn the semantic, temporal and structural features of log semantic temporal graphs, along with label enhancement based on label contrastive coding to perform better with less data (Section 4.3).
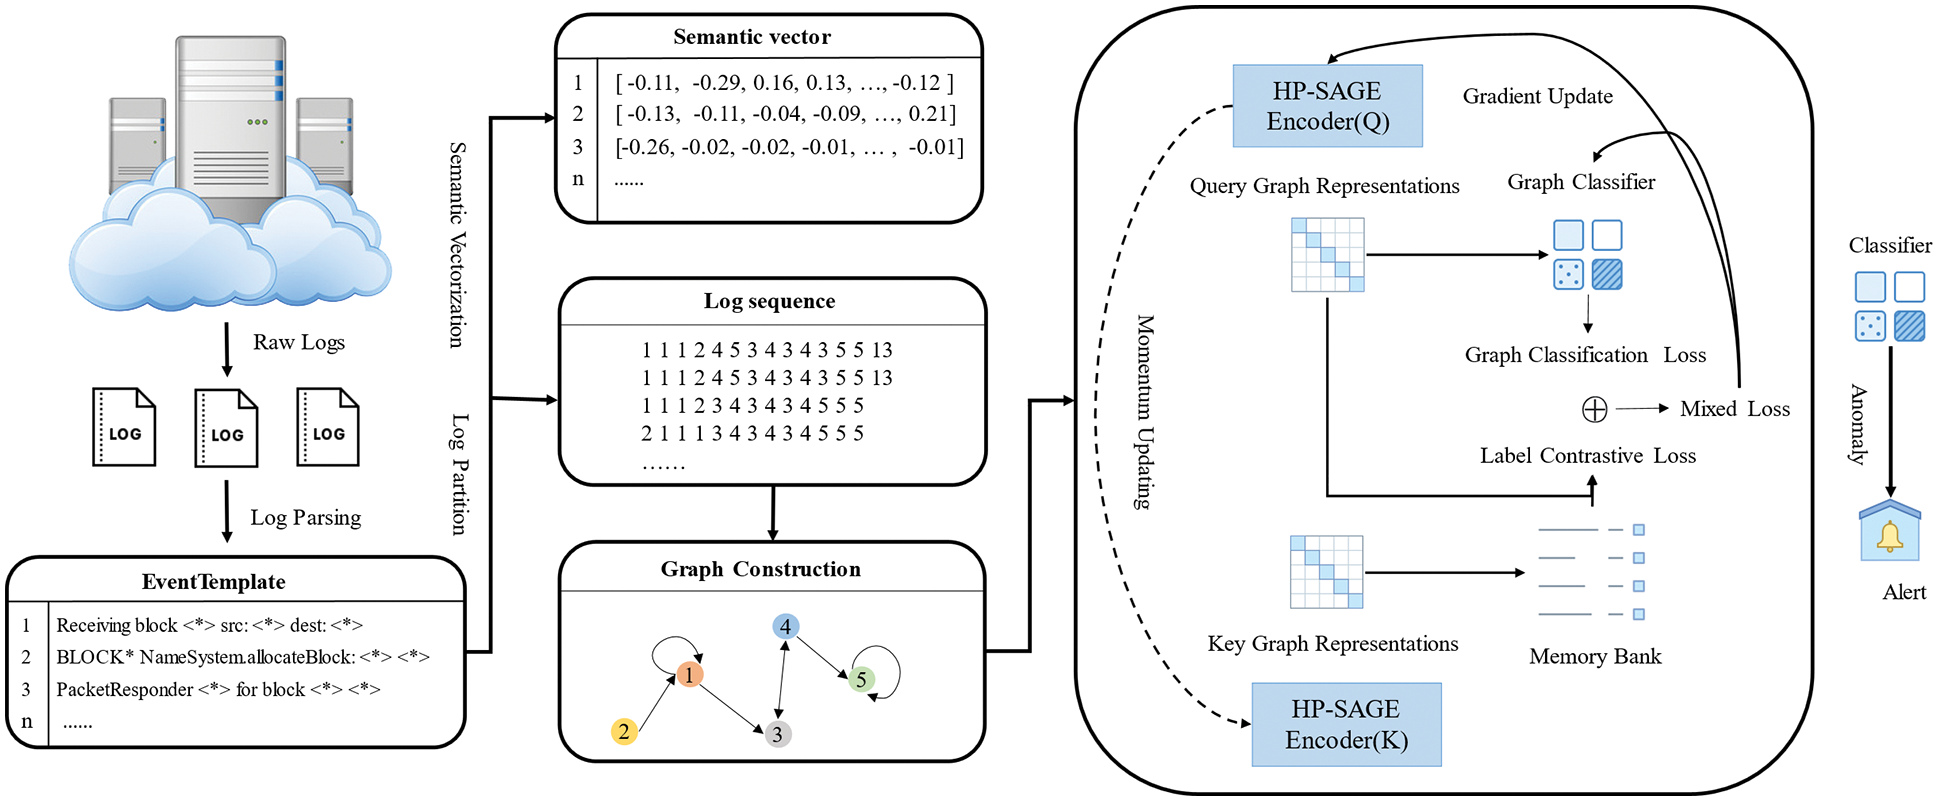
Figure 2: The architecture of LCC-HGLog
4.1 Log Event Sequence Extraction
Log Parsing. Raw logs are unstructured data and consist of two parts: variables and constants. Log parsing is converting raw logs into structured text to extract log templates. In practice, LCC-HGLog uses the advanced Drain [31] method, which is widely used in existing log anomaly detection research [22,32] and has been proven accurate and efficient. Fig. 3 shows an example of log parsing, which converts the information contained in logs into a format that facilitates log analysis. The EventTemplate field is the extracted log template, which extracts the log’s constant part and uses a placeholder <*> to represent the variable part.
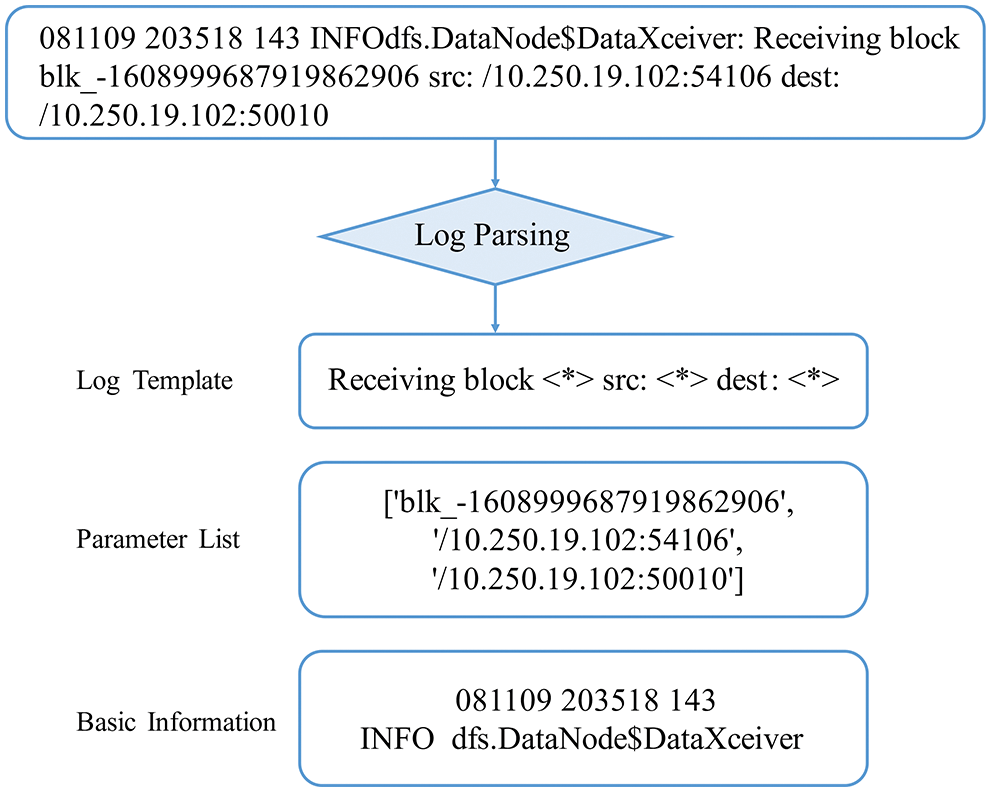
Figure 3: An example of log parsing
Log Partition. After extracting the log templates from raw logs, log event sequences must be extracted according to specific criteria, which are the fundamental units for extracting features. Logs are usually divided into groups using log identifier or log timestamp, and each group represents a sequence of log events [33]. In this paper, different log partition methods are used for different datasets. Merge or split log entries into log event sequences in the HDFS dataset according to the log identifier block_id. For the BlueGene/L (BGL) dataset, a fixed window strategy is used since there is no similar identifier in the dataset. Each item in the log event sequence is a log entry, and the event templates are numbered sequentially from 1 to get the template ID.
4.2 Semantic Temporal Graph Construction
Semantic Vector Extraction. Log semantics are not fully exploited if log entries are distinguished only by log sequences. So, following existing work [13], the log templates are converted into semantic vectors by extracting semantic information from log templates. Consider each log entry as a natural language sentence and first remove the non-character tokens and stop words. Then the compound tokens are decomposed into individual words according to the Camel Case [34]. The intrinsic relationships between words are captured using the FastText algorithm based on the Common Crawl corpus, which is mapped into a
After converting to a 300-dimensional semantic vector using the FastText algorithm, a more concise semantic feature representation is obtained by applying the post-processing algorithms (PPA) borrowed from the paper [35], which can reduce the computational burden. First, a 20-dimensional word embedding representation is constructed using the dimensionality reduction technique based on principal component analysis. Then the PPA algorithm is applied to delete the mean vector and control the word embedding direction. According to the literature, the number of removed feature directions is set to 7. Finally, a low-dimensional semantic vector representation is obtained. This operation can effectively reduce the computational burden when the detection method is deployed on devices with limited computational resources.
Graph Construction. To effectively perform a correlation analysis of log anomalies with the help of GNN, this paper first models the rich correlations among log sequences by constructing semantic temporal graphs. Each log event sequence is converted into a semantic temporal graph.
4.3 Log Anomaly Detection Model
Graph Classification Loss. GNN with convolutional and pooling layers has attained notable progress in various challenging tasks to improve the accuracy of graph classification with end-to-end learning.
The convolution operator uses the SAGE proposed by [36] to extract the features of the graph. Compared with graph convolutional network (GCN), SAGE truly achieves message aggregation in the local area and applies GNN on extensive graph data in an absolute sense. The propagation of nodes is computed as follows:
where
The pooling layer is equally important, applying a new Hierarchical Graph Pooling with Structure Learning (HGP-SL) proposed in [37] to aggregate the features to obtain a representation of the whole graph for classification. HGP-SL can adaptively select a subset of nodes to form induced subgraphs in subsequent layers. A sparse attention structure learning mechanism is invoked to learn the optimized aggregated graph structure at each layer, which solves the problem that GNN lacks hierarchical aggregated node information. Each node is scored according to the Manhattan distance between the node representation itself and its neighbors, and then graph pooling is completed by node selection.
where
Thus, for each log semantic temporal graph
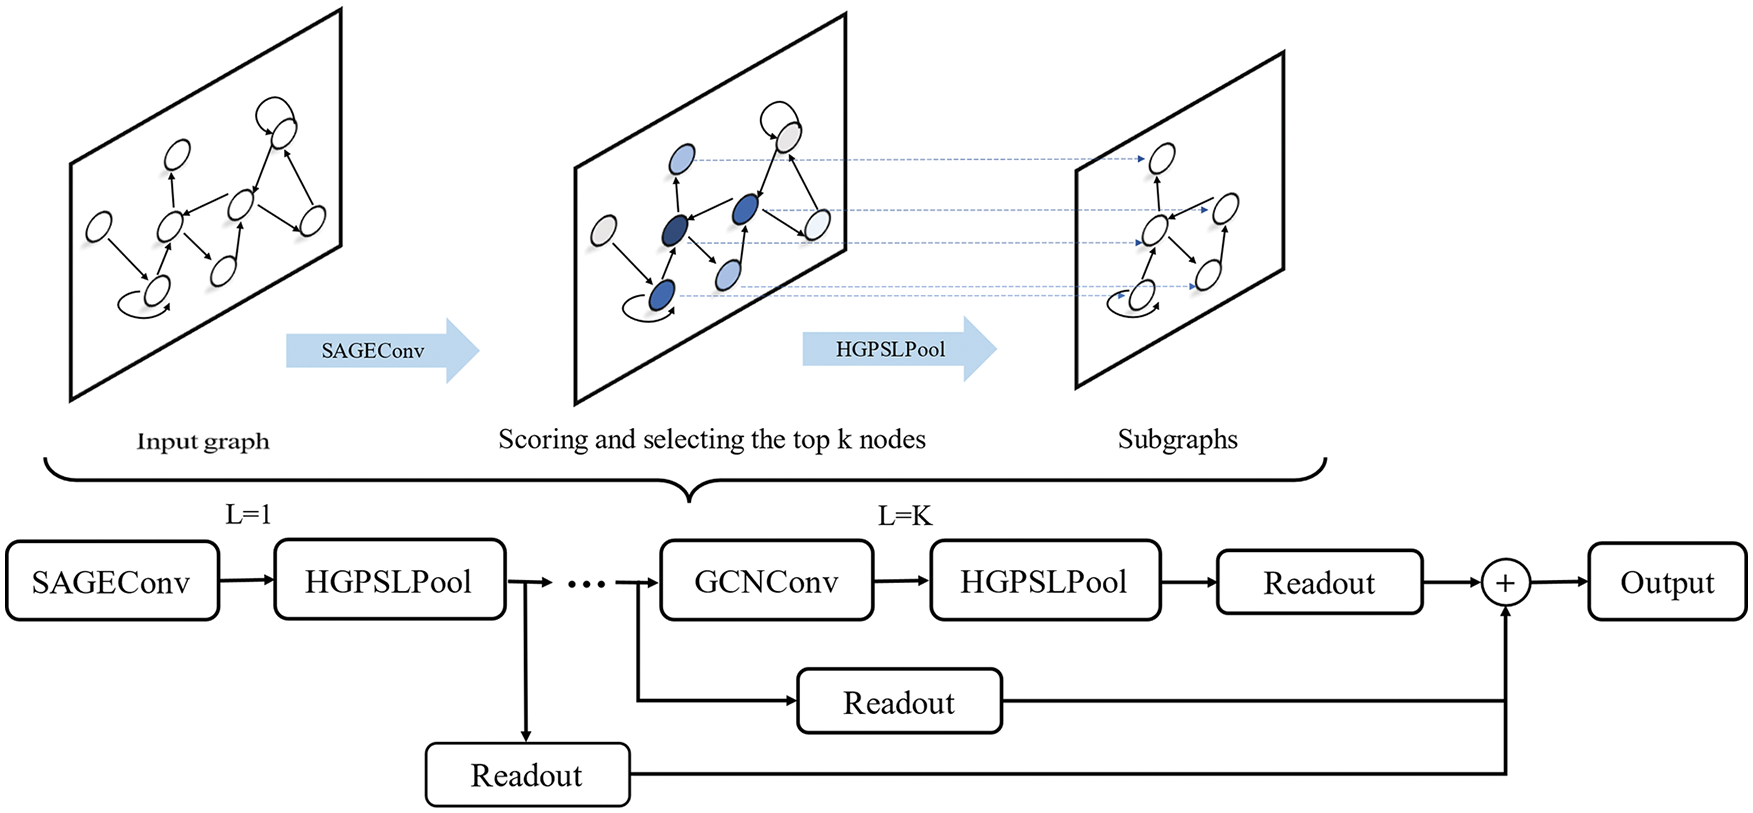
Figure 4: The framework of the HP-SAGE model
The graph level representation is input to the classifier for prediction and uses the cross-entropy function to compute the graph classification loss in this paper:
where the parameters have the same meaning as Eq. (10).
Label Contrastive Loss. The standard graph classification approach is to input a whole graph’s representation vector into a classifier to predict the label of the graph, which pays attention to the discriminability at the class-level and neglects the discriminability at the instance-level. In fact, the finer granularity of discriminative information between instances facilitates the graph classification task. In addition, the current log data is cumbersome and difficult to label, and how to subtract the reliance on label features in anomaly detection is one of the current difficulties. Therefore, label contrastive coding [38] is introduced to improve the intra-class separability of instance-level by using label contrastive loss.
Constructing the set of positive and negative samples is the core of contrastive learning. When applying label contrastive coding to graph classification tasks, it is for training data imported with available label information. Therefore, the two samples with the same label are considered to be similar pairs, and the two samples with different labels are considered to be dissimilar pairs. Similar to MoCo [39], the graph is divided into query graphs and key graphs, which are input to two graph encoders composed of HP-SAGE to obtain the low-dimensional key graph representation k and query graph representation q, respectively. Multiple key graphs and corresponding labels form a key graph queue
The formula of feature representation by label contrastive loss is calculated as follows, and it is essentially in the form of a contrastive loss function named InfoNCE [40].
where
LCC-HGLog Detection Model. The losses obtained from the first two steps are summed up to obtain the final mixed loss:
where
In this way, label contrastive loss contributes to tightness within each log semantic temporal graph category, and graph classification loss ensures the discriminability between normal or abnormal log semantic temporal graph samples.
In this chapter, the following research questions are answered experimentally:
• RQ1: Does the proposed LCC-HGLog approach achieve state-of-the-art performance?
• RQ2: Does each main component contribute to LCC-HGLog?
• RQ3: Is LCC-HGLog superior in detection on small datasets?
5.1 Datasets and Evaluation Metrics
This study evaluated LCC-HGLog using a publicly available log dataset maintained by loghub [41], which has been widely used in current research on log anomaly detection.
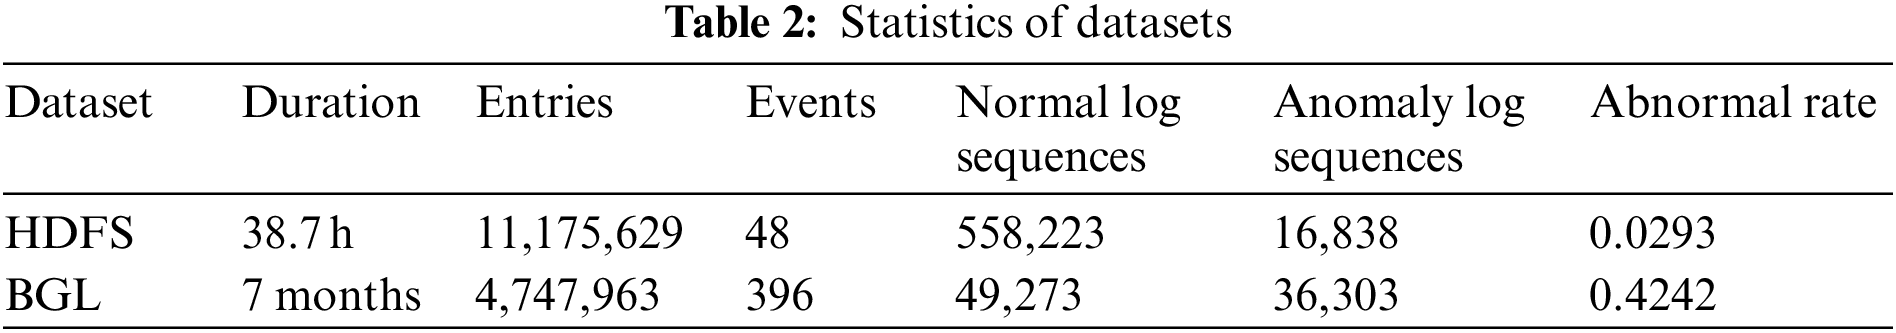
HDFS dataset is collected from a Hadoop cluster running on Amazon’s EC2 platform. It contains two days of runtime and 11,175,629 log entries, but the percentage of abnormal logs is only 2.9%. The label features are manually tagged by Hadoop experts. The logs were split into different log event sequences using the log identifier block_id in this paper.
BGL dataset has been gathered from a BlueGene/L supercomputer system, with 7 months and 4,747,963 log entries. This paper used a fixed window strategy to extract log event sequences. If there is at least one abnormal log, the log event sequence is marked as an exception.
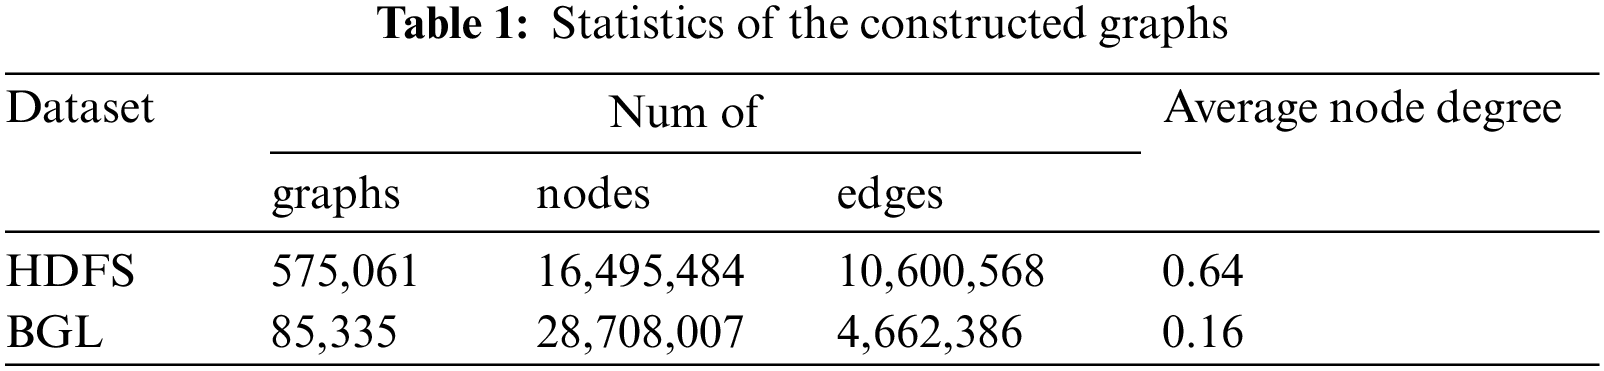
Similar to existing research, the datasets were split into a training set, a validation set, and a test set following a 7:1:2 ratio, to evaluate the performance of a graph-based anomaly detection approach. The specific statistical information of the two datasets is shown in Table 2.
To better evaluate the effectiveness of LCC-HGLog in log anomaly detection, Precision, Recall, and F1-score are used as evaluation metrics, and they are calculated as follows:
where
5.2 Baselines and Implementation Details
This paper compared the LCC-HGLog model with the following baselines:
• Isolation forest (iForest) [42]. Rather than focusing on analyzing normal instances, iForest is an anomaly detection method that separates anomalies near the tree’s root by constructing isolation trees.
• Principal Component Analysis (PCA) [43]. PCA uses the widely used message count vectors and the state ratio vectors to group parsed log messages and employs dimensionality reduction to retain the most important features for log anomaly detection.
• Invariant Mining (IM) [44]. IM is based on statistical learning methods for anomaly detection using sparse and integer invariants automatically mined from logs.
• LogCluster [8]. LogCluster introduces clustering into log anomaly detection by converting log sequences into vectors and assigning weights to different sequences’ events. Then extract representative log sequences into the knowledge base based on the similarity between the sequences.
• Deeplog [10]. Deeplog uses a LSTM model to learn normal log sequence relationships. For a given log sequence, the LSTM model predicts the probability of the next log key in the sequence.
• LogAnomaly [12]. LogAnomaly considers log semantic information first and designs a template representation method called Template2Vec. It converts log sequences into template vector sequences and then inputs them into LSTM models for training, enabling the sequential and quantitative anomalies to be detected simultaneously.
This paper conducted the experiments on a Linux server with Intel E5-2680 v4@2.4 GHz CPU and NVIDIA RTX 2080TI GPU, running with Python 3.8 and PyTorch 1.10.1. For the training process, the epochs were set to be 100 with an early stop mechanism, Adam was chosen as the optimizer, and the learning rate was set to be 0.001. The batch size was set to 32. For the graph classifier HP-SAGE, which was the encoder of the LCC-HGLog model, the dimension of the hidden layer was set to 128 and the pooling ratio was 0.5. In addition, the momentum weight
5.3 RQ1: Comparison with Baseline Models
In this paper, experiments were conducted on HDFS and BGL datasets to compare the proposed LCC-HGLog with baselines. Table 3 shows the detailed experimental results, and it can be seen that LCC-HGLog achieves state-of-the-art detection on both datasets, with an F1-score of 0.999 on both the HDFS and BGL datasets. After experiments, it was found that, on average, after 30 epochs, the model training was finished, which took about 45 min. In the detection phase, it took about 40 seconds. The time consumption is acceptable in practice since the model is offline during the training phase. It can be used for log anomaly detection when the model training is completed, and thus this time consumption is acceptable in practice.
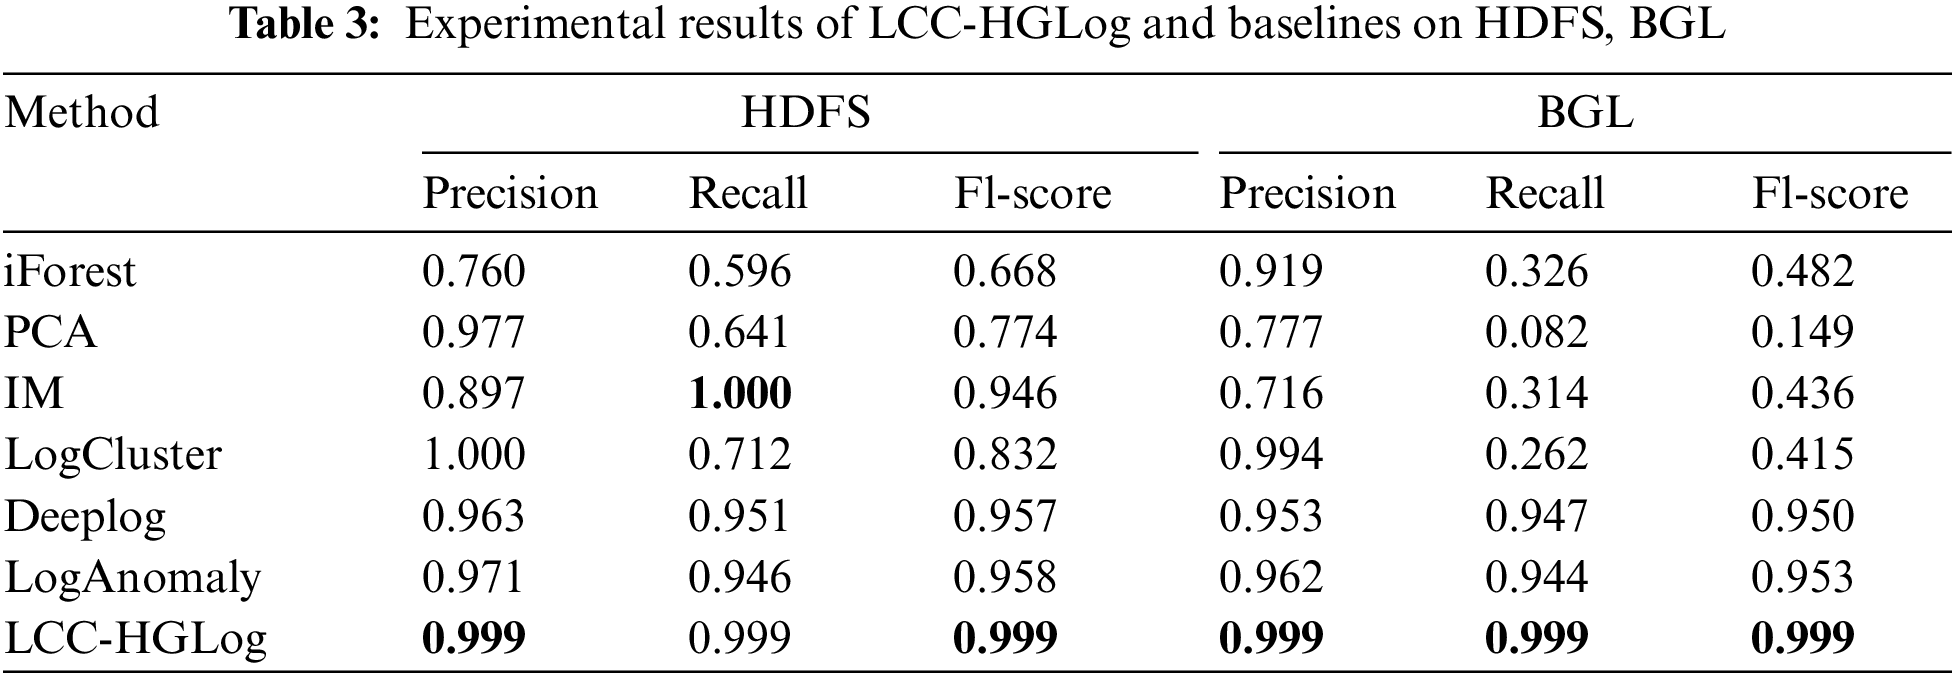
The iForest, PCA, and IM models are not effective in detection. They can achieve high accuracy values but perform poorly in recall and F1-score. They use the statistical features of log data for anomaly detection and ignore the transformation information between log sequences. Both the above methods and LogCluster have the problem that the detection effect varies significantly on different datasets, which hinders the practical application of the method. This may be because they require parameter tuning for the features of different datasets, relying on a priori knowledge. Deeplog and LogAnomaly are deep learning-based detection methods. They achieve good detection results compared to traditional methods, indicating that deep learning has a great advantage in learning the inherent patterns of log sequences. However, both of them use LSTM models, which cannot eliminate the problem that they cannot compute in parallel and the gradient still vanishes after the sequence length exceeds a certain limit.
The LCC-HGLog model can effectively balance precision and recall, which is reflected in the F1-score metric. The F1-score is a weighted harmonic average of the two parts, and the closer the value is to 1, the better the performance is. The F1-score of each method in the two datasets is shown in Fig. 5, and it can be seen that LCC-HGLog has the best detection effect among all methods on both datasets. The performance of the LCC-HGLog model in each category is visualized through the confusion matrix, as shown in Fig. 6. In both datasets, 100% of normal samples are correctly classified, and the percentage of abnormal samples misclassified as normal samples is only 1%. This is because the LCC-HGLog model maps the raw logs into graph structures and uses GNN to fully explore and correlate the semantic, temporal and structural features, distinguishing positive and negative samples more effectively. At the same time, label contrastive coding can focus on instance-level discriminability, which makes the intensity of discriminant information finer and more conducive to the graph classification task. Meanwhile, LCC-HGLog uses GNN to avoid the process of manually adjusting parameters based on experience, and the detection is more intelligent and efficient.
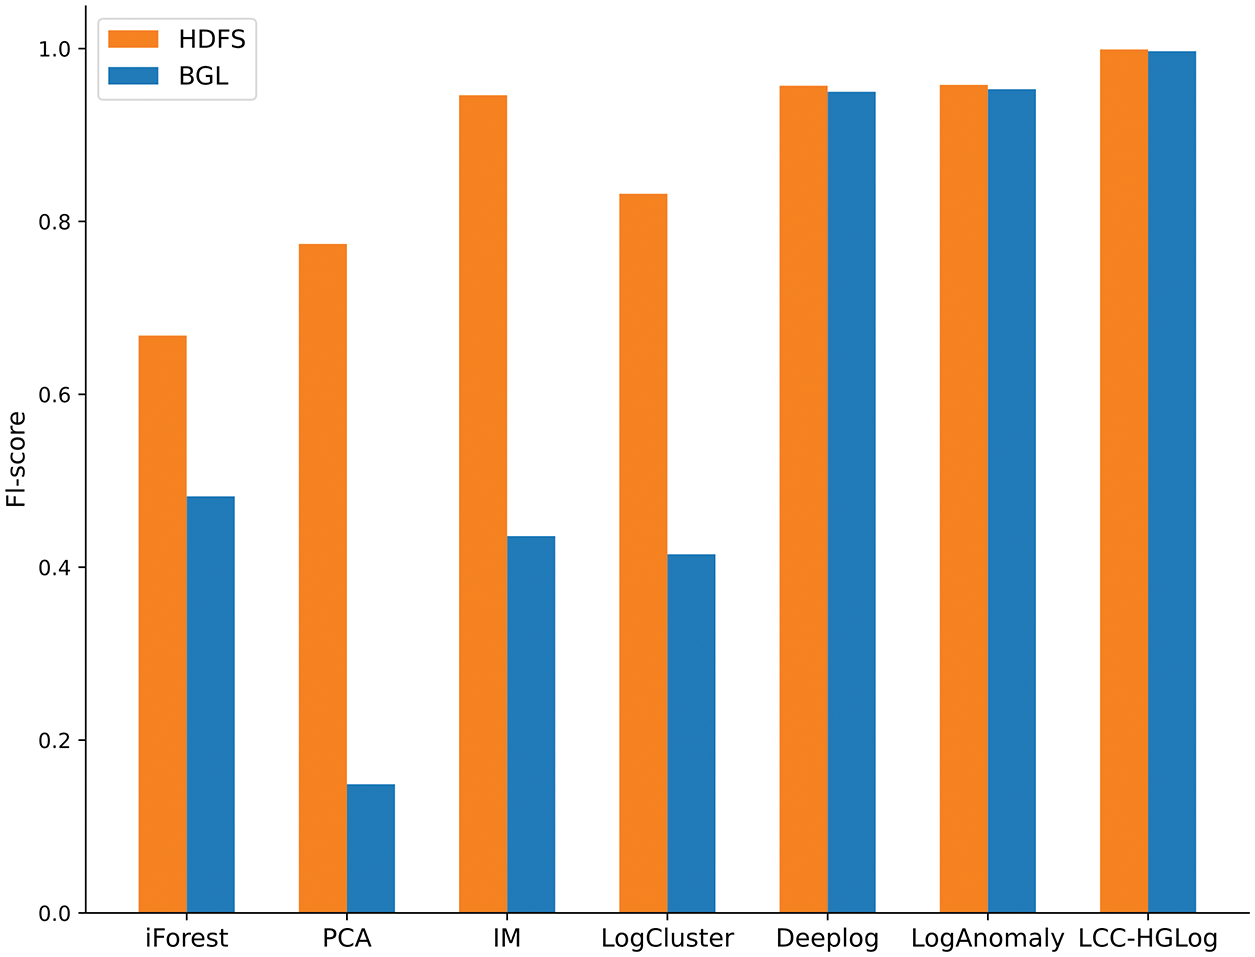
Figure 5: A comparison of F1-score under different methods
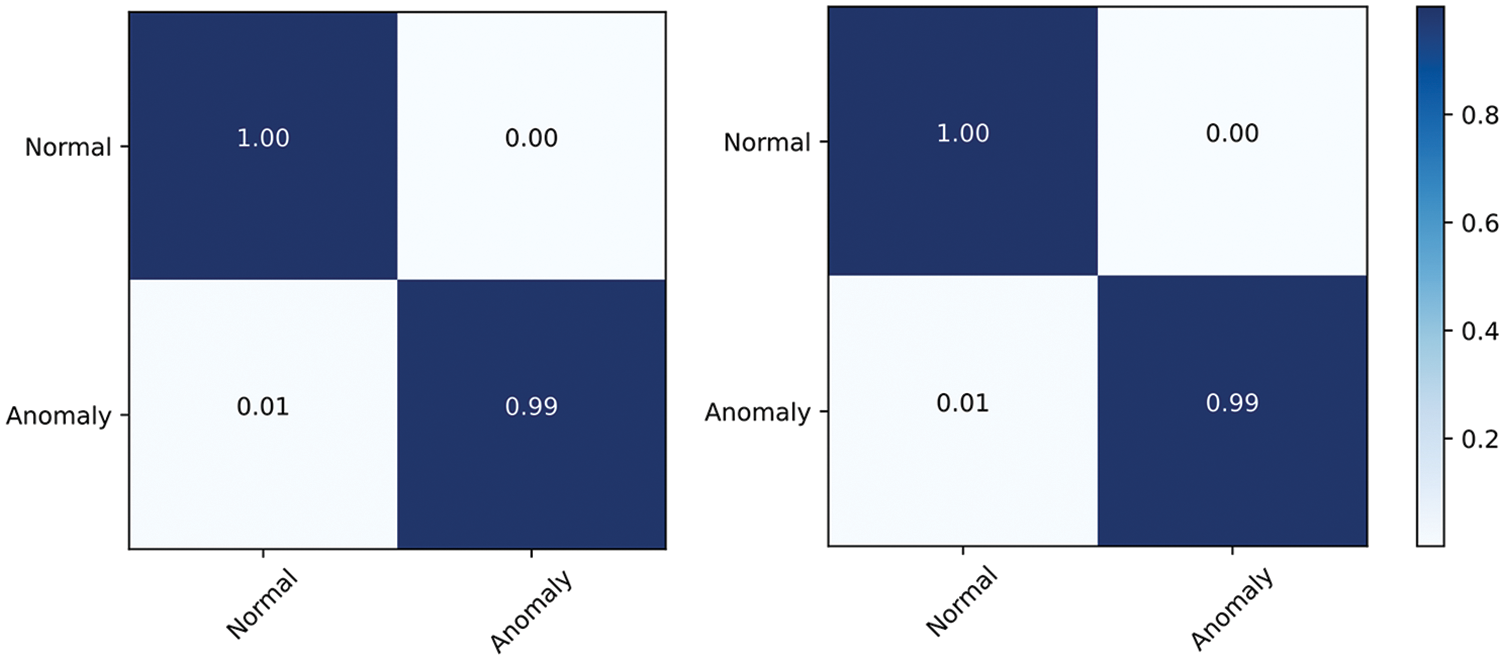
Figure 6: A comparison of confusion matrix under different dataset
5.4 RQ2: Contribution of Main Components
LCC-HGLog constructed a graph classifier HP-SAGE for log semantic temporal graphs by incorporating semantic features on top of sequence features. Also, label enhancement was performed using label contrastive coding to detect anomalies in small labeled samples. Based on this, the following variants were constructed to verify the contribution of the main components to the detection effectiveness:
• LCC-HGLogsubS: Removed the semantic feature component. Specifically, set the node features of the log semantic temporal graph to 0 to verify the contribution of semantic features in anomaly detection.
• LCC-HGLogsubHG: Removed the SAGE and HGP-SL operators from the graph classifier and used the plain GCN instead.
• LCC-HGLogsubLC: Removed the label contrastive encoding component and directly used the proposed graph classifier HP-SAGE for anomaly detection.
Fig. 7 shows the experimental results of LCC-HGLog and its variants. As can be seen from the figure, the detection effect of the LCC-HGLog model that retains all components achieves optimal detection results for precision, recall, and Fl-score on both datasets. It confirms the contribution of semantic features to constructing a complete log temporal graph and the ability of label contrastive coding for more comprehensive learning of label features. The detection effect of LCC-HGLogsubS with node semantic features removed at composition is greatly reduced with a 4.24% reduction in Fl-score on the HDFS dataset and a 58.61% reduction on the BGL dataset, confirming the necessity of semantic features. When node attributes are missing and using only temporal and structural features, the graph classifier cannot effectively learn complex associations in the graph structure. The detection effect of LCC-HGLogsubHG with the SAGE and HGP-SL operators removed and the contrastive encoding module retained is slightly lower than LCC-HGLog but still better than the previously mentioned baselines. The reason is that label contrastive encoding requires the help of an encoder, so a simple GCN model still needs to be built as a classifier. Although a plain GCN is used here, it still facilitates the learning of graph features owing to the excellent learning and inference capabilities of graph neural networks. LCC-HGLogsubLC with the label contrastive encoding component removed is almost the same as that of LCC-HGLog. This is because the data volume is large enough for the graph structure to mine complex correlations from the log data. Thus, the graph classifier HP-SAGE can better learn the deep temporal, structural features and semantic attribute features of nodes for each semantic temporal graph. The absence of label contrastive coding has little effect on the results. In RQ3, a small sample of data is used to further verify the usefulness of the two components.In addition, some supplementary experiments were done in this paper:
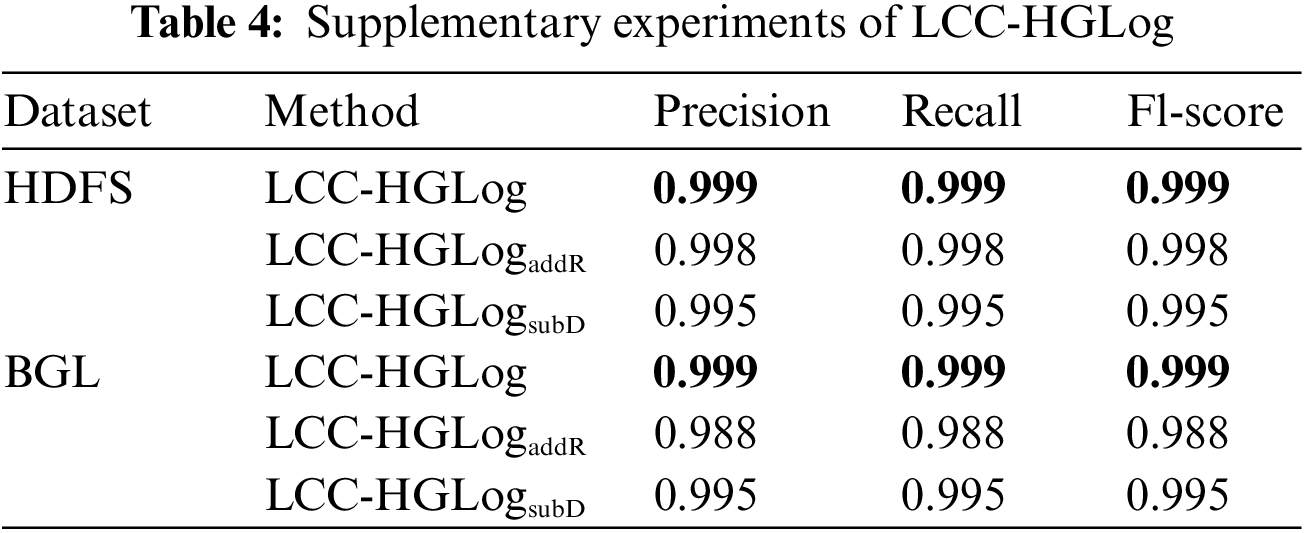
• LCC-HGLogaddR: Added the semantic dimensionality reduction component. Specifically, the PPA dimension reduction technology was used to obtain a 20-dimensional semantic vector to test the influence of semantic dimension reduction.
• LCC-HGLogsubD: Used only 10% of the data for training and 10% of the data for validation to verify the ability of the label contrastive encoding component in learning more comprehensive information about the label.
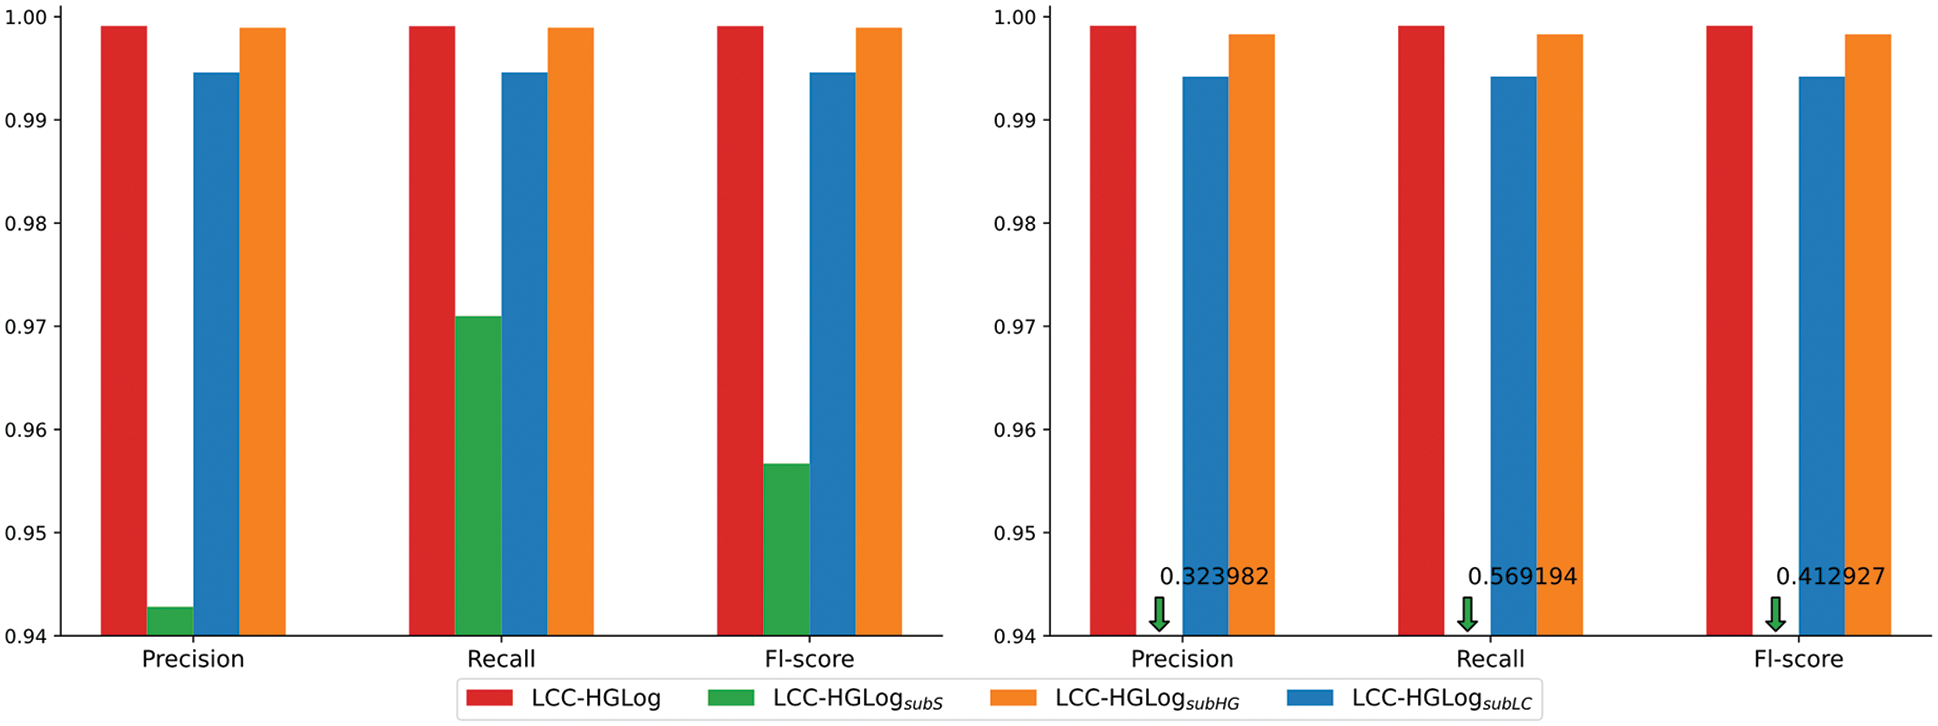
Figure 7: Experiment results between variants of LCC-HGLog, HDFS(left), BGL(right)
The results are shown in Table 4. After reducing the semantic features from 300 to 20 dimensions, the detection results are slightly reduced, but their memory usage was reduced to 1/2–1/3 of the original, which reduces the computational burden. In practice, the dimensionality of the semantic vector can be chosen according to the capabilities of the device. When using only 10% of the data for training, the detection results are 0.45% lower in Fl-score on the HDFS dataset and 0.41% lower in Fl-score on the BGL dataset compared with 70% of the data for training. It effectively evidences that the LCC-HGLog model can achieve good detection results using only a small amount of labeled data.
5.5 RQ3: Label Utilization and Parameters Analysis
The above experiments show that LCC-HGLog and its variants detect better than baselines. The reason is the large number of log datasets combined with the superior ability of graph neural networks to learn features. In the supplementary experiments, the detection effect is reduced by less than 1%, using only 10% of the data for training. The reason is that the amount of HDFS and BGL data used is large enough that 10% of them is also nearly 9,000, which is perfectly sufficient for better-designed deep learning. This paper conducted experiments on a small dataset to further investigate the contributions of the graph classifier and label contrastive coding. Where the core idea of the GCN model was derived from [45], the validation set was set to 10% of the dataset, and the rest were test sets. The specific results are shown in Fig. 8.
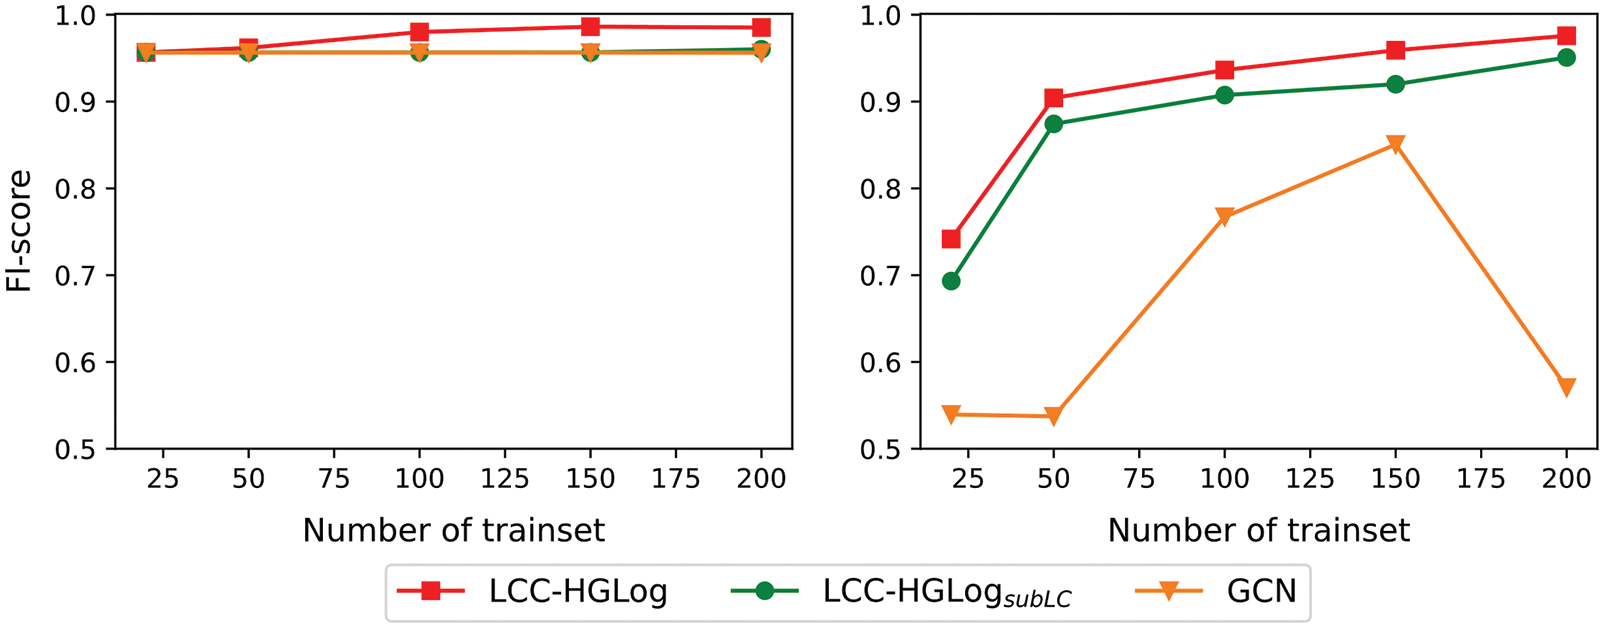
Figure 8: Experiment results on small datasets, HDFS(left), BGL(right)
As shown in Fig. 8, the F1-score of LCC-HGLog is above 90% using 50 samples and above 97% using 200 samples. By analyzing the confusion matrix, it is found that the model can discriminate well for both positive and negative samples. This fully confirms that the proposed model improves the utilization of labels and can train stable, applicable models using only a small amount of labeled data. The effect of LCC-HGLogsubLC, i.e., using only the graph classifier HP-SAGE, is about 2% lower than that of LCC-HGLog at each data level on both datasets. However, by analyzing the confusion matrix of HDFS dataset results with less than 3% of anomalous samples, the classification accuracy for anomalous samples is low, indicating that it is difficult to resist the sample imbalance problem. The GCN, on the other hand, cannot achieve good convergence due to the small amount of data. Although the F1-score is high on the HDFS dataset, the confusion matrix analysis finds that this is because GCN judges almost all samples in the dataset as normal. The model trained in this way is difficult to apply in practice. Overall, label contrastive coding increases the differentiation between sample categories, bringing pairs of samples with the same labels closer together in the projection space and distancing pairs of sample instances with different labels. As a result, the model achieves promising detection results using only 200 labels, which significantly improves the efficiency of label utilization.
In this paper, the influence of the two key hyper-parameters, momentum mass
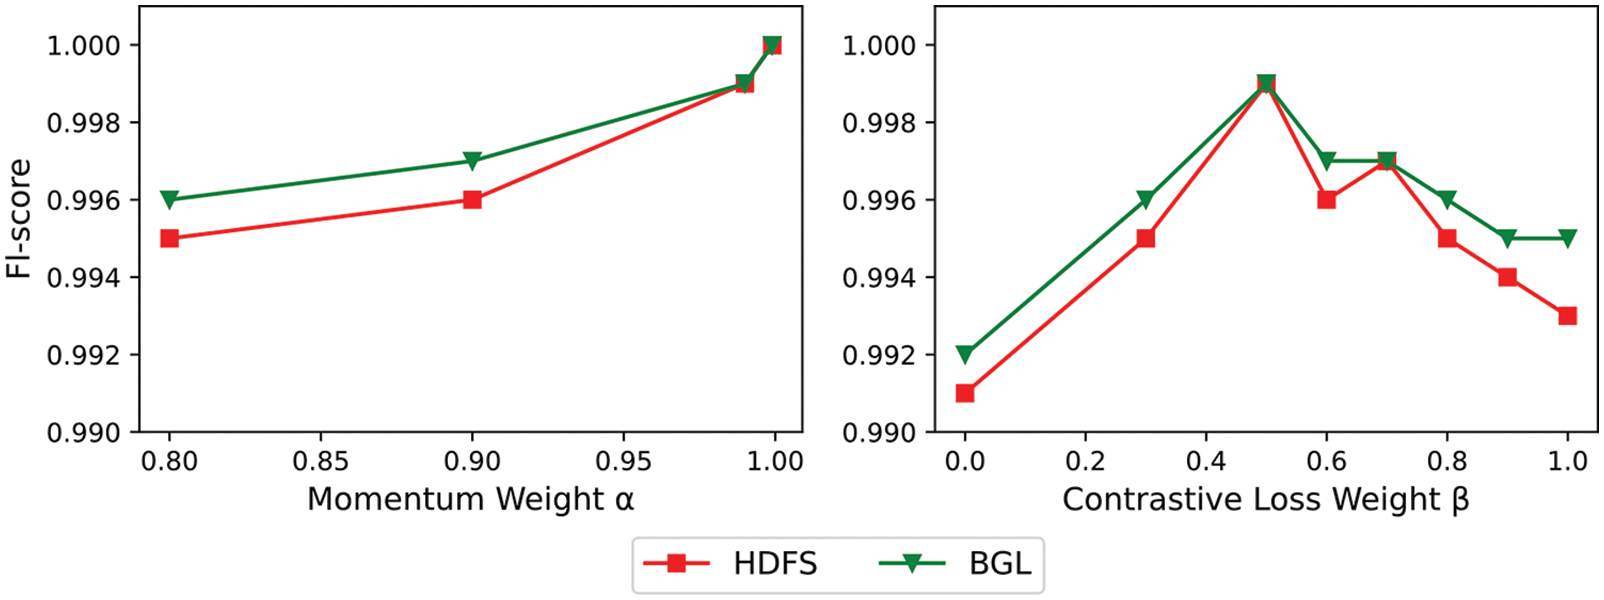
Figure 9: A comparison of F1-score under different parameter settings
In addition, for the BGL dataset, when using the sliding window strategy to process the data, the detection results do not differ much from the fixed window, proving that the proposed model is robust to how the data is processed.
This work proposes a novel GNN-based log anomaly detection model named LCC-HGLog, which converts log anomaly detection into a graph classification problem. In particular, LCC-HGLog abstracts the semantic temporal graph from log events to fully extract the semantic, temporal and structural features. The sample and aggregate convolution layer and the graph pooling layer with structure learning are employed to build the graph classifier HP-SAGE, which can be used either as an encoder in label contrastive learning or applied independently for log anomaly detection. Moreover, label contrastive coding is introduced, which enhances the labels and helps to train the classification model using fewer samples. Through extensive experiments conducted in large log systems with baselines, it is demonstrated that LCC-HGLog achieves the highest detection results, with an F1-score above 99% on both datasets. Meanwhile, in the small dataset experiment, the detection effect of the baseline methods can be achieved using only 200 labeled samples.
However, this paper also has some limitations. First of all, the model has a shortage in training time and computation consumption compared with traditional machine learning. In terms of training time, the training phase is offline and the prediction time is very short, so it can basically meet the demand. Regarding the computational consumption, the graph neural network is more computationally intensive, and the parameter settings can be reduced to build a more lightweight detection model for detection scenarios with limited computational power. Second, while the current study detects anomalous behaviors in system logs that deviate from the normal situation in benchmark datasets, anomaly detection in specific domains or attack scenarios [46,47] can be considered in the future, e.g., evaluating this approach in the AIT Log Dataset [48]. In addition, the interpretability of the model can be investigated to aid in understanding the model and optimally tuning it.
Contributions of Authors: Yong Fang: Conceptualization, Methodology, Investigation. Zhiying Zhao: Conceptualization, Methodology, Software, Data curation, Experiment, Formal analysis, Writing-original draft. Yijia Xu: Conceptualization, Methodology, Validation, Writing-review editing. Zhonglin Liu: Investigation, Data curation, Review.
Funding Statement: This research is funded by the National Natural Science Foundation of China (U20B2045).
Conflicts of Interest: The authors declare that they have no conflicts of interest to report regarding the present study.
References
1. X. Duan, S. Ying, W. Yuan, H. Cheng and X. Yin, “QLLog: A log anomaly detection method based on Q-learning algorithm,” Information Processing & Management, vol. 58, no. 3, pp. 102540, 2021. [Google Scholar]
2. X. Han, H. Cheng, D. Xu and S. Yuan, “InterpretableSAD: Interpretable anomaly detection in sequential log data,” in IEEE Int. Conf. on Big Data, Orlando, FL, USA, pp. 1183–1192, 2021. [Google Scholar]
3. Z. Wang, J. Tian, H. Fang, L. Chen and J. Qin, “LightLog: A lightweight temporal convolutional network for log anomaly detection on the edge,” Computer Networks, vol. 203, pp. 108616, 2022. [Google Scholar]
4. L. Zhang, W. Li, Z. Zhang, Q. Lu, C. Hou et al., “LogAttn: Unsupervised log anomaly detection with an autoencoder based attention mechanism,” in Int. Conf. on Knowledge Science, Engineering and Management, Tokyo, Japan, pp. 222–235, 2021. [Google Scholar]
5. H. Sun and R. Grishman, “Lexicalized dependency paths based supervised learning for relation extraction,” Computer Systems Science and Engineering, vol. 43, no. 3, pp. 861–870, 2022. [Google Scholar]
6. J. P. Rouillard, “Real-time log file analysis using the simple event correlator,” in Proc. of 18th USENIX Conference on System Administration, Atlanta, GA, United States, pp. 133–150, 2004. [Google Scholar]
7. T. F. Yen, A. Oprea, K. Onarlioglu, T. Leetham, W. Robertson et al., “Beehive: Large-scale log analysis for detecting suspicious activity in enterprise networks,” in Proc. of the 29th Annual Computer Security Applications Conf., New Orleans, Louisiana, USA, pp. 199–208, 2013. [Google Scholar]
8. Q. Lin, H. Zhang, J. G. Lou, Y. Zhang and X. Chen, “Log clustering based problem identification for online service systems,” in Int. Conf. on Software Engineering Companion, New York, NY, United States, pp. 102–111, 2016. [Google Scholar]
9. S. He, Q. Lin, J. G. Lou, H. Zhang, M. R. Lyu et al., “Identifying impactful service system problems via log analysis,” in Proc. of the 2018 26th ACM Joint Meeting on European Software Engineering Conf. and Symp. on the Foundations of Software Engineering, New York, NY, United States, pp. 60–70, 2018. [Google Scholar]
10. M. Du, F. Li, G. Zheng and V. Srikumar, “Deeplog: Anomaly detection and diagnosis from system logs through deep learning,” in Proc. of the 2017 ACM SIGSAC Conference on Computer and Communications Security, Dallas, Texas, USA, pp. 1285–1298, 2017. [Google Scholar]
11. Z. Wang, Z. Chen, J. Ni, H. Liu, H. Chen et al., “Multi-scale one-class recurrent neural networks for discrete event sequence anomaly detection,” in Proc. of the 27th ACM SIGKDD Conference on Knowledge Discovery & Data Mining, Singapore, pp. 3726–3734, 2021. [Google Scholar]
12. W. Meng, Y. Liu, Y. Zhu, S. Zhang, D. Pei et al., “Loganomaly: Unsupervised detection of sequential and quantitative anomalies in unstructured logs,” IJCAI, vol. 19, no. 7, pp. 4739–4745, 2019. [Google Scholar]
13. X. Zhang, Y. Xu, Q. Lin, B. Qiao, H. Zhang et al., “Robust log-based anomaly detection on unstable log data,” in Proc. of the 2019 27th ACM Joint Meeting on European Software Engineering Conf. and Symp. on the Foundations of Software Engineering, New York, NY, United States, pp. 807–817, 2019. [Google Scholar]
14. V. H. Le and H. Zhang, “Log-based anomaly detection without log parsing,” in 2021 36th IEEE/ACM Int. Conf. on Automated Software Engineering (ASE), Melbourne, Australia, pp. 492–504, 2021. [Google Scholar]
15. X. Liu, W. Liu, X. Di, J. Li, B. Cai et al., “LogNADS: Network anomaly detection scheme based on log semantics representation,” Future Generation Computer Systems, vol. 124, pp. 390–405, 2021. [Google Scholar]
16. T. Jia, P. Chen, L. Yang, Y. Li, F. Meng et al., “An approach for anomaly diagnosis based on hybrid graph model with logs for distributed services,” in Int. Conf. on Web Services, Honolulu, HI, USA, pp. 25–32, 2017. [Google Scholar]
17. F. Liu, X. Jiang, Y. Wen, X. Xing, D. Zhang et al., “Log2vec: A heterogeneous graph embedding based approach for detecting cyber threats within enterprise,” in Proc. of the 2019 ACM SIGSAC Conference on Computer and Communications Security, London United Kingdom, pp. 1777–1794, 2019. [Google Scholar]
18. Y. Wan, Y. Liu, D. Wang and Y. Wen, “GLAD-PAW: Graph-based log anomaly detection by position aware weighted graph attention network,” in Pacific-Asia Conf. on Knowledge Discovery and Data Mining, Delhi, India, pp. 66–77, 2021. [Google Scholar]
19. T. Wittkopp, A. Acker, S. Nedelkoski, J. Bogatinovski, D. Scheinert et al., “A2log: Attentive augmented log anomaly detection,” in HICSS, Hawaii, USA, pp. 1853–1862, 2022. [Google Scholar]
20. M. Catillo, A. Pecchia and U. Villano, “AutoLog: Anomaly detection by deep autoencoding of system logs,” Expert Systems with Applications, vol. 191, pp. 116263, 2022. [Google Scholar]
21. X. Han and S. Yuan, “Unsupervised cross-system log anomaly detection via domain adaptation,” in Conf. on Information & Knowledge Management, Gold Coast, Queensland, Australia, pp. 3068–3072, 2021. [Google Scholar]
22. L. Yang, J. Chen, Z. Wang, W. Wang, J. Jiang et al., “Semi-supervised log-based anomaly detection via probabilistic label estimation,” in Int. Conf. on Software Engineering, Madrid, ES, pp. 1448–1460, 2021. [Google Scholar]
23. G. Pang, C. Shen, L. Cao and A. V. D. Hengel, “Deep learning for anomaly detection: A review,” ACM Computing Surveys, vol. 54, no. 2, pp. 1–38, 2021. [Google Scholar]
24. S. He, P. He, Z. Chen, T. Yang, Y. Su et al., “A survey on automated log analysis for reliability engineering,” ACM Computing Surveys, vol. 54, no. 6, pp. 1–37, 2021. [Google Scholar]
25. T. Ma, H. Wang, L. Zhang, Y. Tian and N. Al-Nabhan, “Graph classification based on structural features of significant nodes and spatial convolutional neural networks,” Neurocomputing, vol. 423, pp. 639–650, 2021. [Google Scholar]
26. J. You, J. Gomes-Selman, R. Ying and J. Leskovec, “Identity-aware graph neural networks,” in Proc. of the AAAI Conf. on Artificial Intelligence, Online, pp. 10737–10745, 2021. [Google Scholar]
27. H. Wang, D. Lian, W. Liu, D. Wen, C. Chen et al., “Powerful graph of graphs neural network for structured entity analysis,” World Wide Web, vol. 25, no. 2, pp. 609–629, 2022. [Google Scholar]
28. R. Zhu, Z. Tao, Y. Li and S. Li, “Automated graph learning via population based self-tuning GCN,” in Proc of the 44th Int. ACM SIGIR Conference on Research and Development in Information Retrieval, Canada, pp. 2096–2100, 2021. [Google Scholar]
29. Z. Wang, H. Shen, Q. Cao and X. Cheng, “Survey on graph classification,” Journal of Software, vol. 33, no. 1, pp. 171–192, 2022. [Google Scholar]
30. F. Scarselli, M. Gori, A. C. Tsoi, M. Hagenbuchner and G. Monfardini, “The graph neural network model,” IEEE Transactions on Neural Networks, vol. 20, no. 1, pp. 61–80, 2009. [Google Scholar]
31. P. He, J. Zhu, Z. Zheng and M. R. Lyu, “Drain: An online log parsing approach with fixed depth tree,” in IEEE Int. Conf. on Web Services, Honolulu, HI, USA, pp. 33–40, 2017. [Google Scholar]
32. H. Guo, S. Yuan and X. Wu, “LogBERT: Log anomaly detection via bert,” in Int. Joint Conf. on Neural Networks, Shenzhen, China, pp. 1–8, 2021. [Google Scholar]
33. S. He, J. Zhu, P. He and M. R. Lyu, “Experience report: System log analysis for anomaly detection,” in 2016 IEEE 27th Int. Symp. on Software Reliability Engineering (ISSRE), Ottawa, ON, Canada, pp. 207–218, 2016. [Google Scholar]
34. B. Dit, L. Guerrouj, D. Poshyvanyk and G. Antoniol, “Can better identifier splitting techniques help feature location?,” in Int. Conf. on Program Comprehension, Kingston, ON, Canada, pp. 11–20, 2011. [Google Scholar]
35. J. Mu and P. Viswanath, “All-but-the-top: Simple and effective post-processing for word representations,” in“ ICLR, Vancouver, BC, Canada, pp. 1–25, 2018. [Google Scholar]
36. W. L. Hamilton, R. Ying and J. Leskovec, “Inductive representation learning on large graphs,” in Proc. of Neural Information Processing Systems, Long Beach, CA, USA, pp. 1024–1034, 2017. [Google Scholar]
37. Z. Zhang, J. Bu, M. Ester, J. Zhang, C. Yao et al., “Hierarchical graph pooling with structure learning,” arXiv e-prints, pp. arXiv:1911.05954, 2019. [Google Scholar]
38. Y. Ren, J. Bai and J. Zhang, “Label contrastive coding based graph neural network for graph classification,” in Int. Conf. on Database Systems for Advanced Applications, Taipei, China, pp. 123–140, 2021. [Google Scholar]
39. K. He, H. Fan, Y. Wu, S. Xie and R. Girshick, “Momentum contrast for unsupervised visual representation learning,” in Proc. of the IEEE/CVF Conf. on Computer Vision and Pattern Recognition, Online, pp. 9729–9738, 2020. [Google Scholar]
40. A. V. D. Oord, Y. Li and O. Vinyals, “Representation learning with contrastive predictive coding,” arXiv e-prints, pp. arXiv: 1807.03748, 2018. [Google Scholar]
41. S. He, J. Zhu, P. He and M. R. Lyu, “Loghub: A large collection of system log datasets towards automated log analytics,” arXiv e-prints, pp. arXiv: 2008.06448, 2020. [Google Scholar]
42. F. T. Liu, K. M. Ting and Z. -H. Zhou, “Isolation forest,” in IEEE Int. Conf. on Data Mining, Pisa, Italy, pp. 413–422, 2008. [Google Scholar]
43. W. Xu, L. Huang, A. Fox, D. Patterson and M. I. Jordan, “Detecting large-scale system problems by mining console logs,” in Proc. of the 22nd ACM Symposium on Operating Systems Principles, Big Sky Montana, USA, pp. 117–132, 2009. [Google Scholar]
44. J. G. Lou, Q. Fu, S. Yang, Y. Xu and J. Li, “Mining invariants from console logs for system problem detection,” in USENIX ATC, Boston, MA, pp. 231–244, 2019. [Google Scholar]
45. T. N. Kipf and M. Welling, “Semi-supervised classification with graph convolutional networks,” in“ ICLR, Toulon, France, pp. 1–14, 2017. [Google Scholar]
46. V. E. Adeyemo, A. Azween, N. JhanJhi, S. Mahadevan and A. O. Balogun, “Ensemble and deep-learning methods for two-class and multi-attack anomaly intrusion detection: An empirical study,” International Journal of Advanced Computer Science and Applications, vol. 10, no. 9, pp. 520–528, 2019. [Google Scholar]
47. O. A. Alzubi, “A deep learning-based frechet and dirichlet model for intrusion detection in IWSN,” Journal of Intelligent & Fuzzy Systems, vol. 42, no. 2, pp. 873–883, 2022. [Google Scholar]
48. M. Landauer, F. Skopik, M. Wurzenberger, W. Hotwagner and A. Rauber, “Have it your way: Generating customized log datasets with a model-driven simulation testbed,” IEEE Transactions on Reliability, vol. 70, no. 1, pp. 402–415, 2021. [Google Scholar]
Cite This Article
 Copyright © 2023 The Author(s). Published by Tech Science Press.
This work is licensed under a Creative Commons Attribution 4.0 International License , which permits unrestricted use, distribution, and reproduction in any medium, provided the original work is properly cited.
 Downloads
 Citation Tools