
 Submit a Paper
 Propose a Special lssue
 Open Access
ARTICLE
Automated Deep Learning Based Melanoma Detection and Classification Using Biomedical Dermoscopic Images
1 Department of Computer Sciences, College of Computer and Information Sciences, Princess Nourah bint Abdulrahman University, P.O. Box 84428, Riyadh, 11671, Saudi Arabia
2 Department of Information Systems, College of Science & Art at Mahayil, King Khalid University, Saudi Arabia
3 Department of Computer Science, College of Computer and Information Sciences, Prince Sultan University, Saudi Arabia
4 Department of Computer and Self Development, Preparatory Year Deanship, Prince Sattam bin Abdulaziz University, AlKharj, Saudi Arabia
* Corresponding Author: Anwer Mustafa Hilal. Email:
Computers, Materials & Continua 2023, 74(2), 2443-2459. https://doi.org/10.32604/cmc.2023.026379
Received 23 December 2021; Accepted 24 January 2022; Issue published 31 October 2022
 View Full Text
 Download PDF
Abstract
Melanoma remains a serious illness which is a common form of skin cancer. Since the earlier detection of melanoma reduces the mortality rate, it is essential to design reliable and automated disease diagnosis model using dermoscopic images. The recent advances in deep learning (DL) models find useful to examine the medical image and make proper decisions. In this study, an automated deep learning based melanoma detection and classification (ADL-MDC) model is presented. The goal of the ADL-MDC technique is to examine the dermoscopic images to determine the existence of melanoma. The ADL-MDC technique performs contrast enhancement and data augmentation at the initial stage. Besides, the k-means clustering technique is applied for the image segmentation process. In addition, Adagrad optimizer based Capsule Network (CapsNet) model is derived for effective feature extraction process. Lastly, crow search optimization (CSO) algorithm with sparse autoencoder (SAE) model is utilized for the melanoma classification process. The exploitation of the Adagrad and CSO algorithm helps to properly accomplish improved performance. A wide range of simulation analyses is carried out on benchmark datasets and the results are inspected under several aspects. The simulation results reported the enhanced performance of the ADL-MDC technique over the recent approaches.Keywords
Computation analysis for gathering the skin lesion information is the field of study is important due to its treatment planning and cancer diagnosis. Melanocytes are melanin-producing cells that primary objective is to offer color to eyes, skin, and hair [1]. Skin cancer is one of the common types of cancer [2], which is categorized into melanoma and non-melanoma. The considerable healthcare cost and higher morbidity related to the malignant types of lesion have inspired authors to propose more flexible and accurate models for earlier melanoma [3]. While abnormal melanocyte cells divide out of control and affect other parts of the body and it became high metastases and increases deaths rate. As per the information reported by American Cancer Society 2018, the rate of skin cancer has been increased over the past few years. In 2018, nearly 91,270 new melanoma cases would be detected and 9320 people are predicted to die of skin cancer in the US. But the skin cancer is extremely curable when it is detected at earlier stages.
Effective non-invasive diagnosis method assists dermatologists to gather information, providing insight into melanoma shape and structure. Macroscopic images, commonly called clinical images or non-dermoscopic since these images are taken by the traditional digital cameras that are non-invasive and inexpensive–utilized in computation analysis for patients of distinct ethnicities and ages [4,5]. Dermoscopic images are attained by dermoscopy, a special non-invasive imaging instrument, commonly have good invariance to contrast and illumination [6]. But, distinct image acquisition parameters and conditions like non-ideal illumination, image quality limits, variable distance, and poor resolutions like artefacts, noises, reflections, shadows, and hairs reduce the image quality which can compromise the strength of the melanoma analysis. Thus, a computer aided diagnosis (CAD) scheme is capable of analyzing dermoscopy-based images might be considered for assisting dermatologists in skin cancer diagnoses [7].
Recently, neural network has once again boomed in a wide-ranging of applications. By attaining reasonable outcomes, it becomes a promising tool for skin lesion classification. A convolutional neural network (CNN) is depending on the convolutional process of the image with various filters, offering varied and extensive data. Initially, CNN gets the edge and line features, whereas, in the deeper layer, they find more detailed information in the image. It is familiar that the convolutional process isn't invariant for geometric transformations such as scale, translation, and rotation [8]. For this reason, neural network requires a massive amount of training images for extracting each possible way that the image can have, so their higher computation cost. Additionally, images of skin lesions could have lower contrasts among the healthy skin and lesion that can interfere with the accurate segmentation of the lesion [9]. That might result in loss of data that is utilized for accurate classification of the injury.
This paper presents an automated deep learning based melanoma detection and classification (ADL-MDC) model. The ADL-MDC technique performs contrast enhancement and data augmentation at the initial stage. Followed by, the k-means clustering technique is applied for the image segmentation process. Next, Adagrad optimizer based Capsule Network (CapsNet) model is derived for effective feature extraction process. Finally, crow search optimization (CSO) algorithm with sparse autoencoder (SAE) model is utilized for the melanoma classification process. The exploitation of the Adagrad and CSO algorithm helps to properly accomplish improved performance. A wide range of simulation analyses is carried out on benchmark datasets and the results are inspected under several aspects.
Daghrir et al. [10] established a hybrid technique for melanoma skin cancer recognition which is utilized for examining some suspicious lesions. The presented method depends on the forecast of 3 distinct approaches: A CNN and 2 typical machine learning (ML) techniques trained with group of features relating the border, texture, and color of skin lesion. These techniques are next related to enhancing its efficiency utilizing popular voting. Kassani et al. [11] estimated the efficiency of many recent CNNs from dermoscopic images of skin lesions. The experiment was demonstrated on graphics processing unit (GPU) to speed up the trained and utilization procedure. For enhancing the quality of image, it can utilize distinct pre-processed stages. It also implements data augmentation techniques like horizontal as well as vertical flipping approaches for addressing the class skewness issue.
Thiyaneswaran et al. [12] purposed for detecting the symptom of melanoma primary with images of moles attained in image processing devices and classifying the varieties. The intensity of image was downsampled for decreasing the bit depth. When the illumination of downsampled image is not uniform, afterward gamma corrected was implemented for obtaining the uniform illumination. A textural feature was removed in the segmentation image. In ML approach was implemented for classifying the melanoma image. In [13], 2 approaches were planned for classifying melanoma cancer stage. A primary method classifies melanoma as stage 1 as well as stage 2. Secondary methods classify melanoma as stage 1, stage 2, or stage 3 melanoma. The presented technique utilizes CNN technique with Similarity Measure for Text Processing (SMTP) as loss functions.
In [14], a comparative analysis to classify the set of melanoma utilizing the supervised ML technique. The group of melanoma in dermoscopic data was presented for helping the medical consumption of dermatoscopy imaging techniques skin sores classification. The melanoma has been segmentation in the background utilizing adaptive k-means clustering technique with 2 clusters then feature extraction techniques were dependent upon intensity and texture feature in the segmentation data that is succeeded by trained of classifier and eventually testing on unknown dermoscopic data. Ali et al. [15] examined an automated technique for skin lesion border irregularity recognition. This technique contains removing the skin lesion in the image, identifying the skin lesion border, calculating the border irregularity, trained a CNN and Gaussian naive Bayes (GNB) ensemble, to automatic recognition of border irregularity that outcomes in an objective decision if the skin lesion border was regarded as regular/irregular. ALEnezi [16] presented an image processing based technique for identifying skin disease. This technique gets the digital image of disease affects skin area, afterward utilize image analysis for identifying the kind of diseases. This technique work on input of color image. Afterward, resize of image for extracting features utilizing pre-trained CNN. Then the classified feature utilizes Multiclass support vector machine (SVM).
In this study, a novel ADL-MDC technique has been derived for melanoma detection and classification using dermoscopic images. The ADL-MDC technique encompasses several stages including pre-processing, K-means segmentation, CapsNet based feature extraction, Adagrad optimizer based hyperparameter tuning, SAE based classification, and CSO based parameter optimization. The exploitation of the Adagrad and CSO algorithm helps to properly accomplish improved performance.
At the initial stage, the pre-processing of the dermoscopic images takes place using two ways namely contrast enhancement and data augmentation. In this study, Contrast Limited Adaptive Histogram Equalization (CLAHE) is used for image equalization [17], which processes on smaller areas in the image instead of the whole image. Besides, the adjacent tiles are integrated by the use of bilinear interpolation approach for the removal of artificial boundaries. It is mainly applied to boost the contrast level of the image. Next, data augmentation takes place in two ways as given below.
• Flipping: flipping the image vertically or horizontally
• Rotation: rotates the image by a specified degree.
Next, the K-means algorithm is used to segment the dermoscopic images and thereby determine the infected regions. Flow level clustering needs effectively subdividing gathered flows for all applications into groups according to the transferred NetFlow attribute. The most leading unsupervised clustering methods are the k-means clustering method chosen on another approach like hierarchical clustering, because of its improved computation efficacy [18]. k-means minimize a provided amount of vectors through selecting k random vector as initial cluster center and assign all vectors to clusters as defined as a distance metrics compared to the cluster centers (a squared error function) as shown in Eq. (1). Then, Cluster center is recalculated as the average (or mean) of the cluster member. This process repeats continuously, terminating whether the cluster converges or a certain amount of processes can be defined as:
where
During feature extraction process, the CapsNet model is derived for the useful extraction of the images. The CNN is widely employed technique for 2D object classifications. But data for example pose and position in the object is removed by the CNN because of its data routing process. In order to compensate for the limitations of CNN, a network structure named the capsule network has been introduced [19]. The activation neuron represents the characteristics of components in the object. All the capsules are accountable for describing an individual component in the object, and each capsule collectively describes the general architecture of the object. Unlike some DL models, this architecture preserves objects component and spatial data. Like CNN, a CapsNet is made up of a multilayer network. Fig. 1 demonstrates the architecture of a capsule and how data is routed from the low-level capsule to the high-level capsule.
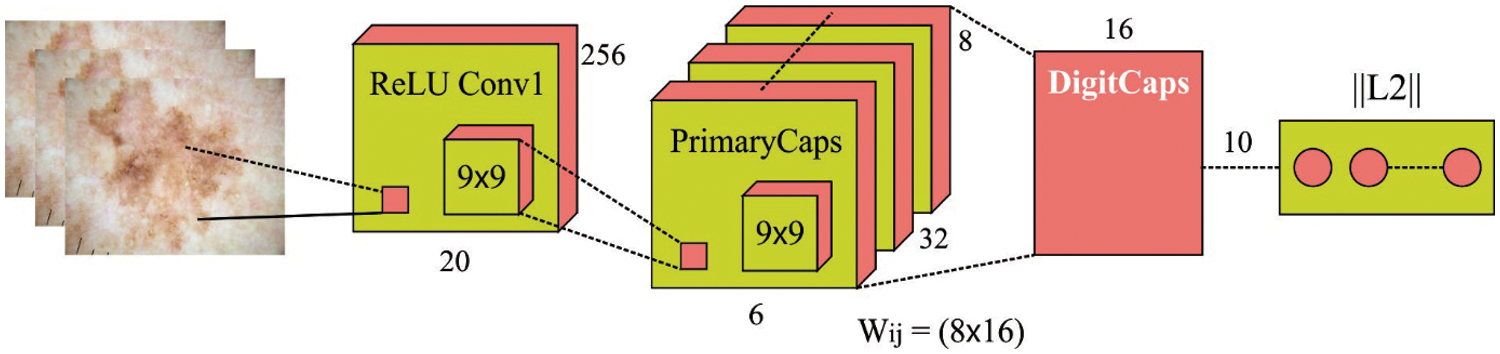
Figure 1: Structure of CapsNet model
The inputs and outputs of the capsule are vectors. The length of the output
Specifically, the pose data and detected presence of components are utilized for predicting the pose data and whole existence. In the training model, the network learns to alter the conversion matrix of the capsule pair by the respective relationships among the whole in the object and components [20]. In high level capsule,
If the low- and high-level capsules are reliable with the prediction, the values of
To properly adjust the hyperparameters of the CapsNet model, the Adagrad optimizer is applied. During the Adagrad optimizing process, the gradient and accumulated squared gradient to all the variables are calculated at the round [20]:
where
where
It can be recognized that
So, the Adagrad is upgraded in Eq. (10):
It can be same as the upgrading method of the typical gradient descent (GD). Thus, Adagrad optimizing is regarded as hyperparameter tuning utilizing the gradient.
At the final stage, the SAE model is applied to classify the dermoscopic images into various class labels. AE is a feed forward neural network (NN), comprises input, hidden, and output layers. It receives the input x and performs encoding process to a latent representation
The approximation takes place
Through the application of KL divergence term, the cost function can be derived as follows.
where
For determining the parameters involved in the SAE model, the CSO algorithm is applied. CSO algorithm is a novel search approach stimulated by the behaviour of crows stealing and hiding food [22]. It is non-greedy and could increase the generated solution. The principle of CSO algorithm is given in the following: (1) with some possibility, the crows keep their food from being stolen by randomly flying and aware of being tracked, (2) crows life in the form of flock, and (3) all the crows could remember the location of their hiding place and steal food from another crow. The location of all the crows represent a solution
Whereas
This section investigates the experimental validation of the ADL-MDC technique using ISIC dataset. The dataset comprises various images under distinct classes [24,25]. Fig. 2 shows the sample test images. The dataset contains different classes of skin lesion (SL) such as Actinic keratosis (AK-SL), Basal Cell Carcinoma (BCC-SL), Seborrheic Keratosis (SCC-SL), Melanoma (MEL-SL), Nevus (NEV-SL), BKL-SL, and Vascular lesion (VASC-SL).
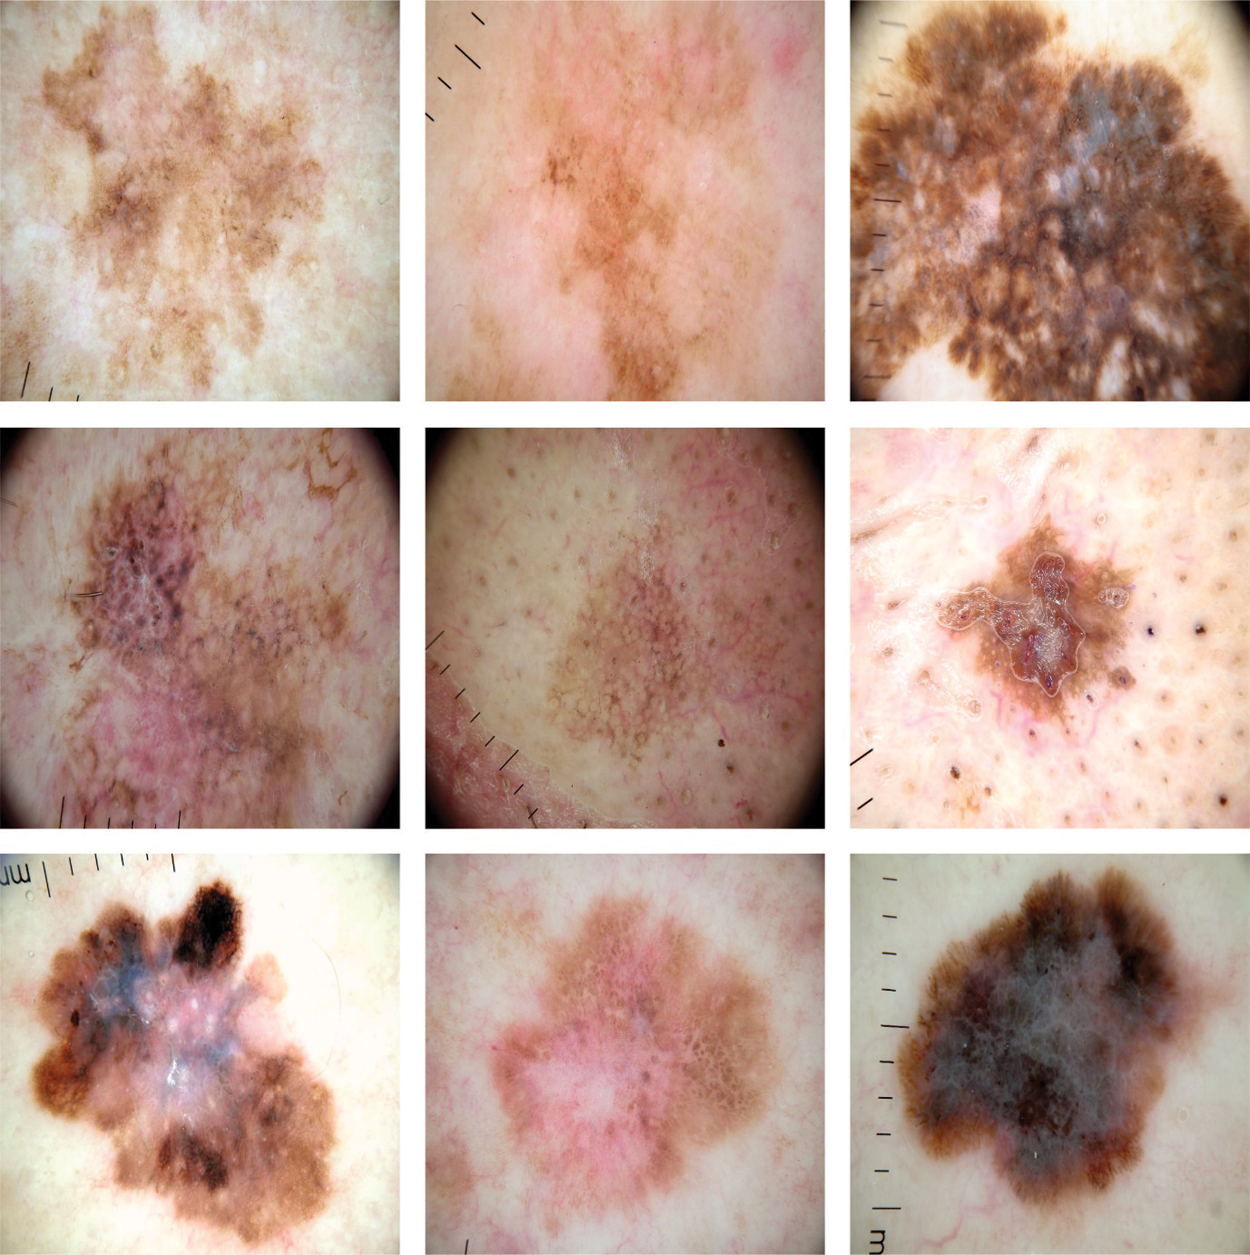
Figure 2: Samples images
The confusion matrix obtained by the ADL-MDC technique on melanoma classification with the training/testing data of 80:20 in Fig. 3. The figure reported that the ADL-MDC technique has classified 122 images under AK-SL class, 122 images under BCC-SL class, 123 images under SCC-SL class, 124 images under BKL-SL class, 125 images under MEL-SL class, 121 images under NEV-SL class, and 122 images under VASC-SL class.
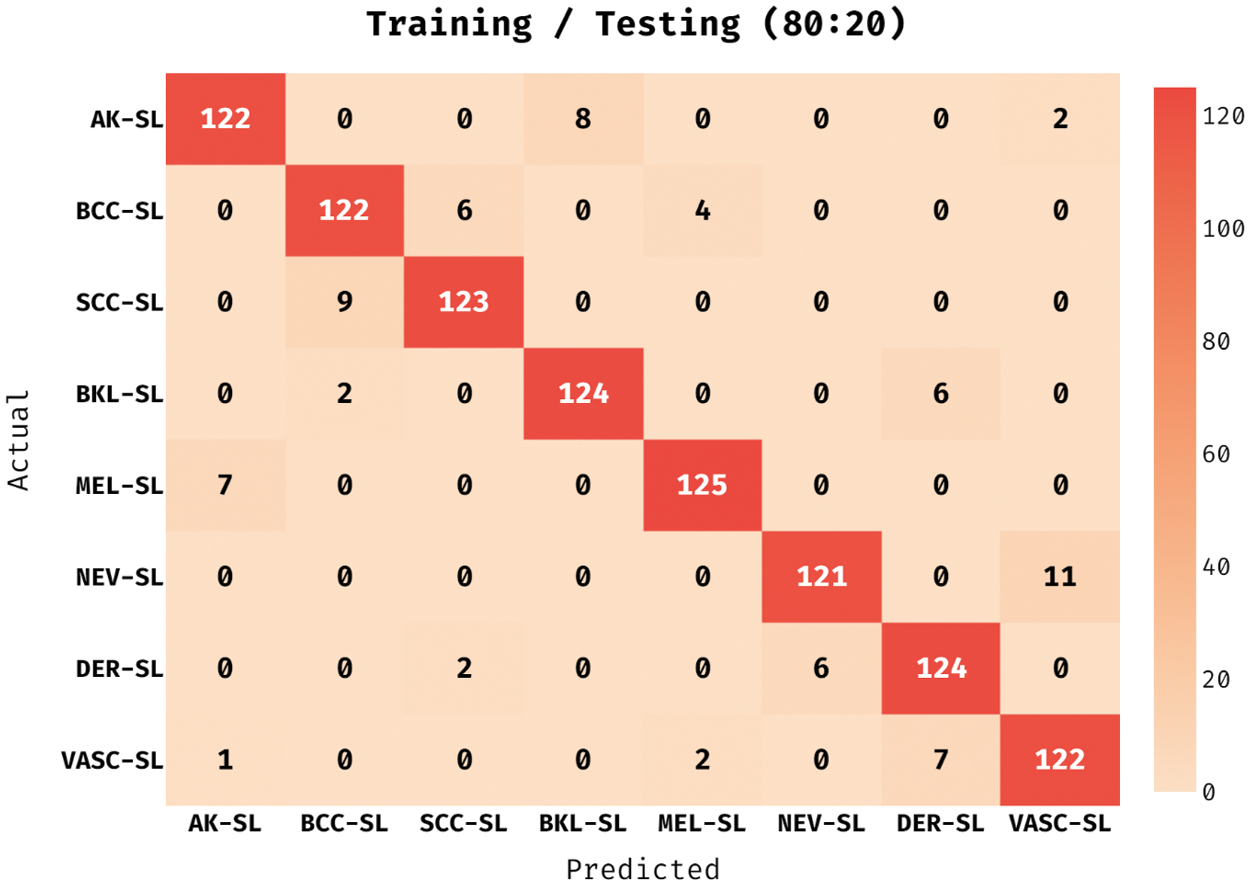
Figure 3: Confusion matrix of ADL-MDC technique (Training/Testing of 80:20)
A brief melanoma classification result analysis of the ADL-MDC technique with the training/testing set of 80:20 is shown in Tab. 1 and Fig. 4. The results show that the ADL-MDC technique has classified all the images effectively. For instance, with AK-SL class, the ADL-MDC technique has obtained
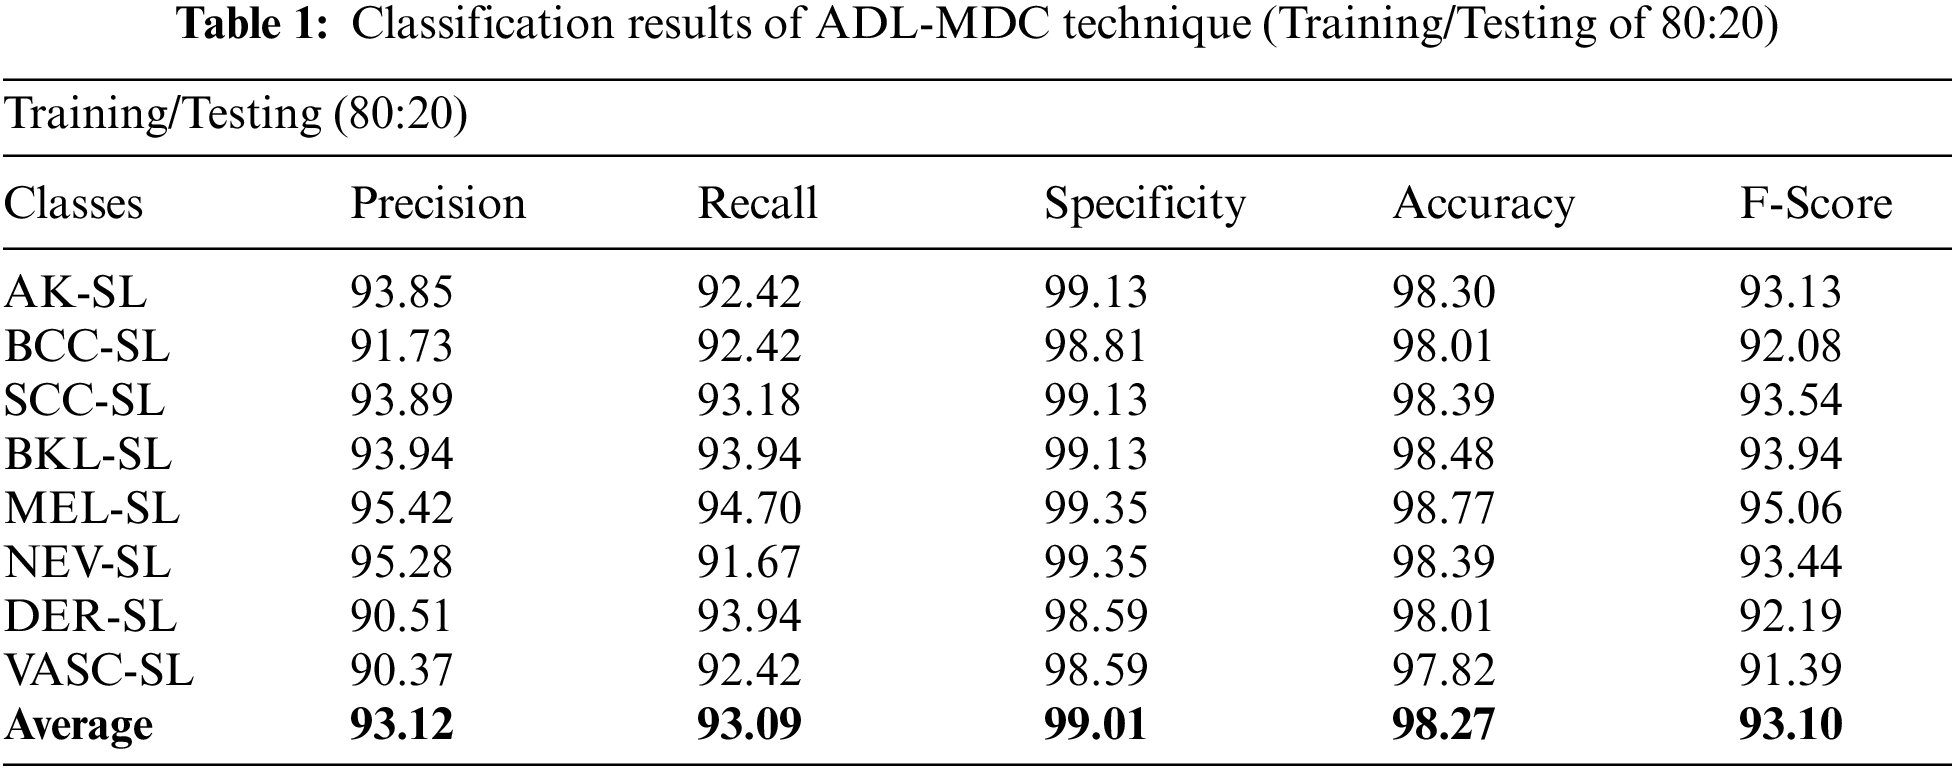

Figure 4: Melanoma classification results of ADL-MDC technique (Training/Testing of 80:20)
In Fig. 5, the ROC analysis of the ADL-MDC technique takes place on the training/testing data of 80:20. The figure exhibited that the ADL-MDC technique has the ability to attain improved melanoma classification performance with the maximum ROC of 99.6372.
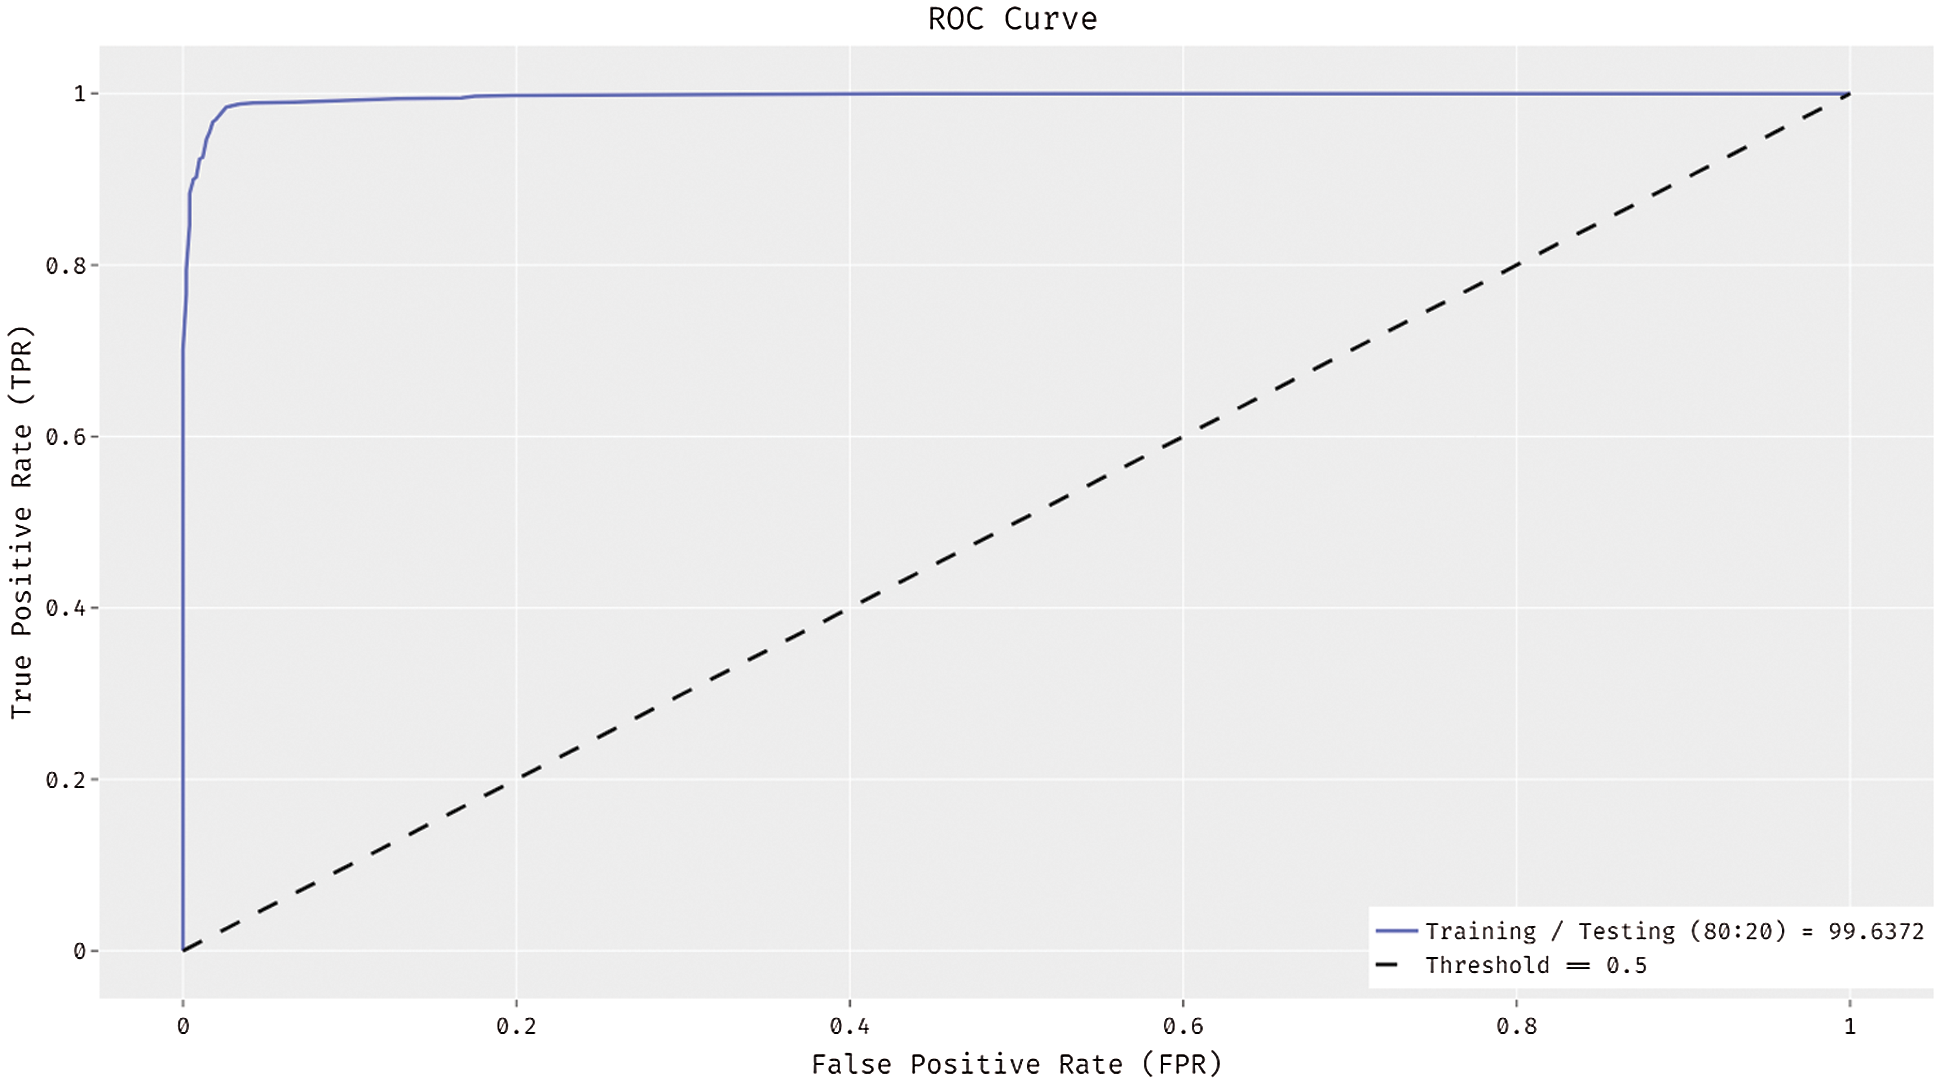
Figure 5: ROC curve of ADL-MDC technique (Training/Testing of 80:20)
The confusion matrix achieved by the ADL-MDC technique on melanoma classification with the training/testing data of 70:30 in Fig. 6. The figure portrayed the ADL-MDC technique has categorized 177 images into AK-SL class, 179 images into BCC-SL class, 183 images into SCC-SL class, 190 images into BKL-SL class, 185 images into MEL-SL class, 187 images into NEV-SL class, 178 images into DER-SL class, and 122 images into VASC-SL class.
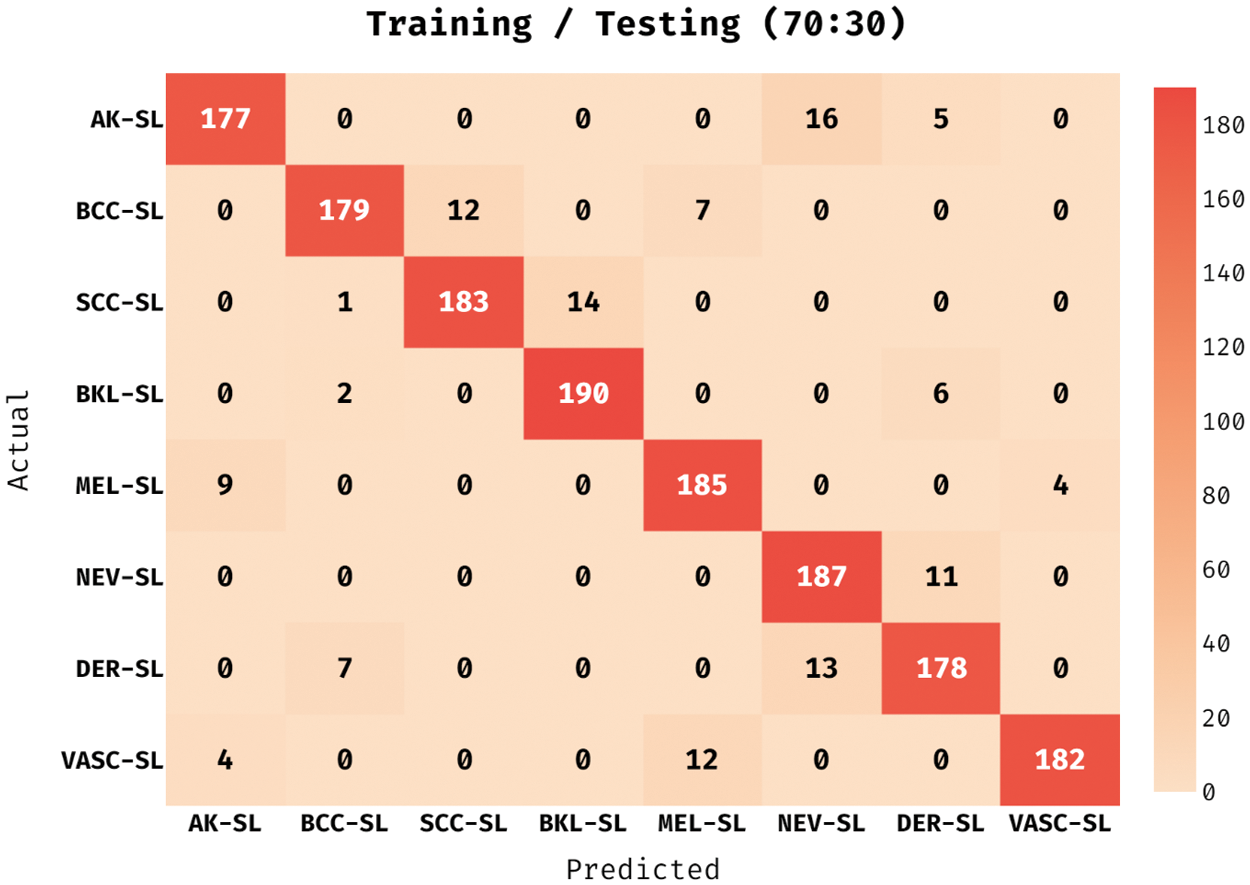
Figure 6: Confusion matrix of ADL-MDC technique (Training/Testing of 70:30)
Tab. 2 and Fig. 7 give a comprehensive melanoma classification result of the ADL-MDC technique on the training/testing set of 70:30 is shown in. The results exposed that the ADL-MDC technique has categorized all the images efficiently. For instance, with AK-SL class, the ADL-MDC technique has resulted to
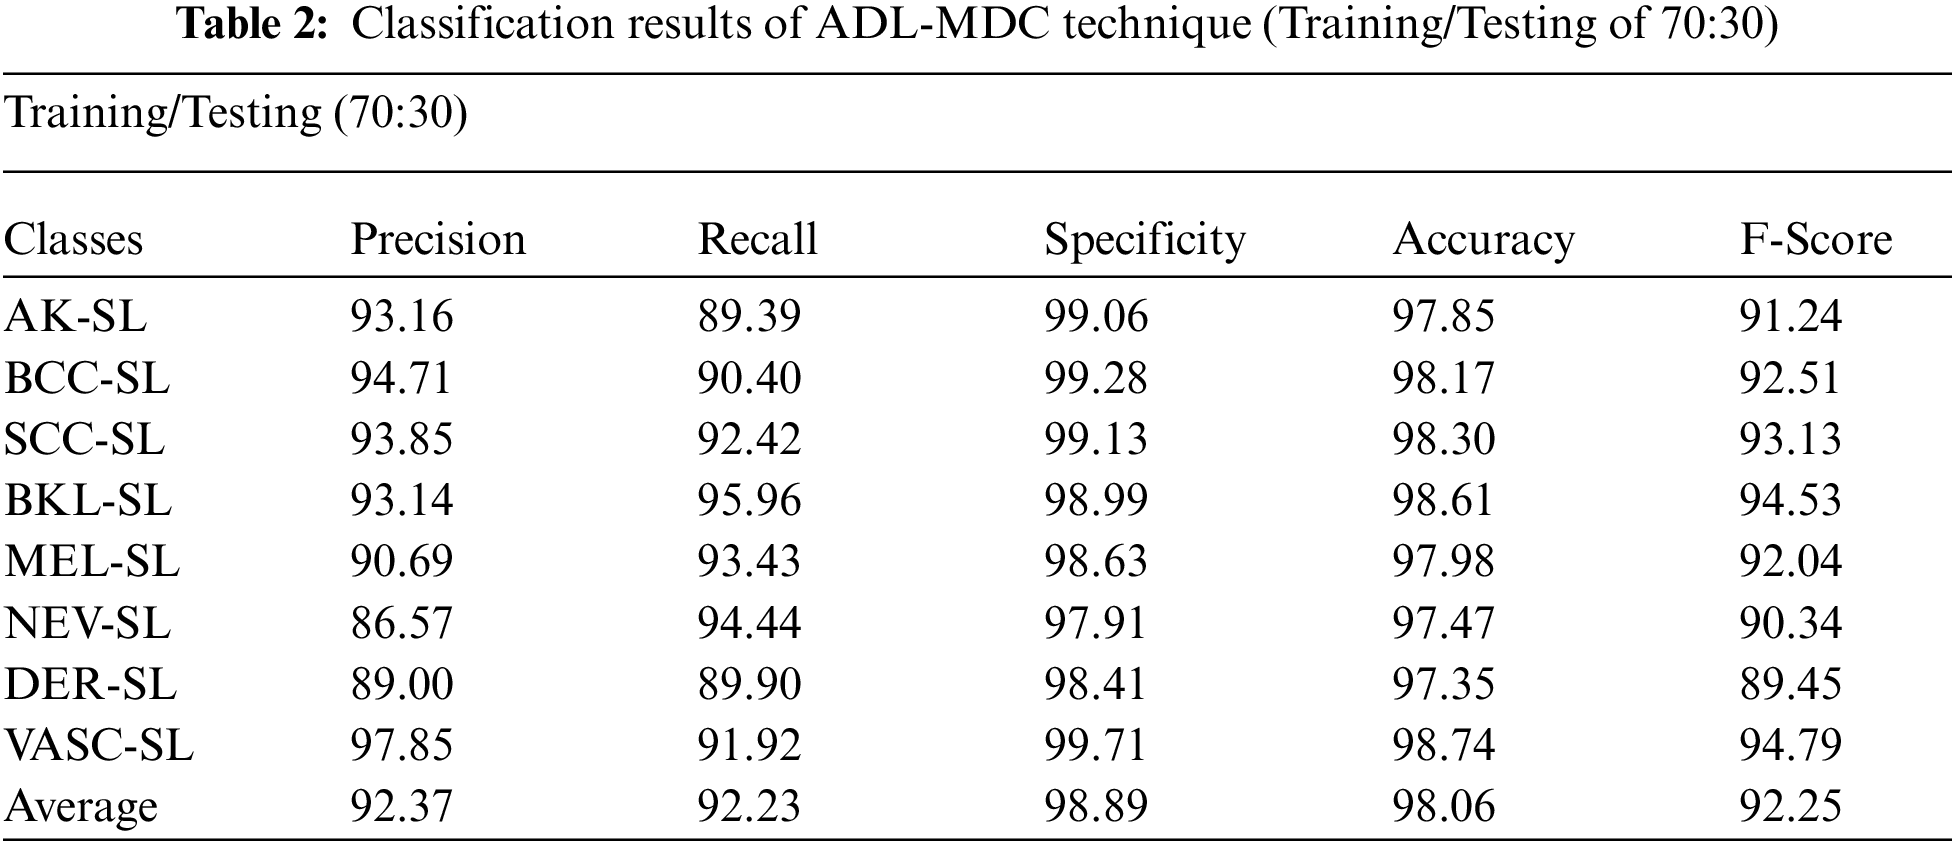
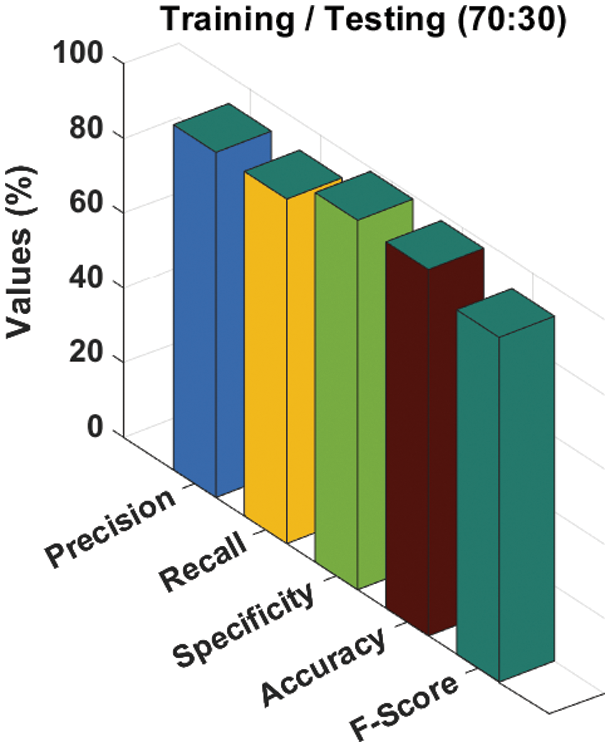
Figure 7: Melanoma classification results of ADL-MDC technique (Training/Testing of 70:30)
In Fig. 8, the ROC analysis of the ADL-MDC technique is carried out on the training/testing data of 70:30. The figure displayed that the ADL-MDC technique has the capability of accomplishing enhanced melanoma classification performance with the higher ROC of 99.5718.

Figure 8: ROC curve of ADL-MDC technique (Training/Testing of 70:30)
The confusion matrix derived by the ADL-MDC technique on melanoma classification with the training/testing data of 60:40 in Fig. 9. The figure stated that the ADL-MDC technique has categorized 237 images under AK-SL class, 245 images under BCC-SL class, 243 images under SCC-SL class, 243 images under BKL-SL class, 247 images under MEL-SL class, 241 images under NEV-SL class, and 242 images under VASC-SL class.
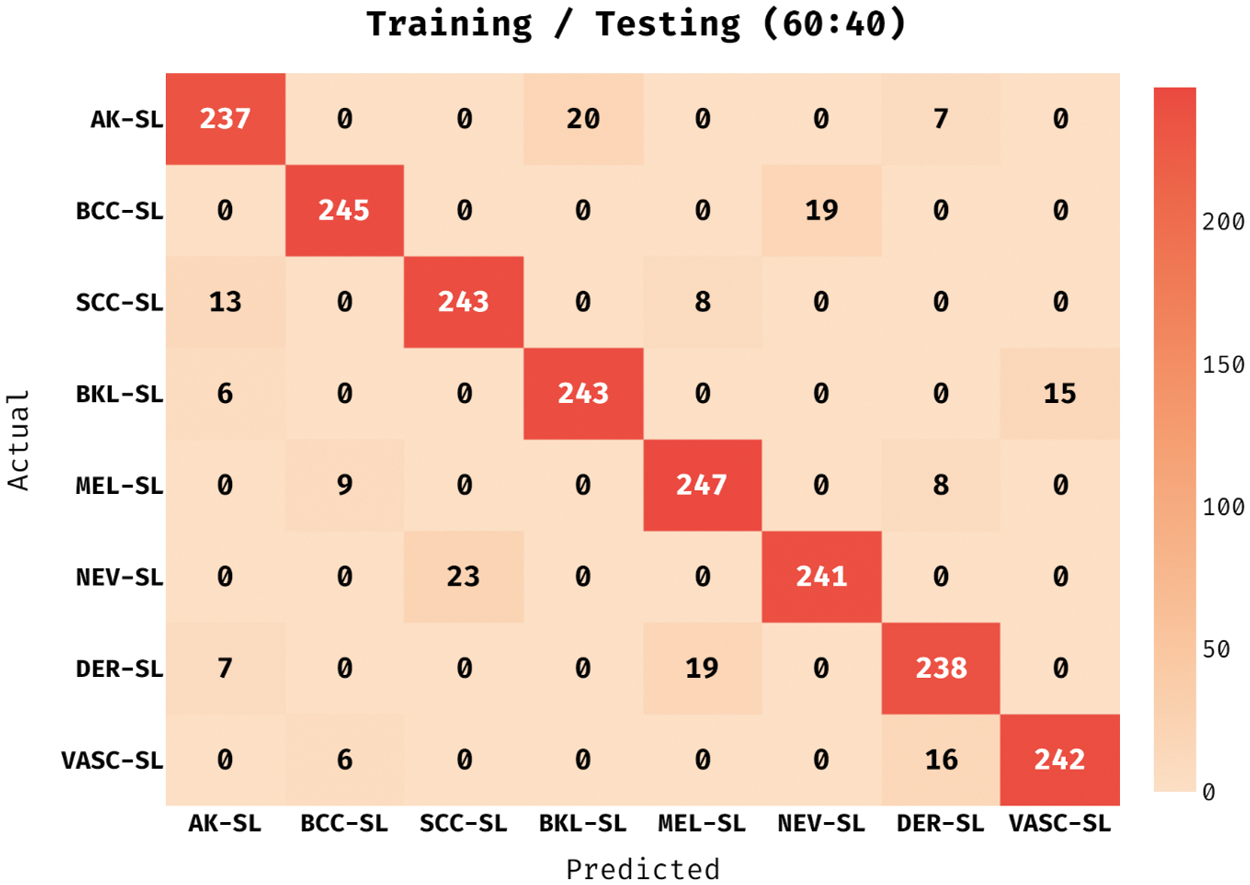
Figure 9: Confusion matrix of ADL-MDC technique (Training/Testing of 60:40)
A detailed melanoma classification result analysis of the ADL-MDC technique with the training/testing set of 60:40 takes place in Tab. 3 and Fig. 10. The experimental values denoted that the ADL-MDC technique has categorized the skin lesion images effectually. For instance, with AK-SL class, the ADL-MDC technique has reached to


Figure 10: Melanoma classification results of ADL-MDC technique (Training/Testing of 60:40)
Fig. 11 exhibits the ROC analysis of the ADL-MDC technique on the training/testing data of 60:40. The results showcased that the ADL-MDC technique has the capacity of reaching better melanoma classification performance with a maximum ROC of 99.8663.
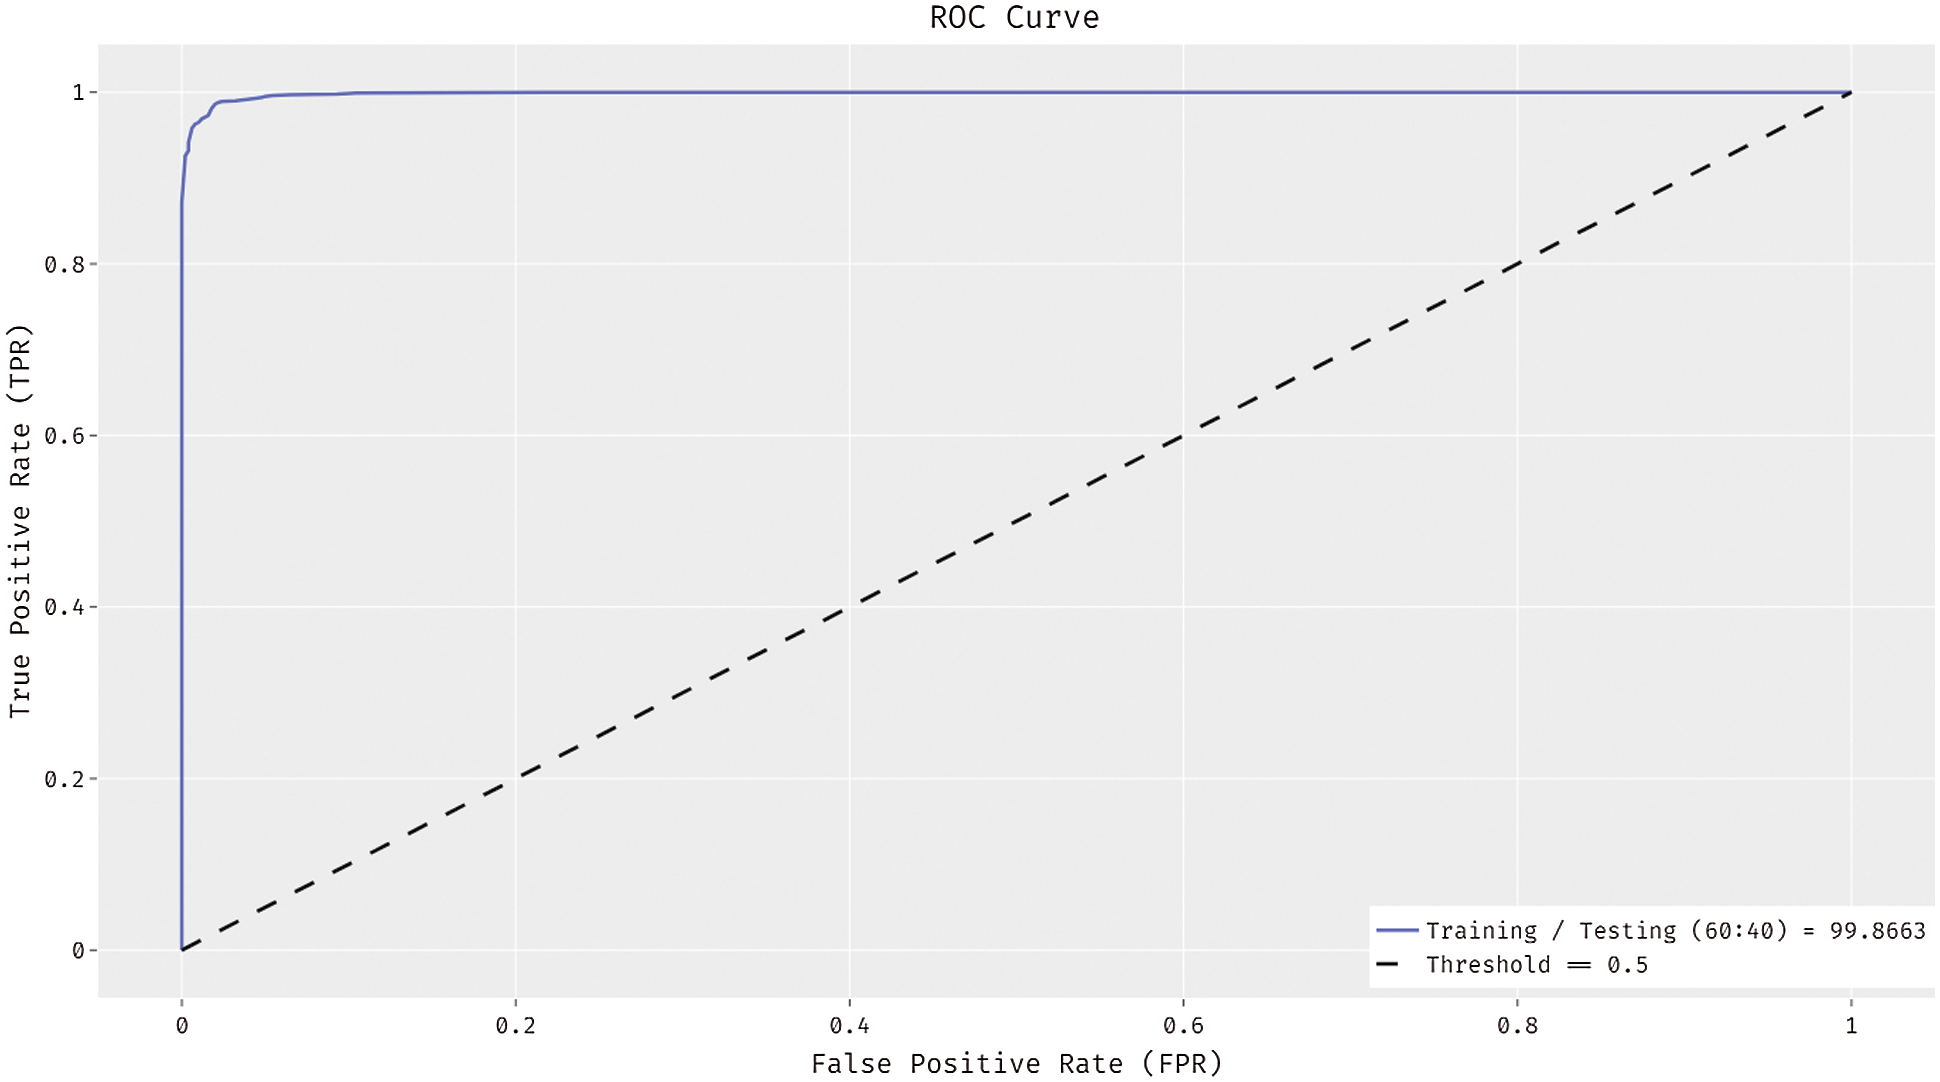
Figure 11: ROC curve of ADL-MDC technique (Training/Testing of 60:40)
Fig. 12 illustrates the
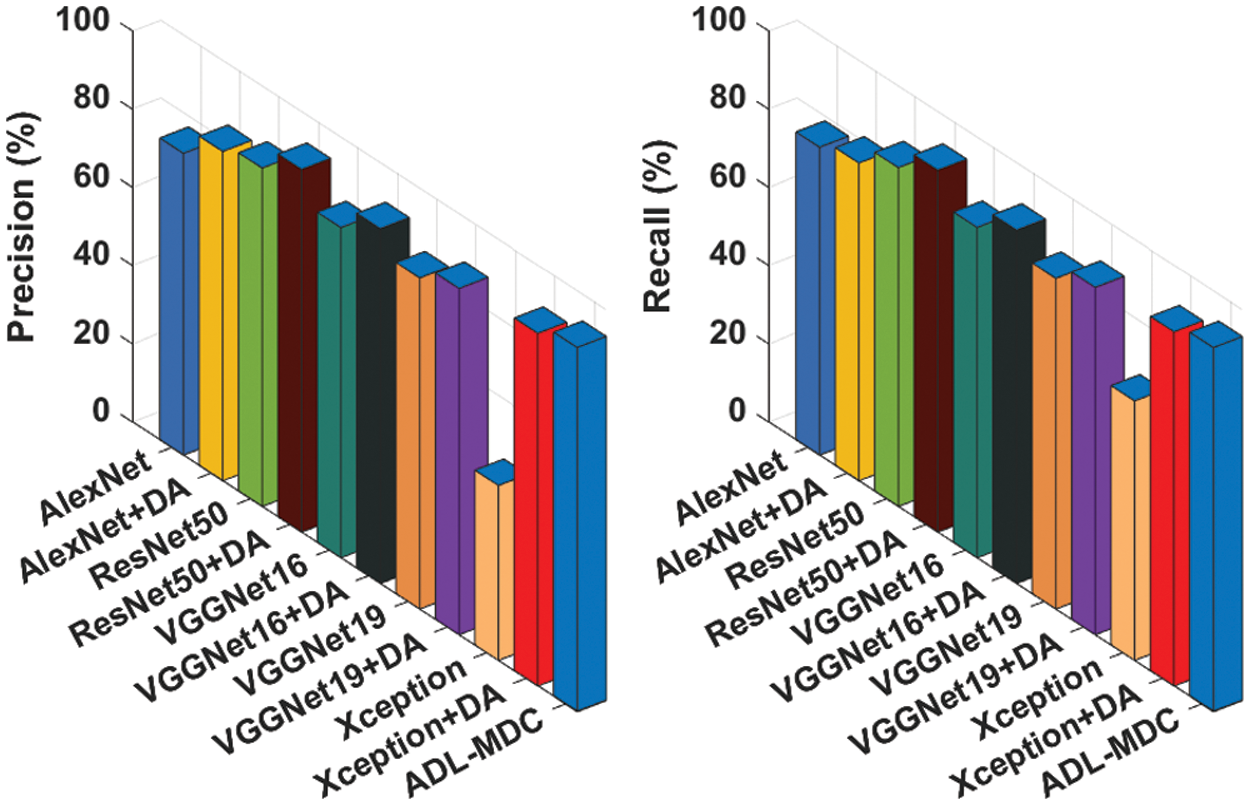
Figure 12: Comparative
Fig. 13 demonstrates the
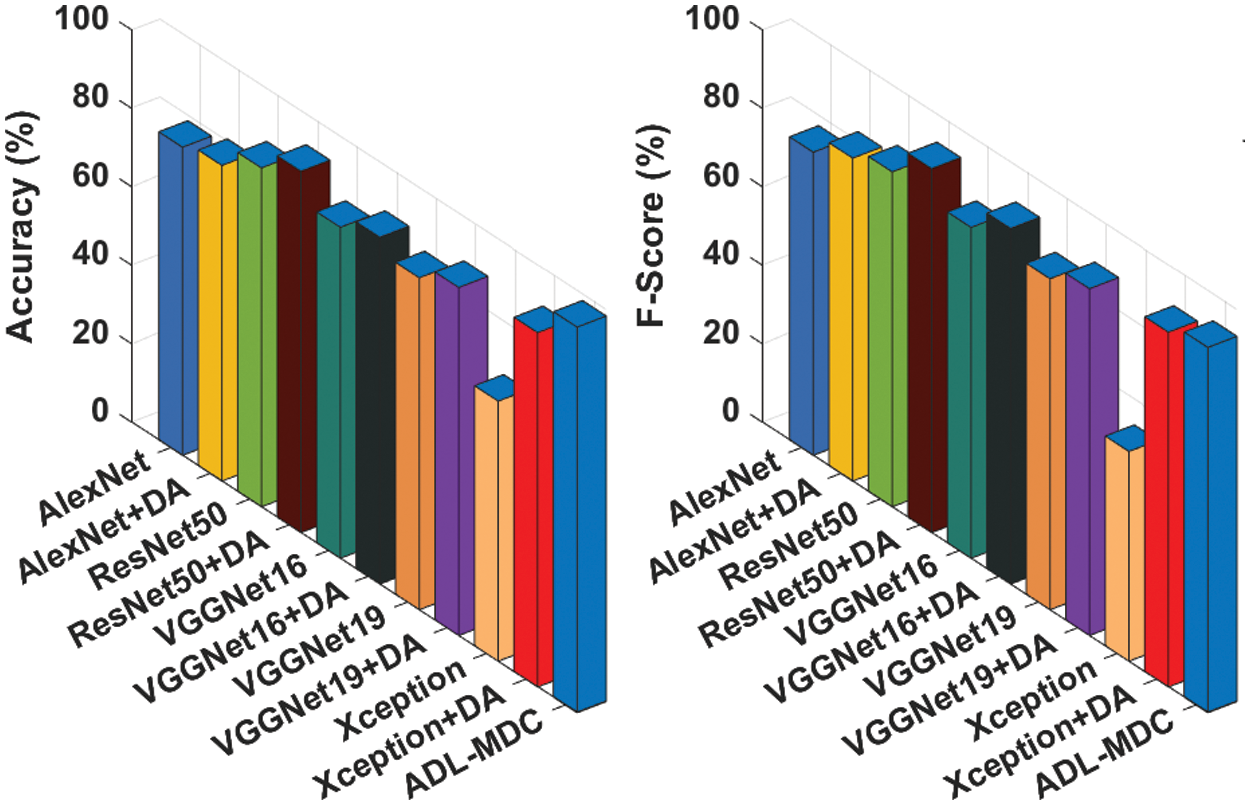
Figure 13: Comparative
In this study, a novel ADL-MDC technique has been derived for melanoma detection and classification using dermoscopic images. The ADL-MDC technique encompasses several stages including pre-processing, K-means segmentation, CapsNet based feature extraction, Adagrad optimizer based hyperparameter tuning, SAE based classification, and CSO based parameter optimization. The exploitation of the Adagrad and CSO algorithm helps to properly accomplish improved performance. A wide range of simulation analyses is carried out on benchmark datasets and the results are inspected under several aspects. The simulation results reported the enhanced performance of the ADL-MDC technique over the recent approaches. As a part of future extension, the classification performance of the ADL-MDC technique can be improved by the design of DL based image segmentation techniques.
Funding Statement: The authors extend their appreciation to the Deanship of Scientific Research at King Khalid University for funding this work under Grant Number (RGP 1/80/43). Princess Nourah bint Abdulrahman University Researchers Supporting Project Number (PNURSP2022R191), Princess Nourah bint Abdulrahman University, Riyadh, Saudi Arabia.
Conflicts of Interest: The authors declare that they have no conflicts of interest to report regarding the present study.
References
1. E. O. M. Molina, S. S. Calderón and J. Á. Borrego, “Classification of dermoscopy skin lesion color-images using fractal-deep learning features,” Applied Sciences, vol. 10, no. 17, pp. 5954, 2020. [Google Scholar]
2. T. J. Brinker, L. Kiehl, M. Schmitt, T. B. Jutzi, E. I. K. Henning et al., “Deep learning approach to predict sentinel lymph node status directly from routine histology of primary melanoma tumours,” European Journal of Cancer, vol. 154, pp. 227–234, 2021. [Google Scholar]
3. M. A. Al-masni, M. A. Al-antari, M. T. Choi, S. M. Han and T. S. Kim, “Skin lesion segmentation in dermoscopy images via deep full resolution convolutional networks,” Computer Methods and Programs in Biomedicine, vol. 162, pp. 221–231, 2018. [Google Scholar]
4. M. Q. Khan, A. Hussain, S. U. Rehman, U. Khan, M. Maqsood et al., “Classification of melanoma and nevus in digital images for diagnosis of skin cancer,” IEEE Access, vol. 7, pp. 90132–90144, 2019. [Google Scholar]
5. A. Marka, J. B. Carter, E. Toto and S. Hassanpour, “Automated detection of nonmelanoma skin cancer using digital images: A systematic review,” BMC Medical Imaging, vol. 19, no. 1, pp. 21, 2019. [Google Scholar]
6. M. A. Wahba, A. S. Ashour, Y. Guo, S. A. Napoleon and M. M. A. Elnaby, “A novel cumulative level difference mean based GLDM and modified ABCD features ranked using eigenvector centrality approach for four skin lesion types classification,” Computer Methods and Programs in Biomedicine, vol. 165, pp. 163–174, 2018. [Google Scholar]
7. N. Amoroso, D. Diacono, A. Fanizzi, M. L. Rocca, A. Monaco et al., “Deep learning reveals Alzheimer's disease onset in MCI subjects: Results from an international challenge,” Journal of Neuroscience Methods, vol. 302, pp. 3–9, 2018. [Google Scholar]
8. C. Barata, J. S. Marques and M. E. Celebi, “Improving dermoscopy image analysis using color constancy,” in 2014 IEEE Int. Conf. on Image Processing (ICIP), Paris, France, pp. 3527–3531, 2014. [Google Scholar]
9. N. Gessert, M. Nielsen, M. Shaikh, R. Werner and A. Schlaefer, “Skin lesion classification using ensembles of multi-resolution EfficientNets with meta data,” MethodsX, vol. 7, pp. 100864, 2020. [Google Scholar]
10. J. Daghrir, L. Tlig, M. Bouchouicha and M. Sayadi, “Melanoma skin cancer detection using deep learning and classical machine learning techniques: A hybrid approach,” in 2020 5th Int. Conf. on Advanced Technologies for Signal and Image Processing (ATSIP), Sousse, Tunisia, pp. 1–5, 2020. [Google Scholar]
11. S. H. Kassani and P. H. Kassani, “A comparative study of deep learning architectures on melanoma detection,” Tissue and Cell, vol. 58, pp. 76–83, 2019. [Google Scholar]
12. B. Thiyaneswaran, K. Anguraj, S. Kumarganesh and K. Thangaraj, “Early detection of melanoma images using gray level co-occurrence matrix features and machine learning techniques for effective clinical diagnosis,” International Journal of Imaging Systems and Technology, vol. 31, no. 2, pp. 682–694, 2021. [Google Scholar]
13. R. Patil and S. Bellary, “Machine learning approach in melanoma cancer stage detection,” Journal of King Saud University-Computer and Information Sciences, 2020. http://doi:10.1016/j.jksuci.2020.09.002. [Google Scholar]
14. J. B. Janney and S. E. Roslin, “Classification of melanoma from Dermoscopic data using machine learning techniques,” Multimedia Tools and Applications, vol. 79, no. 5–6, pp. 3713–3728, 2020. [Google Scholar]
15. A. R. Ali, J. Li, S. Kanwal, G. Yang, A. Hussain et al., “A novel fuzzy multilayer perceptron (f-mlp) for the detection of irregularity in skin lesion border using dermoscopic images,” Frontiers in Medicine, vol. 7, pp. 297, 2020. [Google Scholar]
16. N. S. A. ALEnezi, “A method of skin disease detection using image processing and machine learning,” Procedia Computer Science, vol. 163, pp. 85–92, 2019. [Google Scholar]
17. A. M. Reza, “Realization of the contrast limited adaptive histogram equalization (clahe) for real-time image enhancement,” The Journal of VLSI Signal Processing-Systems for Signal, Image, and Video Technology, vol. 38, no. 1, pp. 35–44, 2004. [Google Scholar]
18. N. Dhanachandra, K. Manglem and Y. J. Chanu, “Image segmentation using k-means clustering algorithm and subtractive clustering algorithm,” Procedia Computer Science, vol. 54, pp. 764–771, 2015. [Google Scholar]
19. H. Chao, L. Dong, Y. Liu and B. Lu, “Emotion recognition from multiband EEG signals using CapsNet,” Sensors, vol. 19, no. 9, pp. 2212, 2019. [Google Scholar]
20. C. Zhang, M. Yao, W. Chen, S. Zhang, D. Chen et al., “Gradient descent optimization in deep learning model training based on multistage and method combination strategy,” Security and Communication Networks, vol. 2021, pp. 1–15, 2021s. [Google Scholar]
21. B. Abraham and M. S. Nair, “Computer-aided classification of prostate cancer grade groups from MRI images using texture features and stacked sparse autoencoder,” Computerized Medical Imaging and Graphics, vol. 69, pp. 60–68, 2018s. [Google Scholar]
22. A. Askarzadeh, “A novel metaheuristic method for solving constrained engineering optimization problems: Crow search algorithm,” Computers & Structures, vol. 169, pp. 1–12, 2016. [Google Scholar]
23. Y. H. Jia, J. Qiu, Z. Z. Ma and F. F. Li, “A novel crow swarm optimization algorithm (CSO) coupling particle swarm optimization (PSO) and crow search algorithm (CSA),” Computational Intelligence and Neuroscience, vol. 2021, pp. 1–14, 2021. [Google Scholar]
24. P. Tschandl, C. Rosendahl and H. Kittler, “The HAM10000 dataset, a large collection of multi-source dermatoscopic images of common pigmented skin lesions,” Scientific Data, vol. 5, no. 1, pp. 180161, 2018. [Google Scholar]
25. N. C. F. Codella, D. Gutman, M. E. Celebi, B. Helba, M. A. Marchetti et al., “Skin lesion analysis toward melanoma detection: A challenge,” in 2018 IEEE 15th Int. Symp. on Biomedical Imaging (ISBI 2018), Washington, DC, pp. 168–172, 2018. [Google Scholar]
Cite This Article
 Copyright © 2023 The Author(s). Published by Tech Science Press.
This work is licensed under a Creative Commons Attribution 4.0 International License , which permits unrestricted use, distribution, and reproduction in any medium, provided the original work is properly cited.
 Downloads
 Citation Tools