
 Submit a Paper
 Propose a Special lssue
 Open Access
ARTICLE
A Big Data Based Dynamic Weight Approach for RFM Segmentation
1 Hunan University of Finance and Economics, Changsha, 410205, China
2 University Malaysia Sabah, Kota Kinabalu, 88670, Malaysia
* Corresponding Author: Minjuan Zhong. Email:
Computers, Materials & Continua 2023, 74(2), 3503-3513. https://doi.org/10.32604/cmc.2023.023596
Received 13 September 2021; Accepted 16 December 2021; Issue published 31 October 2022
 View Full Text
 Download PDF
Abstract
Using the RFM (Recency, Frequency, Monetary value) model can provide valuable insights about customer clusters which is the core of customer relationship management. Due to accurate customer segment coming from dynamic weighted applications, in-depth targeted marketing may also use type of dynamic weight of R, F and M as factors. In this paper, we present our dynamic weighted RFM approach which is intended to improve the performance of customer segmentation by using the factors and variations to attain dynamic weights. Our dynamic weight approach is a kind of Custom method in essential which roots in the understanding of the data set. Firstly, Analytic Hierarchy Process is used to calculate the subjective weight, then the entropy method is applied to calculate the objective weight. Finally, we use comprehensive integration weighting method to combine the subjective and objective weight to obtain the final weight of the index to calculate the individual user value and quantify the user value difference. The experiment shows that the dynamic weight we used in RFM model is vital, affects the customer segmentation performance positively. Also, this study indicates that customer segments containing dynamic weighted RFM scores bring about stronger and more accurate association rules for the understanding of customer behavior. At last, we discuss the limitations of RFM analysis.Keywords
In recent years, the number of online shopping users in China has shown rapid growth. CNNIC (China Internet Network Information Center) released the 47th China Internet Development Statistics Report in February 2021. The penetration rate was 70.4%, an increase of 5.9 percentage from March 2020. In 2020, Chinese online retail sales reached 11.76 trillion yuan, an increase of 10.9% over 2019. Among them, the online retail sales of physical goods were 9.76 trillion yuan, accounting for 24.9% of the total retail sales of consumer goods. As of December 2020, the number of online shopping users in China has reached 782 million, an increase of 72.15 million compared to March 2020, accounting for 79.1% of the total Internet users, and the number of people using the Internet for shopping in China has reached 782 million.
A large number of online shoppers bring great opportunities to the e-commerce industry, but also make the industry competition intensified [1]. Price war needs year by year increase in advertising and marketing costs, resulting in a constantly compressed profit space [2]. If an e-commerce enterprise wants better development, reducing costs and refining operations become the only choice [3].
The analysis of user purchase behavior has very important practical significance in social and economic development [4,5]. User value based on user behavior has become a concern of most e-commerce enterprises [6]. Compared with traditional commerce, today, the browsing path, purchase records and access time of consumers of e-commerce enterprises are traceable, which means it’s more convenient to obtain the consumer’s data [7]. How to explore the characteristics and values of consumers, as well as how to conduct targeted precision marketing to users, is the most concerning problem for merchants, and is also the core application scenario of CRM (Customer Relationship Management) [8]. Most enterprises are eager to select high-quality customers to take advantage of their limited resources, give priority to serve the enterprise’s high-quality users, to achieve precision marketing [9].
Although there are many methods for customer value calculation such as Share of Wallet, Past Customer Value, and Life Time Value, RFM is generally used to obtain customer values, which has been showing good flexibility and adaption to each business situation [10–12]. However, due to the ambiguity of Recency, Frequency, Monetary value, using a deterministic approach is not appropriate [13]. For tackling this matter, this paper presents a dynamic weight approach attained from real transaction big data to improve RFM on evaluating the user value more accurately. These dynamic weights cover the limitations of previous customer segmentation methods.
2 RFM Models and Related Dynamic Weight Methods
RFM analysis is an effective model to study customer value and customer profitability, which can improve the complexity of the customer value analysis model with the help of relatively few consumer behavior characteristics [14]. There are three observing indicators of customer purchase behavior: R stands for last purchase time, F is defined as customer purchase frequency, M means customer purchase amount to describe the customer’s value status. Recency refers to the number of days the customer’s last purchase time-distance analysis time. When the customer’s last purchase time is close to the present, the customer will be more likely to re-consume [15]. Frequency refers to the number of times that the customer buys the products of the enterprise in a certain period. The higher the frequency of the purchase of the customer, the more loyal the customer is to the enterprise, and the higher the value of the customer is [16]. Monetary refers to the total amount of product purchased by the customer in a certain period. The higher the total amount of product purchased by the customer, the higher the value that the enterprise considers the customer to have [17]. The schematic of the RFM model is shown in Fig. 1.
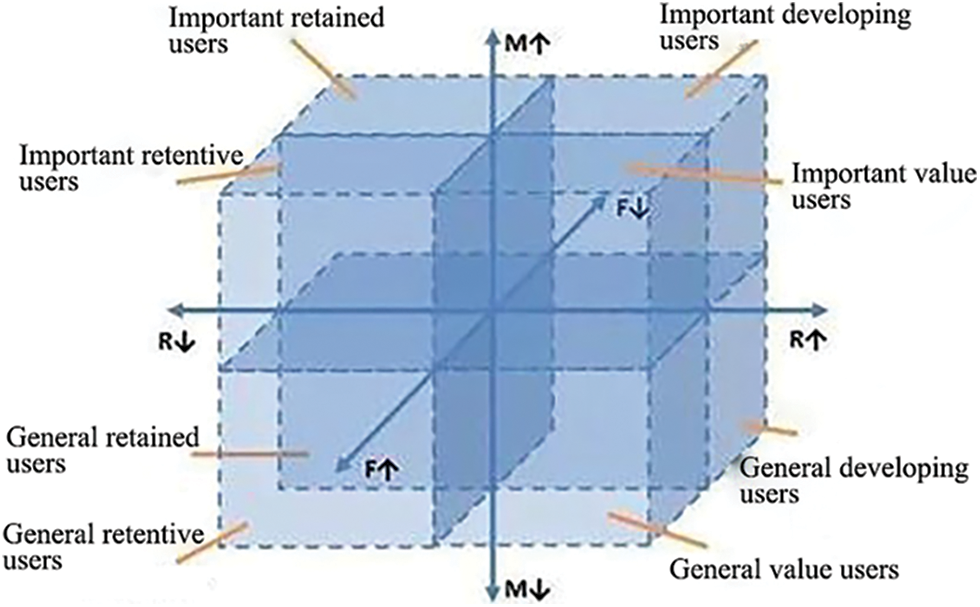
Figure 1: RFM model schematic
RFM model combines three different indicators to calculate customer’s value, and then segment them with it. The RFM values can be calculated in several ways. The common ways are Pareto 80/20 cut, Percentiles e.g., Quantiles and Custom.
Pareto principle is commonly referred to as the 80/20 rule. About 20% of customers contribute to 80% of the total revenue [18,19]. Pareto principle is the most common way to calculate customer value in RFM model. It outputs 8 segments. The percentiles method gives a score from 1–5 to R, F and M values. So it outputs 125 segments. The custom method works best since it works for all businesses and adjusts according to your data. It’s based on business knowledge, the core is dynamic weight [20].
According to RFM model, the weight of each index used to identify customer value is the same. Studies have shown that proximity and frequency are good indicators of loyalty [21]. For example, Stone B, Wu J and Lin Z found that in the field of credit card consumption, proximity and frequency have an important impact on customers’ next consumption, so proximity is given the highest weight, followed by frequency and the lowest amount [12]. However, this does not mean that the amount is not important, after all, the consumption amount can be used to judge the transaction size and willingness of users. If it is aimed at a non-high frequency, non-consumer industry, or an industry where customer stratification is not particularly obvious, it is another matter. So many scholars think that we should set the index weight according to the characteristics of industry competitiveness, customer type and customer consistency [13]. The academic circles have different opinions on the index weight, so we should analyze the specific problems [16]. When using RFM to calculate the customer value, the comprehensive integration weighting method is appropriate to determine the index weight by comprehensively considering the subjective and objective factors [17].
2.2 Related Dynamic Weight Methods
① Analytic Hierarchy Process
The Analytic Hierarchy Process (AHP) is a practical systematic analysis and decision-making method proposed by professor Thomas Seti from the University of Pittsburgh in the early 1970 s [18]. It combines qualitative and quantitative methods, represents complex problems as an orderly hierarchical structure, through people’s subjective judgment and scientific calculation to obtain the order and weight of each alternative, the providing theoretical basis for decision-makers to choose the best solution. The steps are as follows:
Step 1. Building hierarchy model.
Step 2. Building judgment matrix (pairwise comparison). The properties of the judgment matrix are as follows:
aij is the comparison result of the importance of i and j.
Step 3. Hierarchical single sort and its consistency test.
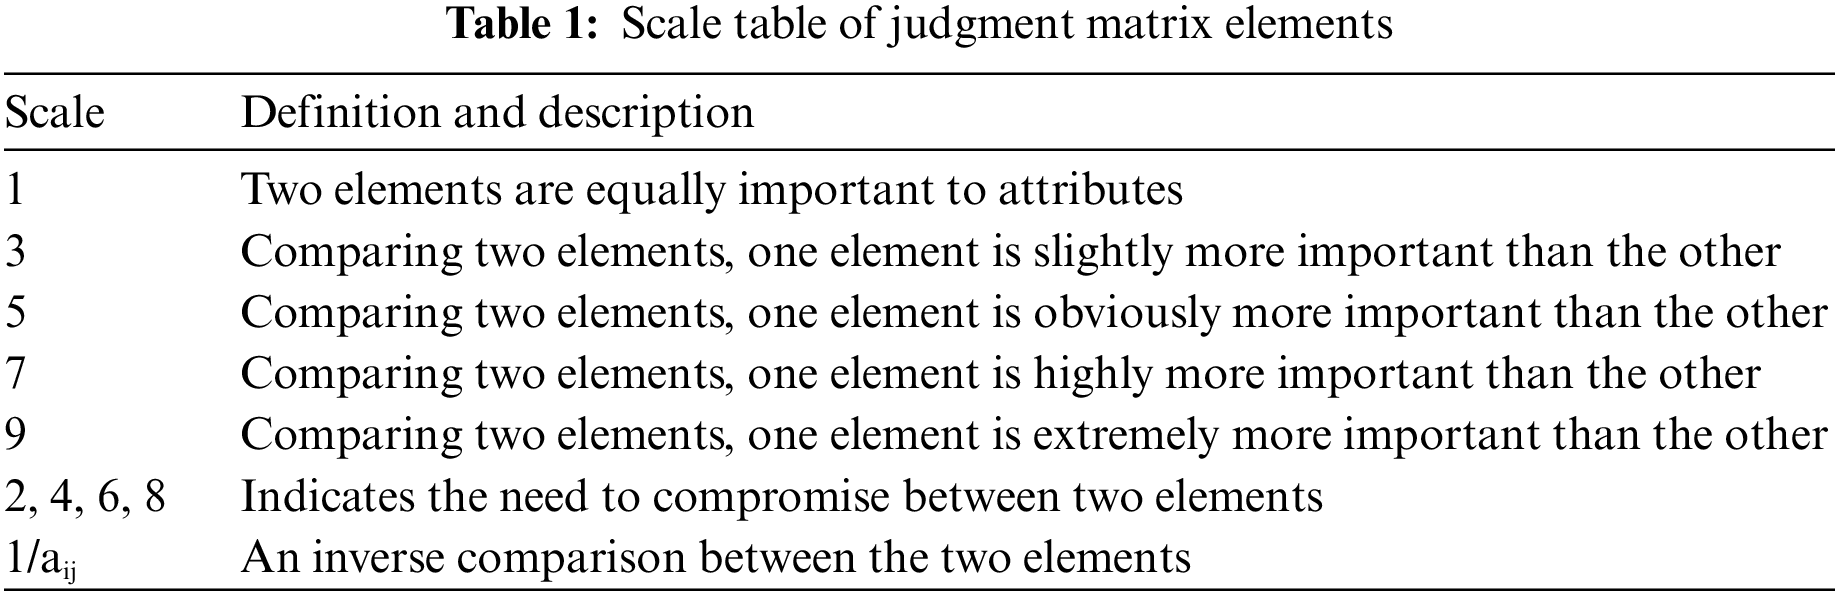
Step 4. Hierarchical total order and its consistency test. The scale table of the judgment matrix element aij is shown in Tab. 1.
② Entropy Method
The entropy method is an objective weighting method, which determines the index weight according to the information provided by the observed values of each index [20–22]. Suppose that there are m plans to be evaluated and n evaluation indexes, forming the original index data matrix X = (Xij) m × n, for an index Xj, the greater the difference between the index values Xij, the greater the role of the index in the comprehensive evaluation; if the index values of an index are all equal, the index does not play a role in the comprehensive evaluation.
③ Comprehensive Integration Weighting Method
The comprehensive integration weighting method integrates the weights calculated by the subjective weighting method and the objective weighting method through a certain equation. The integrated results reflect the subjective intention of the evaluator and the objectivity of the evaluation data at the same time, avoiding the defect that the subjective weight is too subjective and the objective weight lacks subjective information [23–25].
Our dynamic weight approach is a kind of Custom method in essential which roots in the understanding of the data set. Therefore the first step aims to identify the requirements from data, of course, the best is big data. For example, we collect selling data of CD from CDnow website, January 1, 1997 to June 30, 1998. The data set contains 69660 purchase records. We randomly chose the date December 8, 2019 for index calculation. The calculation results are shown in Fig. 2.
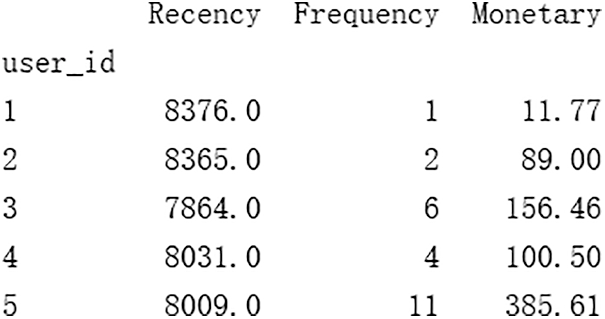
Figure 2: Calculation result of an index value
Recency is the number of days from the latest purchase date of the user to the date of data collection, that is R indicator value; Frequency is the total number of user consumption, i.e., F indicator value; Monetary is the total amount of user consumption, that is M indicator value. Exploratory analysis is made on the calculated results, and the program operation results are shown in Fig. 3
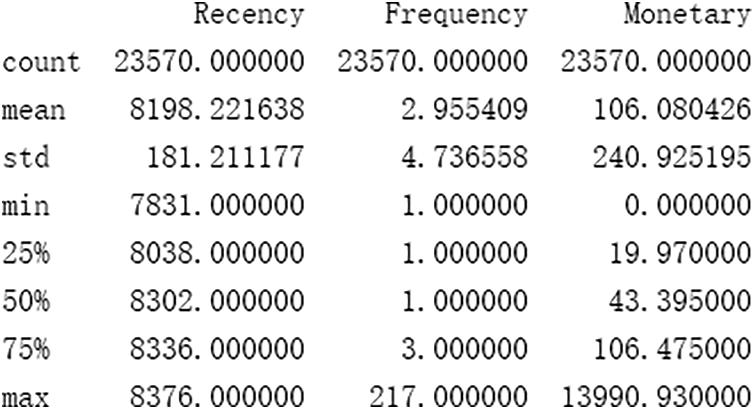
Figure 3: Results of exploratory analysis
From Fig. 3 we get insight into the data that there are 23570 users in total after the completion of the summary. The average recency is 8198.22 days, the average frequency is 2.96 times, and the average monthly is 106.08 yuan. There is no missing value in the data set.
3.2 Customer Value Calculation
To distinguish the value differences of different users more precisely, Dynamic weights are assigned to R, F and M. Firstly, AHP is used to calculate the subjective weight. Then the entropy method is used to calculate the objective weight. Finally, the comprehensive integration weighting method is used to combine the subjective and objective weight to obtain the final weight of the index to calculate the individual user value and quantify the user value difference.
3.2.1 Using Analytic Hierarchy Process to Calculate the Subjective Weights
As for the three indexes of RFM, the importance of the indexes should be determined by pairwise comparison. This paper combines the characteristics of CD itself to make an artificial qualitative judgment: ① CD belongs to durable goods, it is different from daily necessities, after a purchase, users can use a CD for a long time, do not need to buy twice. ② For users who love CDs, the purchase of CDs is affected by many factors, such as the purchase preference of users, the date of CDs release date and so on. The buyback cycle is irregular, and users’ demand for CD is discontinuous. Therefore, for such a non-high-frequency, non-consumer industry, the impact of the most recent purchase date R on customer value is relatively little in the contribution to corporate profits, the customer consumption is the most intuitive reflection. So the total consumption amount M has the highest importance. And F focuses on measuring customer loyalty, the higher the loyalty, the greater the customer value, F will also account for a certain proportion. The final judgment matrix is shown in Tab. 2.
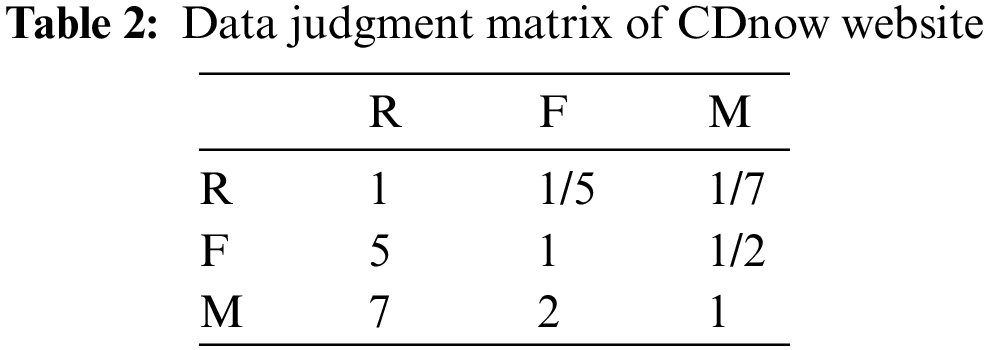
After normalization of the judgment matrix, the vector T = (0.23, 0.99, 1.78) is obtained. After normalization of the vectors, the eigenvectors of the judgment matrix of R, F and M were obtained. W = (0.08, 0.33, 0.59) T. At this point, whether the weight of each element of the feature vector can become an index is decided by the consistency test. Therefore, in this paper, we at first calculate the maximum characteristic root of the judgment matrix. Let’s say that original matrix:
B is equal to
where
n is the order of the matrix, and the test coefficient:
Therefore, the subjective weights of R, F and M were determined to be 0.08, 0.33 and 0.59 respectively through the consistency test.
3.2.2 The Entropy Method Calculates the Objective Weight
Since the date of the data set is December 8, 2019 in this paper, the R index value has been increasing, while the other two indexes are constant. To eliminate the impact of the order of magnitude, the data is first standardized as follows.
Where, X is the standardized index value of R, F and M, X is the original value, and the maximum and minimum values of the index respectively. Since the influence of F and M is positive, the Eq. (7) is applicable, while the influence of R is negative, the Eq. (8) is applicable.
Using standardized data to calculate the objective weight of each indicator, the steps are as follows:
Step1. Calculate the proportion of the index in item j of the ith sample:
Step2. Calculate the information entropy of the jth index :
k is boltzmann coefficient.
Step3. Calculate the difference coefficient of item j:
Step4. Calculate the weight of each index :
Going through the above 4 steps, finally we get the objective weights of R, F and M are 0.19, 0.48 and 0.33 respectively.
3.2.3 The Integrated Weighting Method Establishes the Final Weight
Due to the strong subjective will to give weight to individuals, and the lack of objective analysis and judgment of the real situation, in this paper we combine the subjective and objective weight using the additive integration of the comprehensive integration method, to establish the final weight. Let Pj and Qj (j is the jth index) be the subjective and objective weight vectors of R, F and M, respectively. By using the addition integration method, the calculation equation of the final weight is as follows:
Where, k1 and k2 are the synthesis coefficients (k1, k2 > 0, and k1 + k2 = 1), which are used to measure the relative importance of subjective and objective weights. In general, the values of k1 and k2 can be determined by a mathematical model or according to the subjective preference of decision-makers. The calculation equations of k1 and k2 are as follows:
The final weights of R, F and M are 0.15, 0.42 and 0.43 respectively. According to the weights of the indicators, the value of a single customer calculated as follows.
Value score is the customer’s value score for sure, WR, WF and WM respectively represent the weight of R, F and M, and XR, XF and XM respectively represent R, F and M after standardization. The first 20% of users are screened in descending order of customer value, as shown in Fig. 4.
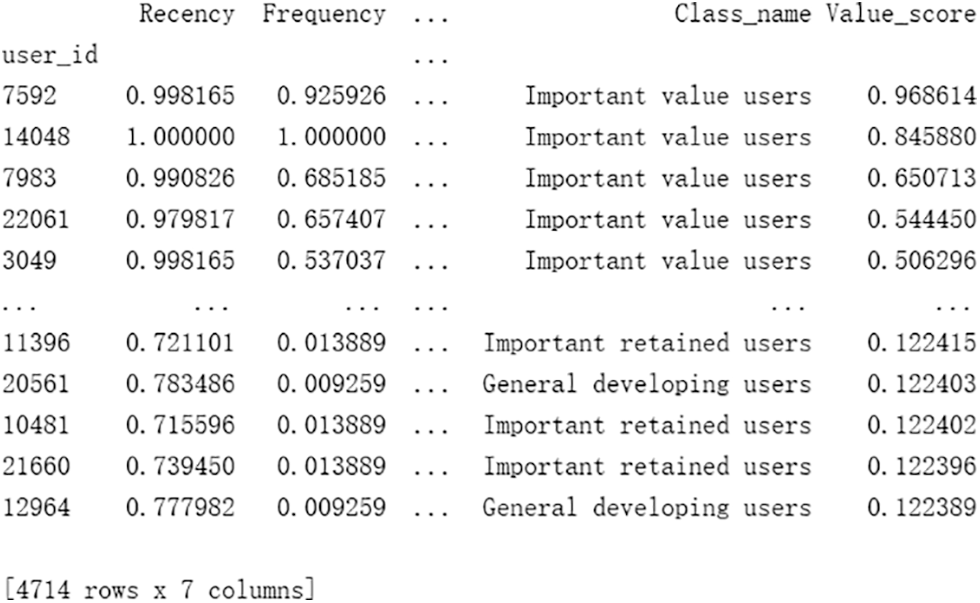
Figure 4: User filtering results
By using the sales data from CDnow website, we calculated the value of each user. Then we applied the model and weighted different transaction data with differentiated indexes. The key to the establishment of dynamic weight is the establishment of a judgment matrix. In this paper, a dynamic weighted RFM model was applied to the Brazilian e-commerce transaction data, combining the characteristics of the region, data and trading products judgment index importance: ① According to foreign media reports, over the past few years Brazil has been plagued by a political and economic crisis, in the face of economic downward pressure, Brazil’s electricity is strong, it gains made tremendous contributions to the economic development of the whole Brazil; ② From the characteristics of the data itself, many users only consume once and purchase only one piece of goods. Therefore, the traditional RFM model cannot be used for general weighting; ③ Through the observation of the trading products, it is found that most of the products are household items and electronic products, such as health beauty, auto, computers accessories, housewares, etc., which are durable goods and the buyback cycle is irregular. The trade product screenshot is shown in Fig. 5.
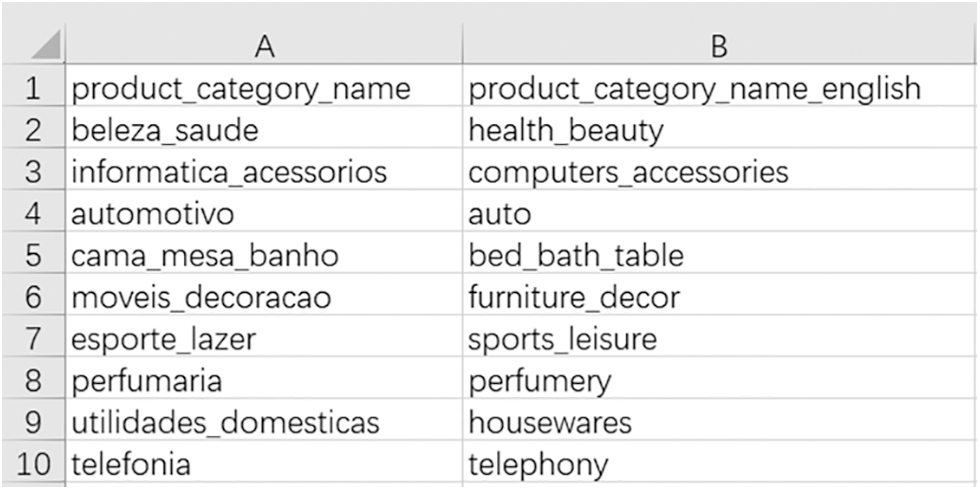
Figure 5: Trade product screenshot
Therefore, we believe that the last purchase date and total consumption times have little impact on user value. So, the judgment matrix is shown in Tab. 3. User value calculation and high-quality user screening results are shown in Fig. 6.
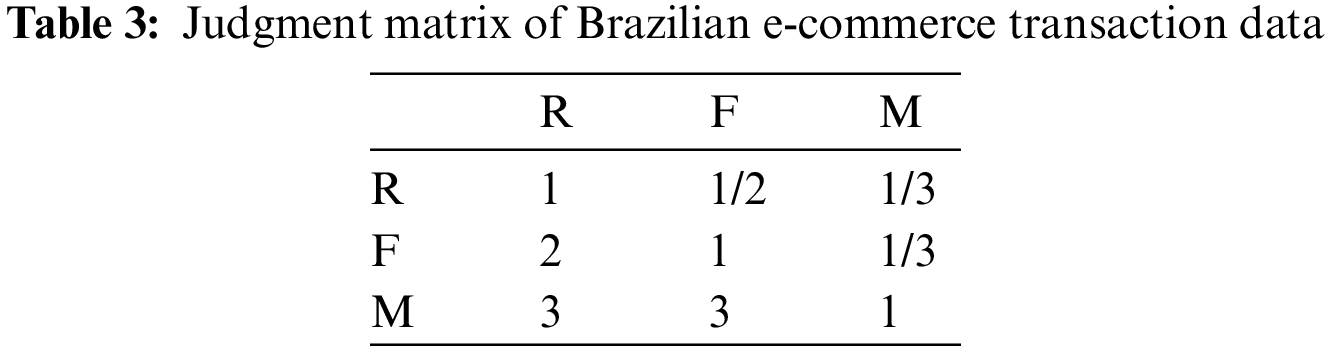
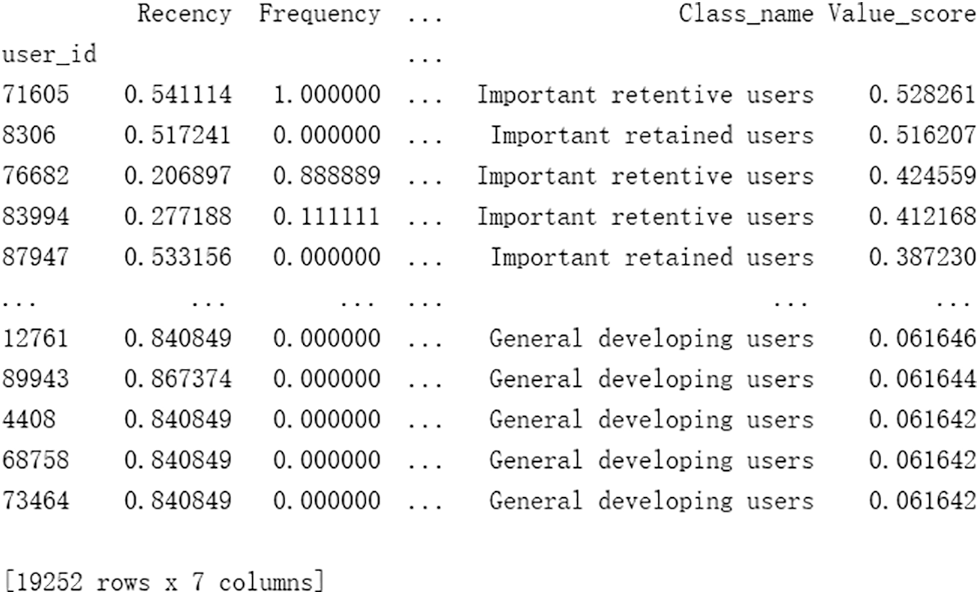
Figure 6: Filtering results of Brazilian e-commerce data users
According to the experimental results, after the dynamic weight is assigned to the traditional RFM model, the most valuable customers are not necessarily the important ones. At this point, the customer value combines the data characteristics to judge the importance of indexes, instead of classifying users in a general way, so the user value evaluation results are more reasonable.
As an effective tool for identifying customer value and customer profitability, the RFM model can easily and quickly identify the most valuable customers (Important value users) and the least valuable customers (General retained users). For the middle six categories of customers, the RFM model cannot effectively judge the category ranking of user value, because different businesses have different emphases on R, F and M, so they need to differentiate the weight of each index. The dynamic weight RFM model is built based on the traditional RFM model. Through the customer value calculation, the value difference of each type of user and even each user can be clarified to meet the requirements of dynamic adjustment of index weight of different businesses, to help enterprises select the best users for precision marketing. Experiments on different data in this paper show that the dynamic weight RFM model applies to the transaction data of different businesses, and the user value evaluation results are more scientific, effectively making up for the defects of the traditional RFM model.
Meanwhile, our research discovery the limitations of RFM analysis is obvious. RFM only uses historical data about customers, which results in RFM being unable to identify future customer behavior that predictive methods may be able. Using RFM modeling can provide valuable insights about customers. But it does not take into account many other factors about the customer. Customer demographics such as age, sex and ethnicity are not covered in RFM analysis either. In-depth targeted marketing may also use the type of item purchased or customer campaign responses as factors.
Funding Statement: The research was co-completed by School of Journalism and Communication of Hunan Normal University and Financial Big-data Research Institute of Hunan University of Finance and Economics. This research was funded by This work was supported by the National Natural Science Foundation of China (No.72073041); Open Foundation for the University Innovation Platform in Hunan Province (No. 18K103);2011 Collaborative Innovation Center for Development and Utilization of Finance and Economics Big Data Property, Universities of Hunan Province, Open Project (Nos. 20181901CRP03, 20181901CRP04, 20181901CRP05); 2020 Hunan Provincial Higher Education Teaching Reform Research Project(Nos. HNJG-2020-1130, HNJG-2020-1124); and 2020 General Project of Hunan Social Science Fund(No. 20B16).
Conflicts of Interest: The authors declare that they have no conflicts of interest to report regarding the present study.
References
1. Y. Yang, D. Zhou and X. Yang, “A Multi-feature weighting based K-means algorithm for MOOC learner classification,” Computers, Materials & Continua, vol. 59, no. 2, pp. 625–633, 2019. [Google Scholar]
2. S. Monalisa, P. Nadya and R. Novita, “Analysis for customer lifetime value categorization with RFM model,” Procedia Computer Science, vol. 161, pp. 834–840, 2019. [Google Scholar]
3. M. J. Awan, M. S. M. Rahim, H. Nobanee, A. Munawar, A. Yasin et al., “Social media and stock market prediction: A big data approach,” Computers, Materials & Continua, vol. 67, no. 2, pp. 2569–2583, 2021. [Google Scholar]
4. Y. S. Cho, S. C. Moon, S. Jeong, I. B. Oh and K. H. Ryu, “Clustering method using item preference based on RFM for recommendation system in U-commerce,” Ubiquitous Information Technologies and Applications, vol. 214, pp. 353–362, 2013. [Google Scholar]
5. K. Coussement, F. A. M. Van-Den-Bossche and K. W. De-Bock, “Data accuracy’simpact on segmentation performance: Benchmarking RFM analysis, logistic regression, and decision trees,” Journal of Business Research, vol. 67, no. 1, pp. 2751–2758, 2014. [Google Scholar]
6. Y. H. Hu and T. W. Yeh, “Discovering valuable frequent patterns based on RFM analysis without customer identification information,” Knowledge-Based Systems, vol. 61, no. 3, pp. 76–88, 2014. [Google Scholar]
7. Z. Zohre and A. V. Yousef, “Measuring customer loyalty using an extended RFM and clustering technique,” Management Science Letters, vol. 4, no. 5, pp. 905–912, 2014. [Google Scholar]
8. H. Zhang, K. Hou and Z. Zhou, “A weighted KNN algorithm based on entropy method,” Intelligent Computing and Internet of Things, vol. 924, pp. 443–451, 2018. [Google Scholar]
9. X. Liu and G. Yang, “Research on the selection model of technology-based intellectual property evaluation method based on analytic hierarchy process,” Cluster Computing, vol. 22, no. 2, pp. 2943–2953, 2019. [Google Scholar]
10. E. Wong and Y. Wei, “Customer online shopping experience data analytics,” International Journal of Retail & Distribution Management, vol. 46, no. 4, pp. 406–420, 2018. [Google Scholar]
11. Y. Chang, C. Liu, M. Liu, W. Liu, Z. Liu et al., “Differentiation degree combination weighting method for investment decision-making risk assessment in power grid construction projects,” Global Energy Interconnection, vol. 2, no. 5, pp. 465–477, 2019. [Google Scholar]
12. Y. H. Hu, T. C. K. Huang and Y. H. Kao, “Knowledge discovery of weighted RFM sequential patterns from customer sequence databases,” Journal of Systems and Software, vol. 86, no. 3, pp. 779–788, 2013. [Google Scholar]
13. A. J. Christy, A. Umamakeswari, L. Priyatharsini and A. Neyaa, “RFM ranking – an effective approach to customer segmentation,” Journal of King Saud University - Computer and Information Sciences, https://doi.org/10.1016/j.jksuci.2018.09.004, 2018. [Google Scholar]
14. S. Xu, D. Xu and L. Liu, “Construction of regional informatization ecological environment based on the entropy weight modified AHP hierarchy model,” Sustainable Computing: Informatics and Systems, vol. 22, pp. 26–31, 2019. [Google Scholar]
15. L. Li, F. Liu and C. Li, “Customer satisfaction evaluation method for customized product development using entropy weight and analytic hierarchy process,” Computers & Industrial Engineering, vol. 77, pp. 80–87, 2014. [Google Scholar]
16. H. C. Chang and H. P. Tsai, “Group RFM analysis as a novel framework to discover better customer consumption behavior,” Expert Systems with Applications, vol. 38, no. 12, pp. 14499–14513, 2011. [Google Scholar]
17. M. Khajvand, K. Zolfaghar, S. Ashoori and S. Alizadeh, “Estimating customer lifetime value based on RFM analysis of customer purchase behavior: Case study,” Procedia Computer Science, vol. 3, pp. 57–63, 2011. [Google Scholar]
18. Z. C. Lin and C. H. Cheng, “Creative design of multi-layer web frame structure using modified AHP and modified TRIZ clustering method,” Computers, Materials & Continua, vol. 68, no. 1, pp. 25–54, 2010. [Google Scholar]
19. A. Wulam, Y. Wang, D. Zhang, J. Sang and A. Yang, “A recommendation system based on fusing boosting model and dnn model,” Computers, Materials & Continua, vol. 60, no. 3, pp. 1003–1013, 2019. [Google Scholar]
20. Y. L. Chen, M. H. Kuo, S. Y. Wu and K. Tang, “Discovering recency, frequency, and monetary (RFM) sequential patterns from customers’ purchasing data,” Electronic Commerce Research and Applications, vol. 8, no. 5, pp. 241–251, 2009. [Google Scholar]
21. S. Bayrak, E. Yucel, H. Takci and R. Samli, “Classification of epileptic electroencephalograms using time-frequency and back propagation methods,” Computers, Materials & Continua, vol. 69, no. 2, pp. 1427–1446, 2021. [Google Scholar]
22. B. Janakiraman and S. Arumugam, “Personalized nutrition recommendation for diabetic patients using optimization techniques,” Intelligent Automation & Soft Computing, vol. 26, no. 2, pp. 269–280, 2020. [Google Scholar]
23. B. Shazad, H. U. Khan, Z. Rehman, M. Farooq, A. Mahmood et al., “Finding temporal influential users in social media using association rule learning,” Intelligent Automation & Soft Computing, vol. 26, no. 1, pp. 87–98, 2020. [Google Scholar]
24. C. Luo, C. Shi, X. Li, X. Wang, Y. Chen et al., “Multi-task learning using attention-based convolutional encoder-decoder for dilated cardiomyopathy cmr segmentation and classification,” Computers, Materials & Continua, vol. 63, no. 2, pp. 995–1012, 2020. [Google Scholar]
25. E. M. Abdelkader, O. Moselhi, M. Marzouk and T. Zayed, “A Multi-objective invasive weed optimization method for segmentation of distress images,” Intelligent Automation & Soft Computing, vol. 26, no. 4, pp. 643–661, 2020. [Google Scholar]
Cite This Article
 Copyright © 2023 The Author(s). Published by Tech Science Press.
This work is licensed under a Creative Commons Attribution 4.0 International License , which permits unrestricted use, distribution, and reproduction in any medium, provided the original work is properly cited.
 Downloads
 Citation Tools