
 Submit a Paper
 Propose a Special lssue
 Open Access
ARTICLE
A New Framework for Employing Responsive End-Users Using FAHP and PSO Algorithm
1 Faculty of Electrical Engineering, Shahid Beheshti University, A.C., Tehran, Iran
2 Department of Electrical Engineering, Jouybar Branch, Islamic Azad University, Jouybar, Iran
3 Department of Electrical and Electronics Engineering, Faculty of Engineering and Architectures, Nisantasi University, Istanbul, Turkey
4 Department of Information Electronics, Fukuoka Institute of Technology, Fukuoka, Japan
* Corresponding Author: Mehrdad Ahmadi Kamarposhti. Email:
Computers, Materials & Continua 2023, 74(1), 951-964. https://doi.org/10.32604/cmc.2023.032631
Received 24 May 2022; Accepted 27 June 2022; Issue published 22 September 2022
 View Full Text
 Download PDF
Abstract
The capacitor bank and synchronous condenser have been the only available sources of reactive power. Nowadays, most of the appliances use a power electronic interface for their connection. Applying a power electronic interface adds many features to these appliances. One of the promising features is their capability to interact with Volt-VAR programs. In this paper was investigated the reactive power interaction of the end-user appliances. For this purpose, the distribution network buses are ranked based on their effectiveness, followed by studying their interaction in the Volt-VAR program. To be able to consider the uncertainties, Probability Density Function (PDF) curve was discretized to represent different scenarios, and the reduction method was utilized to reduce the situations.Keywords
Nowadays, the operation of the power system is almost limited due to low voltages and contingencies. The setting of power factor closer to the applied loads is one of the useful solutions to overcome the low voltage problem, which also reduces power system loss and improve efficiency and loading of transmission line [1]. Loss reduction is a solution for energy efficiency improvement in Distribution System Management (DSM). Control of the reactive power resources often results in the better reactive power flow in the network and loss reduction. Traditionally, switchable shunt capacitor banks and synchronous condensers are the only available Volt-Ampere Reactive (VAR) sources in the network. Existing and forthcoming Distributed Energy Resources (DERs) can provide support of reactive power. Also because of their ever-increasing penetration, they are considered as significant future VAR sources that bring new opportunities for voltage enhancement and loss reduction [2].
The power electronic interface of the appliances can inject/absorb the reactive power based on their design capacity. This capability can be employed for local power factor correction programs. This method can be used in networks where costs and installation time are minimal, which are its advantages compared to other ways. The participation of the end-user in Volt-VAR programs resembles capacitor bank placement in many features [3]. The end-users with a power electronic interface can respond to their surrounding condition based on their control algorithm [4]. Responsive end-user devices (REDs) include personal computers, PHEV/EVs, elevators, appliances, and UPS systems. All of these devices are in the distribution network layer (Q-C bus) where some local problems can be solved without the involvement of the upper layers [5].
To take advantage of this potential end-user capability, three central questions must be responded to [6]:
• Which Q-C buses are the most effective?
• What is the optimized participation of each selected RED?
• How is the REDs uncertainty considered in problem formulation?
To rank the distribution network buses based on their effectiveness, different methods were reviewed in literature and found that sensitivity analysis is the most widely used approach. In this method, buses with higher sensitivity are prioritized for participation in the Volt-VAR program [7]. Practically, the buses with higher sensitivity necessarily are not preferred. For instance, a bus with relatively limited and high sensitivity participation capacity must not be selected for Volt-VAR program participation. Thus, we utilized the Fuzzy Analytical Hierarchy Process (FAHP) in the present work for Q-C buses, as the candidate bus selection [8]. Different optimization algorithms are used in literature to determine the selected Q-C buses participation in Volt-VAR programs [9]. Rogers et al. [1] used the “steepest descent approach” for optimization purposes. The sensitivity analysis and AC power flow are used in this paper for Q-C bus selection. The proposed method is implemented on IEEE 24-Bus Test System. The steepest descent approach is also used in [8] to solve the problem of optimization and minimize the sum of the differences of the voltage buses from their specified values, as the objective of the optimization function. To identify candidate buses, one of the criteria considered in this study is the sensitivity of the buses voltages regarding the reactive power injection. Load controllability was proposed as another criterion for candidate bus selection in this paper. The load controllability was allocated to each load based on former knowledge. Abessi et al. [5] applied the genetic algorithm to minimize the objective function. The objective function consists of voltage profile enhancement and reactive power change minimization.
One of the cases that the distribution system may face, is load uncertainty. The load forecast involves some degree of uncertainty that affects the calculations because of the nature of loads [10]. Generally, load estimation error follows certain distribution function [11,12]. Load uncertainty can model by variance and mean that are used to form Load Probability Density Function (PDF) [13,14]. Using the method of reducing the scenarios obtained from PDF discretization, a good initial large-scale problem approximation can be achieved [12].
None of the mentioned literature, except [15], considers all the criteria involved in candidate bus selection. This paper used FAHP as a multi-criteria decision-making method to prioritize the Q-C buses. Moreover, to examine the more realistic behavior of the loads, the uncertainty was added to the model comprehensively discussed in [15]. Incorporating the load uncertainty in addition to the proposed criteria could simulate more actual conditions of the power system, which gives a better understanding of the system for remedial actions.
• In Section 2, the following issues are addressed:
• Candidate bus selection method
• Load flow formulation
• Scenario generation and reduction
2.1 Selection of Candidate Q-C Bus
The goal of the conventional literature is to find buses in which reactive power injection/absorption has the best effect on the power system. The reactive power injection/absorption buses are indicated by Q-Controlled (Q-C) bus.
However, the advent of smart grids and home appliances with electronic power interfaces enables end users to participate in Volt/VAR applications. In this paper the FAHP method is used to determine the most efficient buses.
The final weights of the criteria is calculated by the fuzzy method in the FAHP method. Decision makers are often confronted with fuzzy sets to express the relative importance of one criterion in relation to other criteria. Therefore, FAHP is exploited in which the unfavorable ratios of comparisons are expressed as fuzzy [16].
In FAHP linguistic variables are used instead while in conventional AHP, a team of evaluators and expert staff fill in the comparison matrices and assigns a number to each criterion according to the other criteria [17].
Each element in the cross-comparison matrices is its displacement element. The explicit pairwise comparison used in conventional AHP has advantages such as simplicity. However, it seems incorrect to express the views of decision makers. In this paper, triangular fuzzy numbers have been used for fuzzy construction due to their accuracy.
The Eq. (1) describes the membership function of the triangular fuzzy number
where,
RED can inject reactive power based on the capacity of its electronic power interface. Hence, when a device is “ON”, the required active power occupies most of the capacity of its electronic power interface, and the device’s ability to inject reactive power in “OFF” mode is greatly increased. The Eq. (2) illustrates the capability of reactive power injection [5]:
where,
The voltage deviation, available reactive power, sensitivity, and power loss are the criteria that considered for selection of candidate Q-C bus in this paper,
Due to the characteristic of the radial distribution network and higher resistance/reactance ratio regarding the transmission system, the conventional power methods are not suitable for solving the problem of load flow.
The Branch-Current to Bus-Voltage (BCBV) and Bus-Injection to Branch-Current (BIBC) methods are appropriate techniques for solving the distribution system load flow. The main steps of this method are defined as below:
• Equivalent current injection
• Forming BIBC matrix
• Forming BCBV matrix
The voltage of each bus shall be updated by Eq. (3) [18]:
where
2.3 Scenario Generation and Reduction Method
Estimation of load data is one of the most necessary tasks in distribution system operation. Considering the nature of load in the distribution system, its variation with time over a wide range is inevitable. Therefore, the load data are regarded as stochastic variables [3]. Mathematical load estimation methods are used to estimate the load data in unmetered points; besides, for future load approximation, load forecast methods are used. Due to insufficient measurement and unpredictable load profile, the loads cannot be estimated accurately [10]. One of the most effective parameters in the occurred uncertainty is the load forecast uncertainty. The load estimation error follows specific distribution function [12]. The probability distribution assumes about one particular standard from random variables; e.g., normal, uniform or Poisson distribution. All distribution functions are determined by a set of parameters that are arranged with the probability of an event where the random variable is discrete or within a specified range of continuous values. The choice of a distribution model means the option of standard probability distribution and then adjusts its parameters according to the data [19]. The Eq. (4) describes the PDF of truncated normal distribution as follows:
where
Where
The CDF of truncated distribution is:
Based on historical data of the loads, the load is supposed to have a normal distribution [20].
The dimensionality of stochastic programming is directly dependent on the number of scenarios. Because scenario generation algorithm generates many situations that make the stochastic programming cumbersome, to solve the problem within a reasonable time, the conditions were reduced such that a tradeoff is made between computational burden and accuracy of the results. Reference [20] proposed the method used for scenario reduction in the present paper. The reduction method determines a subset of scenarios and allocates a new probability to the chosen situations.
The Section 3 focuses on the proposed approach. The proposed method consists of four main stages.
As shown in Fig. 1, in the first stage, the network, load, and end-users data are acquired. In next step, these data are used for two primary purposes: candidate bus selection; and scenario generation and reduction. Candidate bus selection and scenario generation and modification are performed based on the approaches described in Section 2.1 and 2.3, respectively. In the third stage, PSO algorithm is used to specify optimal participation of candidate buses in scenarios. The results of the proposed approach are obtained in stage 4.
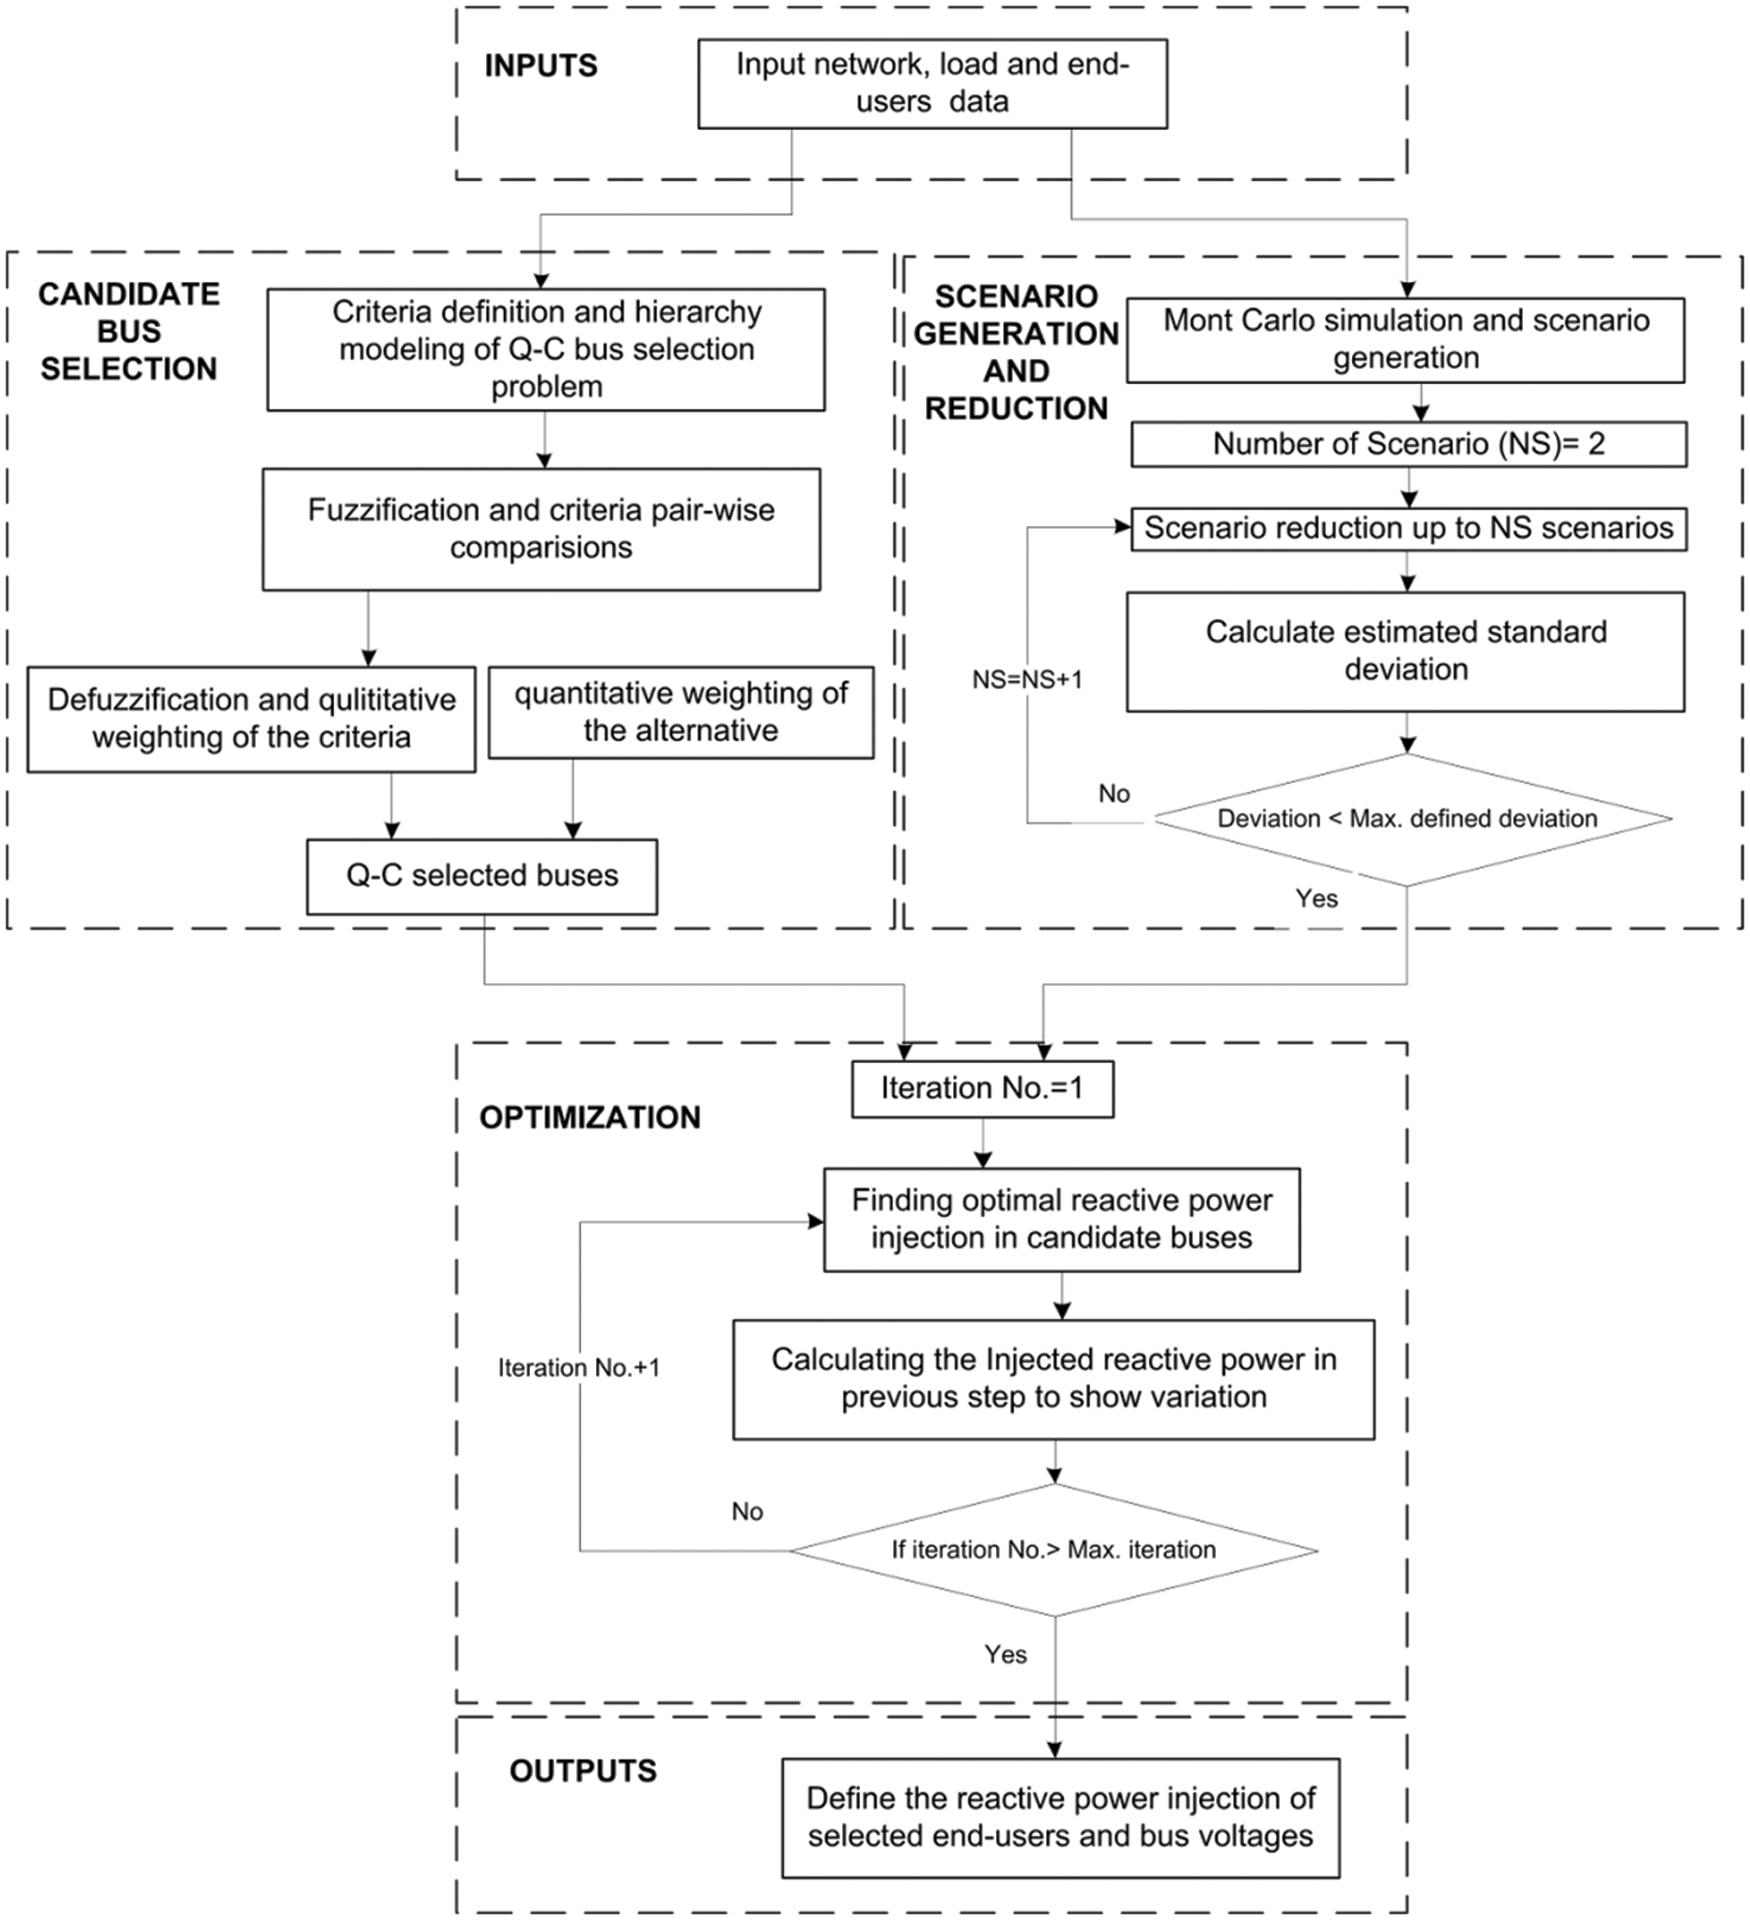
Figure 1: The proposed approach
As discussed in Section 2.2, the BIBC and BCBV method are used as direct approaches for distribution load flow solution [18]. Voltage sensitivity to reactive power is one of the key criteria in selecting a Q-C bus. The sensitivities are commonly used to estimate the effect of a small variable change on the rest of the system.
The method presented in [8] is used to calculate the sensitivity matrices. It was confirmed that small load changes do not lead to significant changes in the sensitivity matrix data. Hence, a snapshot of the base load was used as input data for sensitivity analysis to simplify the problem. The sensitivity of g to reactive power injection is calculated as follow [5]:
Where
Distribution system nodes are ranked according to their priority using the FAHP method. The Eq. (7) describes the objective function of the optimization problem.
where
To evaluate the available reactive power of each bus, it is necessary to carefully examine the loads connected to each bus and the capacity of their electronic power interface. However, this research is beyond the scope of this article. To evaluate the effectiveness of the proposed method, the available reactive power for each bus was considered:
where
An IEEE 33 Distribution Testing System has been used to illustrate the effectiveness of the proposed method [21,22]. It contains 33 buses and 32 sections. The base voltage and the base load are 12.66 kV and 100 MVA respectively. The total reactive load is 2300 kVAR and the total reactive active load is 3720 kW. Fig. 2 shows the single-line diagram of test system.
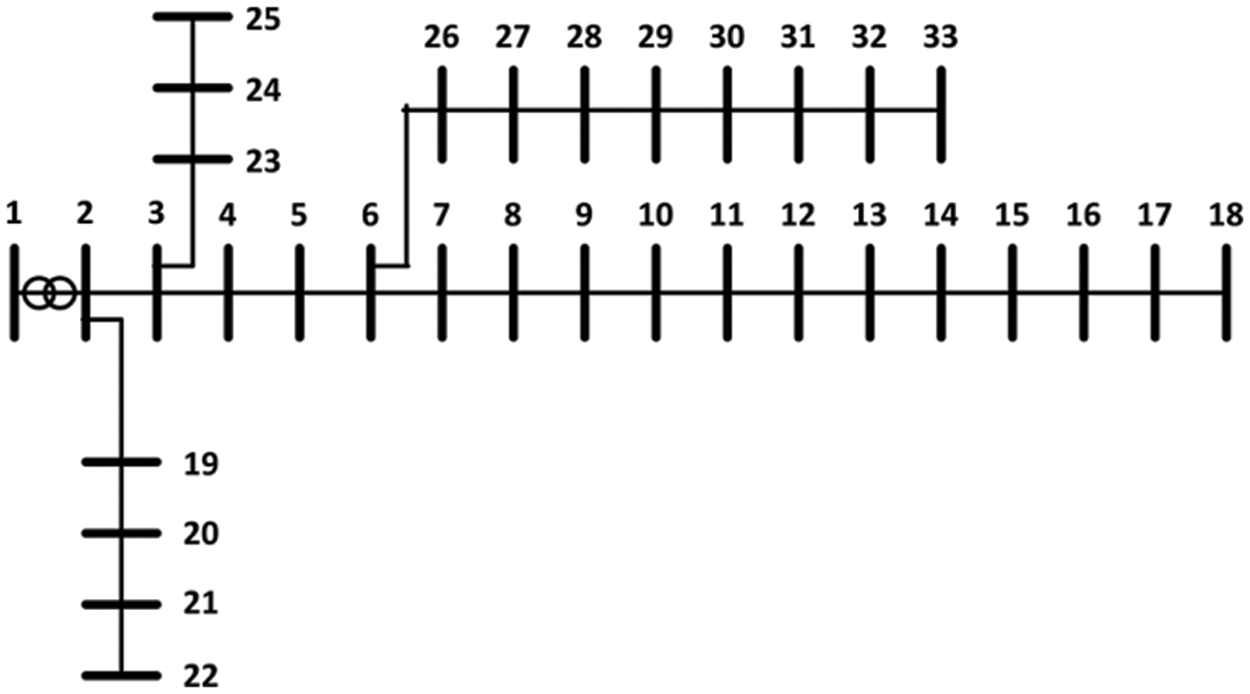
Figure 2: The single-line diagram of IEEE 33 bus system
The distribution system buses were ranked by applying FAHP algorithm (Fig. 3). The buses with higher relative priority are in the higher priority to participate in Volt-VAR programs.
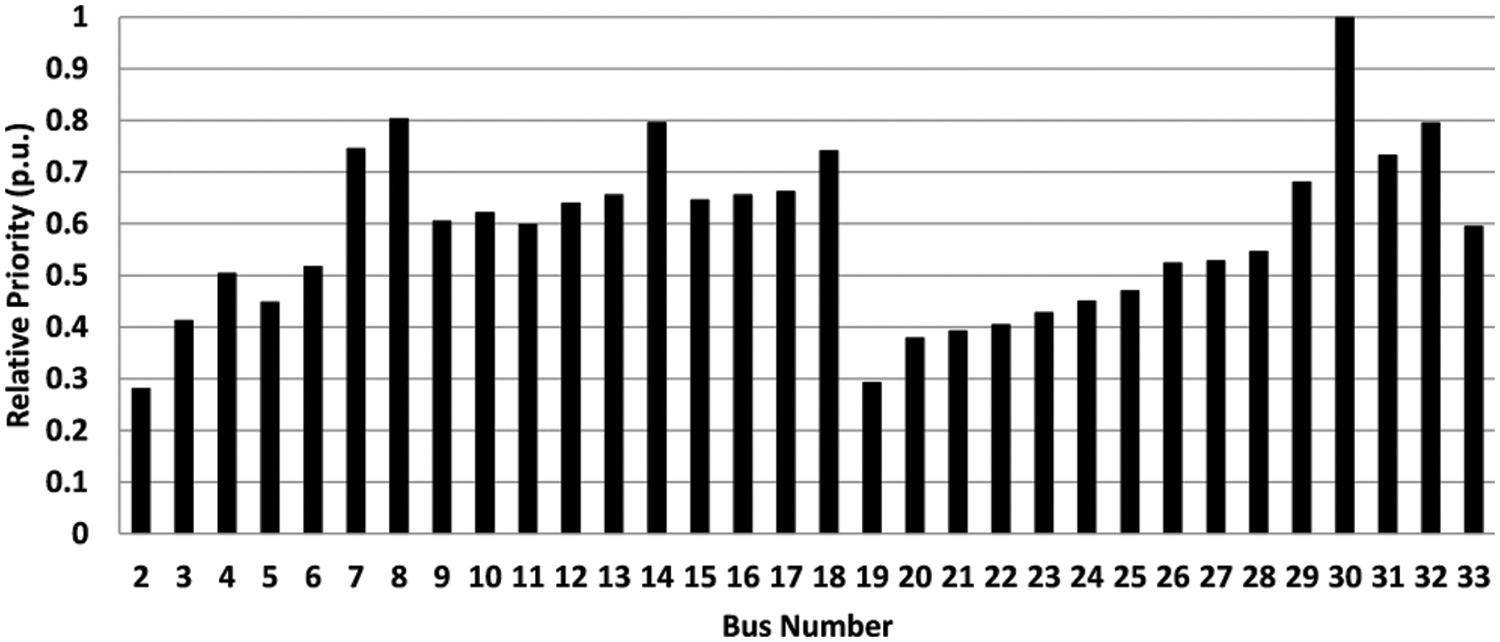
Figure 3: FAHP buses rank
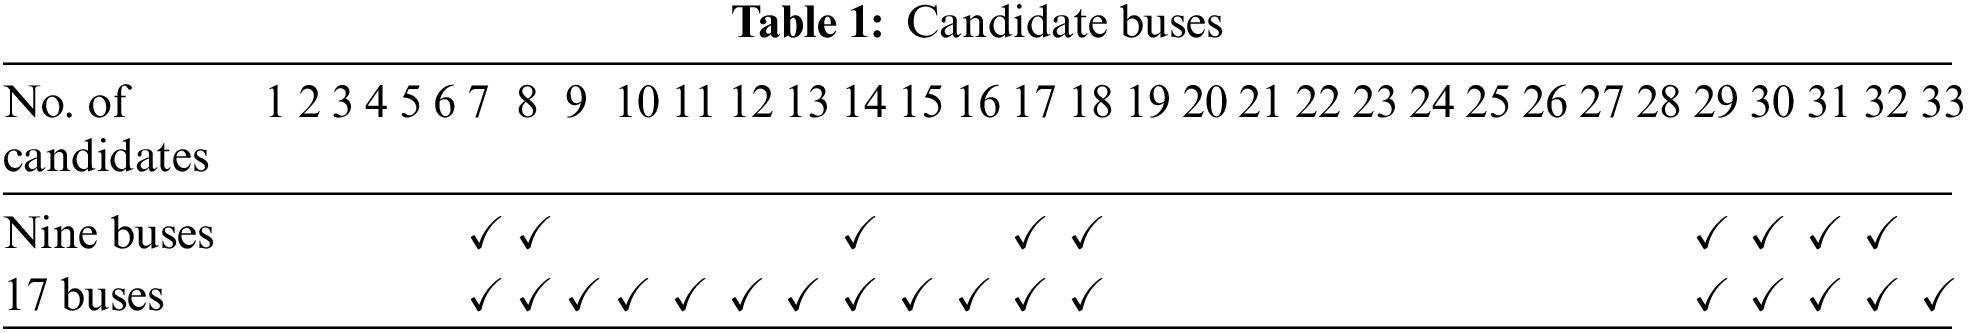
In this paper, two scenarios of 9 effective buses and 17 effective buses are used to determine the optimal end-user participation in Volt-VAR applications. As illustrated previously, the FAHP method was employed to determine the candidate buses for each mentioned scenarios. The candidate buses for two pre-mentioned scenarios are shown in Tab. 1.
The PSO optimization method is used to define the optimal participation of Q-C buses in Volt-VAR applications. This heuristic optimization algorithm is a population-based stochastic optimization, which is because of evolutionary calculus and artificial life. The main idea of the PSO is originated from organism social behavior, such as fish school, bird flocking and human social relations. The PSO properties such as a low constraint on the continuity of objective function and its ability to adapting to the dynamic situation, make it one of the most useful swarm intelligence algorithms [23–43].
The dynamic convergence behavior of PSO method for nine candidates and 17 candidate Q-C buses are plotted in Figs. 4 and 5, respectively.
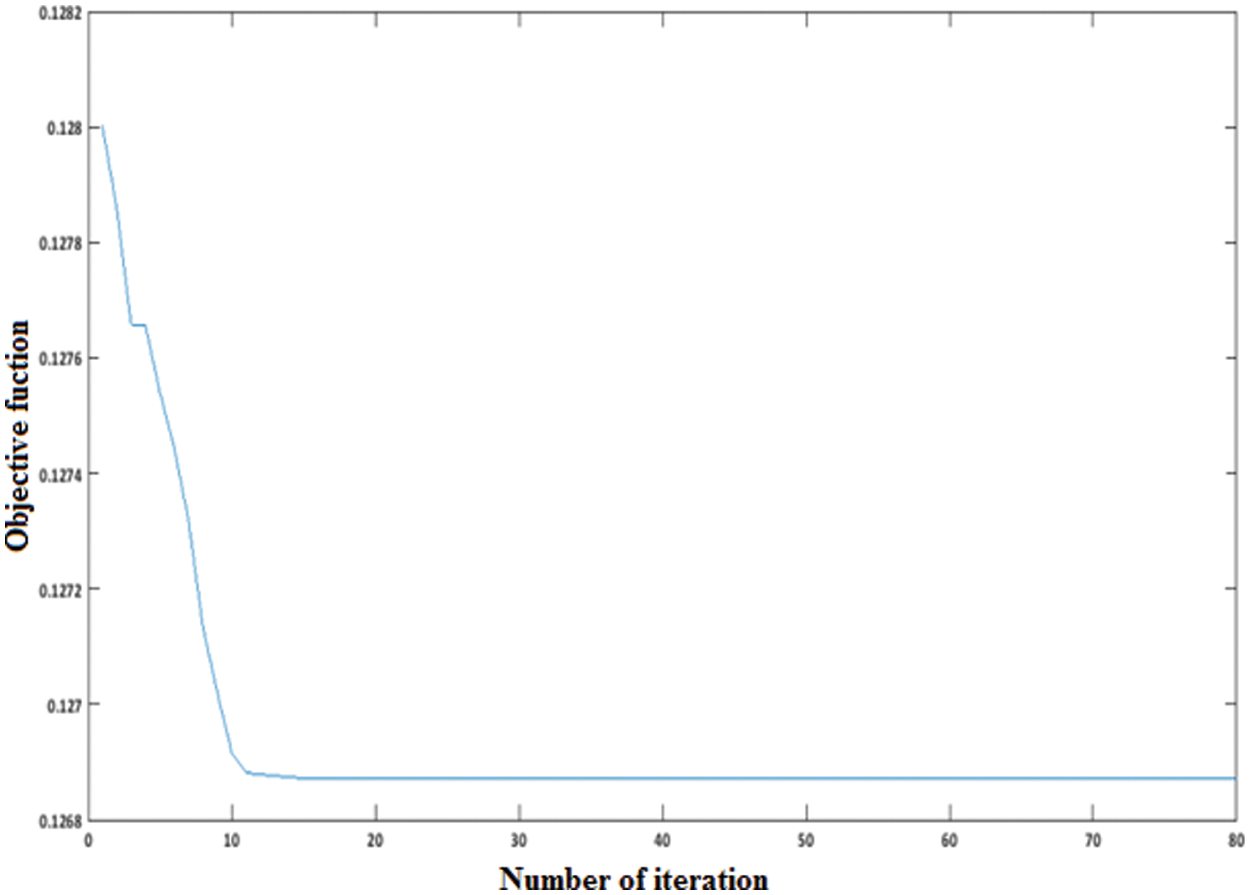
Figure 4: Convergence of PSO method for nine candidate Q-C buses
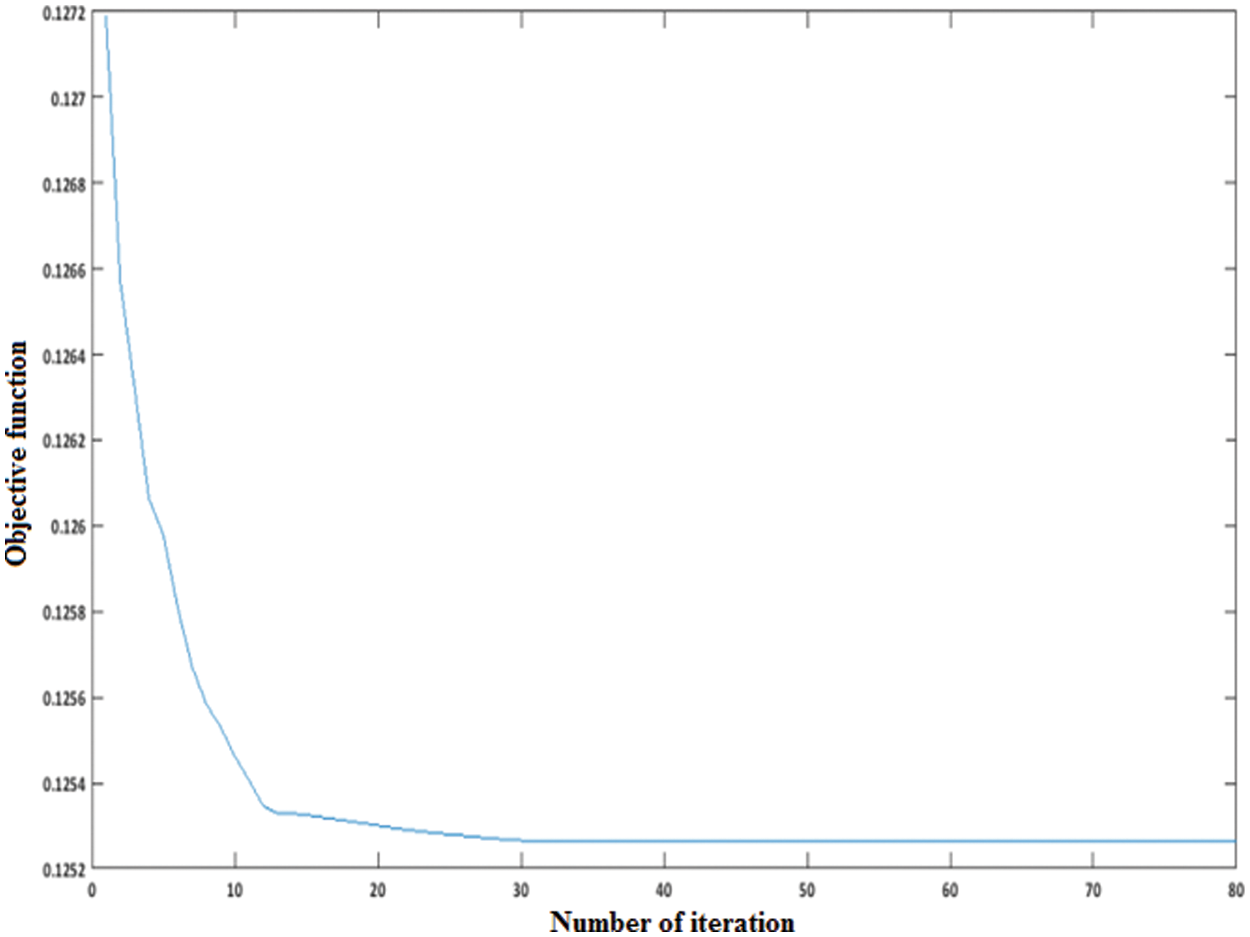
Figure 5: Convergence of PSO method for seventeen candidate Q-C buses
The local reactive power compensation leads to many benefits such as improving system power factor, increasing system capacity, reducing network loss, and improving voltage profile. By participating the nine candidate buses in Volt-VAR program, the improvement of the voltage profile of the distribution network buses is expected. The voltage of the IEEE 33 bus system before/after the end-user participation in the first scenario is presented in Fig. 6. As can be seen in Fig. 6, the profile of distribution system voltage can be improved by the involvement of the end-users in reactive power compensation. In the second scenario, the available end-users for participation in Volt-VAR programs increase to 17 candidate buses. The distribution system buses voltage profile of this scenario is described in Fig. 7.
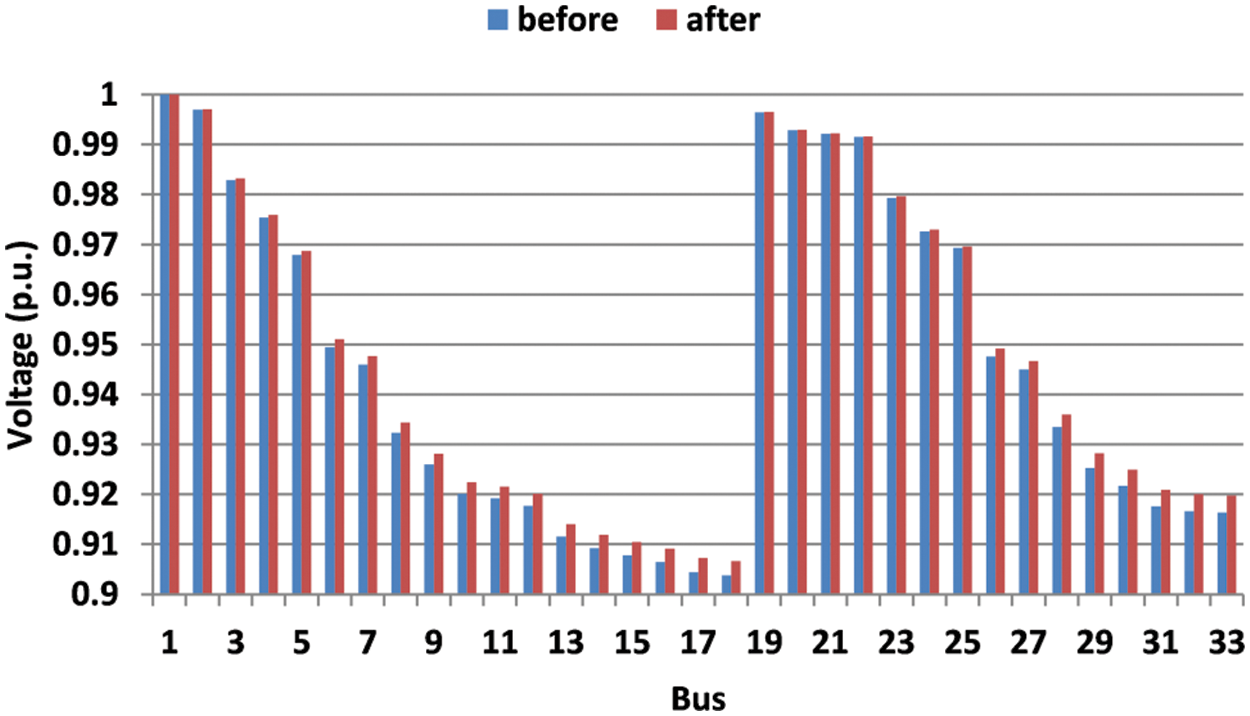
Figure 6: Voltage of the distribution buses before/after end-users participation in Volt-VAR program
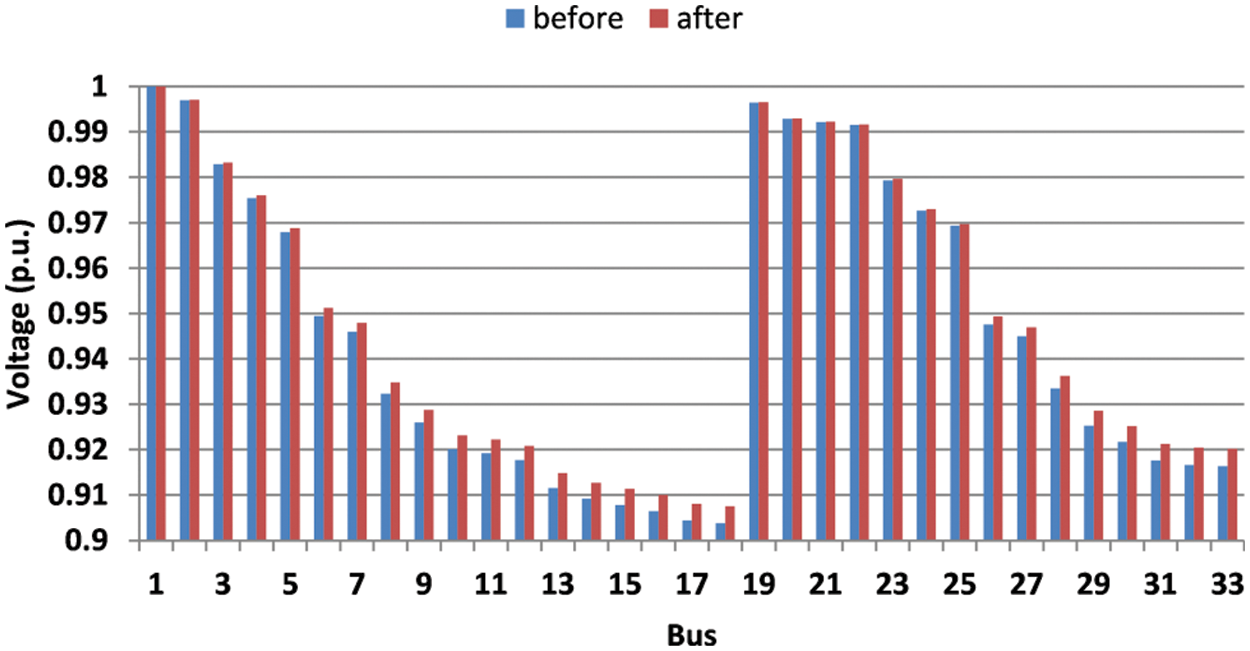
Figure 7: Voltage of the distribution buses before/after 17 candidate buses participation in Volt-VAR program
The reactive power injected by candidate Q-C buses in scenario 1 is shown Figs. 8 and 9 is for scenario 2. In Figs. 8 and 9, the unit of injected reactive power is VAR. The optimum responsive power compensation values are defined by the approach illustrated in Fig. 1.
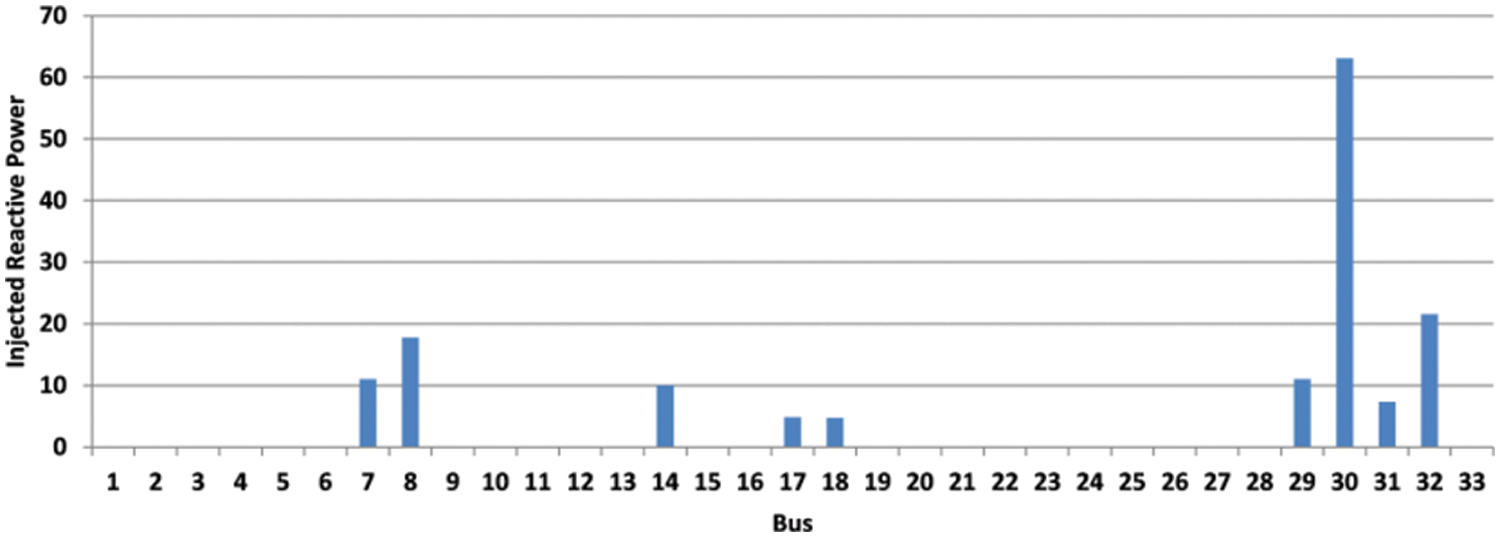
Figure 8: The injection of reactive power of the candidate Q-C buses in scenario 1
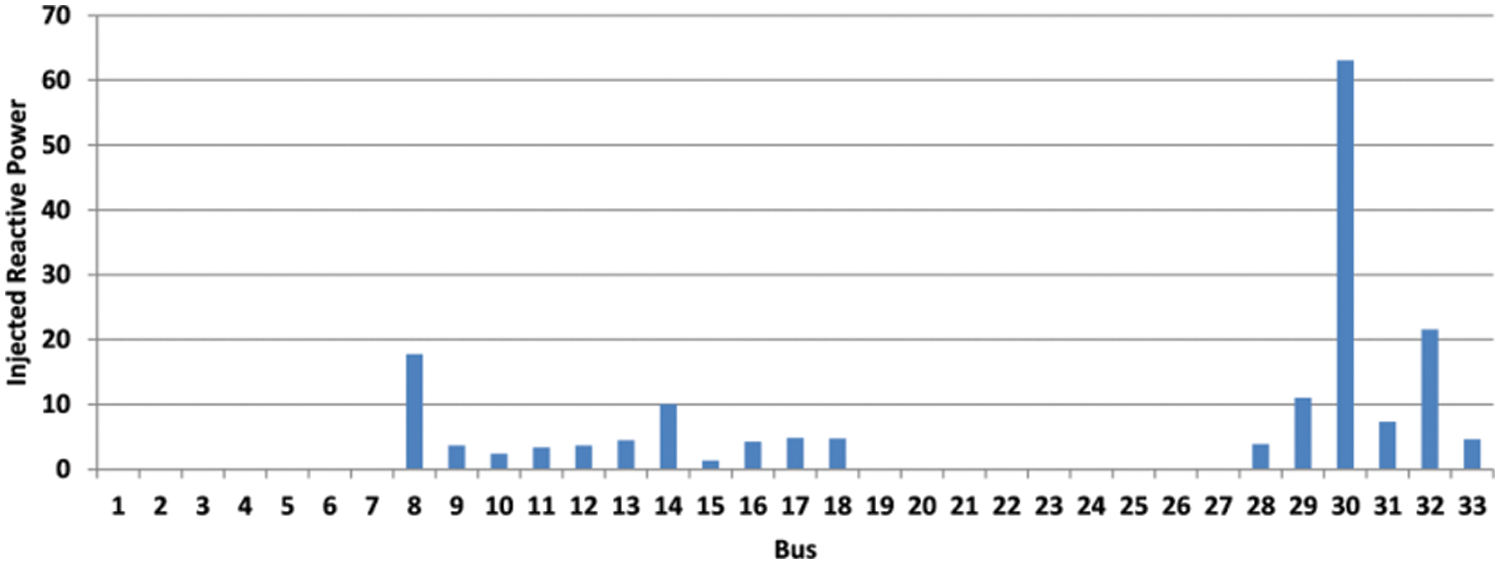
Figure 9: The injection of reactive power of the candidate Q-C buses in scenario 2
The results of load forecast and load estimation are not accurate, and therefore it is recommended that, given the uncertainty of load in the analysis of the distribution system. To consider the stochastic load behavior, scenario generation and reduction approach (described earlier) was used. The voltage expected value for both pre-mentioned scenarios are shown in Figs. 10 and 11.
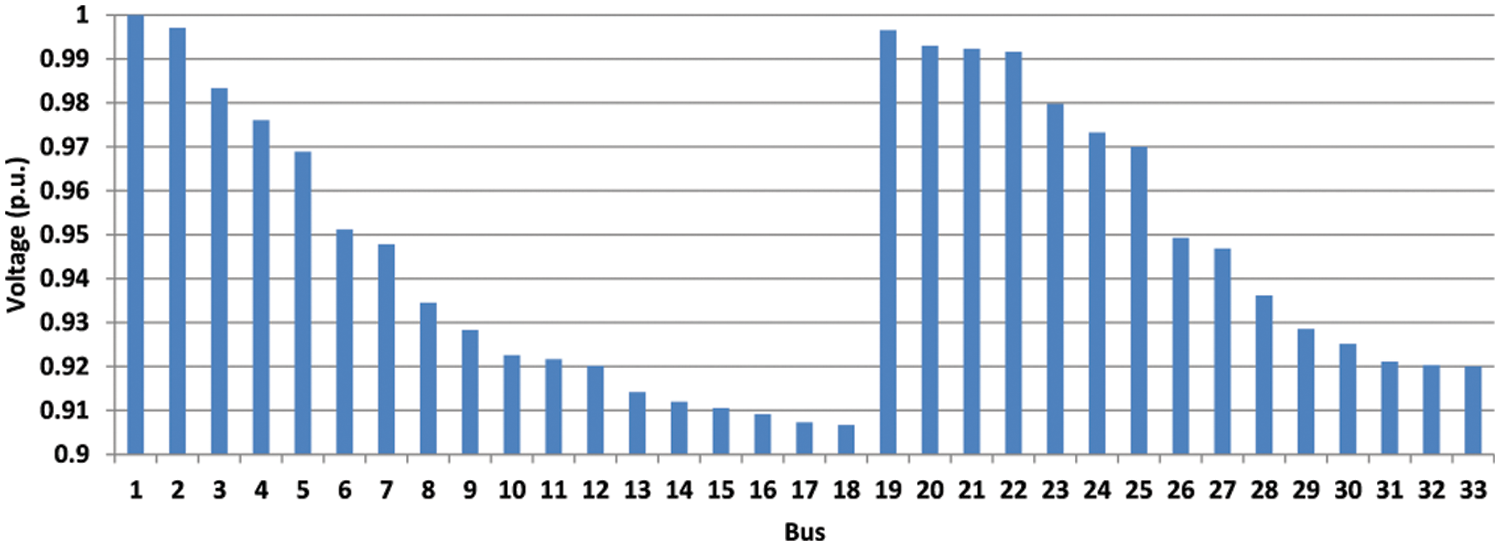
Figure 10: Expected voltage values for 9 candidate Q-C buses participation
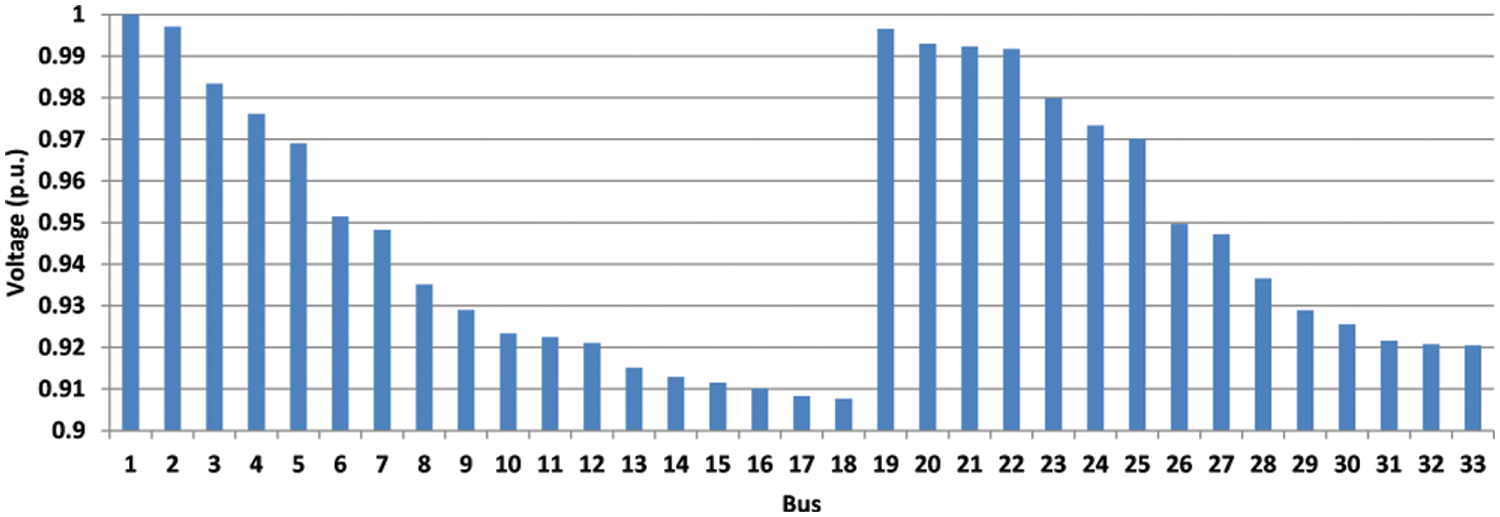
Figure 11: Expected voltage values for 17 candidate Q-C buses participation
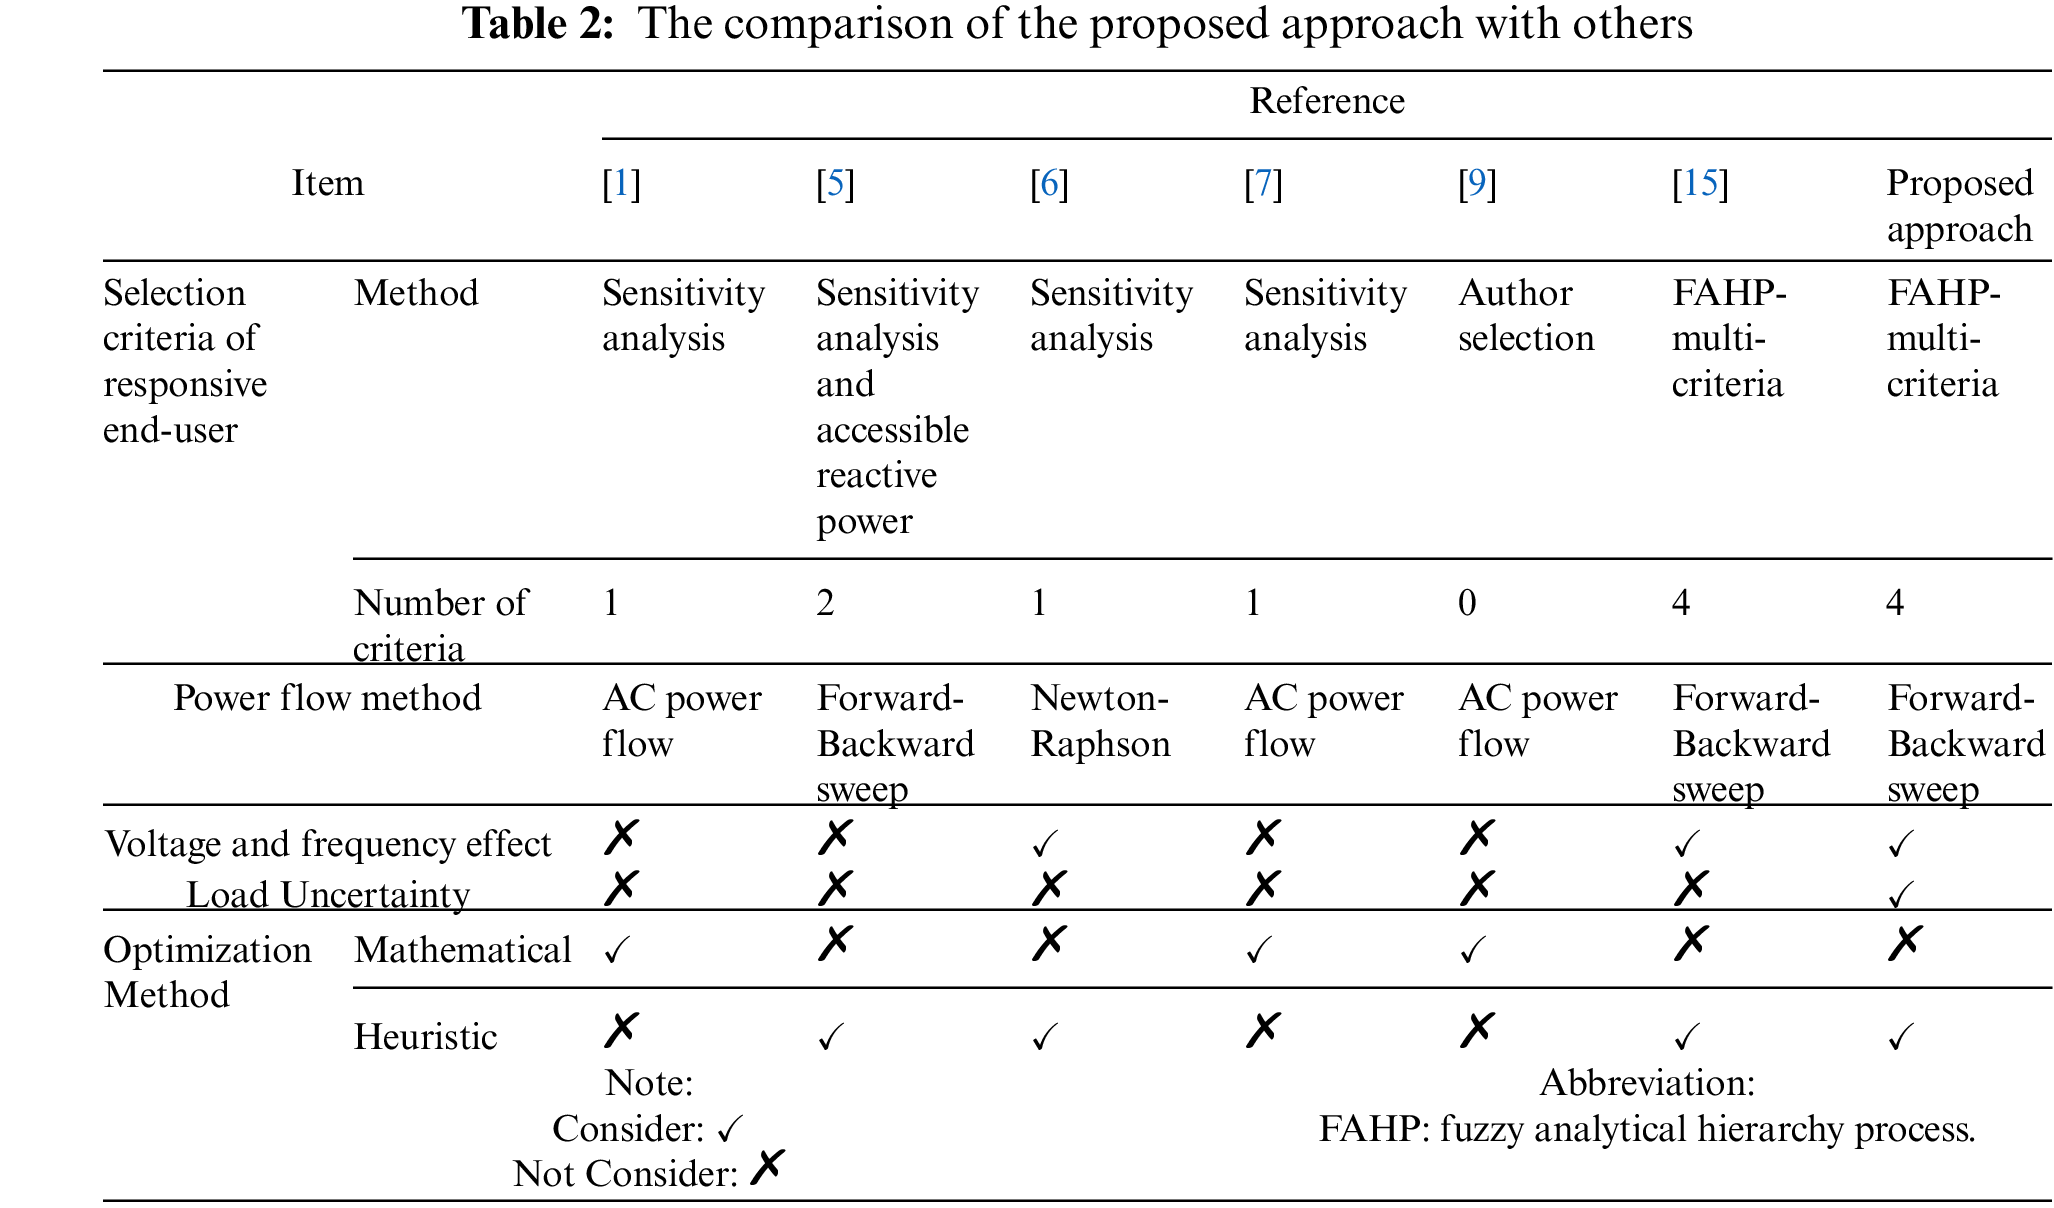
As described previously, the stochastic load consideration resulted in the more realistic outcome. Results from technical literature together with those of the presented study are summarized in Tab. 2.
Emerging the smart grid provides numerous benefits to the conventional distribution system. Nowadays, most of the end-user appliances use the power electronic interface for their connection to the distribution system. The power electronic interface enables these devices to inject/absorb reactive power based on the network condition and improve the distribution system stability and voltage profile. The FAHP method, because of its accuracy in dealing with multi-objective decision-making was used for Q-C bus ranking and the optimum participation of end-user obtained from PSO method. To simulate a more realistic situation in this work, the load uncertainty was also considered. Most of the current end-user appliances use power electronic interface for their connection. Such instruments have the ability of the reactive power injection/absorption. Exploiting this new capability is very beneficial for distribution system operation and results in a power factor correction closer to the load and voltage profile enhancement. As work in the future, we can consider renewable sources with the same approach in the paper and analyze their effect. Uncertainty in the generation of these resources and emergencies can also be considered.
Funding Statement: The authors received no specific funding for this study.
Conflicts of Interest: The authors declare that they have no conflicts of interest to report regarding the present study.
References
1. K. M. Rogers, R. Klump, H. Khurana and T. J. Overbye, “Smart-grid-enabled load and distributed generation as a reactive resource,” in 2010 Innovative Smart Grid Technologies (ISGT), Gaithersburg, MD, USA, pp. 1–8, 2010. [Google Scholar]
2. F. Yang and Z. Li, “Improve distribution system energy efficiency with coordinated reactive power control,” IEEE Transactions on Power Systems, vol. 31, no. 4, pp. 2518–2525, 2016. [Google Scholar]
3. M. Haghifam and O. P. Malik, “Genetic algorithm-based approach for fixed and switchable capacitors placement in distribution systems with uncertainty and time-varying loads,” IET Generation, Transmission & Distribution, vol. 1, no. 2, pp. 244–252, 2007. [Google Scholar]
4. A. Vaccaro, G. Velotto and A. F. Zobaa, “A decentralized and cooperative architecture for optimal voltage regulation in smart grids,” IEEE Transactions on Industrial Electronics, vol. 58, no. 10, pp. 4593–4602, 2011. [Google Scholar]
5. A. Abessi, V. Vahidinasab and M. S. Ghazizadeh, “Centralized support distributed voltage control by using end-users as reactive power support,” IEEE Transactions on Smart Grid, vol. 7, no. 1, pp. 178–188, 2016. [Google Scholar]
6. M. Bayat, K. Sheshyekani and A. Rezazadeh, “A unified framework for participation of responsive end-user devices in voltage and frequency control of the smart grid,” IEEE Transactions on Power Systems, vol. 30, no. 3, pp. 1369–1379, 2015. [Google Scholar]
7. K. M. Rogers, R. Klump, H. Khurana, A. A. Aquino-Lugo and T. J. Overbye, “An authenticated control framework for distributed voltage support on the smart grid,” IEEE Transactions on Smart Grid, vol. 1, no. 1, pp. 40–47, 2010. [Google Scholar]
8. D. K. Khatod, V. Pant and J. Sharma, “A novel approach for sensitivity calculations in the radial distribution system,” IEEE Transactions on Power Delivery, vol. 21, no. 4, pp. 2048–2057, 2006. [Google Scholar]
9. A. A. Aquino-Lugo, R. Klump and T. J. Overbye, “A control framework for the smart grid for voltage support using agent-based technologies,” IEEE Transactions on Smart Grid, vol. 2, no. 1, pp. 173–180, 2011. [Google Scholar]
10. A. P. Sakis Meliopoulos and F. Zhang, “Multi phase power flow and state estimation for power distribution systems,” IEEE Transactions on Power Systems, vol. 11, no. 2, pp. 939–946, 1996. [Google Scholar]
11. D. T. Nguyen, “Modeling load uncertainty in distribution network monitoring,” IEEE Transactions on Power Systems, vol. 30, no. 5, pp. 2321–2328, 2015. [Google Scholar]
12. Y. Wang, W. Wu, B. Zhang, Z. Li and W. Zheng, “Robust voltage control model for active distribution network considering PVs and loads uncertainties,” in IEEE Power & Energy Society General Meeting, Denver, CO, USA, pp. 1–5, 2015. [Google Scholar]
13. Z. Wang, B. Chen, J. Wang, J. Kim and M. M. Begovic, “Robust optimization based optimal DG placement in microgrids,” IEEE Transactions on Smart Grid, vol. 5, no. 5, pp. 2173–2182, 2014. [Google Scholar]
14. S. Conti and S. Raiti, “Probabilistic load flow using monte carlo techniques for distribution networks with photovoltaic generators,” Solar Energy, vol. 81, no. 12, pp. 1473–1481, 2007. [Google Scholar]
15. R. Etemad, M. S. Ghazizadeh and M. Ahmadian, “Exploiting end-users capability in voltage support by means of power electronic transformer,” International Transactions on Electrical Energy Systems, vol. 27, no. 10, pp. e2406, 2017. [Google Scholar]
16. P. Dehghanian, M. Fotuhi-Firuzabad, S. Bagheri-Shouraki and A. A. Razi Kazemi, “Critical component identification in reliability centered asset management of power distribution systems via fuzzy AHP,” IEEE Transactions on Power Systems, vol. 6, no. 4, pp. 593–602, 2012. [Google Scholar]
17. T. L. Saaty, “The analytic hierarchy process--what it is and how it is used,” Mathematical Modelling, vol. 9, no. 3--5, pp. 161--176, 1980. [Google Scholar]
18. J. Teng, “A direct approach for distribution system load flow solutions,” IEEE Transactions on Power Delivery, vol. 18, no. 3, pp. 882–887, 2003. [Google Scholar]
19. Y. V. Makarov, Z., Huang, P. V. Etingov, J. Ma, R. T. Guttromson et al., “Incorporating wind generation and load forecast uncertainties in to power grid operations,” in IEEE PES T&D, New Orleans, LA, USA, pp. 1--8, 2010. [Google Scholar]
20. J. Dupǎ cová, N. Gröwe-Kuska and W. Römisch, “Scenario reduction in stochastic programming: An approach using probability metrics,” Mathematical Programming, vol. A 95, pp. 493–511, 2003. [Google Scholar]
21. P. R. Babu, C. Rakesh, M. Kumar, G. Srikanth and D. P. Reddy, “A novel approach for solving distribution networks,” in Annual IEEE India Conference, Ahmedabad, India, pp. 1–5, 2009. [Google Scholar]
22. R. S. Rao and S. V. L. Narasimham, “Optimal selection of capacitors for radial distribution systems using plant growth simulation algorithm,” International Journal of Electrical, Computer, Energetic, Electronic and Communication Engineering, vol. 2, no. 9, pp. 1971–1978, 2008. [Google Scholar]
23. G. Sun, Y. Cong, Q. Wang, B. Zhong and Y. Fu, “Representative task self-selection for flexible clustered lifelong learning,” IEEE Transaction on Neural Networks and Learning Systems, vol. 33, no. 4, pp. 1467–1481, 2022. [Google Scholar]
24. X. Qin, L. Zhang, L. Yang and S. Cao, “Heuristics to sift extraneous factors in dixon resultants,” Journal of Symbolic Computation, vol. 112, pp. 105–121, 2022. [Google Scholar]
25. B. Zhu, Q. Zhong, Y. Chen, S. Liao, Z. Li et al., “A novel reconstruction method for temperature distribution measurement based on ultrasonic tomography,” IEEE Transactions on Ultrasonics, Ferroelectrics, and Frequency Control, vol. x, pp. 1–10, 2022. [Google Scholar]
26. F. Meng, W. Cheng and J. Wang, “Semi-supervised software defect prediction model based on tri-training,” KSII Transactions on Internet and Information Systems, vol. 15, no. 11, pp. 4028–4042, 2021. [Google Scholar]
27. N. Zhongqian, Z. Bo, D. Bingli, Z. Jicong, S. Fang et al., “220 GHz multi circuit integrated front end based on solid-state circuits for high speed communication system,” Chinese Journal of Electronics, vol. 31, no. 3, pp. 569–580, 2022. [Google Scholar]
28. W. Zheng, L. Yin, X. Chen, Z. Ma, S. Liu et al., “Knowledge base graph embedding module design for visual question answering model,” Pattern Recognition, vol. 120, pp. 108153, 2021. [Google Scholar]
29. W. Zheng, X. Liu, X. Ni, L. Yin and B. Yang, “Improving visual reasoning through semantic representation,” IEEE Access, vol. 9, pp. 91476–91486, 2021. [Google Scholar]
30. W. Zheng, X. Liu and L. Yin, “Sentence representation method based on multi-layer semantic network,” Applied Sciences, vol. 11, no. 3, pp. 1–17, 2021. [Google Scholar]
31. T. Sui, D. Marelli, X. Sun and M. Fu, “Multi-sensor state estimation over lossy channels using coded measurements,” Automatica, vol. 111, p. 108561, 2020. [Google Scholar]
32. J. Li, K. Xu, S. Chaudhuri, E. Yumer, H. Zhang et al., “Grass: Generative recursive autoencoders for shape structures,” ACM Transactions on Graphics (TOG), vol. 36, no. 4, pp. 1–14, 2017. [Google Scholar]
33. X. Liang, L. Luo, S. Hu and Y. Li, “Mapping the knowledge frontiers and evolution of decision making based on agent-based modeling,” Knowledge-Based Systems, vol. 250, pp. 108982, 2022. [Google Scholar]
34. G. Zhou, B. Song, P. Liang, J. Xu and T. Yue, “Voids filling of DEM with multiattention generative adversarial network model,” Remote Sensing, vol. 14, no. 5, pp. 1–22, 2022. [Google Scholar]
35. K. Wang, B. Zhang, F. Alenezi and S. Li, “Communication-efficient surrogate quantile regression for non-randomly distributed system,” Information Sciences, vol. 588, pp. 425–441. 2022. [Google Scholar]
36. Z. Wu, J. Cao, Y. Wang, Y. Wang, L. Zhang et al., “hPSD: A hybrid PU-learning-based spammer detection model for product reviews,” IEEE Transactions on Cybernetics, vol. 50, no. 4, pp. 1595–1606, 2020. [Google Scholar]
37. Z. Wu, C. Li, J. Cao and Y. Ge, “On scalability of association-rule-based recommendation: A unified distributed-computing framework,” ACM Transactions on the Web, vol. 14, no. 3, pp. 1–21, 2020. [Google Scholar]
38. Y. Zhang, C. Li, H. Ji, X. Yang, M. Yang et al., “Analysis of grinding mechanics and improved predictive force model based on material-removal and plastic-stacking mechanisms,” International Journal of Machine Tools and Manufacture, vol. 122, pp. 81–97, 2017. [Google Scholar]
39. B. Li, C. Li, Y. Zhang, Y. Wang, D. Jia et al., “Heat transfer performance of MQL grinding with different nanofluids for Ni-based alloys using vegetable oil,” Journal of Cleaner Production, vol. 154, pp. 1–11, 2017. [Google Scholar]
40. M. Yang, C. Li, Y. Zhang, D. Jia, R. Li et al., “Predictive model for minimum chip thickness and size effect in single diamond grain grinding of zirconia ceramics under different lubricating conditions,” Ceramics International, vol. 45, no. 12, pp. 14908–14920, 2019. [Google Scholar]
41. T. Gao, C. Li, M. Yang, Y. Zhang, D. Jia et al., “Mechanics analysis and predictive force models for the single-diamond grain grinding of carbon fiber reinforced polymers using CNT nano-lubricant,” Journal of Materials Processing Technology, vol. 290, pp. 116976, 2021. [Google Scholar]
42. X. Bai, C. Li, L. Dong and Q. Yin, “Experimental evaluation of the lubrication performances of different nanofluids for minimum quantity lubrication (MQL) in milling Ti-6Al-4 V," International Journal of Advanced Manufacturing Technology, vol. 101, no. 9, pp. 2621–2632, 2019. [Google Scholar]
43. X. Cui, C. H. Li, W. F. Ding, Y. Chen, C. Mao et al., “Minimum quantity lubrication machining of aeronautical materials using carbon group nanolubricant: From mechanisms to application,” Chinese Journal of Aeronautics, vol. x, pp. 1–28, 2021. [Google Scholar]
Cite This Article
 Copyright © 2023 The Author(s). Published by Tech Science Press.
This work is licensed under a Creative Commons Attribution 4.0 International License , which permits unrestricted use, distribution, and reproduction in any medium, provided the original work is properly cited.
 Downloads
 Citation Tools