
 Submit a Paper
 Propose a Special lssue
 Open Access
ARTICLE
The Fusion Model of Catalytic Combustion and Thermal Conductivity
1 Sichuan Normal University, Chengdu, 610066, China
2 School of Computer Science, Southwest Petroleum University, Chengdu, 610500, China
3 Jackson State University, Jackson, 39217, MS, USA
4 Key Laboratory on Aero-Engine Altitude Simulation Technology, Sichuan Gas Turbine Establishment, AECC, Mianyang, 621000, China
5 School of Power and Energy, Northwestern Polytechnical University, Xi’an, 710072, China
* Corresponding Author: Zhengyu Li. Email:
Computers, Materials & Continua 2023, 74(1), 1509-1521. https://doi.org/10.32604/cmc.2023.032557
Received 22 May 2022; Accepted 29 June 2022; Issue published 22 September 2022
 View Full Text
 Download PDF
Abstract
The further development of catalytic elements has been plagued by activation and binary problems. The automatic shift model that has emerged in recent years helps components achieve full range. However, the detection data still remains unstable in the shift area (7%~13%). This paper proposes a Catalytic Combustion and Thermal Conductivity (CCTC) model for the specified range, which can be explained from two aspects based on the existing methods. On the one hand, it uses iterative location search to process heterogeneous data, judges the prediction position of data points, and then gives weight evaluation. On the other hand, it corrects the abnormal points, determines the abnormal points in the horizontal direction, and gives the replacement value through the data of adjacent points. The experimental results show that the CCTC model reduces the sum of variance from 17 of the automatic shift model to 13, and the comparison of experimental variance is reduced by 23%. In the full-scale real-time data, the experimental variance of CCTC model and automatic shift model is reduced by 18%. In conclusion, CCTC is a cross section stability framework for full-scale methane measurement, in which the specified heterogeneous combination and anomaly point correction methods improve the stability.Keywords
Methane detector based on catalytic principle has been widely used in the field of safety [1]. The traditional carrier catalytic element sensor can only measure methane gas below 4% concentration [2]. Palladium oxide black as catalyst is the most effective method for catalytic detection of methane. It is coated on the surface of the measuring element to form a new measuring element. This element is also called a black-and-white element [3]. A reference element with the same physical properties is used to form another measuring bridge [4]. Through the output voltage difference of Wheatstone Bridge [5], the corresponding output voltage can be obtained, and the concentration can be calculated.
In recent years, coal mines have been equipped with a large number of portable methane detection and alarm devices, which have played a certain role in preventing coal mine gas explosion accidents [6]. However, there are two serious problems in the design of traditional circuit components: activation problem and binary problem. The activation problem and binary problem have been solved after a multitude of research by researchers [7]. The full range methane sensor meets people’s needs for a large range. However, such a large range still has certain errors and drifts in its switching interval. In order to solve this problem, a series of studies have been carried out in this experiment [8]. The black and white element together with each resistance element constitute a Wheatstone bridge, which assists the catalytic element in measuring methane concentration [9]. The initial methane concentration is zero, and the sliding rheostat is adjusted to balance the bridge. The two elements are heated to 400 degrees Celsius with platinum wire. When the air contains combustible gas, the gas reacts catalytically (flameless combustion) in the presence of catalyst on the surface of the measuring element, which makes the temperature rise [10]. The reference element will not react without catalyst, so the temperature will not change. There is a certain temperature difference between the two elements, which changes the resistance and the resistance in turn changes the output voltage. The methane content can be determined by comparing the pressure difference between the two elements [11].
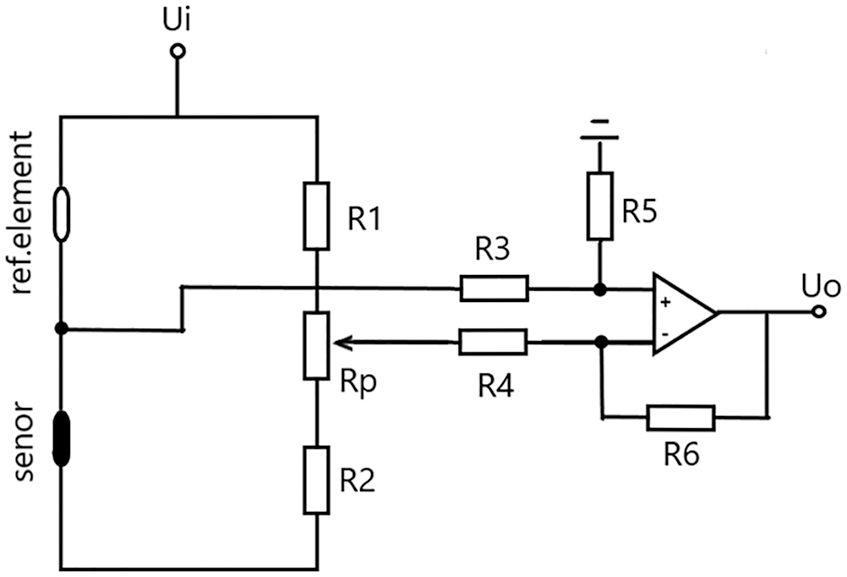
Figure 1: Black and white catalytic element detection bridge
At present, relevant research has made in-depth progress in solving the above two problems, but due to the inconsistency between the combination of the two and the drift of the constant temperature bridge at the turn back point, we propose a new method to improve the availability and accuracy of data [12]. The full range automatic shift methane alarm will be unstable in its automatic shift range. Drift data and unstable measured values will appear in the concentration range of about 10%. Therefore, we propose a method to optimize the algorithm for the concentration between 7% and 13%, so that the measurement can achieve better results [13]. The main contributions of this paper are as follows:
• This paper proposes a CCTC model, which processes the data of automatic shift measuring method and improves the stability of the intersection.
• This paper proposes a heterogeneous combination method, which comprehensively processes the two kinds of data in the intersection interval.
• This paper proposes an outlier correct method, which can be used to check abnormal data and correct outliers at intersections.
The rest of this paper is organized as follows: Section 2 introduces the related problems and research status of this paper. Section 3 presents the basic framework and experimental methods. Section 4 discusses the specific effect of the experimental algorithm and the classification and results of the evaluation methods from two aspects. Section 5 summarizes the conclusions of the experiment.
2.1 Related Work of Activate Problem
Research about activation problem have found that the traditional detection principle is to obtain the concentration signal by detecting the temperature difference between the sensing element and the compensation element and the pressure difference of the bridge [6,14]. Related research found that the temperature of the sensor will inevitably increase with the increase of concentration. When the methane concentration in the measured gas is greater than 5%, the catalytic combustion reaction is violent and the temperature rises rapidly [15]. Experiment shows that the measurement range of traditional catalytic combustion methane sensor can only reach about 5% [16]. Based on previous research findings, this paper simulates a temperature control of pulse power supply constant temperature clamp by using constant temperature detection bridge, and the model makes its measurement range and accuracy more prolonged [17]. Through a feedback circuit, the series resistance of both black and white elements is detected. The higher the methane concentration is, the more intense the catalytic combustion reaction is [18]. Therefore, the pulse power supply does not need too long time, and the given pulse times are reduced [19]. In the experiment, the concentration of methane can be corresponding to the number of pulse power supply. Related research studied that the overvoltage was constant U1 and the total power reached the upper limit was set to P1. After the pulse power supply reaches the upper limit, the cumulative power supply heating times N1 are limited, and the temperature is limited by the power limit, so that it is always in the back and forth movement of heating and power failure [20,21].
The heating times correspond to the methane concentration. Chen et al. (2008) studied that the shorter the heating time is, the shorter the power pulse time required for the reaction to reach the limit temperature is, and the higher the methane concentration is.
Research shows that pulse feedback constant temperature clamping technology can solve the activation problem that has plagued people for a long time [22]. Fig. 2 shows a model of the experiment. If the concentration is about 10%, the greater the concentration of methane is, the fewer pulses we will give.
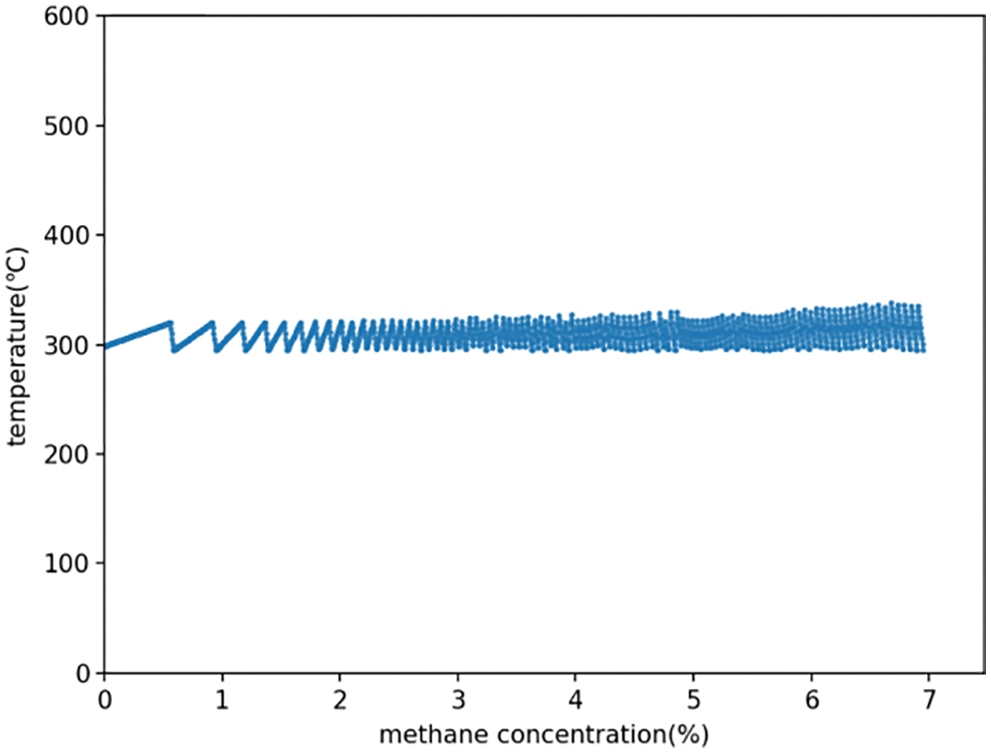
Figure 2: Low concentration constant temperature pulse clamping
2.2 Related Work of Binary Problem
Fig. 3 shows this phenomenon. In the range of 0%~4% CH4, the output signal of the bridge is basically linear with methane concentration. Related research found that when the methane concentration was about 10%, the oxygen in the air was squeezed out. Without oxygen, the combustion of methane could not be carried out completely, and there was an inflection point in the curve [23].
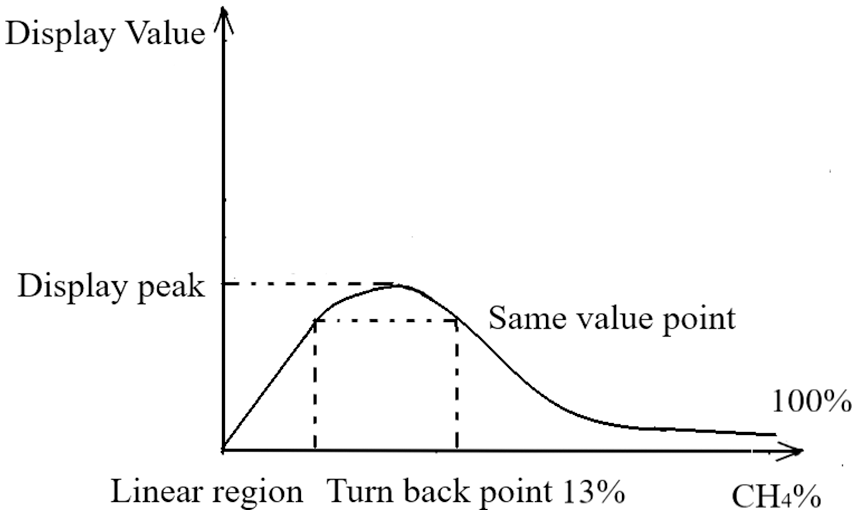
Figure 3: Characteristic curve of binary problem
Related works have used the combination of catalytic element and thermal conductive element to create methane sensors with combined high and low concentration [24]. However, experiments have found that the measurement intersection of heat conduction element and catalytic combustion methane concentration measurement element does not coincide [25]. The key to solving the problem of “double-value” is to determine the value interval of the instrument so that different measurement results will be obtained in different intervals [26]. According to the references and experimental data of research, this experiment can continue to use the bridge for measurement and black-and-white components [27]. Adjusting parameters can calculate the methane concentration when it is greater than 10%. Still using black and white components, methane is detected by thermal conductivity, which not only reduces the cost and complexity of using two components, but also makes the detection range reach 10%~100%. To solve the activation problem, the catalytic combustion measuring range is set to a high-precision measuring range from 0% to 10% [28,29]. While to solve the binary problem, the white element thermal conductivity principle is adopted, and its measuring range is set to a low-precision measuring range from 10% to 100%. The effective combination of these two ranges is a new working direction proposed in this experiment [30].
2.3 Instability of Automatic Shift
The automatic shift full range methane alarm still has its disadvantages. In the data range of about 10% near the shift data point, there will be a certain data drift at the high range end of constant temperature clamping in the low concentration. While in the high concentration, there will be a certain drift at the low range end of thermal conductivity model [31,32].
It can be observed through experiments that in Fig. 4, the constant temperature clamping model will have certain errors and inaccuracies when it reaches the automatic shift point [33]. When the concentration exceeds 13%, the oxygen in the catalytic reaction will be reduced, and this method will completely lose its function.
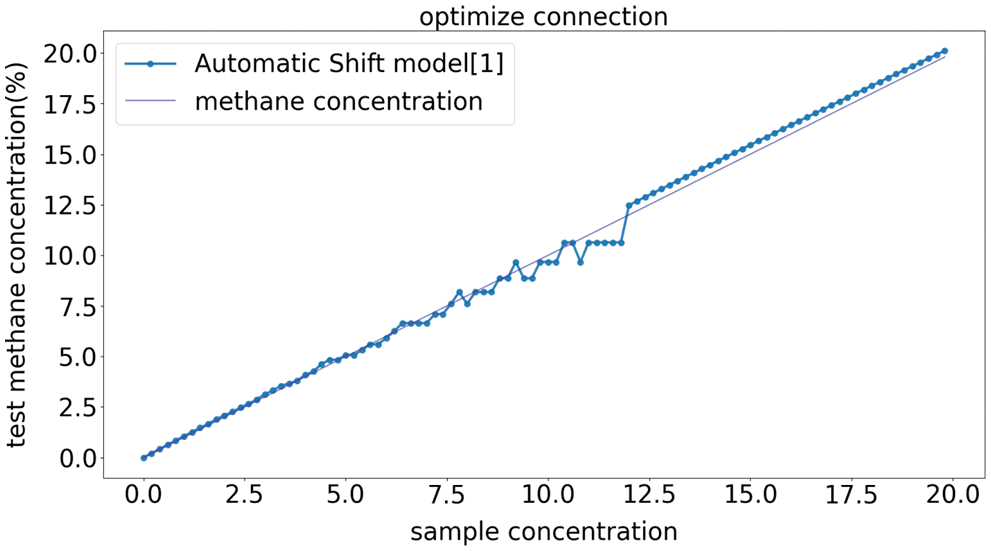
Figure 4: Instability in shift range
As shown in Fig. 5 The framework of this experimental design covers two parts. One is the combination of two types of data, and the other is the pull back of noise points. The basic framework consists of five main steps. The following is the basic design of this experiment.
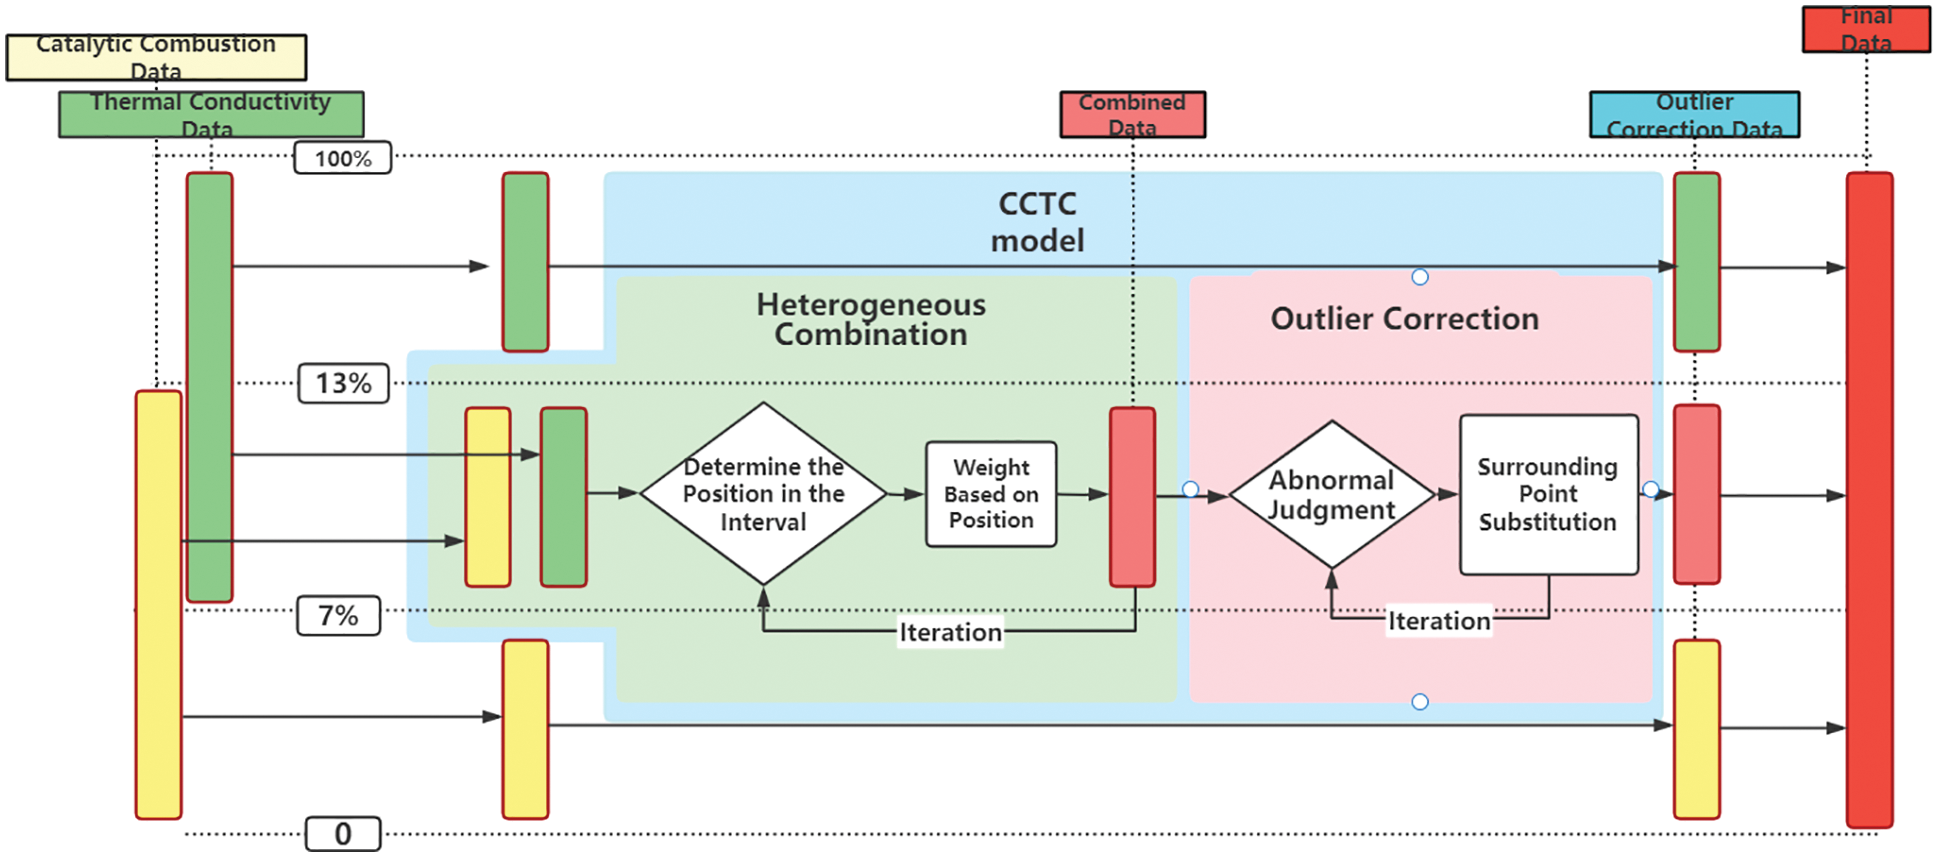
Figure 5: CCTC model operation framework
Because the precision measurement from low concentration to high concentration has certain dislocation, it is necessary to preheat the black element from high concentration to low concentration. Such an intersection interval with high and low concentrations has an unstable switching process. We extend the range of low concentration measurement, put the starting point of the range of high concentration measurement at a lower position, and overlap the measurement ranges of the two ranges at the intersection interval. A concentration is measured in two ways, and then the two data are combined to calculate. The preliminary plan of the experiment is to reduce the noise of methane concentration curve in the interval of 7%~13%.
3.2.1 Heterogeneous Combination Method
Traditional catalytic elements include black elements and white elements. The black element is a detection element, whose surface is coated with catalysts. In the presence of catalysts, methane can burn without open flame. When the temperature rises, the resistance value changes with the change of methane concentration. The white element is a compensation element. In order to reduce the impact of errors and temperature, there is no catalyst on the surface of it, and the resistance value only changes with the change of temperature, not with that of methane concentration.
As shown in Fig. 1, when methane gas is introduced, the surface of the black element burns. When the resistance value rises, the potential at the junction between the black element and the white element rises, and the output voltage rises, which shows a certain linear relation.
and because Rb = Rw = R1 = R2, the original formula is:
Due to
Traditional catalytic elements calculate methane concentration through this output voltage value, whose range is about 0%~ 4%.
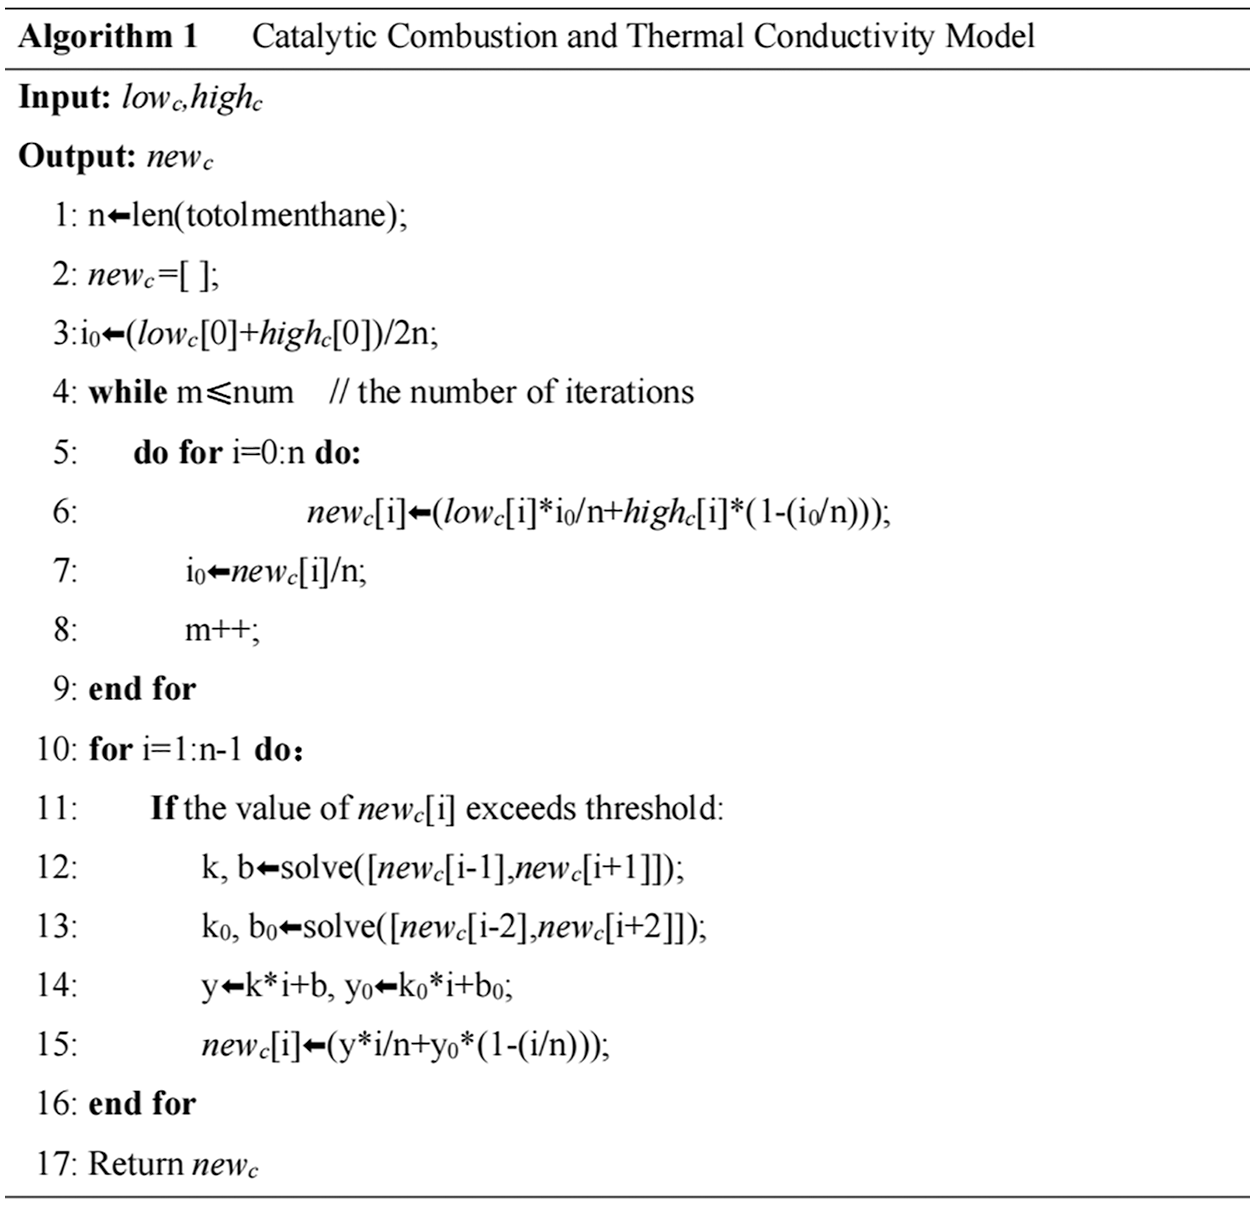
The methane concentration in the intersection region is stored in the array total methane. Suppose the length of the extracted array is n = len (totalmenthane), and the weight ratio is combined according to the data measured by the catalytic combustion model of i/len (totalmenthane) and the data obtained by the thermal conductivity characteristic of (1 − i/len (totalmenthane)):
where new_c is the combined concentration, low_c is the concentration of this point obtained by catalytic combustion, high_c is the concentration of this point obtained by thermal conductivity, and i is the serial number of this point data in the array.
The smaller the serial number is, the closer it is to the data of catalytic combustion. The bigger the serial number is, the greater the weight of the data obtained by thermal conductivity is.
When the concentration of both is closer to the low concentration, the data measured at the low concentration is weighted and averaged at the high concentration. When the concentration is close to the high concentration, the measured data of high concentration is weighted more heavily, and the low concentration and high concentration are weighted and averaged to a certain extent. By using this idea, the curve obtained in this experiment is more effective.
3.2.2 Outlier Correction Method
The weight parameters are determined by the size of the measured data. In the concentration range of 7%~13%, the weights closer to the low concentration are more inclined to the low concentration, and the weights closer to the high concentration are closer to the measured data of the high concentration. In the experiment, such a formula is used for weighted average. When there is a big difference between the data at one point and the data around it, the absolute value of this difference is calculated separately. If the difference exceeds the set range, then the point is a noise, and the adjacent data value method is adopted to deal with the point. The data measured in two different ways are taken before and after, and the obtained before and after values are averaged to remove the noise.
In order to eliminate noise, this experiment designs and calculates the distance between the middle point of the three points and the straight line connecting the two ends based on DP algorithm. Firstly, set the threshold judgment, take a certain interval, and calculate the distance and height of each group of data.
Then the area is obtained by three-point coordinate operation. Where a, b, c, d, e and f represent A (a, b), B (c, d) and C (e, f) respectively, A, B, C is the three points in the window. Then calculate the height. If the height exceeds the set threshold, replace it with the value of the straight line at the two endpoints at the abscissa point.
In order to eliminate some unstable points, through multiple iterations, the smoother the curve is, and closer to the real value is.
The combination of the two methods is equivalent to a certain weighted average at the same point, From the direction of the image, it is a vertical upward operation, while the removal of noise is a comprehensive smoothing process for a single curve in the horizontal direction. The CCTC model in the experiment is the sequential operation of the above two algorithms.
Algorithm 1 explains the basic process of processing intersection interval data. 1~9 lines of code is a compromise between the two kinds of data. Lines 10~16 eliminate the noise on the measured data. These two processing methods need to be in a certain order. The optimization function in the algorithm has adaptive parameters. lowc is the concentration obtained by the constant temperature pulse mechanism. highc is the concentration obtained from the principle of thermal conductivity. newc is the final fusion data.
4.1 Real-time Concentration Change
According to the data processing method, constant temperature pulse treatment is carried out for low concentration methane, while thermal conductivity treatment is carried out for high concentration methane detection. The methane, whose concentration in the middle range is 7%~13%, at this point is measured and calculated by two methods at the same time, and then the simulated data is obtained through data processing, which is closer to the real methane concentration. In Fig. 6, we can see that in the range of low concentration methane, the experimental measurement data is almost identical to the true concentration.
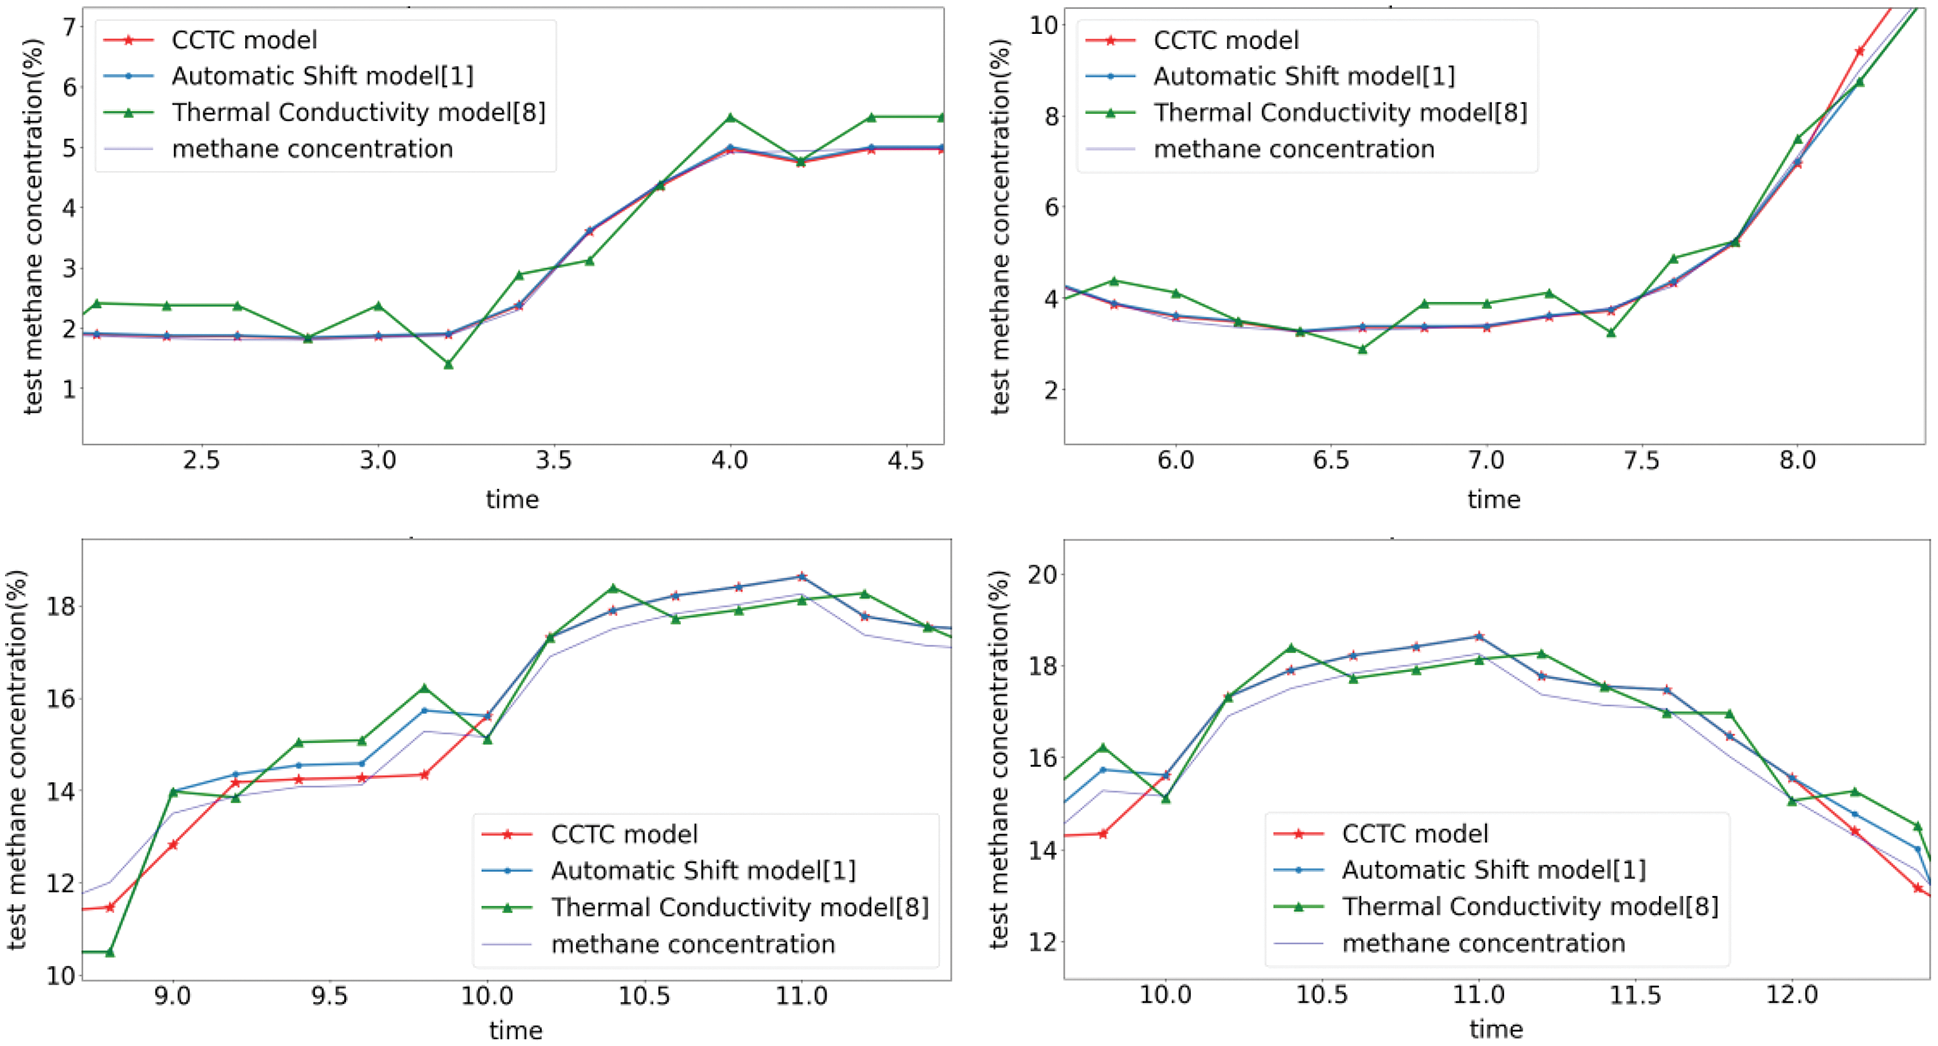
Figure 6: Example diagram of real-time concentration measurement
The green curve in the figure shows the traditional simple switching combination model. When the concentration reaches 7%~13% at the intersection, the curve will have a great jump and uncertainty, and the components cannot coincide well at the intersection of measurement. The black-and-white element working circuit of catalytic combustion works normally, reaching a certain concentration and the inflection point of binary problem as well. At this time, it switches to the black-and-white element working circuit by using thermal conductivity characteristics in the same way as multi-meter gear switching. The curve in this way obviously does not fit well with the blue translucent real sample data. Although the measured data can reflect the changing trend of sample concentration on the whole, there are still some inaccuracies.
This paper uses optimized cohesion, so that the methane concentration in this intersection area is comprehensively treated and the red optimization curve is obtained. In Fig. 7, it can be seen that the concentration measurement in the intersection section produces a certain drift.
In the automatic shift model, in Fig. 7, the automatic shift concentration measurement will produce a certain drift, and the CCTC model designed in this experiment will perfectly reduce the drift.
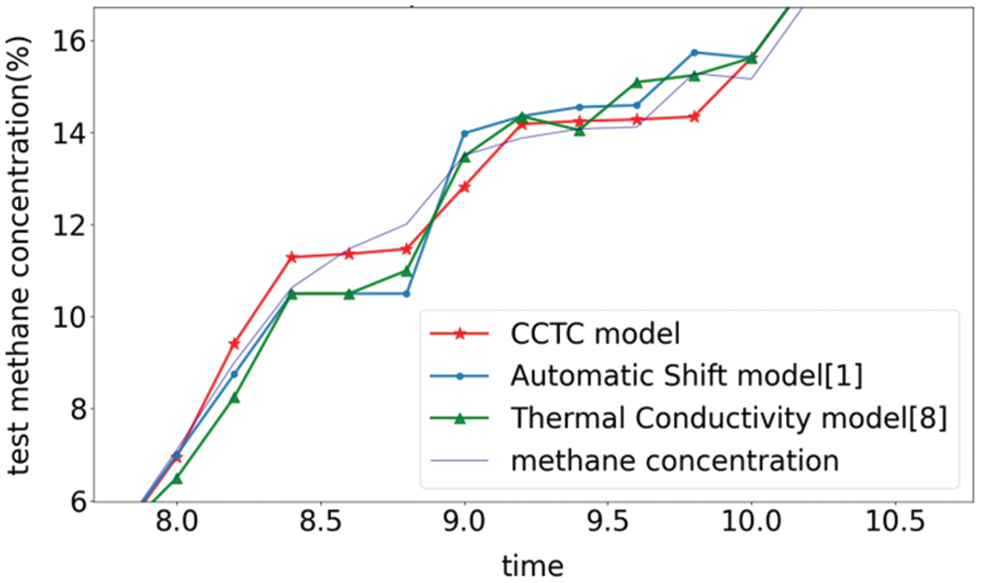
Figure 7: Measurement of intersection section
4.2 Linearly Increasing Concentration
From 0% to 100% sample gas data, the denser the data measured in the intersection interval by two methods is, the more clearly the fluctuation of the intersection point itself can be seen. The traditional switching model cannot get a stable linear curve at all, and the data measured by catalytic combustion and thermal conductivity cannot coincide with the effective true value in this interval. In the experiment, low concentration data was obtained by catalytic combustion method, and relatively high concentration data was obtained by thermal conductivity characteristics. Combining both, the two data was weighted and averaged to a certain extent. In Fig. 8, under the environment of continuously increasing methane concentration, the automatic shift concentration measurement method is superior to the initial low concentration. However, near the reentry point of nearly 13%, there is a very large error and drift in the concentration measurement.
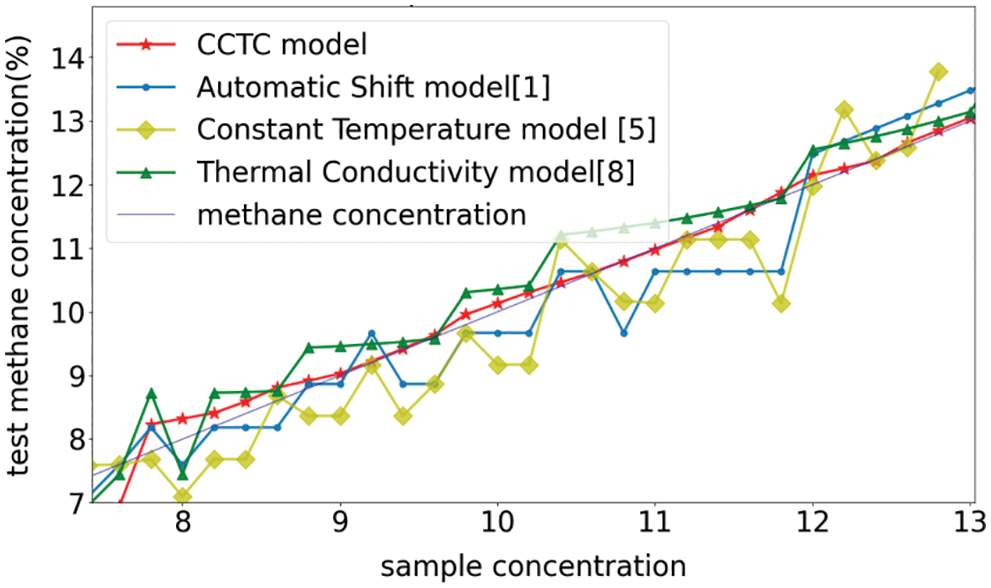
Figure 8: Single point corresponding detection of sample concentration
By monitoring the adjacent data and processing the current noise data, we can see that in Fig. 8, the red optimization curve obtained by the experiment eliminates the noise to a certain extent without large mutation. Compared with the shift model, the CCTC model is smoother and closer to the real methane concentration measurement.
4.3 Comparison of Evaluation Indicators
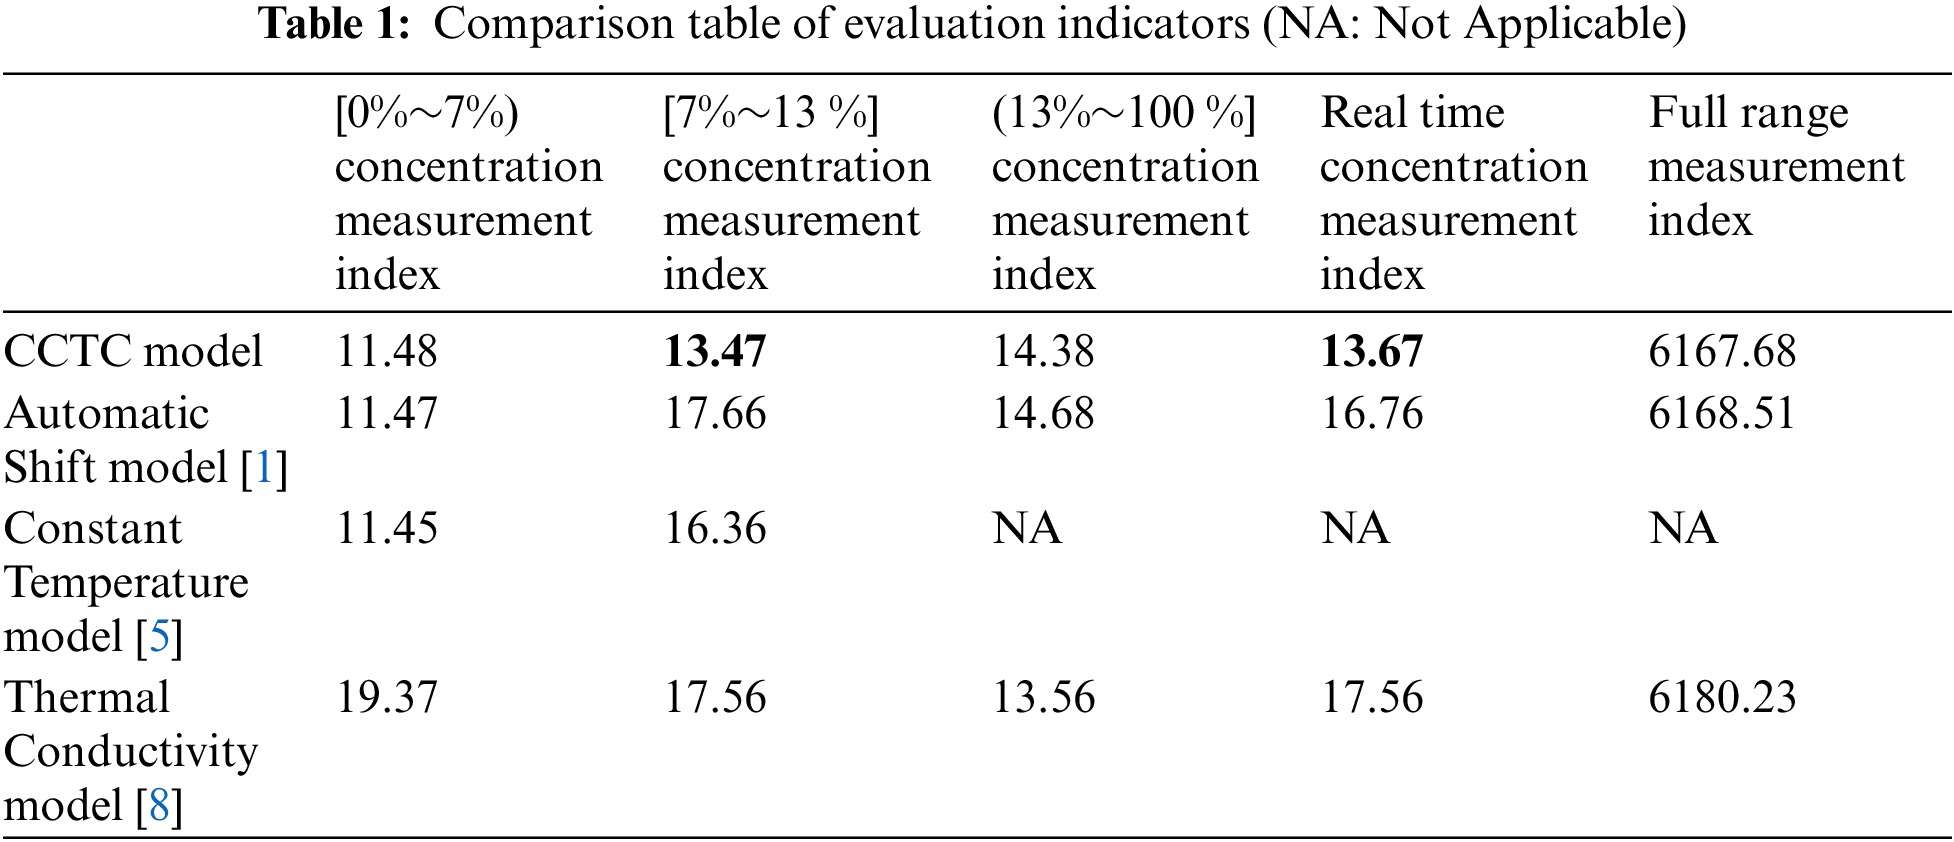
The difference between sample data and measured value can reflect the advantages and disadvantages of high and low range connection methods. For the intersection interval (7%~13% concentration), the error between the measured values of the two methods and the experimental data is analyzed, and the square sum of the difference between the measured points and the sample points is used to evaluate the fit of the curve.
This paper defines variance V as the evaluation index, where yi is the measured value at i, and si is the sample value at i. For the intersection interval in the real-time concentration change, sum the square of the difference within the specified concentration range and calculate the evaluation index; for the single point sample data experiment, calculate the evaluation index of the sample data in the continuous interval of 7%~13%. The final result is shown in Table 1.
Based on previous achievements, the experiment is designed by using the traditional catalytic combustion methane sensor. Firstly, the logic flow of the constant temperature detection bridge is simulated. Then, the constant temperature, which is completely controlled under the self-excited condition is realized by using the constant temperature pulse temperature clamping. In addition, the methane concentration is accurately calculated based on the duration and times of the pulse signal, which increases the safety performance and accuracy of the components. Finally, the two range data detection methods are integrated, and the intersection part in the switching process of the two methods is processed. The experimental results demonstrate that the optimized data is closer to the real real-time data value, reduces the noise of the traditional switching model, makes the methane measurement data in the intersection area more accurate, and better guarantees the safety of measurement and coal mining environment. In this paper, the optimization curve can be noise reduction for many times, and the measured unstable data points can be smoothed through many iterations. In the future research, we will propose better optimization processing methods by combining more effective optimization algorithms, so as to achieve larger measurement range and higher accuracy of the measurement interval.
Funding Statement: This work was supported by Major Science and Technology Project of Sichuan Province [No. 2022YFG0315, 2022YFG0174]; Sichuan Gas Turbine Research Institute stability support project of China Aero Engine Group Co., Ltd [GJCZ-2019-59]; Key project of Chengdu [No. 2019-YF09-00044-CG]. (Corresponding author: Zhengyu Li).
Conflicts of Interest: The authors declare that they have no conflicts of interest to report regarding the present study.
References
1. B. Q. Jia, “Development of shock-resistant full-range methane sensor,” Energy Technology and Management, vol. 1, no. 4, pp. 1–3, 2005. [Google Scholar]
2. S. Leng, J. Xu and C. F. Chen, “Attention should be paid to maintaining the explosion-proof performance of catalytic combustion methane detection alarm during maintenance,” Stoichiometry and Analysis Technology, vol. 8, no. 4, pp. 1, 2010. [Google Scholar]
3. X. L. Wang, “Principle and technical performance analysis of catalytic element supported by catalytic combustion methane analyzer,” Metrology and Test Technology, vol. 2, no. 39, pp. 2, 2012. [Google Scholar]
4. R. L. Wang, “Modern research method and direction of mine gas sensor,” Coal Mine Automation, vol. 4, no. 4, pp. 3, 1998. [Google Scholar]
5. L. Jiang and F. H. Liu, “Study on the bridge of constant temperature detection of catalytic combustion methane sensor,” Industrial and Mining Automation, vol. 14, no. 6, pp. 3, 2006. [Google Scholar]
6. Y. Z. Chen, “Research and design of a new full-range methane detector,” M.S. dissertation, Wuhan University of Technology, 4, 2008. [Google Scholar]
7. L. Q. Dang, “Design of a new portable gas detection and alarm device,” Journal of Wuyi University, vol. 2, no. 28, pp. 5, 2009. [Google Scholar]
8. B. Lin, D. H. Mu and S. G. Xiao, “Design of a new full-range methane detector,” Mining Machinery, vol. 12, no. 33, pp. 3, 2005. [Google Scholar]
9. J. Z. Liu, Y. Z. Wang and Y. M. Feng, “Steady-state working equation and linear compensation simulation of gas sensor,” Transducer Technology, vol. 1, no. 18, pp. 4, 1999. [Google Scholar]
10. Q. Le, “Full-range methane measuring instrument,” Journal of Chongqing Jianzhu University, vol. 3, no. 18, pp. 6, 1996. [Google Scholar]
11. Q. Huang and X. Q. Zhao, “Development and characteristics of full-range intelligent methane detector,” Coal Engineer, vol. 3, no. 3, pp. 4, 1997. [Google Scholar]
12. B. Lin, “Determination of methane concentration by supported catalytic element at constant temperature,” Journal of University of Electronic Science and Technology of China, vol. 4, no. 35, pp. 3, 2006. [Google Scholar]
13. D. Wang, “Study on thermal effect of catalytic elements,” Coal Mine Safety, vol. 8, no. 49, pp. 3, 2018. [Google Scholar]
14. H. Malik, A. S. Malik and C. K. Roy, “A methodology to optimize query in wireless sensor networks using historical data,” Journal of Ambient Intelligence and Humanized Computing, vol. 8, no. 2, pp. 227–238, 2011. [Google Scholar]
15. Z. X. Li, “Design of full-range methane detector based on dual sensitive model,” M. S. dissertation, Harbin University of Science and Technology, China, 2015. [Google Scholar]
16. X. Wang, “Study on accelerated stabilization method of catalytic combustion gas sensor,” Sensors and Microsystems, vol. 4, no. 40, pp. 4, 2021. [Google Scholar]
17. Y. L. Zhao, “Coal mine gas concentration monitoring system based on self-tuning sensor,” Coal Technology, vol. 5, no. 37, pp. 2, 2018. [Google Scholar]
18. B. W. Xie, “Analysis of performance characteristics and influencing factors of catalytic combustion gas detection instrument,” Coal Mine Safety, vol. 3, no. 33, pp. 2, 2002. [Google Scholar]
19. D. Zhang, “Design of a new full-range methane sensor,” Coal Safety, vol. 23, no. 10, pp. 3, 2012. [Google Scholar]
20. D. Zheng, Z. Ran, Z. Liu, L. Li and L. Tian, “An efficient bar code image recognition algorithm for sorting system,” Computers, Materials & Continua, vol. 64, no. 3, pp. 1885–1895, 2020. [Google Scholar]
21. S. L. Sun, “Manufacturing method of carrier catalytic methane detection element based on MEMS technology,” Industrial and Mining Automation, vol. 4, no. 42, pp. 4, 2016. [Google Scholar]
22. K. Shankar and S. Venkatraman, “A secure encrypted classified electronic healthcare data for public cloud environment,” Intelligent Automation & Soft Computing, vol. 32, no. 2, pp. 765–779, 2022. [Google Scholar]
23. Z. C. Liu, “Current conversion detection of mine gas with carrier catalytic element,” Journal of Electronic Measurement and Instrumentation, vol. 3, no. 19, pp. 3, 2005. [Google Scholar]
24. W. Sun, X. Zhang, S. Peeta, X. He and Y. Li, “A real-time fatigue driving recognition method incorporating contextual features and two fusion levels,” IEEE Transactions on Intelligent Transportation Systems, vol. 12, no. 18, pp. 3408–3420, 2017. [Google Scholar]
25. H. Fu, N. N. Si and J. J. Lu, “Research on double-loop gas concentration meter based on constant temperature harmonic detection,” Journal of Sensing Technology, vol. 10, no. 29, pp. 7, 2016. [Google Scholar]
26. X. J. Chen, “Design and implementation of gas detection based on catalytic combustion,” M.S. dissertation, Beijing Jiaotong University, China, 2007. [Google Scholar]
27. Y. Peng and X. Y. Li, “Verification mechanism to obtain an elaborate answer span in machine reading comprehension,” Neurocomputing, vol. 1, no. 4, pp. 1–3, 2021. [Google Scholar]
28. P. Xu and J. Zhang, “An expected patch log likelihood denoising method based on internal and external image similarity,” Journal of Internet of Things, vol. 2, no. 1, pp. 13–21, 2020. [Google Scholar]
29. L. G. Wang, “Design and simulation of methane concentration alarm based on PROTUES,” Value Engineering, vol. 47, no. 24, pp. 4, 2019. [Google Scholar]
30. W. Sun, G. C. Zhang, X. R. Zhang, X. Zhang and N. N. Ge, “Fine-grained vehicle type classification using lightweight convolutional neural network with feature optimization and joint learning strategy,” Multimedia Tools and Applications, vol. 80, no. 20, pp. 30803–30816, 2021. [Google Scholar]
31. D. Jwo and K. Lee, “Continuous tracking of gps signals with data wipe-off method,” Computers, Materials & Continua, vol. 71, no. 2, pp. 3803–3820, 2022. [Google Scholar]
32. X. Chen, Z. Zhang, A. Qiu, Z. Xia and N. Xiong, “A novel coverless steganography method based on image selection and StarGAN,” IEEE Transactions on Network Science and Engineering, vol. 9, no. 1, pp. 219–230, 2020. [Google Scholar]
33. S. Cai, B. Gallina and D. Nyström, “Tool-supported design of data aggregation processes in cloud monitoring systems,” Journal of Ambient Intelligence and Humanized Computing, vol. 47, no. 10, pp. 2519–2535, 2019. [Google Scholar]
Cite This Article
 Copyright © 2023 The Author(s). Published by Tech Science Press.
This work is licensed under a Creative Commons Attribution 4.0 International License , which permits unrestricted use, distribution, and reproduction in any medium, provided the original work is properly cited.
 Downloads
 Citation Tools