
 Submit a Paper
 Propose a Special lssue
 Open Access
ARTICLE
Modeling and Analysis of UAV-Assisted Mobile Network with Imperfect Beam Alignment
1 University of Rennes 1/ADOPNET team at IRISA laboratory, Rennes, 35000, France
2 Faculté de Technologie, Laboratoire d’Informatique Médicale (LIMED), Université de Bejaia, Bejaia, 06000, Algérie
3 Department of Information Technology, College of Computer and Information Sciences, Princess Nourah bint Abdulrahman University, P.O.Box 84428, Riyadh, 11671, Saudi Arabia
4 Department of Information Systems, College of Computer and Information Sciences, Princess Nourah bint Abdulrahman University, P.O.Box 84428, Riyadh, 11671, Saudi Arabia
5 Electrical engineering department, College of Engineering, Taif University P. O. Box 11099, Taif, 21944, Saudi Arabia
* Corresponding Author: Reem Alkanhel. Email:
Computers, Materials & Continua 2023, 74(1), 453-467. https://doi.org/10.32604/cmc.2023.031450
Received 18 April 2022; Accepted 07 June 2022; Issue published 22 September 2022
 View Full Text
 Download PDF
Abstract
With the rapid development of emerging 5G and beyond (B5G), Unmanned Aerial Vehicles (UAVs) are increasingly important to improve the performance of dense cellular networks. As a conventional metric, coverage probability has been widely studied in communication systems due to the increasing density of users and complexity of the heterogeneous environment. In recent years, stochastic geometry has attracted more attention as a mathematical tool for modeling mobile network systems. In this paper, an analytical approach to the coverage probability analysis of UAV-assisted cellular networks with imperfect beam alignment has been proposed. An assumption was considered that all users are distributed according to Poisson Cluster Process (PCP) around base stations, in particular, Thomas Cluster Process (TCP). Using this model, the impact of beam alignment errors on the coverage probability was investigated. Initially, the Probability Density Function (PDF) of directional antenna gain between the user and its serving base station was obtained. Then, association probability with each tier was achieved. A tractable expression was derived for coverage probability in both Line-of-Sight (LoS) and Non-Line-of-Sight (NLoS) condition links. Numerical results demonstrated that at low UAVs altitude, beam alignment errors significantly degrade coverage performance. Moreover, for a small cluster size, alignment errors do not necessarily affect the coverage performance.Keywords
Unmanned Aerial Vehicle (UAV) based-cellular network has recently attracted more attention due to its capacity to overcome some terrestrial network communication constraints [1,2]. For example, mmWave UAVs can easily establish line-of-sight (LoS) connections to ground users [3]. Additionally, UAV can assist terrestrial networks to prevent temporary congestion in ultra-dense places such as stadiums. In certain applications, UAVs can be used as a relay to improve energy efficiency in cellular networks. However, to maintain the high performance of UAVs based communication, the optimal UAVs deployment parameters are of fundamental importance [4]. Heterogeneity between UAV and ground base station requires an understanding of channel scenarios introduced such as the ground-to-ground (G2G) and air-to-ground (A2G) channels. Therefore, the modeling of these channels has received much attention in the literature [5,6]. To overcome spectral saturation, Millimeter Waves (mmWave) are largely considered one of the keys technology for the 5G network. Nevertheless, mmWave spectrum is susceptible to blockages and suffers from high propagation attenuation. To address the blocking effect, Beamforming can be applied to improve the signal quality and compensate for the additional path loss [7]. Currently, Stochastic Geometry is employed to study and analyze cellular network performance, in particular the deployment of base stations (BSs) and users’ equipments (UEs) [8,9]. Indeed, BSs and UEs locations are modeled as Poisson Cluster Process (PCP) in several scenarios like sporting events. This distribution allows the coupling of UE and UAV locations, but also provides accurate models according to the 3rd Generation Partnership Project (3GPP).
Several studies have recently addressed the performance analysis of UAV-assisted cellular networks, where different metrics were considered. For instance, authors in [10] analyzed downlink coverage and rate of a vertical heterogeneous network in both LOS and NLOS propagation. In this work, the authors assumed that the UAVs heights were fixed and their location distributed forms a Poisson Point Process (PPP). In [11], the authors investigated performance analysis for two scenarios: static UAVs and mobile UAVs. The proposed analytical framework adopts an appropriate (A2G) channel model that incorporated LoS and non-line-of-sight (NLoS) transmissions. However, beamforming has not been incorporated. In [12], stochastic geometry base PCP was proposed to model the UEs locations. Additionally, the impact of path loss exponent and UAV density on coverage probability was achieved. Moreover, PCPs were also introduced to the model device-to-device network in [13]. In this work, a special case of PCP namely the Matern cluster process (MCP) was used. The Cumulative Density Function (CDF) of distance distribution between UE and the adjacent/serving base station was derived. Authors in [14] proposed a unified spatial framework for UAV aided mmWave. More specifically, MCP and (TCP) were introduced to model and represent the BSs locations. A 3D blockage process and a 3D up tilted antenna model were introduced to characterize the impact of UAVs altitudes and positions. The signal-to-interference-plus-noise-ratio (SINR) coverage and outage probabilities were studied as the network performance metric in [15] and [16] respectively. First, in [15], the exact expression of coverage probability, which includes the effect of base stations (BSs) height, antenna pattern, and UAVs altitudes, was derived. Then, in [16], the outage probability and ergodic rate of Multi Input Multi Output (MIMO) were evaluated, when the transmit power of interference sources was proportional. Hou et al. [17] proposed a tractable approach to analyze coverage probability. The authors considered a scenario where the UAVs are placed between 3D obstacles. A more general study investigated the coverage optimization using stochastic geometry where the UEs were modeled as TCP [18]. This study aims to obtain an optimal UAVs height with maximum coverage probability. On the other extreme, in urban environments, it is necessary to keep UAVs at low altitudes to reduce path loss. However, at this height, alignment errors are significant due to environmental obstacles such as large buildings and shadow zones.
As discussed above, stochastic geometry is a promising power tool to provide autonomous and effective analysis for UAV-assisted wireless network performance. To address the coverage analysis challenges, considering the limitations of the existing models such as different heights of the drones, and beams alignment errors, The coverage probability while taking into account the two different challenges should be studied. First, although coverage analysis has been well studied in the literature, few articles have dealt with the problem when drones are positioned at different altitudes. In reality, drones cannot be positioned at identical heights depending on the propagation environment and building density. On the other hand, 5G wireless networks are very dense, requiring the involvement of robust technology to improve their coverage and capacity. Therefore, beamforming is applied in several UAV scenarios to enhance coverage, but there are still errors in the beam alignment, which degrades the association of users with their Base Station and as a result, poor coverage is experienced.
Motivated by these considerations, in this paper, a detailed performance analysis of a UAV-assisted cellular network over the Nakagami-m channel with Imperfect beam alignment was presented. The main contribution of this document can be summarized as follows:
• An analytical framework to analyze the coverage probability of UAV-assisted mobile networks under clustered users was suggested. Compared to [13], all UAV were located at different heights. Moreover, the system performance should be analyzed exactly when the UAVs were located at certain heights with imperfect beam alignment. Based on [19], an exact expression of coverage probability for typical UEs located at origin by adopting imperfect beam alignment was driven. The path loss model is different between aerial and ground tiers in both LoS and NLoS links.
• The proposed analysis provided several useful conclusions. First, it revealed that at low UAVs altitudes, beam alignment errors significantly degrade coverage performance. Second, our investigation showed that there was an optimal value for the imperfect beam alignment, which should not be exceeded to improve coverage probability
The remainder of this paper is organized as follows. In Section 2, the system and channel model was introduced. Section 3, association probability was derived. In Section 4, the exact expression of Coverage probability was obtained. In Section 5, some numerical results were presented to confirm the accuracy of the model. Finally, the conclusion and perspectives were presented in Section 6.
The system model illustrated in Fig. 1 was considered. The UAVs are deployed at different heights

Figure 1: System model: UAV assisted cellular network in both LoS and NLoS link

To study the proposed model accurately, the LoS and NLoS links were examined separately, as well as their probabilities of occurrence. The LoS and alos NLoS probabilities depended on the environment propagation. Note that, for UAV-UE communication, the link probability was related to the UAV height. In urban scenarios, the effect of blockages was considerable. However, the probabilities functions of LoS/NLoS can be further given by [13].
For UAV-UE
where
For GBS-UE
where γ is the blockage parameter.
In contrast to path loss model proposed in [11], our model incorporated different path loss for each tier (i.e., UAV and GBS). For the A2G link, the path loss model was formulated as follows
where
where
Small-scale fading is a property of radio propagation caused by the existence of reflectors and scatterers. In fact, several versions of the transmitted signal reach the user, where each version was distorted in terms of amplitude, phase, and angle of arrival. In our model, Nakagami-m fading was used to model the fading channels with the shape parameter given by
where
To improve communication between the base station and user, directional beamforming [22] was used to focus a signal in a specific UE direction. However, UE and its serving base station adjusted the orientation of their antennas after estimating the angles of arrival (AoAs) and angles of departure (AoDs). The objective of this approach is to maximize directivity gain. Nevertheless, due to errors in the installation of antennas in practice, estimation errors in directivity angles could be made as shown in Fig. 2. For the associated BS-UE pair, the imperfect beam alignment was modeled as a truncated Gaussian distributed variable [23] where the expression was given by
where
where
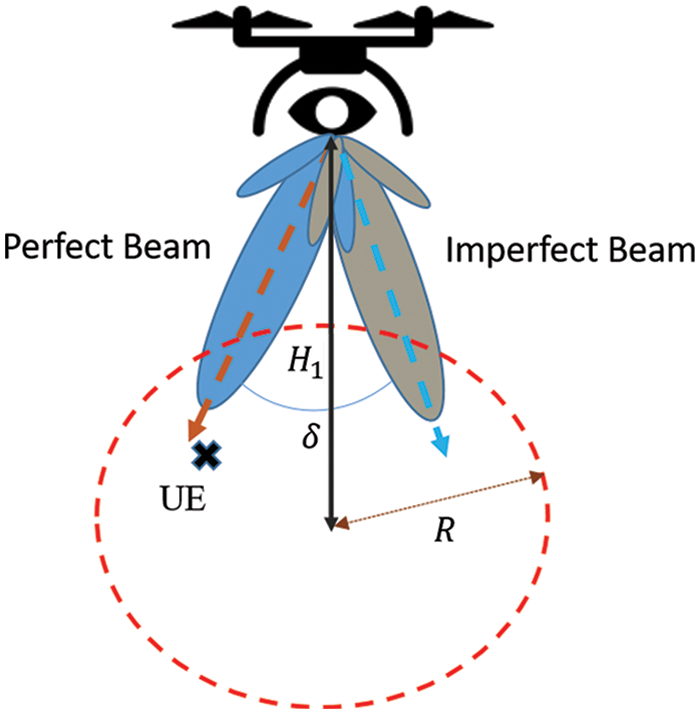
Figure 2: Imperfect beam alignment

Figure 3: Distance separating the user from UAV and GBS
User association is an important step in a communication network and significantly affects network performance. It generally depends on the radio link, the distance between the user and BSs, and also the power transmission. Consequently, the user probability association is based on different schemes such as minimum load or maximum distance BS, and maximum received signal power. As mentioned above, in this work, we focus on the case where UE is connected with the BSs (UAV or GBS) that provides maximum received signal power and can be given mathematically as
where
Proposition 1: The PDF and CDF of the distance separated UE located at distance
where
In the following Lemma, the probability that the UE was associated with a LOS/NLOS UAV or GBS. This can be evaluated by assuming that the number of drones per cluster was fixed and using the ordered statistics of the distance distribution of the cluster BSs points to the typical user located at distance.
This section presented the performance analysis of the proposed system with imperfect beam alignment. However, the metric that has been selected to be estimated was the coverage probability.
The analysis of this special case will provide important information about the network performance in more general contexts. Particularly, the coverage probability can be defined as the probability that signal-to-interference-plus-noise-ratio experienced by a typical user is greater than the desired threshold
Lemma: The probability that a typical UE is associated with UAV/GBS in both LOS and NLOS conditions can be expressed by (15) and (16).
Proof: See Appendix A
where
Theorem: For the special case of TCP, the downlink coverage probability for typical UE in both LOS/NLOS links can be expressed by
Proof: See Appendix B
4.2 Total Coverage Probability
In this subsection, after deriving the formulas for the association probabilities and conditional coverage probabilities, now the total coverage probability will be calculated. The overall network coverage in a UAV assisted mobile network was the sum of coverage offered by both tiers and can be expressed as
where
where
The analytical expression for the association probability and coverage probability has been derived in Sections 3 and 4, respectively. In this section, the coverage probability expression obtained was validated against Monte Carlo simulations using MATLAB. Results were based on the impact of UAV height and the imperfect beam alignment. The transmit power of SBS and UAV were 30 and 24 dBm, respectively. For our simulation, all necessary parametric values were given in Tab. 2.

Fig. 4 illustrated the impact of beam alignment errors on the coverage probability with different values of UAV height. It is observed that the beam alignment error increases the coverage probability deteriorates. Indeed, this degradation was considerable when the UAV height increased. The reason was that when the UAV height increased the misalignment occurred with a high probability. Moreover, the distance between the drone and the UE became significant, which enhanced attenuation. As can be seen from Fig. 5, the coverage probability was significantly decreased when the cluster size was increased. This was mainly due to the increase in path loss (enhanced distance between UAVs and UE). It was clearly shown that for a small cluster size, alignment errors did not necessarily affect the coverage performance and the same results as when UE and BSs were perfectly aligned. This can be explained as when the cluster was reduced, the UE and its serving base station adjusted the orientation of their antennas easily over a large distance. In addition, despite the estimation errors of (AoAs) and (AoDs), when the radius of the cluster was small, the received power by the user was high, because they were closer to the base station and the losses become minimal. To validate the coverage analysis, the estimated results were plotted against drone density. It was obvious from the figure that the analytical results were reasonably consistent with the simulation results. Indeed, Fig. 6 illustrated the impact of UAV density at different values of alignment error.
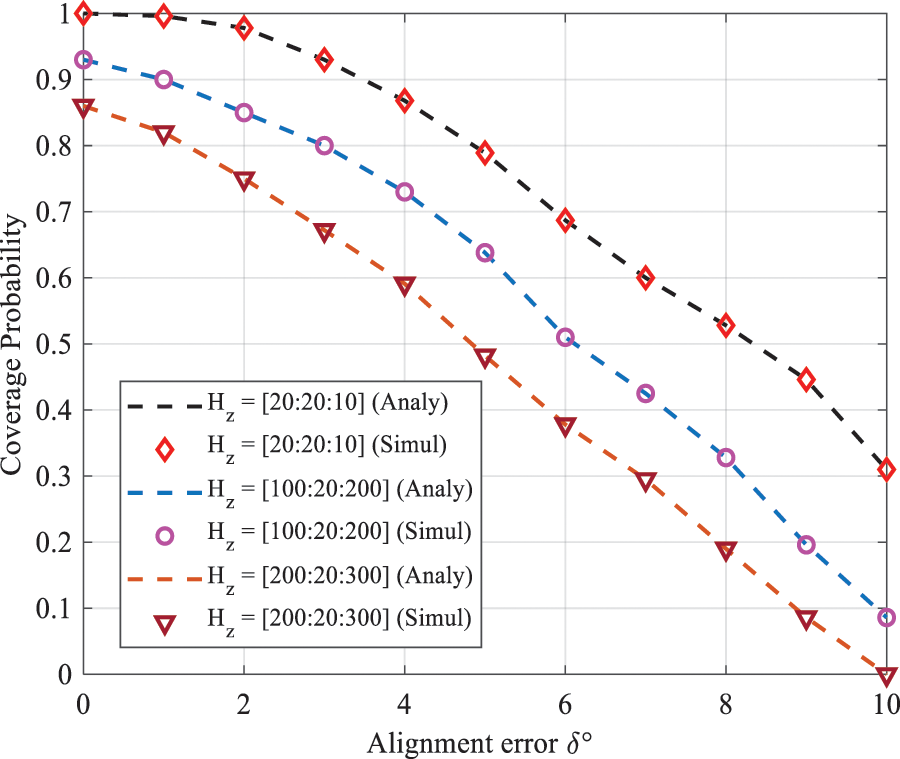
Figure 4: Coverage probability as a function of alignment error with different UAV height variation
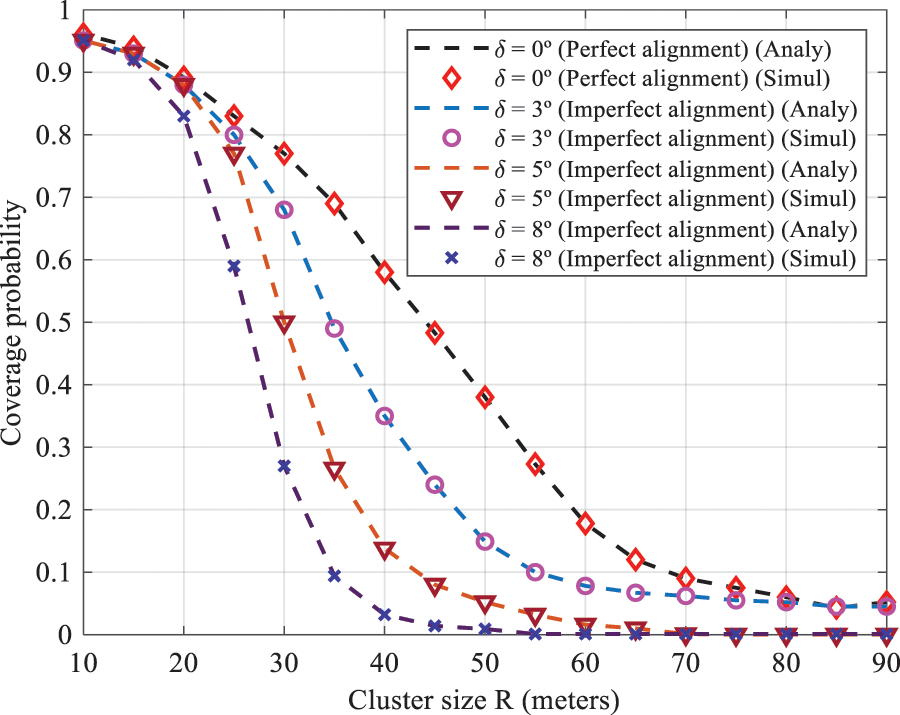
Figure 5: Coverage probability as function of cluster size with different imperfect alignment
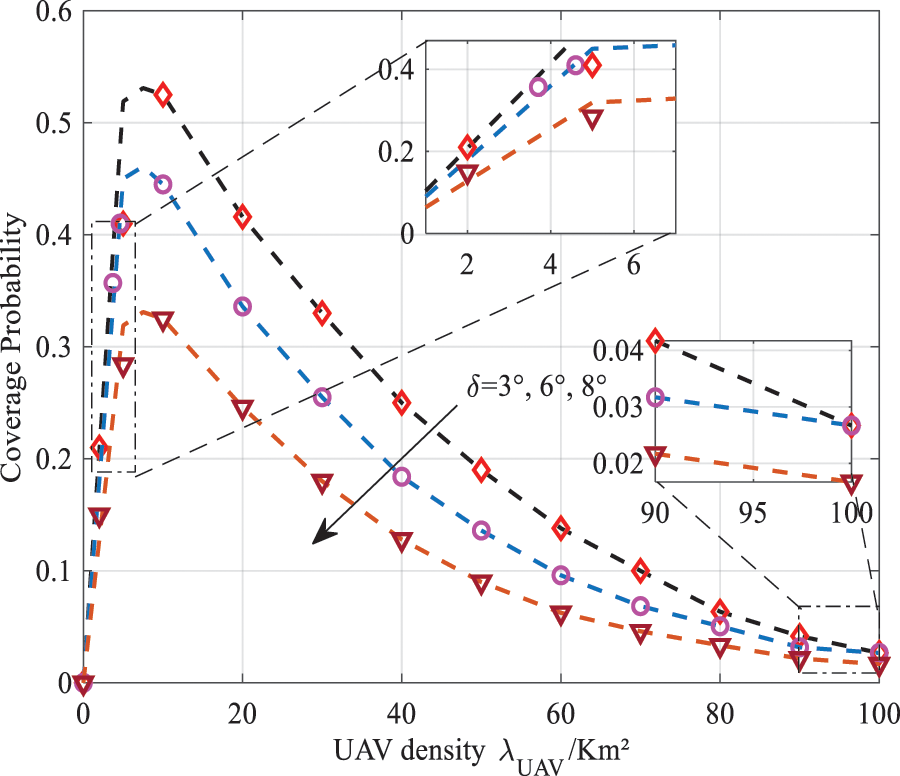
Figure 6: Coverage probability as function of UAV density
It can be observed from the figure that when the UAV density increased slightly, the coverage probability was initially improved. The reason was that the distance between UE and UAV was reduced. Therefore, the probability of having a LOS link was high. Contrarily, increasing UAV density significantly led to higher interference. On the other hand, increasing UAV deployment results in increased beam alignment error. It was due to inadequate exploitation of beamforming gains, i.e., the base station and the user did not perfectly adjust their azimuth, main lobe, and side lobe for each entity. In Fig. 7, coverage probability as a function of SINR with different beam alignments was plotted. From this figure, the coverage performance of the derived analytical statement was sufficiently accurate to evaluate the coverage probability of the system. Indeed, as the SINR threshold increases the coverage probability decreases. It can also be seen that when the UE and its serving BS (UAV or GBS) were note aligned perfectly, the coverage probability was significantly reduced.
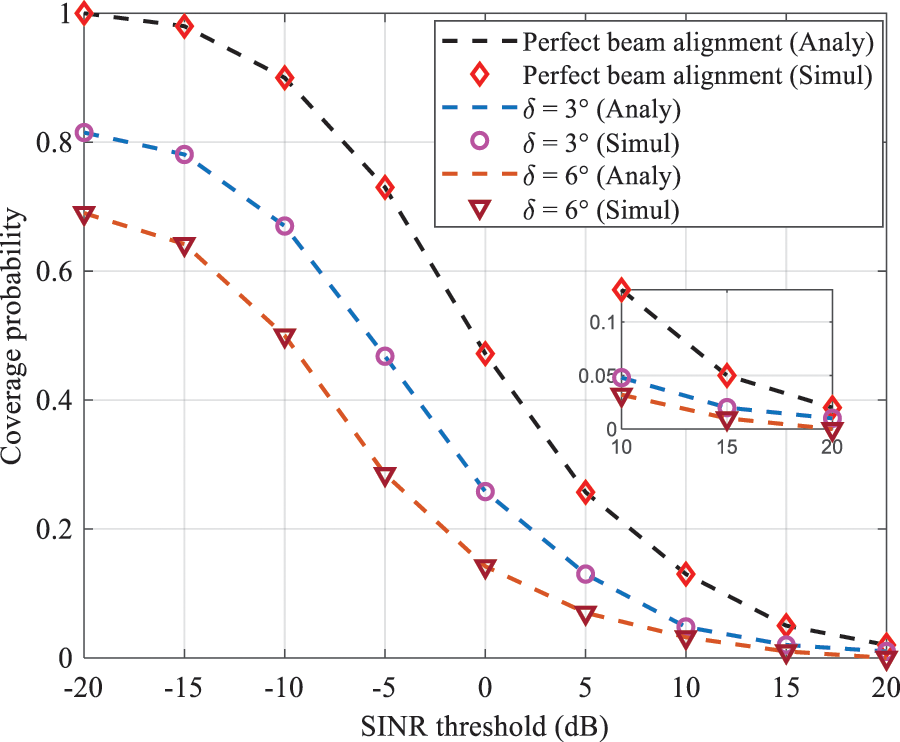
Figure 7: Coverage probability as a function of SINR threshold with perfect/imperfect beam alignment δ
In this paper, the downlink coverage analysis for UAV-assisted mobile networks with imperfect beam alignment has been investigated in both LOS and NLOS propagation. Our framework assumed that all UAVs were deployed at different heights. Specifically, stochastic geometry-based techniques were used to derive the exact expression of coverage probability, which can be affected by inter-cell interference. First, the association probability and distance distribution were obtained in the case of the Thomas cluster process. Then, based on the proposed model the coverage probability was derived and evaluated by integrating the impact of the beam alignment error. Using numerical results, it was shown that at low UAVs altitude, beam alignment errors significantly degraded coverage performance. Moreover, alignment errors did not affect the coverage probability at a small cluster size. There were many interesting questions to be addressed in the future, and some of them are listed below:
• Coverage and rate for UAV-assisted small cells by introducing inter-cell interference coordination between UAVs were analyzed.
• Analyze the performance when the UAVs are equipped with an antenna array and use the 3D beamforming model.
• Study the performance of UAVs swarm in 3D blocking environments with cooperation methods.
Acknowledgement: The authors express their gratitude to Princess Nourah bint Abdulrahman University Researchers Supporting Project number (PNURSP2022R323), Princess Nourah bint Abdulrahman University, Riyadh, Saudi Arabia, and Taif University Researchers Supporting Project Number TURSP-2020/34, Taif, Saudi Arabia.
Funding Statement: This work was supported by Princess Nourah bint Abdulrahman University Researchers Supporting Project number (PNURSP2022R323), Princess Nourah bint Abdulrahman University, Riyadh, Saudi Arabia, and Taif University Researchers Supporting Project Number TURSP-2020/34, Taif, Saudi Arabia.
Conflicts of Interest: The authors declare that they have no conflicts of interest to report regarding the present study.
References
1. W. Huang, J. Peng and H. Zhang, “User-centric intelligent UAV swarm etworks: Performance analysis and de-sign insight,” IEEE Access, vol. 7, pp. 181469–181478, 2021. [Google Scholar]
2. O. Sami Oubbati, M. Atiquzzaman, T. Ahamed Ahanger and A. Ibrahim, “Softwarization of UAV networks: A survey of applications and future trends,” IEEE Access, vol. 8, pp. 98073–98125, 2020. [Google Scholar]
3. M. Lahmeri, M. A. Kishk and M. Alouini, “Stochastic geometry-based analysis of airborne base stations with laser-powered UAVs,” IEEE Communications Letters, vol. 24, no. 1, pp. 173–177, 2020. [Google Scholar]
4. H. N. Qureshi and A. Imran, “On the tradeoffs between coverage radius, altitude, and beamwidth for practical UAV deployments,” IEEE Transactions on Aerospace and Electronic Systems, vol. 55, no. 6, pp. 2805–2821, 2019. [Google Scholar]
5. D. Alkama, M. A. Ouamri, M. S. Alzaidi, R. N. Shaw, M. Azni et al., “Downlink performance analysis in MIMO UAV-cellular communication with LOS/NLOS propagation under 3D beamforming,” IEEE Access, vol. 10, pp. 6650–6659, 2022. [Google Scholar]
6. X. Cai, C. Zhang, J. Rodríguez-Piñeiro, X. Yin, W. Fan et al., “Interference modeling for low-height air-to-ground channels in live LTE networks,” IEEE Antennas and Wireless Propagation Letters, vol. 18, no. 10, pp. 2011–2015, 2019. [Google Scholar]
7. M. Liu, G. Gui, N. Zhao, J. Sun, H. Gacanin et al., “UAV-aided air-to-ground cooperative nonorthogonal multiple access,” IEEE Internet of Things Journal, vol. 7, no. 4, pp. 2704–2715, 2020. [Google Scholar]
8. Y. Zhou, V. W. S. Wong and R. Schober, “Coverage and rate analysis of millimeter wave NOMA networks with beam misalignment,” IEEE Transactions on Wireless Communications, vol. 17, no. 12, pp. 8211–8227, 2018. [Google Scholar]
9. Ch. Zou, Xi. Li, Xing. Liu and M. Zhang, “3D placement of unmanned aerial vehicles and partially overlapped channel assignment for throughput maximization,” Digital Communications and Networks, vol. 7, no. 2, pp. 214–222, 2021. [Google Scholar]
10. Y. Zhang, Y. Zhou, Z. Ji, K. Lin and Z. He, “A three-dimensional geometry-based stochastic model for air-to-air UAV channels,” in 2020 IEEE 92nd Vehicular Technology Conf. (VTC2020-Fall), Victoria, BC, Canada, pp. 1–5, 2020. [Google Scholar]
11. M. Alzenad and H. Yanikomeroglu, “Coverage and rate analysis for vertical heterogeneous networks (VHet-Nets),” IEEE Transactions on Wireless Communications, vol. 18, no. 12, pp. 5643–5657, 2019. [Google Scholar]
12. M. Mozaffari, W. Saad, M. Bennis and M. Debbah, “Unmanned aerial vehicle with underlaid device-to-device com-munications: Performance and tradeoffs,” IEEE Transactions on Wireless Communication, vol. 15, no. 6, pp. 3949–3963, 2016. [Google Scholar]
13. E. Turgut and M. C. Gursoy, “Downlink analysis in unmanned aerial vehicle (UAV) assisted cellular networks with clustered users,” IEEE Access, vol. 6, pp. 36313–36324, 2018. [Google Scholar]
14. M. Afshang, C. Saha and H. S. Dhillon, “Nearest-neighbor and contact distance distributions for Matérn cluster process,” IEEE Wireless Communication Letters, vol. 21, no. 12, pp. 2686–2689, 2017. [Google Scholar]
15. W. Yi, Y. Liu, E. Bodanese, A. Nallanathan and G. K. Karagiannidis, “A unified spatial framework for UAV-aided MmWave networks,” IEEE Transactions on Communications, vol. 67, no. 12, pp. 8801–8817, 2019. [Google Scholar]
16. M. M. Azari, F. Rosas, A. Chiumento and S. Pollin, “Coexistence of terrestrial and aerial users in cellular net-works,” in 2017 IEEE Globecom Workshops (GC Wkshps), pp. 1–6, 2017. https://arxiv.org/abs/1710.03103. [Google Scholar]
17. T. Hou, Y. Liu, Z. Song, X. Sun and Y. Chen, “Multiple antenna aided NOMA in UAV networks: A stochastic geometry approach,” IEEE Transactions on Communications, vol. 67, no. 2, pp. 1031–1044, 2019. [Google Scholar]
18. W. Tang, H. Zhang and Y. He, “Tractable modelling and performance analysis of UAV networks with 3D blockage effects,” IEEE Wireless Communications Letters, vol. 9, no. 12, pp. 2064–2067, 2020. [Google Scholar]
19. M. Cheng, J. Wang, Y. Wu, X. Xia, K. Wong et al., “Coverage analysis for millimeter wave cellular networks with imperfect beam alignment,” IEEE Transactions on Vehicular Technology, vol. 67, no. 9, pp. 8302–8314, 2018. [Google Scholar]
20. M. T. Dabiri and S. M. S. Sadough, “Optimal placement of UAV-assisted free-space optical communication systems with DF relaying,” IEEE Communications Letters, vol. 24, no. 1, pp. 155–158, 2020. [Google Scholar]
21. M. A. Ouamri, “Stochastic geometry modeling and analysis of downlink coverage and rate in small cell network,” Telecommunication Systems, vol. 77, pp. 767–779, 2021. [Google Scholar]
22. M. A. Ouamri, M. E. Oteşteanu, A. Isar and M. Azni, “Coverage, handoff and cost optimization for 5G heterogeneous network,” Physical Communication, vol. 39, no. 5, pp. 101037, 2020. [Google Scholar]
23. A. Thornburg and R. W. Heath, “Ergodic capacity in mmWave ad hoc network with imperfect beam alignment,” in MILCOM 2015 - 2015 IEEE Military Communications Conference, Tampa, FL, USA, pp. 1479–1484, 2015. [Google Scholar]
24. M. Afshang and H. S. Dhillon, “Poisson cluster process based analysis of HetNets with correlated user and base station locations,” IEEE Transactions on Wireless Communications, vol. 17, no. 4, pp. 2417–2431, 2018. [Google Scholar]
25. J. G. Andrews, F. Baccelli and R. K. Ganti, “A tractable approach to coverage and rate in cellular networks,” IEEE Transactions on Communication, vol. 59, no. 11, pp. 3122–3134, 2011. [Google Scholar]
Appendix A.
The association probability for UAV-UE can be evaluated as
where (a) according to the definition of association probability, (b) is due to the path loss model, and (c) follows from conditioning on the closest distance. By applying the null probability of a 2-D Poisson process [24]:
where
where
Proof of the Laplace transform
Cite This Article
 Copyright © 2023 The Author(s). Published by Tech Science Press.
This work is licensed under a Creative Commons Attribution 4.0 International License , which permits unrestricted use, distribution, and reproduction in any medium, provided the original work is properly cited.
 Downloads
 Citation Tools